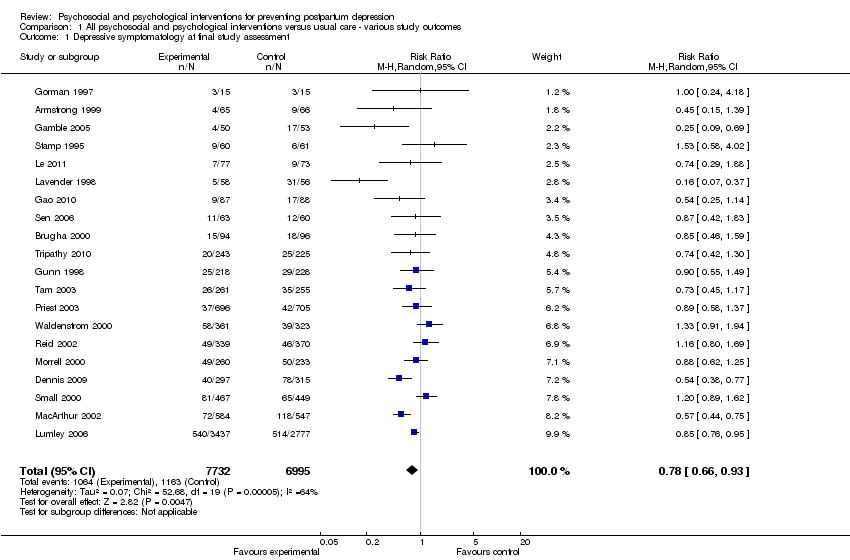
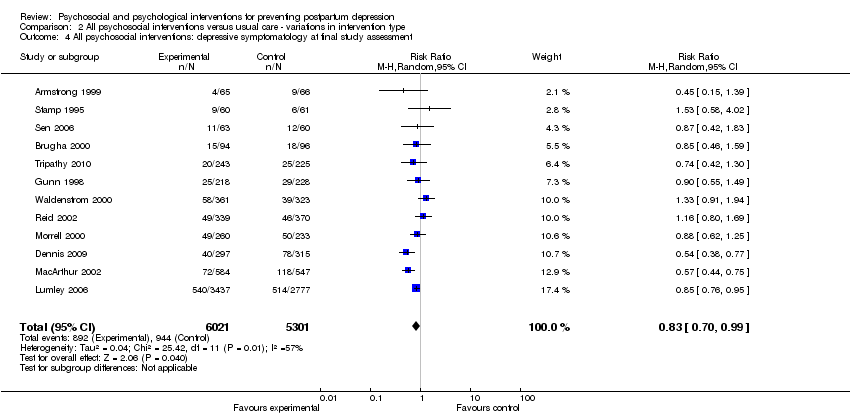
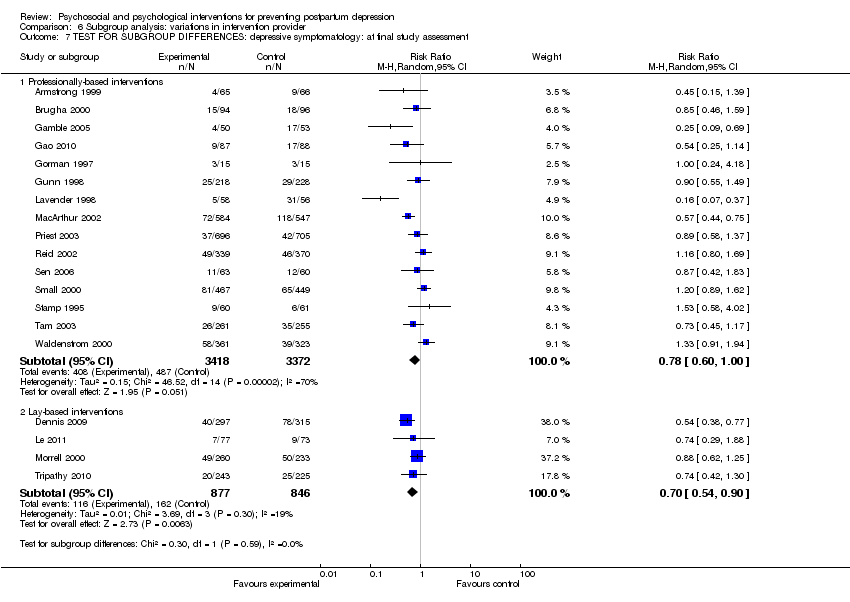
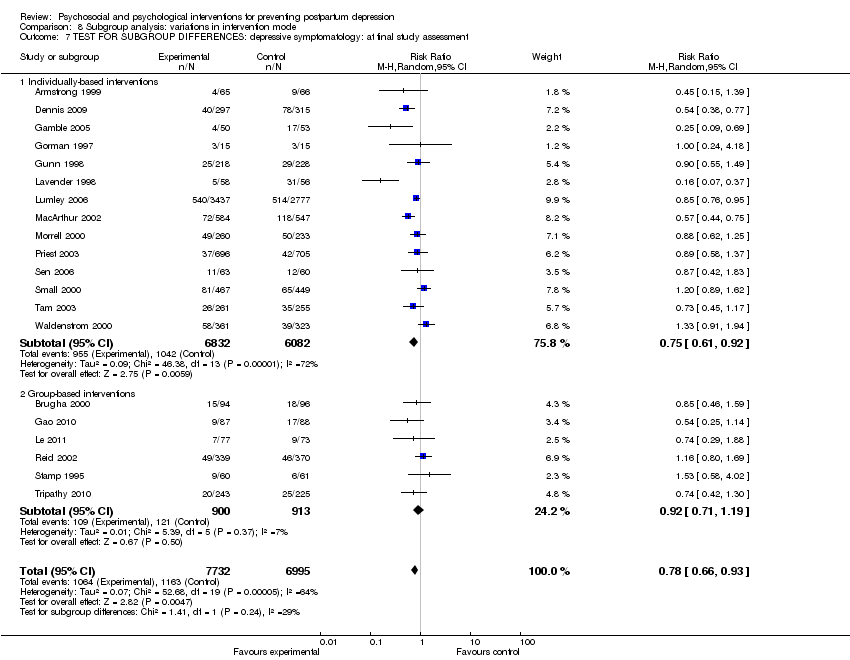
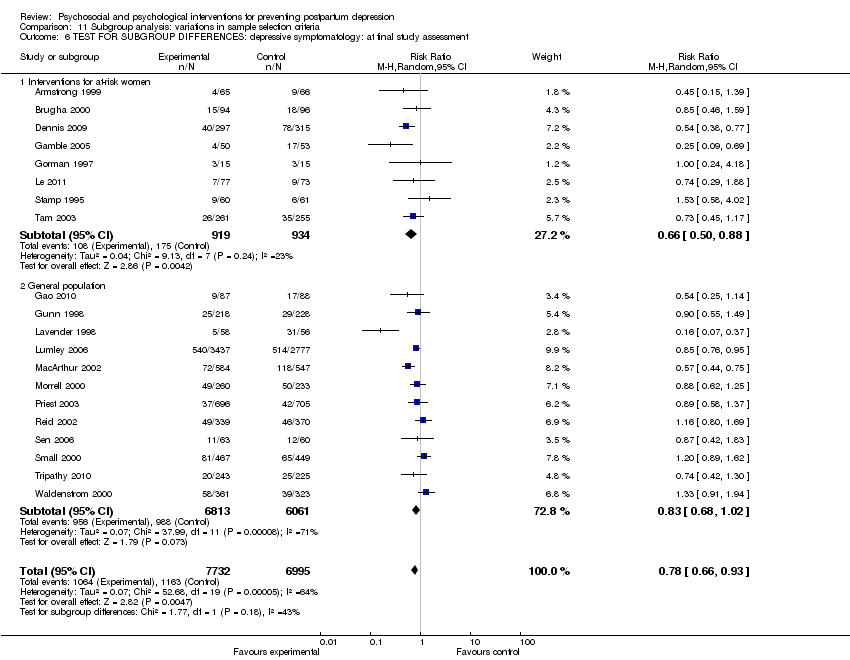
| 1 Depressive symptomatology at final study assessment Show forest plot | 20 | 14727 | Risk Ratio (M‐H, Random, 95% CI) | 0.78 [0.66, 0.93] |
|
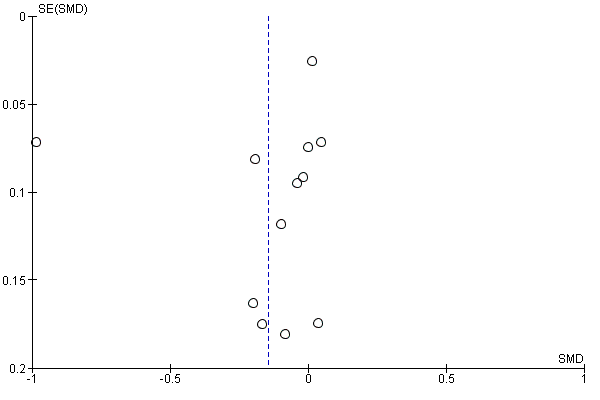
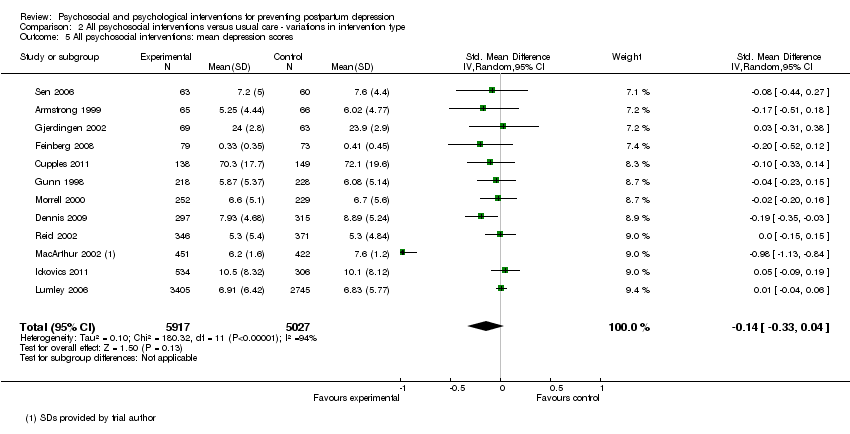
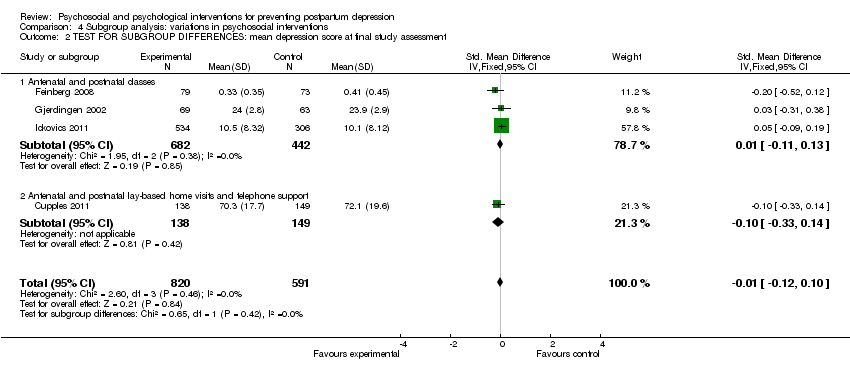
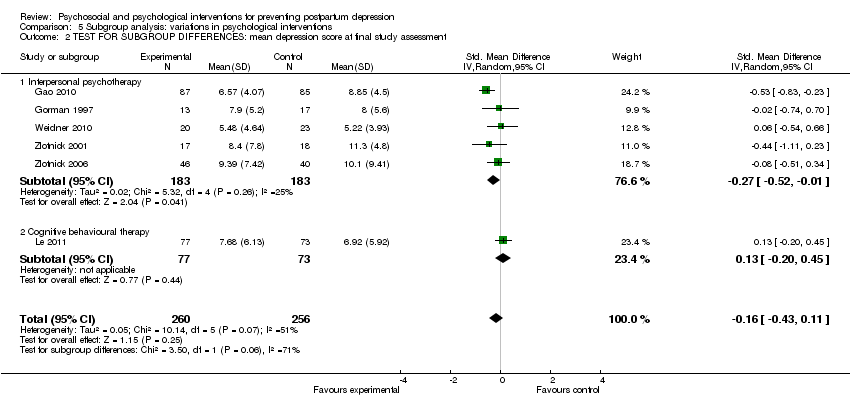
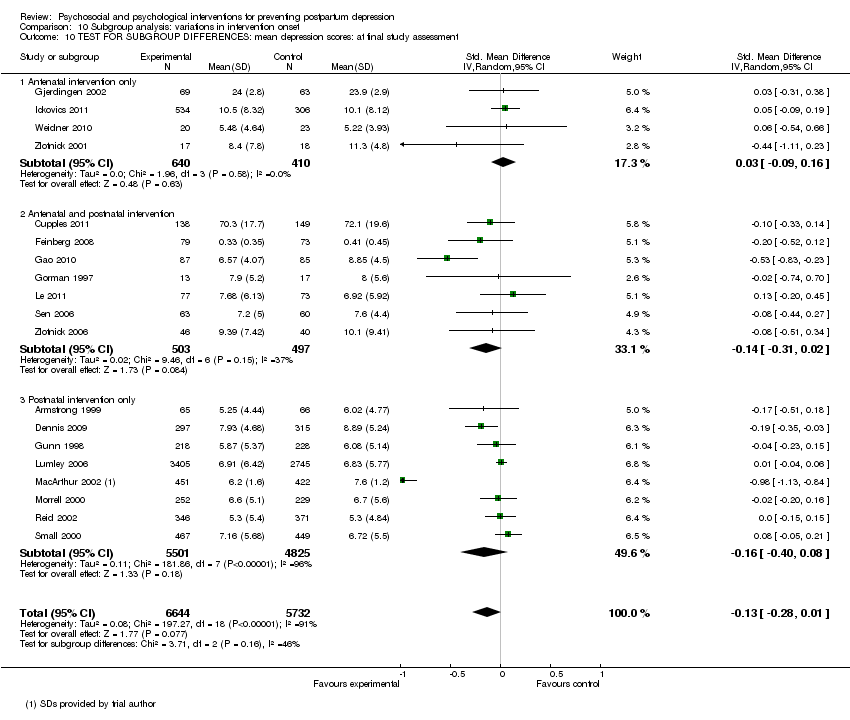
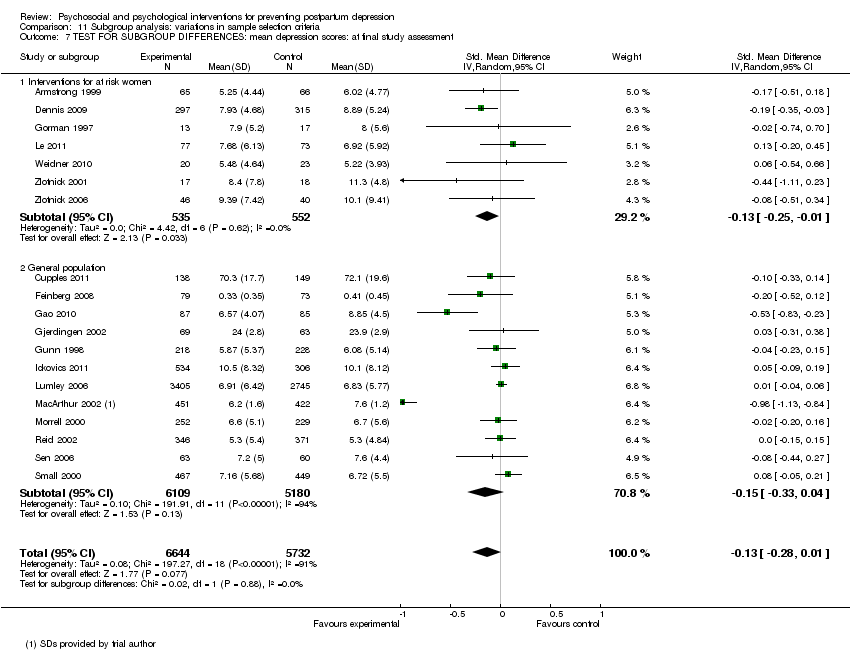
| 2 Mean depression scores at final study assessment Show forest plot | 19 | 12376 | Std. Mean Difference (IV, Random, 95% CI) | ‐0.13 [‐0.28, 0.01] |
|
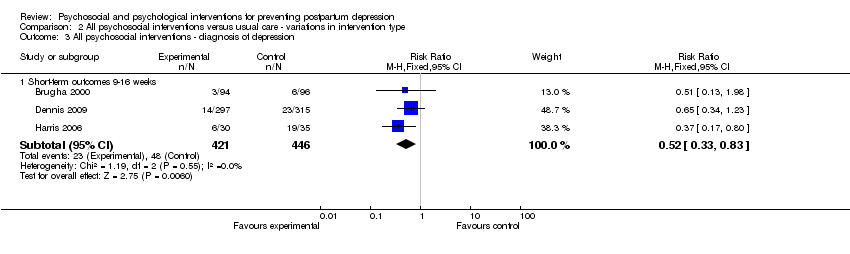
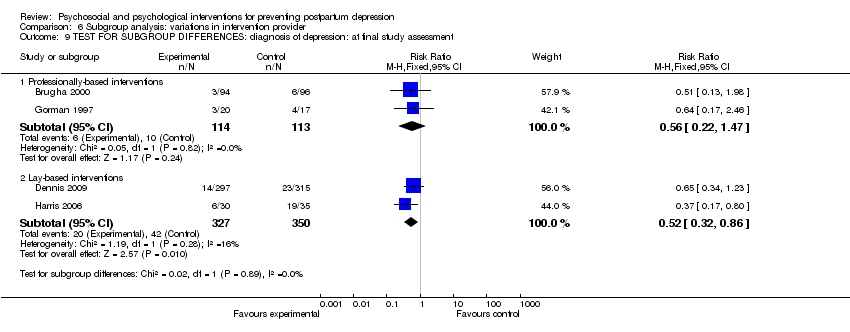
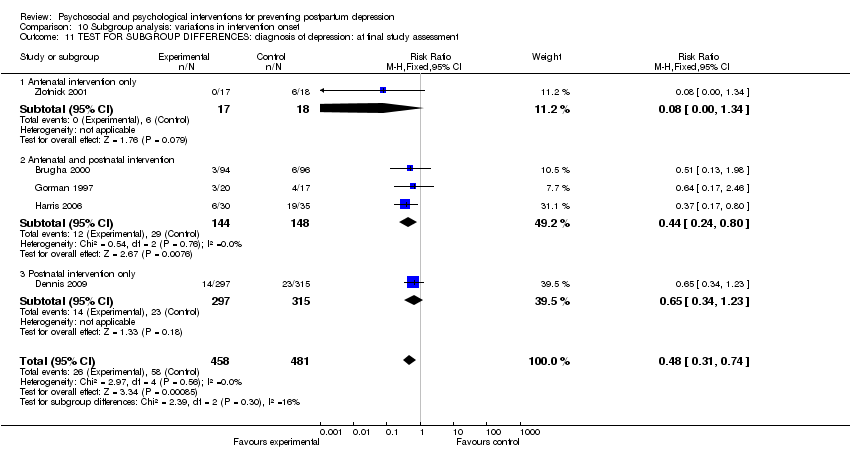
| 3 Diagnosis of depression at final study assessment Show forest plot | 5 | 939 | Risk Ratio (M‐H, Random, 95% CI) | 0.50 [0.32, 0.78] |
|
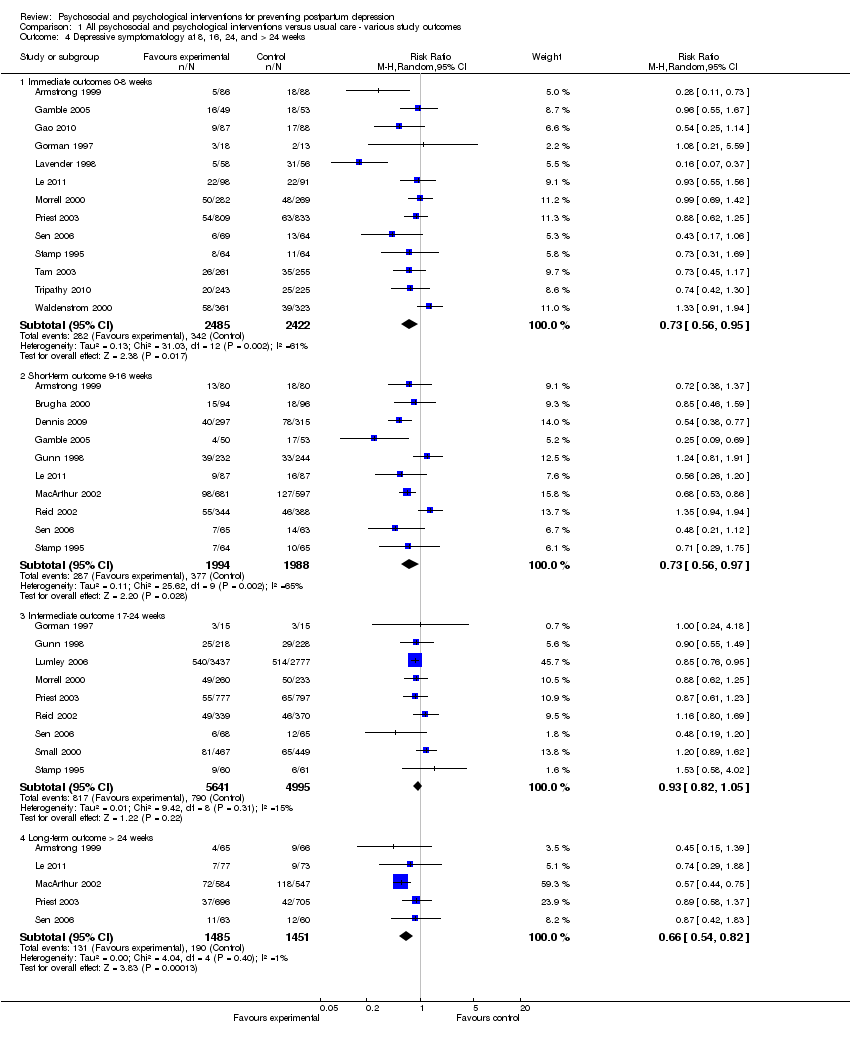
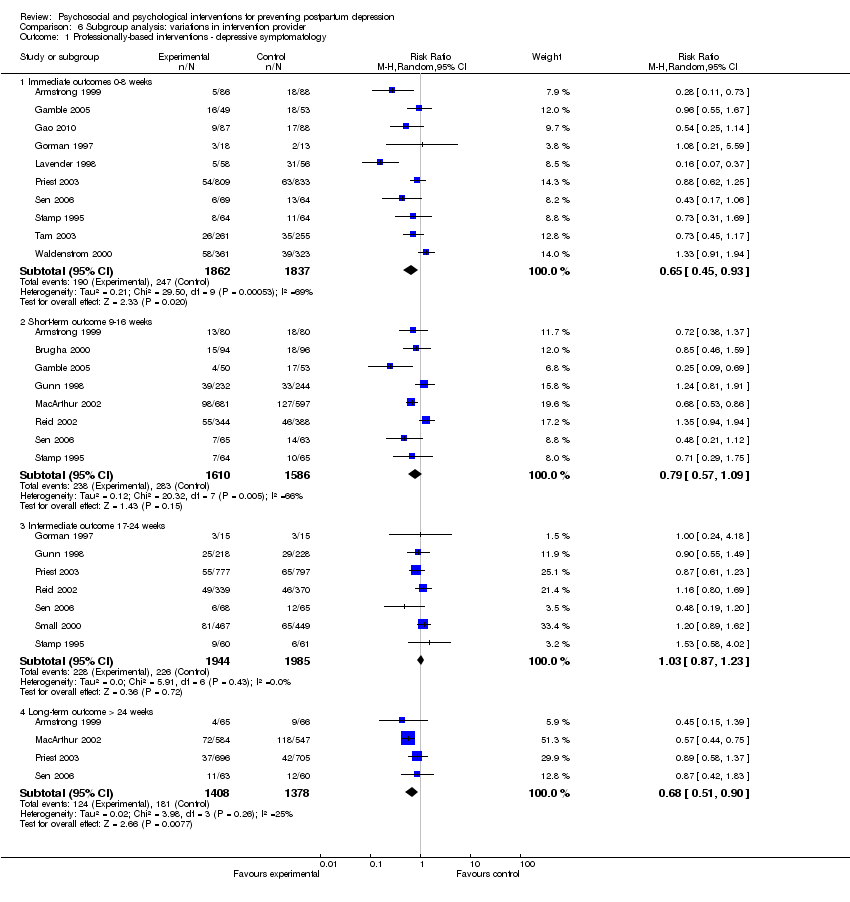
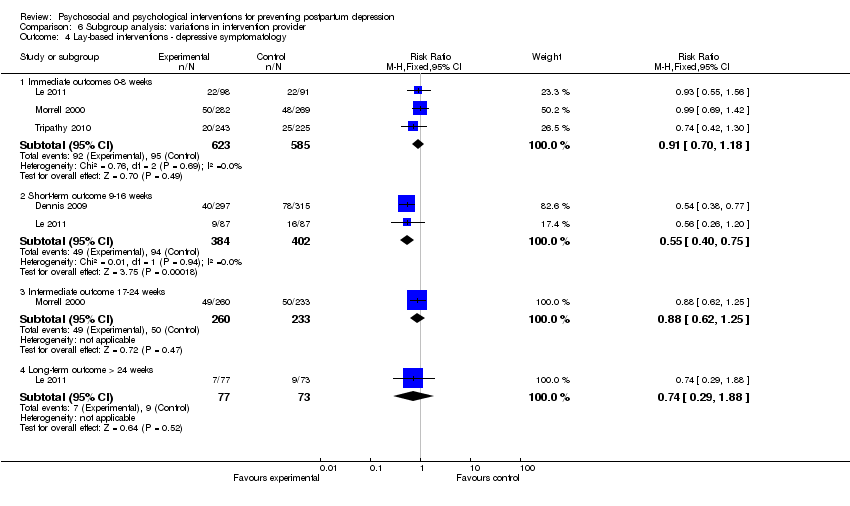
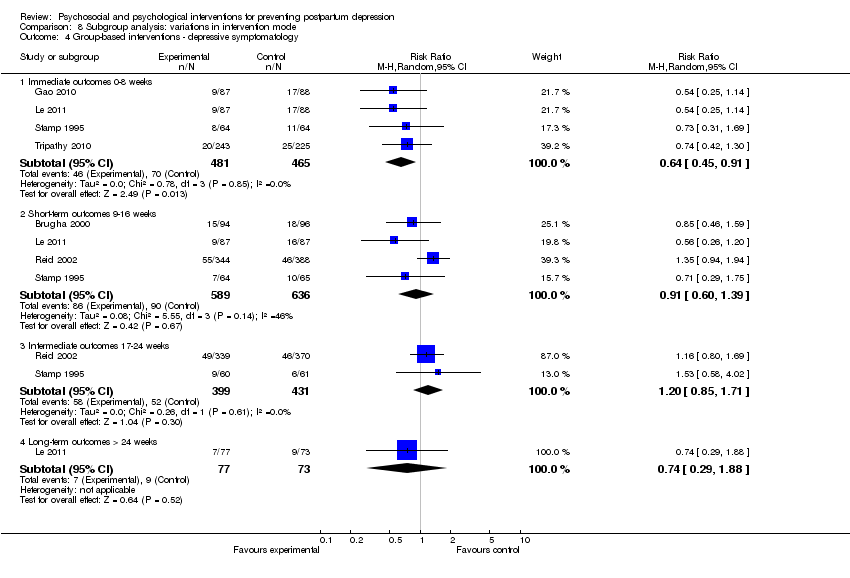
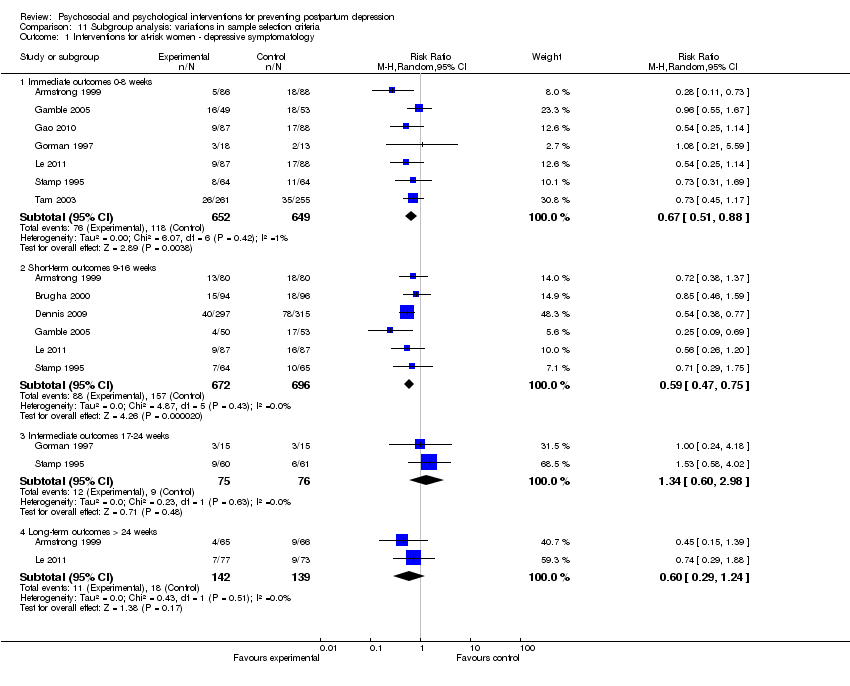
| 4 Depressive symptomatology at 8, 16, 24, and > 24 weeks Show forest plot | 20 | | Risk Ratio (M‐H, Random, 95% CI) | Subtotals only |
|
| 4.1 Immediate outcomes 0‐8 weeks | 13 | 4907 | Risk Ratio (M‐H, Random, 95% CI) | 0.73 [0.56, 0.95] |
| 4.2 Short‐term outcome 9‐16 weeks | 10 | 3982 | Risk Ratio (M‐H, Random, 95% CI) | 0.73 [0.56, 0.97] |
| 4.3 Intermediate outcome 17‐24 weeks | 9 | 10636 | Risk Ratio (M‐H, Random, 95% CI) | 0.93 [0.82, 1.05] |
| 4.4 Long‐term outcome > 24 weeks | 5 | 2936 | Risk Ratio (M‐H, Random, 95% CI) | 0.66 [0.54, 0.82] |
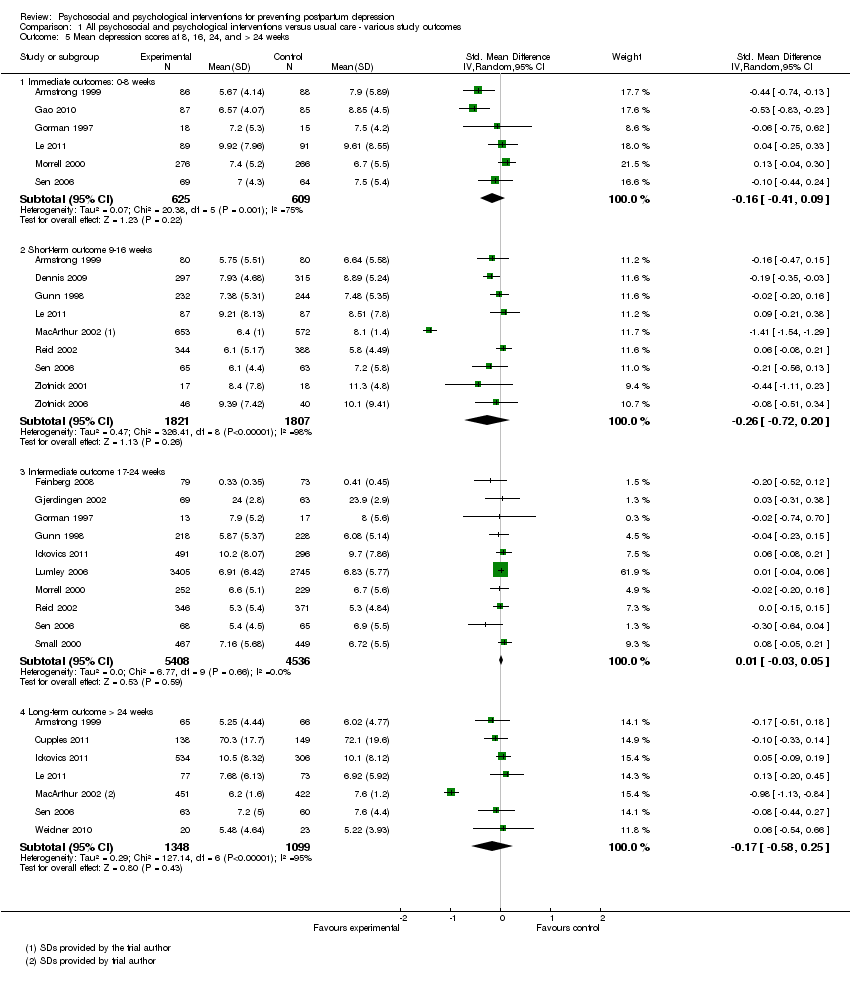
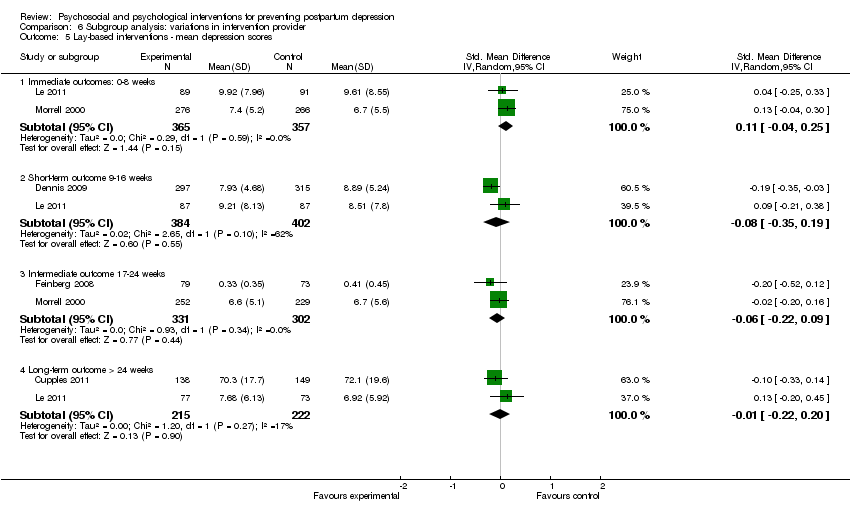
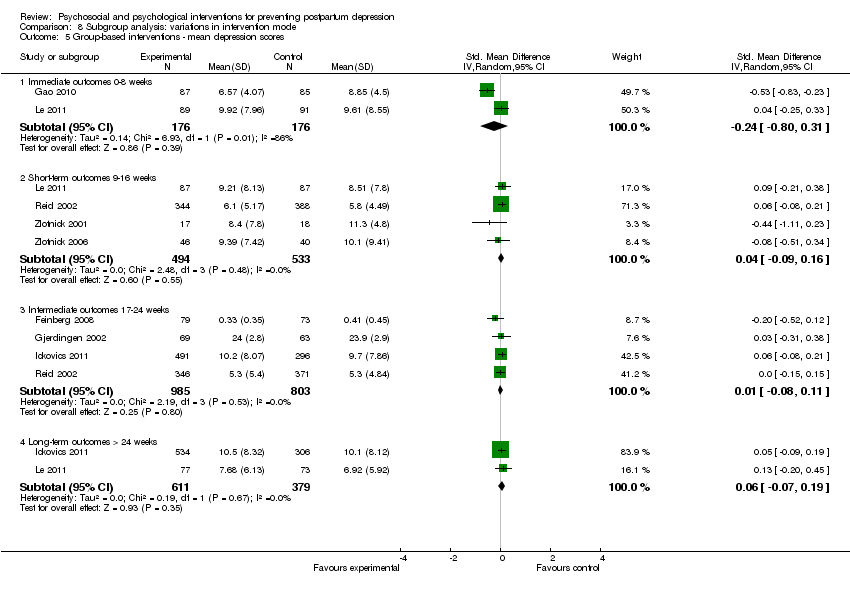
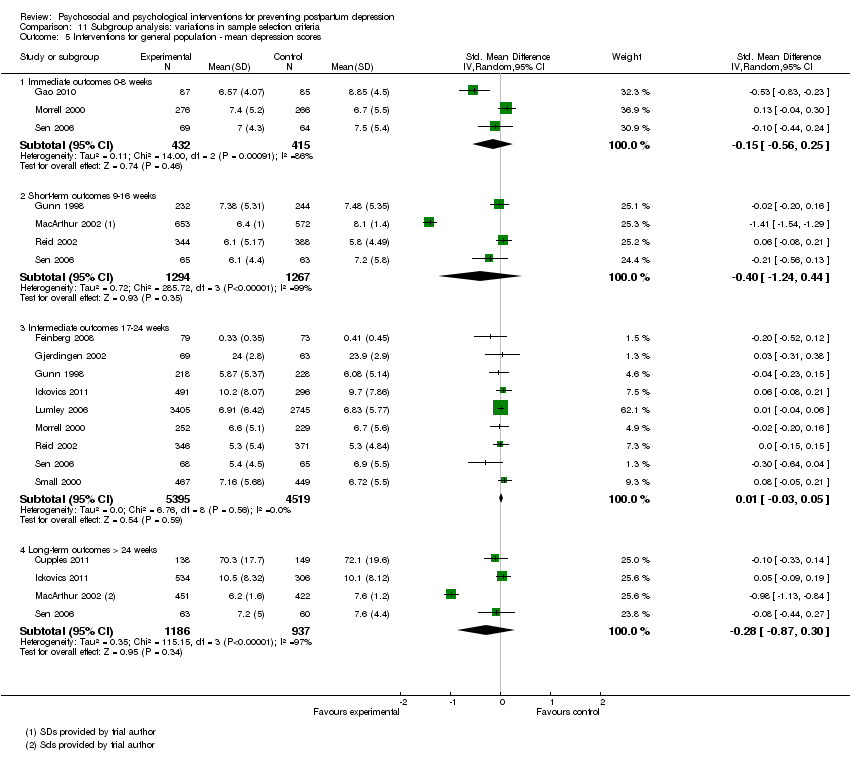
| 5 Mean depression scores at 8, 16, 24, and > 24 weeks Show forest plot | 19 | | Std. Mean Difference (IV, Random, 95% CI) | Subtotals only |
|
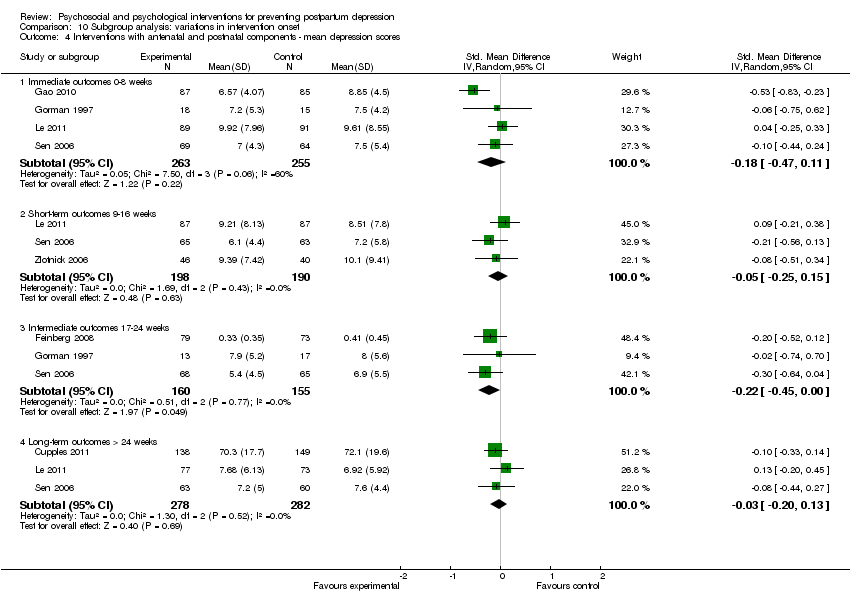
| 5.1 Immediate outcomes: 0‐8 weeks | 6 | 1234 | Std. Mean Difference (IV, Random, 95% CI) | ‐0.16 [‐0.41, 0.09] |
| 5.2 Short‐term outcome 9‐16 weeks | 9 | 3628 | Std. Mean Difference (IV, Random, 95% CI) | ‐0.26 [‐0.72, 0.20] |
| 5.3 Intermediate outcome 17‐24 weeks | 10 | 9944 | Std. Mean Difference (IV, Random, 95% CI) | 0.01 [‐0.03, 0.05] |
| 5.4 Long‐term outcome > 24 weeks | 7 | 2447 | Std. Mean Difference (IV, Random, 95% CI) | ‐0.17 [‐0.58, 0.25] |
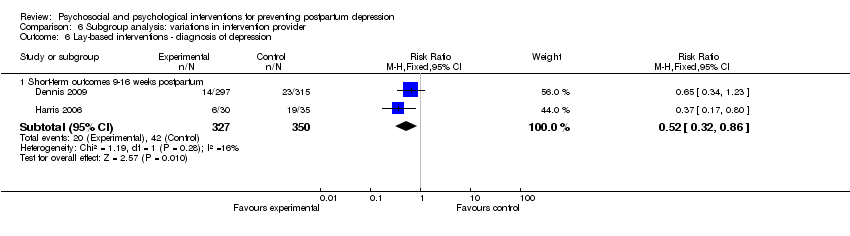
| 6 Diagnosis of depression at 8, 16, 24, and > 24 weeks Show forest plot | 5 | | Risk Ratio (M‐H, Random, 95% CI) | Subtotals only |
|
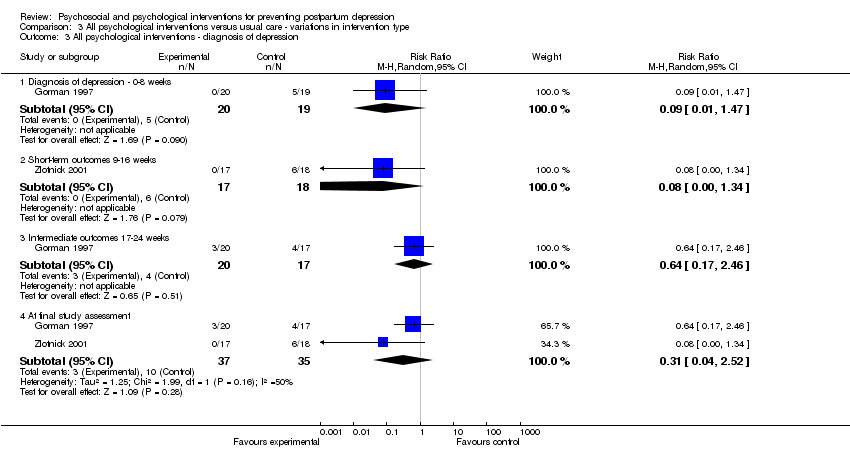
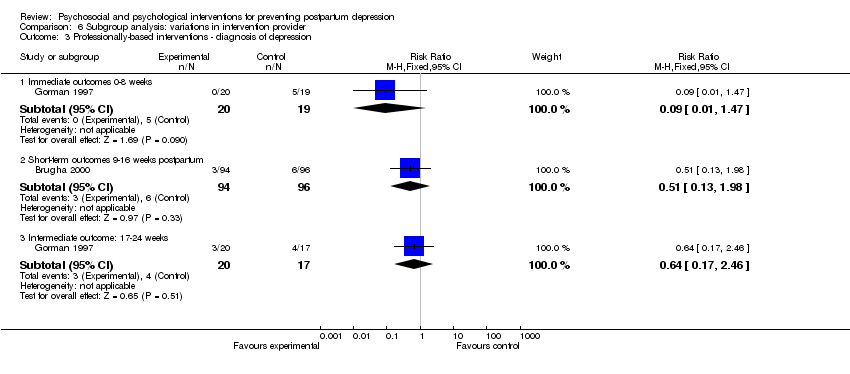
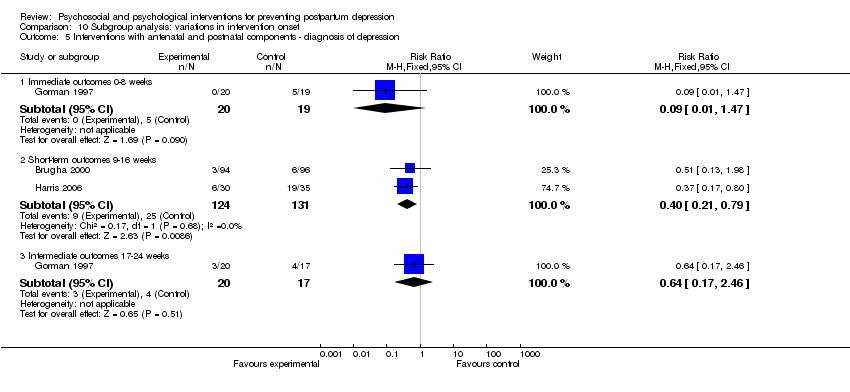
| 6.1 Immediate outcomes 0‐8 weeks | 1 | 39 | Risk Ratio (M‐H, Random, 95% CI) | 0.09 [0.01, 1.47] |
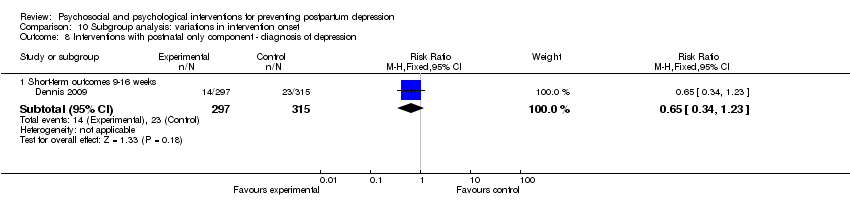
| 6.2 Short‐term outcomes 9‐16 weeks postpartum | 4 | 902 | Risk Ratio (M‐H, Random, 95% CI) | 0.49 [0.31, 0.77] |
| 6.3 Intermediate outcome: 17‐24 weeks | 1 | 37 | Risk Ratio (M‐H, Random, 95% CI) | 0.64 [0.17, 2.46] |
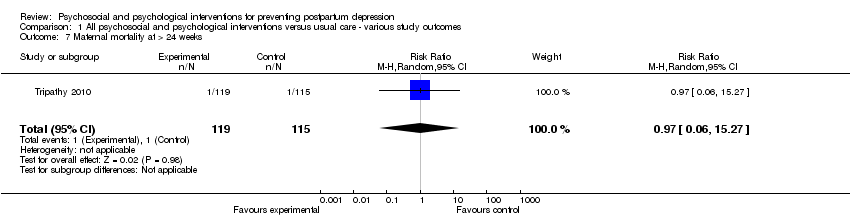
| 7 Maternal mortality at > 24 weeks Show forest plot | 1 | 234 | Risk Ratio (M‐H, Random, 95% CI) | 0.97 [0.06, 15.27] |
|
| 8 Maternal‐infant attachment at 8, 16, and 24 weeks Show forest plot | 1 | | Risk Ratio (M‐H, Random, 95% CI) | Subtotals only |
|
| 8.1 Immediate outcomes 0‐8 weeks | 1 | 133 | Risk Ratio (M‐H, Random, 95% CI) | 1.01 [0.64, 1.59] |
| 8.2 Short‐term outcome 9‐16 weeks | 1 | 126 | Risk Ratio (M‐H, Random, 95% CI) | 1.29 [0.78, 2.13] |
| 8.3 Intermediate outcome 17‐24 weeks | 1 | 127 | Risk Ratio (M‐H, Random, 95% CI) | 0.89 [0.59, 1.34] |
| 9 Mean maternal‐infant attachment scores at 8, 16, 24, and > 24 weeks Show forest plot | 2 | | Std. Mean Difference (IV, Random, 95% CI) | Subtotals only |
|
| 9.1 Immediate outcomes 0‐8 weeks | 1 | 176 | Std. Mean Difference (IV, Random, 95% CI) | ‐0.11 [‐0.40, 0.19] |
| 9.2 Short‐term outcome 9‐16 weeks | 1 | 160 | Std. Mean Difference (IV, Random, 95% CI) | ‐0.20 [‐0.51, 0.11] |
| 9.3 Intermediate outcome 17‐24 weeks | 1 | 152 | Std. Mean Difference (IV, Random, 95% CI) | ‐0.22 [‐0.54, 0.10] |
| 9.4 Long‐term outcome > 24 weeks | 1 | 116 | Std. Mean Difference (IV, Random, 95% CI) | ‐0.12 [‐0.49, 0.24] |
| 9.5 At final study assessment | 2 | 268 | Std. Mean Difference (IV, Random, 95% CI) | ‐0.18 [‐0.42, 0.06] |
| 10 Anxiety at 8, 16, and 24 weeks Show forest plot | 4 | | Risk Ratio (M‐H, Random, 95% CI) | Subtotals only |
|
| 10.1 Immediate outcomes 0‐8 weeks | 2 | 245 | Risk Ratio (M‐H, Random, 95% CI) | 0.35 [0.05, 2.34] |
| 10.2 Short‐term outcome 9‐16 weeks | 3 | 843 | Risk Ratio (M‐H, Random, 95% CI) | 0.41 [0.12, 1.41] |
| 10.3 Intermediate outcome 17‐24 weeks | 1 | 130 | Risk Ratio (M‐H, Random, 95% CI) | 0.94 [0.25, 3.60] |
| 10.4 At final study assessment | 4 | 959 | Risk Ratio (M‐H, Random, 95% CI) | 0.40 [0.14, 1.14] |
| 11 Mean anxiety scores at 8, 16, 24, and > 24 weeks Show forest plot | 4 | | Std. Mean Difference (IV, Random, 95% CI) | Subtotals only |
|
| 11.1 Immediate outcomes 0‐8 weeks | 2 | 163 | Std. Mean Difference (IV, Random, 95% CI) | ‐0.09 [‐0.39, 0.22] |
| 11.2 Short‐term outcome 9‐16 weeks | 2 | 740 | Std. Mean Difference (IV, Random, 95% CI) | ‐0.15 [‐0.30, ‐0.01] |
| 11.3 Intermediate outcome 17‐24 weeks | 2 | 160 | Std. Mean Difference (IV, Random, 95% CI) | ‐0.24 [‐0.55, 0.07] |
| 11.4 Long‐term outcome > 24 weeks | 1 | 43 | Std. Mean Difference (IV, Random, 95% CI) | ‐0.17 [‐0.77, 0.43] |
| 11.5 At final study assessment | 4 | 815 | Std. Mean Difference (IV, Random, 95% CI) | ‐0.16 [‐0.30, ‐0.03] |
| 12 Maternal stress at 16 weeks Show forest plot | 1 | | Risk Ratio (M‐H, Random, 95% CI) | Subtotals only |
|
| 12.1 Short‐term outcome 9‐16 weeks | 1 | 103 | Risk Ratio (M‐H, Random, 95% CI) | 0.44 [0.20, 0.96] |
| 13 Mean maternal stress scores at 24 and > 24 weeks Show forest plot | 1 | | Mean Difference (IV, Random, 95% CI) | Subtotals only |
|
| 13.1 Intermediate outcome 17‐24 weeks | 1 | 787 | Mean Difference (IV, Random, 95% CI) | 0.0 [‐1.02, 1.02] |
| 13.2 Long‐term outcome > 24 weeks | 1 | 840 | Mean Difference (IV, Random, 95% CI) | 0.5 [‐0.51, 1.51] |
| 14 Mean parental stress scores at 8, 24, and > 24 weeks Show forest plot | 3 | | Std. Mean Difference (IV, Random, 95% CI) | Subtotals only |
|
| 14.1 Immediate outcomes 0‐8 weeks | 1 | 176 | Std. Mean Difference (IV, Random, 95% CI) | ‐0.08 [‐0.37, 0.22] |
| 14.2 Intermediate outcome 17‐24 weeks | 1 | 124 | Std. Mean Difference (IV, Random, 95% CI) | ‐0.27 [‐0.62, 0.09] |
| 14.3 Long‐term outcome > 24 weeks | 2 | 341 | Std. Mean Difference (IV, Random, 95% CI) | 0.27 [0.05, 0.48] |
| 14.4 At final study assessment | 3 | 465 | Std. Mean Difference (IV, Random, 95% CI) | 0.11 [‐0.25, 0.48] |
| 15 Perceived social support at 8 and 16 weeks Show forest plot | 2 | | Risk Ratio (M‐H, Random, 95% CI) | Subtotals only |
|
| 15.1 Immediate outcomes 0‐8 weeks | 1 | 528 | Risk Ratio (M‐H, Random, 95% CI) | 0.68 [0.45, 1.05] |
| 15.2 Short‐term outcome 9‐16 weeks | 1 | 190 | Risk Ratio (M‐H, Random, 95% CI) | 1.02 [0.34, 3.05] |
| 15.3 At final study assessment | 2 | 718 | Risk Ratio (M‐H, Random, 95% CI) | 0.72 [0.48, 1.08] |
| 16 Mean perceived social support scores at 8, 16, 24, and > 24 weeks Show forest plot | 7 | | Std. Mean Difference (IV, Random, 95% CI) | Subtotals only |
|
| 16.1 Immediate outcomes 0‐8 weeks | 3 | 822 | Std. Mean Difference (IV, Random, 95% CI) | 0.02 [‐0.13, 0.17] |
| 16.2 Short‐term outcome 9‐16 weeks | 2 | 863 | Std. Mean Difference (IV, Random, 95% CI) | 0.16 [‐0.21, 0.53] |
| 16.3 Intermediate outcome 17‐24 weeks | 6 | 8122 | Std. Mean Difference (IV, Random, 95% CI) | 0.03 [‐0.06, 0.12] |
| 16.4 Long‐term outcome > 24 weeks | 2 | 955 | Std. Mean Difference (IV, Random, 95% CI) | ‐0.07 [‐0.20, 0.06] |
| 16.5 At final study assessment | 7 | 8290 | Std. Mean Difference (IV, Random, 95% CI) | 0.01 [‐0.08, 0.10] |
| 17 Maternal dissatisfaction with care provided at 8, 16, and 24 weeks Show forest plot | 4 | | Risk Ratio (M‐H, Random, 95% CI) | Subtotals only |
|
| 17.1 Immediate outcomes 0‐8 weeks | 2 | 825 | Risk Ratio (M‐H, Random, 95% CI) | 0.56 [0.29, 1.09] |
| 17.2 Short‐term outcome 9‐16 weeks | 1 | 1278 | Risk Ratio (M‐H, Random, 95% CI) | 0.88 [0.65, 1.19] |
| 17.3 Intermediate outcome 17‐24 weeks | 1 | 911 | Risk Ratio (M‐H, Random, 95% CI) | 0.75 [0.44, 1.25] |
| 17.4 At final study assessment | 4 | 3014 | Risk Ratio (M‐H, Random, 95% CI) | 0.67 [0.44, 1.00] |
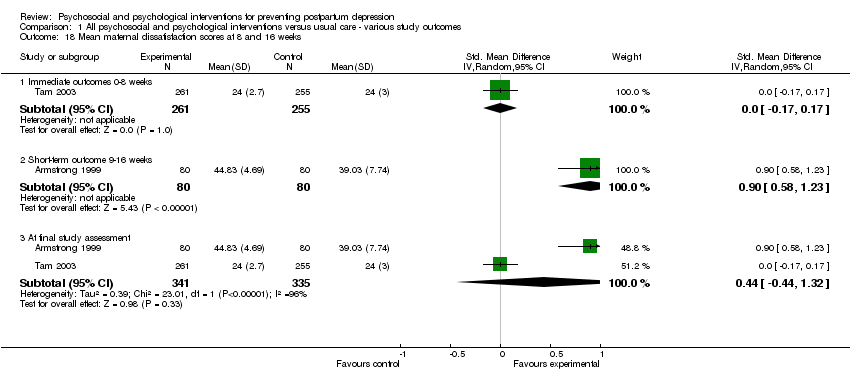
| 18 Mean maternal dissatisfaction scores at 8 and 16 weeks Show forest plot | 2 | | Std. Mean Difference (IV, Random, 95% CI) | Subtotals only |
|
| 18.1 Immediate outcomes 0‐8 weeks | 1 | 516 | Std. Mean Difference (IV, Random, 95% CI) | 0.0 [‐0.17, 0.17] |
| 18.2 Short‐term outcome 9‐16 weeks | 1 | 160 | Std. Mean Difference (IV, Random, 95% CI) | 0.90 [0.58, 1.23] |
| 18.3 At final study assessment | 2 | 676 | Std. Mean Difference (IV, Random, 95% CI) | 0.44 [‐0.44, 1.32] |
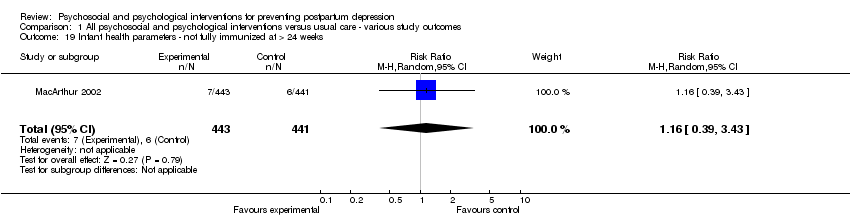
| 19 Infant health parameters ‐ not fully immunized at > 24 weeks Show forest plot | 1 | 884 | Risk Ratio (M‐H, Random, 95% CI) | 1.16 [0.39, 3.43] |
|
| 20 Infant development > 24 weeks Show forest plot | 1 | 280 | Mean Difference (IV, Random, 95% CI) | ‐0.90 [‐2.90, 1.10] |
|
| 20.1 Bayley (BSID‐II) | 1 | 280 | Mean Difference (IV, Random, 95% CI) | ‐0.90 [‐2.90, 1.10] |
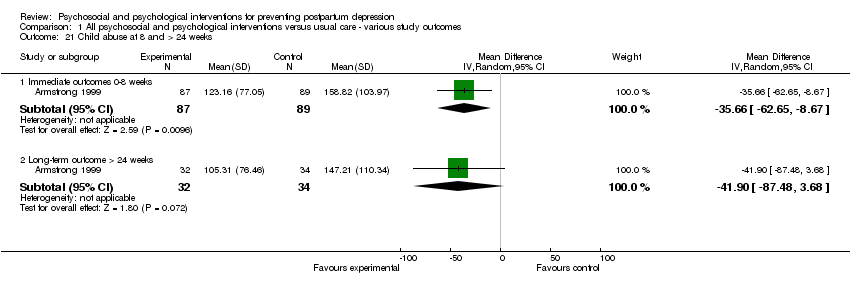
| 21 Child abuse at 8 and > 24 weeks Show forest plot | 1 | | Mean Difference (IV, Random, 95% CI) | Subtotals only |
|
| 21.1 Immediate outcomes 0‐8 weeks | 1 | 176 | Mean Difference (IV, Random, 95% CI) | ‐35.66 [‐62.65, ‐8.67] |
| 21.2 Long‐term outcome > 24 weeks | 1 | 66 | Mean Difference (IV, Random, 95% CI) | ‐41.90 [‐87.48, 3.68] |
| 22 Mean marital discord scores at 8, 16, and 24 weeks Show forest plot | 3 | | Std. Mean Difference (IV, Random, 95% CI) | Subtotals only |
|
| 22.1 Immediate outcomes 0‐8 weeks | 2 | 163 | Std. Mean Difference (IV, Random, 95% CI) | ‐0.03 [‐0.34, 0.28] |
| 22.2 Short‐term outcome 9‐16 weeks | 1 | 127 | Std. Mean Difference (IV, Random, 95% CI) | ‐0.28 [‐0.63, 0.07] |
| 22.3 Intermediate outcome 17‐24 weeks | 3 | 291 | Std. Mean Difference (IV, Random, 95% CI) | ‐0.14 [‐0.37, 0.09] |
| 22.4 At final study assessment | 3 | 291 | Std. Mean Difference (IV, Random, 95% CI) | ‐0.14 [‐0.37, 0.09] |