Scolaris Content Display Scolaris Content Display

Comparison 1 Physical Training vs Control, Outcome 1 PEFR‐l/min.
Figuras y tablas -
Analysis 1.1

Comparison 1 Physical Training vs Control, Outcome 1 PEFR‐l/min.

Comparison 1 Physical Training vs Control, Outcome 2 FEV1‐litres.
Figuras y tablas -
Analysis 1.2

Comparison 1 Physical Training vs Control, Outcome 2 FEV1‐litres.

Comparison 1 Physical Training vs Control, Outcome 3 FVC‐litres.
Figuras y tablas -
Analysis 1.3

Comparison 1 Physical Training vs Control, Outcome 3 FVC‐litres.

Comparison 1 Physical Training vs Control, Outcome 4 VEmax‐l/min.
Figuras y tablas -
Analysis 1.4

Comparison 1 Physical Training vs Control, Outcome 4 VEmax‐l/min.

Comparison 1 Physical Training vs Control, Outcome 5 HRmax (bpm).
Figuras y tablas -
Analysis 1.5

Comparison 1 Physical Training vs Control, Outcome 5 HRmax (bpm).

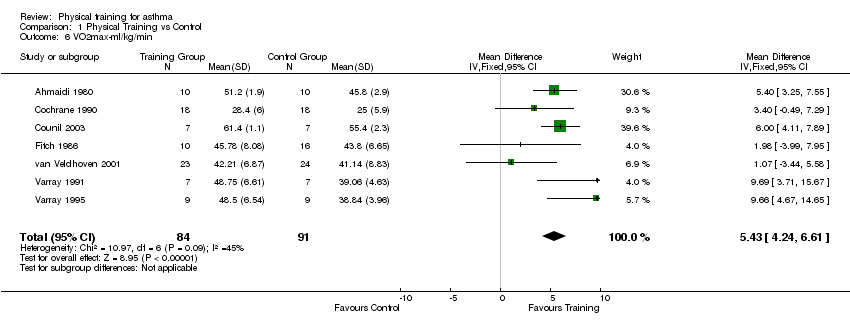
Comparison 1 Physical Training vs Control, Outcome 6 VO2max‐ml/kg/min.
Figuras y tablas -
Analysis 1.6

Comparison 1 Physical Training vs Control, Outcome 6 VO2max‐ml/kg/min.

Comparison 1 Physical Training vs Control, Outcome 7 Episodes of Wheeze (days).
Figuras y tablas -
Analysis 1.7

Comparison 1 Physical Training vs Control, Outcome 7 Episodes of Wheeze (days).

Comparison 1 Physical Training vs Control, Outcome 8 Work Capacity‐W.
Figuras y tablas -
Analysis 1.8

Comparison 1 Physical Training vs Control, Outcome 8 Work Capacity‐W.

Comparison 1. Physical Training vs Control

Outcome or subgroup title

No. of studies

No. of participants

Statistical method

Effect size

1 PEFR‐l/min Show forest plot

4

103

Mean Difference (IV, Fixed, 95% CI)

‐5.47 [‐27.55, 16.60]

2 FEV1‐litres Show forest plot

5

129

Mean Difference (IV, Fixed, 95% CI)

0.01 [‐0.14, 0.16]

3 FVC‐litres Show forest plot

4

93

Mean Difference (IV, Fixed, 95% CI)

0.09 [‐0.12, 0.30]

4 VEmax‐l/min Show forest plot

4

111

Mean Difference (IV, Fixed, 95% CI)

6.00 [1.57, 10.43]

5 HRmax (bpm) Show forest plot

5

121

Mean Difference (IV, Fixed, 95% CI)

7.70 [5.57, 9.83]

6 VO2max‐ml/kg/min Show forest plot

7

175

Mean Difference (IV, Fixed, 95% CI)

5.43 [4.24, 6.61]

7 Episodes of Wheeze (days) Show forest plot

1

24

Mean Difference (IV, Fixed, 95% CI)

‐7.5 [‐22.42, 7.42]

8 Work Capacity‐W Show forest plot

3

83

Mean Difference (IV, Fixed, 95% CI)

14.95 [11.52, 18.38]

Figuras y tablas -
Comparison 1. Physical Training vs Control