Contenido relacionado
Revisiones y protocolos relacionados
Andrew A Travers, Arthur P Jones, Karen D Kelly, Carlos A Jr Camargo, Samantha J Barker, Brian H Rowe | 22 enero 2001
Peter G Gibson, Heather Powell, Francine M Ducharme | 19 octubre 2005
Christopher J Cates, Emma J Welsh, Brian H Rowe | 13 septiembre 2013
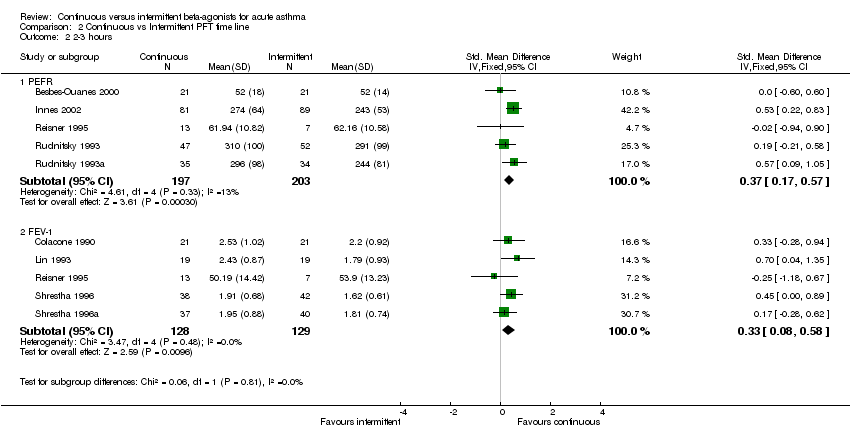
Andrew H Travers, Arthur P Jones, Carlos A Camargo Jr, Stephen J Milan, Brian H Rowe | 12 diciembre 2012
Cynthia D Brown, Douglas C McCrory, John White | 22 enero 2001
Francine M Ducharme, Muireann Ni Chroinin, Ilana Greenstone, Toby J Lasserson | 12 mayo 2010
Rachel Knightly, Stephen J Milan, Rodney Hughes, Jennifer A Knopp‐Sihota, Brian H Rowe, Rebecca Normansell, Colin Powell | 28 noviembre 2017
Muireann Ni Chroinin, Ilana Greenstone, Toby J Lasserson, Francine M Ducharme | 7 octubre 2009
Francine M Ducharme, Muireann Ni Chroinin, Ilana Greenstone, Toby J Lasserson | 14 abril 2010
Andrew H Travers, Stephen J Milan, Arthur P Jones, Carlos A Camargo Jr, Brian H Rowe | 12 diciembre 2012