| 1 Maternal death Show forest plot | 3 | | Risk Ratio (M‐H, Random, 95% CI) | Subtotals only |
|
| 1.1 Any antibiotic versus placebo | 3 | 763 | Risk Ratio (M‐H, Random, 95% CI) | 0.0 [0.0, 0.0] |
| 1.2 All penicillin (excluding co‐amoxiclav) versus placebo | 1 | 85 | Risk Ratio (M‐H, Random, 95% CI) | 0.0 [0.0, 0.0] |
| 1.3 Beta lactum (including co‐amoxiclav) versus placebo | 0 | 0 | Risk Ratio (M‐H, Random, 95% CI) | 0.0 [0.0, 0.0] |
| 1.4 Macrolide (including erythromycin) versus placebo | 0 | 0 | Risk Ratio (M‐H, Random, 95% CI) | 0.0 [0.0, 0.0] |
| 1.5 Other antibiotic versus placebo | 2 | 678 | Risk Ratio (M‐H, Random, 95% CI) | 0.0 [0.0, 0.0] |
| 2 Serious maternal morbidity | 0 | | Risk Ratio (M‐H, Random, 95% CI) | Subtotals only |
| 2.1 Any antibiotic versus placebo | 0 | 0 | Risk Ratio (M‐H, Random, 95% CI) | 0.0 [0.0, 0.0] |
| 2.2 All penicillin (excluding co‐amoxiclav) versus placebo | 0 | 0 | Risk Ratio (M‐H, Random, 95% CI) | 0.0 [0.0, 0.0] |
| 2.3 Beta lactum (including co‐amoxiclav) versus placebo | 0 | 0 | Risk Ratio (M‐H, Random, 95% CI) | 0.0 [0.0, 0.0] |
| 2.4 Macrolide (including erythromycin) versus placebo | 0 | 0 | Risk Ratio (M‐H, Random, 95% CI) | 0.0 [0.0, 0.0] |
| 2.5 Other antibiotic versus placebo | 0 | 0 | Risk Ratio (M‐H, Random, 95% CI) | 0.0 [0.0, 0.0] |
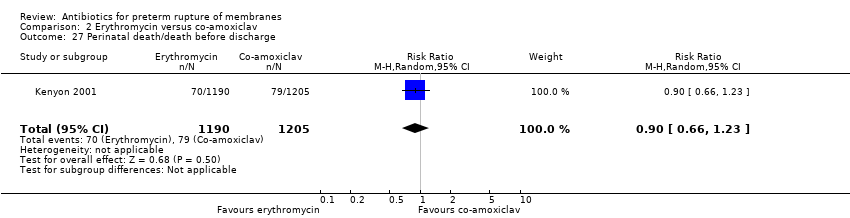
| 3 Perinatal death/death before discharge Show forest plot | 12 | | Risk Ratio (M‐H, Random, 95% CI) | Subtotals only |
|
| 3.1 Any antibiotic versus placebo | 12 | 6301 | Risk Ratio (M‐H, Random, 95% CI) | 0.93 [0.76, 1.14] |
| 3.2 All penicillin (excluding co‐amoxiclav) versus placebo | 4 | 332 | Risk Ratio (M‐H, Random, 95% CI) | 0.78 [0.31, 1.97] |
| 3.3 Beta lactum (including co‐amoxiclav) versus placebo | 2 | 1880 | Risk Ratio (M‐H, Random, 95% CI) | 0.62 [0.15, 2.56] |
| 3.4 Macrolide (including erythromycin) versus placebo | 4 | 2138 | Risk Ratio (M‐H, Random, 95% CI) | 0.83 [0.43, 1.60] |
| 3.5 Other antibiotic versus placebo | 3 | 762 | Risk Ratio (M‐H, Random, 95% CI) | 1.13 [0.68, 1.88] |
| 4 Neonatal infection including pneumonia Show forest plot | 12 | | Risk Ratio (M‐H, Random, 95% CI) | Subtotals only |
|
| 4.1 Any antibiotic versus placebo | 12 | 1680 | Risk Ratio (M‐H, Random, 95% CI) | 0.67 [0.52, 0.85] |
| 4.2 All penicillin (excluding co‐amoxiclav) versus placebo | 5 | 521 | Risk Ratio (M‐H, Random, 95% CI) | 0.30 [0.13, 0.68] |
| 4.3 Beta lactum (including co‐amoxiclav) versus placebo | 1 | 62 | Risk Ratio (M‐H, Random, 95% CI) | 0.33 [0.01, 7.88] |
| 4.4 Macrolide (including erythromycin) versus placebo | 3 | 334 | Risk Ratio (M‐H, Random, 95% CI) | 0.79 [0.45, 1.37] |
| 4.5 Other antibiotic versus placebo | 3 | 763 | Risk Ratio (M‐H, Random, 95% CI) | 0.71 [0.53, 0.95] |
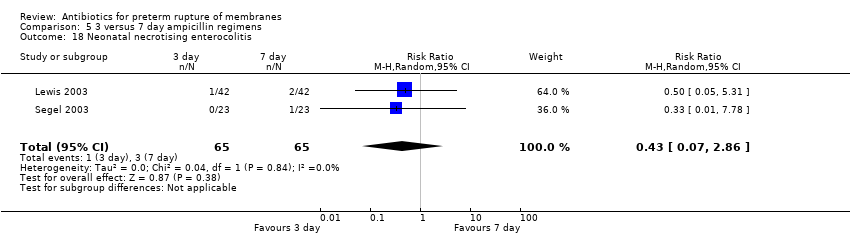
| 5 Neonatal necrotising enterocolitis Show forest plot | 11 | | Risk Ratio (M‐H, Random, 95% CI) | Subtotals only |
|
| 5.1 Any antibiotic versus placebo | 11 | 6229 | Risk Ratio (M‐H, Random, 95% CI) | 1.09 [0.65, 1.83] |
| 5.2 All penicillin (excluding co‐amoxiclav) versus placebo | 3 | 262 | Risk Ratio (M‐H, Random, 95% CI) | 0.85 [0.25, 2.97] |
| 5.3 Beta lactum (including co‐amoxiclav) versus placebo | 2 | 1880 | Risk Ratio (M‐H, Random, 95% CI) | 4.72 [1.57, 14.23] |
| 5.4 Macrolide (including erythromycin) versus placebo | 3 | 2076 | Risk Ratio (M‐H, Random, 95% CI) | 0.88 [0.45, 1.69] |
| 5.5 Other antibiotic versus placebo | 4 | 823 | Risk Ratio (M‐H, Random, 95% CI) | 0.89 [0.54, 1.47] |
| 6 Oxygen treatment > 36 weeks' postconceptual age Show forest plot | 1 | | Risk Ratio (M‐H, Random, 95% CI) | Subtotals only |
|
| 6.1 Any antibiotic versus placebo | 1 | 4809 | Risk Ratio (M‐H, Random, 95% CI) | 0.91 [0.70, 1.17] |
| 6.2 All penicillin (excluding co‐amoxiclav) versus placebo | 0 | 0 | Risk Ratio (M‐H, Random, 95% CI) | 0.0 [0.0, 0.0] |
| 6.3 Beta lactum (including co‐amoxiclav) versus placebo | 1 | 1818 | Risk Ratio (M‐H, Random, 95% CI) | 0.92 [0.63, 1.36] |
| 6.4 Macrolide (including erythromycin) versus placebo | 1 | 1803 | Risk Ratio (M‐H, Random, 95% CI) | 0.89 [0.61, 1.32] |
| 6.5 Other antibiotic versus placebo | 0 | 0 | Risk Ratio (M‐H, Random, 95% CI) | 0.0 [0.0, 0.0] |
| 7 Major cerebral abnormality on ultrasound before discharge Show forest plot | 12 | | Risk Ratio (M‐H, Random, 95% CI) | Subtotals only |
|
| 7.1 Any antibiotic versus placebo | 12 | 6289 | Risk Ratio (M‐H, Random, 95% CI) | 0.81 [0.68, 0.98] |
| 7.2 All penicillin (excluding co‐amoxiclav) versus placebo | 3 | 262 | Risk Ratio (M‐H, Random, 95% CI) | 0.49 [0.25, 0.96] |
| 7.3 Beta lactum (including co‐amoxiclav) versus placebo | 2 | 1880 | Risk Ratio (M‐H, Random, 95% CI) | 0.78 [0.52, 1.16] |
| 7.4 Macrolide (including erythromycin) versus placebo | 4 | 2136 | Risk Ratio (M‐H, Random, 95% CI) | 0.93 [0.60, 1.44] |
| 7.5 Other antibiotic versus placebo | 4 | 823 | Risk Ratio (M‐H, Random, 95% CI) | 0.85 [0.45, 1.64] |
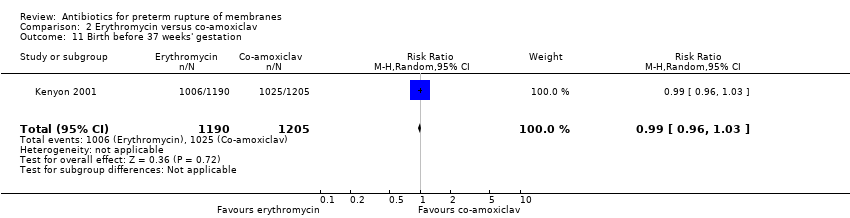
| 8 Birth before 37 weeks' gestation Show forest plot | 3 | 4931 | Risk Ratio (M‐H, Random, 95% CI) | 1.00 [0.98, 1.03] |
|
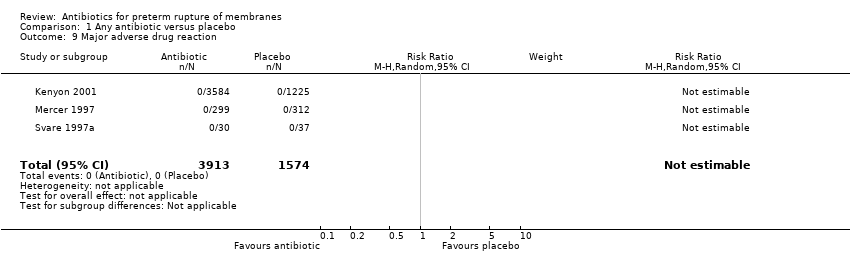
| 9 Major adverse drug reaction Show forest plot | 3 | 5487 | Risk Ratio (M‐H, Random, 95% CI) | 0.0 [0.0, 0.0] |
|
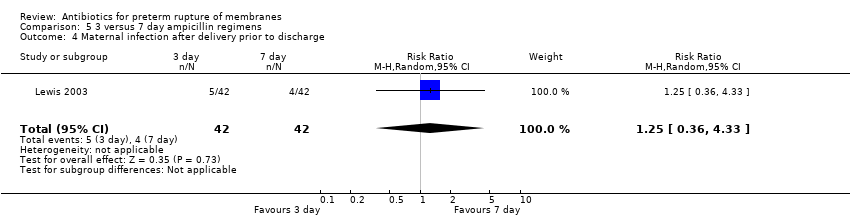
| 10 Maternal infection after delivery prior to discharge Show forest plot | 4 | 5547 | Risk Ratio (M‐H, Random, 95% CI) | 0.91 [0.80, 1.02] |
|
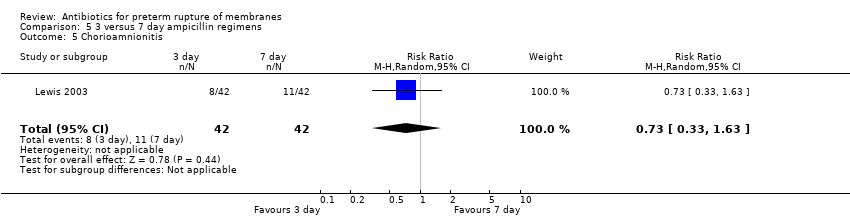
| 11 Chorioamnionitis Show forest plot | 11 | 1559 | Risk Ratio (M‐H, Random, 95% CI) | 0.66 [0.46, 0.96] |
|
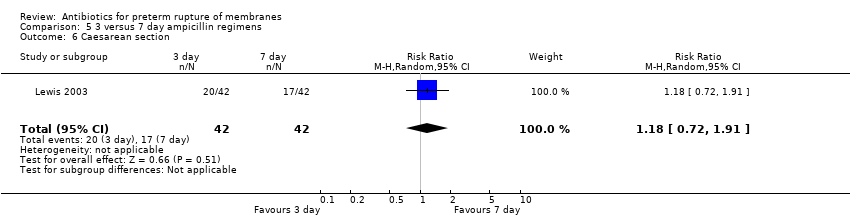
| 12 Caesarean section Show forest plot | 11 | 6317 | Risk Ratio (M‐H, Random, 95% CI) | 0.96 [0.88, 1.05] |
|
| 13 Days from birth till discharge of mother | 0 | 0 | Mean Difference (IV, Random, 95% CI) | 0.0 [0.0, 0.0] |
| 14 Days from randomisation to birth | 0 | 0 | Mean Difference (IV, Random, 95% CI) | 0.0 [0.0, 0.0] |
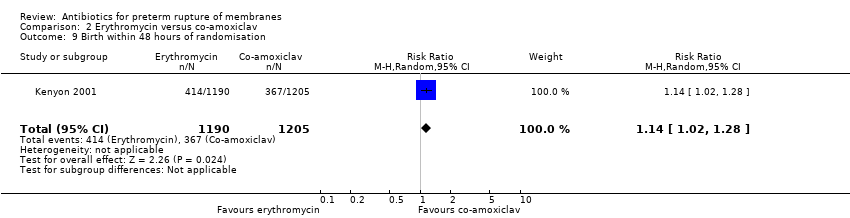
| 15 Birth within 48 hours of randomisation Show forest plot | 7 | 5927 | Risk Ratio (M‐H, Random, 95% CI) | 0.71 [0.58, 0.87] |
|
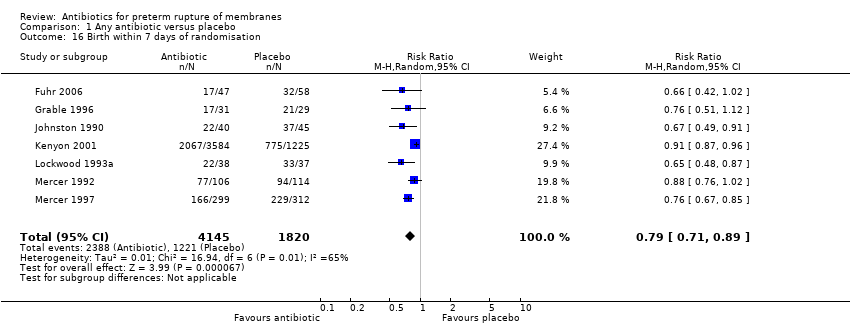
| 16 Birth within 7 days of randomisation Show forest plot | 7 | 5965 | Risk Ratio (M‐H, Random, 95% CI) | 0.79 [0.71, 0.89] |
|
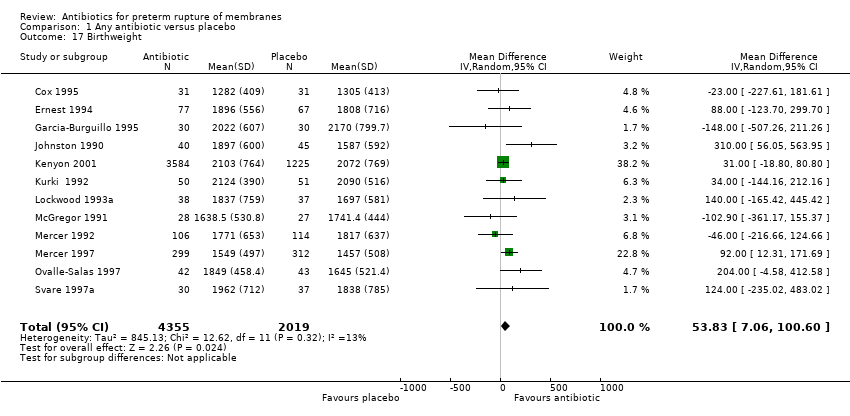
| 17 Birthweight Show forest plot | 12 | 6374 | Mean Difference (IV, Random, 95% CI) | 53.83 [7.06, 100.60] |
|
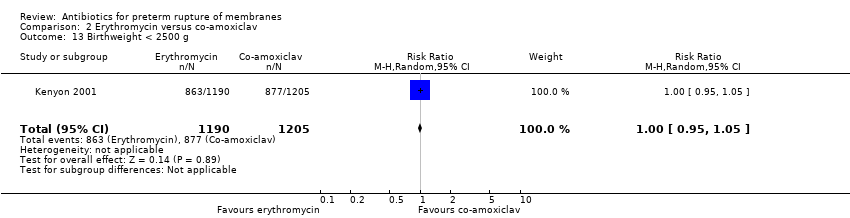
| 18 Birthweight < 2500 g Show forest plot | 2 | 4876 | Risk Ratio (M‐H, Random, 95% CI) | 1.00 [0.96, 1.04] |
|
| 19 Neonatal intensive care Show forest plot | 4 | 5023 | Risk Ratio (M‐H, Random, 95% CI) | 0.98 [0.84, 1.13] |
|
| 20 Days in neonatal intensive care unit Show forest plot | 3 | 225 | Mean Difference (IV, Random, 95% CI) | ‐5.05 [‐9.77, ‐0.33] |
|
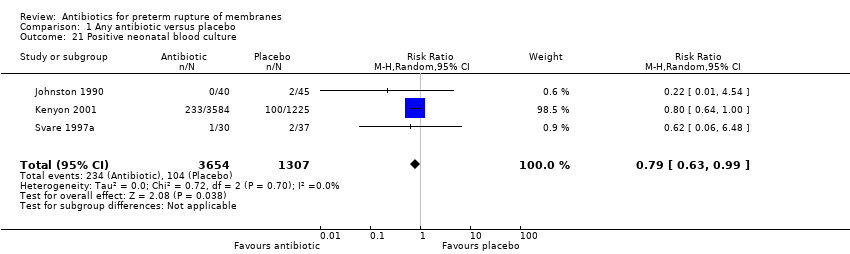
| 21 Positive neonatal blood culture Show forest plot | 3 | 4961 | Risk Ratio (M‐H, Random, 95% CI) | 0.79 [0.63, 0.99] |
|
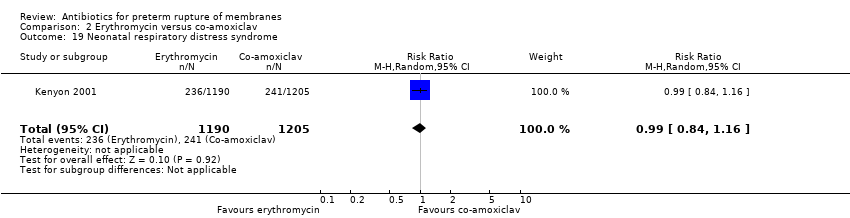
| 22 Neonatal respiratory distress syndrome Show forest plot | 12 | 6287 | Risk Ratio (M‐H, Random, 95% CI) | 0.95 [0.83, 1.09] |
|
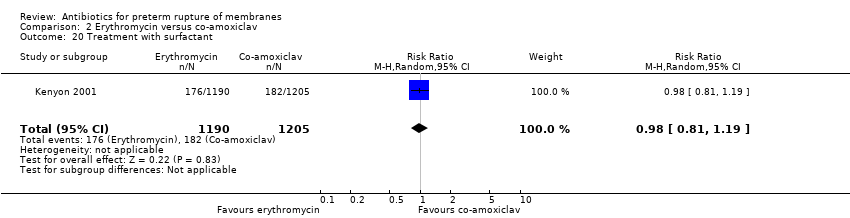
| 23 Treatment with surfactant Show forest plot | 1 | 4809 | Risk Ratio (M‐H, Random, 95% CI) | 0.83 [0.72, 0.96] |
|
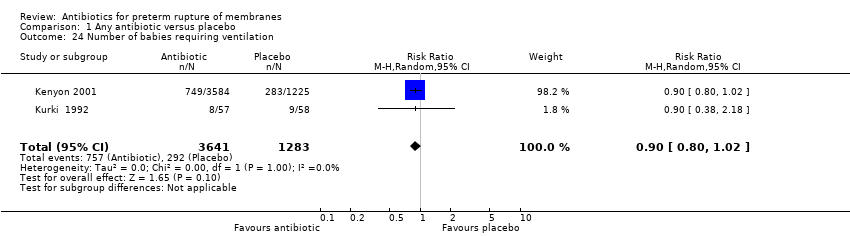
| 24 Number of babies requiring ventilation Show forest plot | 2 | 4924 | Risk Ratio (M‐H, Random, 95% CI) | 0.90 [0.80, 1.02] |
|
| 25 Number of babies requiring oxygen therapy Show forest plot | 1 | 4809 | Risk Ratio (M‐H, Random, 95% CI) | 0.88 [0.81, 0.96] |
|
| 26 Neonatal oxygenation > 28 days Show forest plot | 3 | 5487 | Risk Ratio (M‐H, Random, 95% CI) | 0.79 [0.61, 1.03] |
|
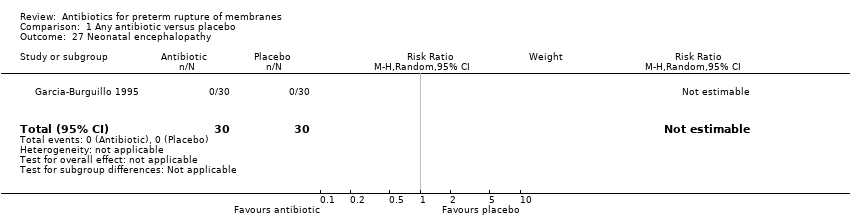
| 27 Neonatal encephalopathy Show forest plot | 1 | 60 | Risk Ratio (M‐H, Random, 95% CI) | 0.0 [0.0, 0.0] |
|
| 28 Serious childhood disability at 7 years Show forest plot | 1 | 3171 | Risk Ratio (M‐H, Random, 95% CI) | 1.01 [0.91, 1.12] |
|