Antibióticos para la rotura prematura de membranas
Información
- DOI:
- https://doi.org/10.1002/14651858.CD001058.pub3Copiar DOI

- Base de datos:
-
- Cochrane Database of Systematic Reviews
- Versión publicada:
-
- 02 diciembre 2013see what's new
- Tipo:
-
- Intervention
- Etapa:
-
- Review
- Grupo Editorial Cochrane:
-
Grupo Cochrane de Embarazo y parto
- Copyright:
-
- Copyright © 2013 The Cochrane Collaboration. Published by John Wiley & Sons, Ltd.
Cifras del artículo
Altmetric:
Citado por:
Autores
Contributions of authors
Sara Kenyon assessed the relevant trials, abstracted the data and wrote the text of the review. Michel Boulvain and Jim Neilson checked the extracted data and helped write the review.
Sources of support
Internal sources
-
University of Liverpool, UK.
-
University of Geneva, Switzerland.
-
Leicester Royal Infirmary, UK.
-
University of Birmingham, UK.
External sources
-
UNDP‐UNFPA‐UNICEF‐WHO‐World Bank Special Programme of Research, Development and Research Training in Human Reproduction (HRP), Department of Reproductive Health and Research (RHR), World Health Organization, Switzerland.
Declarations of interest
Sara Kenyon was the Co‐ordinator of the ORACLE Trial and led the ORACLE Children Study, both of which are included in this review.
Acknowledgements
We acknowledge assistance with the review from Therese Dowswell, Riccardo Pfister, Justus Hofmeyr, David Taylor, Ann Blackburn and Rebecca Smyth.
Therese Dowswell's work was financially supported by the UNDP/UNFPA/UNICEF/WHO/World Bank Special Programme of Research, Development and Research Training in Human Reproduction (HRP), Department of Reproductive Health and Research (RHR), World Health Organization. The named authors alone are responsible for the views expressed in this publication.
As part of the pre‐publication editorial process, the review has been commented on by two peers (an editor and referee who is external to the editorial team), a member of the Pregnancy and Childbirth Group's international panel of consumers and the Group's Statistical Adviser.
The National Institute for Health Research (NIHR) is the largest single funder of the Cochrane Pregnancy and Childbirth Group. The views and opinions expressed therein are those of the authors and do not necessarily reflect those of the NIHR, NHS or the Department of Health.
Version history
| Published | Title | Stage | Authors | Version |
| 2013 Dec 02 | Antibiotics for preterm rupture of membranes | Review | Sara Kenyon, Michel Boulvain, James P Neilson | |
| 2010 Aug 04 | Antibiotics for preterm rupture of membranes | Review | Sara Kenyon, Michel Boulvain, James P Neilson | |
| 2003 Apr 22 | Antibiotics for preterm rupture of membranes | Review | Sara Kenyon, Michel Boulvain, James P Neilson | |
Differences between protocol and review
Secondary outcome "Serious childhood disability at approximately two years" changed to "Serious childhood disability at seven years".
Keywords
MeSH
Medical Subject Headings (MeSH) Keywords
- Amoxicillin-Potassium Clavulanate Combination [adverse effects];
- Anti-Bacterial Agents [adverse effects, *therapeutic use];
- Chorioamnionitis [prevention & control];
- Developmental Disabilities [prevention & control];
- Fetal Membranes, Premature Rupture [*drug therapy];
- Infant, Premature;
- Length of Stay;
- Macrolides [therapeutic use];
- Perinatal Mortality;
- Pregnancy Complications, Infectious [mortality, prevention & control];
- Premature Birth [prevention & control];
- Randomized Controlled Trials as Topic;
Medical Subject Headings Check Words
Child; Female; Humans; Infant, Newborn; Pregnancy;
PICO
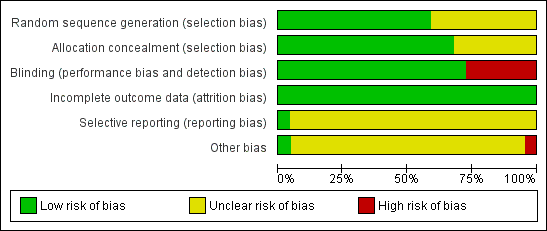
Methodological quality graph: review authors' judgements about each methodological quality item presented as percentages across all included studies.

Funnel plot of comparison: 1 Any antibiotic versus placebo, outcome: 1.3 Perinatal death/death before discharge.

Funnel plot of comparison: 1 Any antibiotic versus placebo, outcome: 1.4 Neonatal infection including pneumonia.
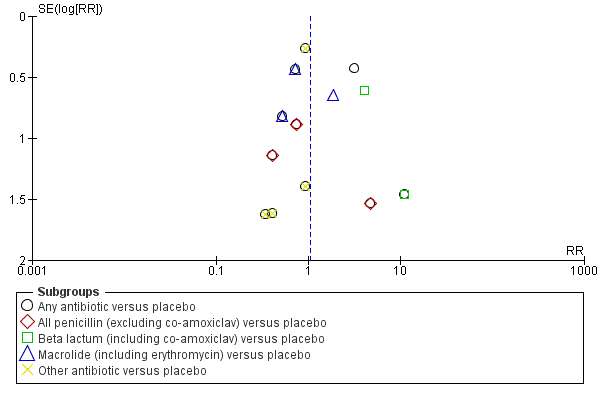
Funnel plot of comparison: 1 Any antibiotic versus placebo, outcome: 1.5 Neonatal necrotising enterocolitis.

Funnel plot of comparison: 1 Any antibiotic versus placebo, outcome: 1.7 Major cerebral abnormality on ultrasound before discharge.

Comparison 1 Any antibiotic versus placebo, Outcome 1 Maternal death.

Comparison 1 Any antibiotic versus placebo, Outcome 3 Perinatal death/death before discharge.

Comparison 1 Any antibiotic versus placebo, Outcome 4 Neonatal infection including pneumonia.

Comparison 1 Any antibiotic versus placebo, Outcome 5 Neonatal necrotising enterocolitis.

Comparison 1 Any antibiotic versus placebo, Outcome 6 Oxygen treatment > 36 weeks' postconceptual age.

Comparison 1 Any antibiotic versus placebo, Outcome 7 Major cerebral abnormality on ultrasound before discharge.

Comparison 1 Any antibiotic versus placebo, Outcome 8 Birth before 37 weeks' gestation.
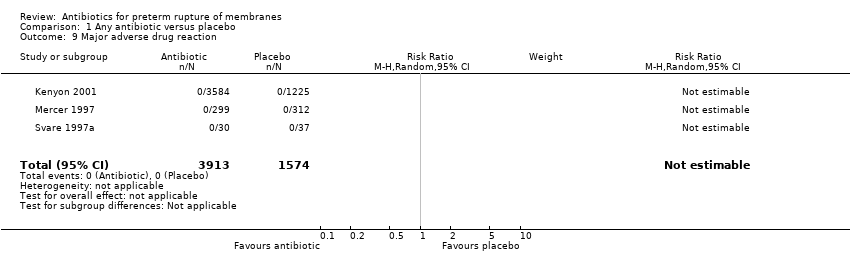
Comparison 1 Any antibiotic versus placebo, Outcome 9 Major adverse drug reaction.

Comparison 1 Any antibiotic versus placebo, Outcome 10 Maternal infection after delivery prior to discharge.

Comparison 1 Any antibiotic versus placebo, Outcome 11 Chorioamnionitis.

Comparison 1 Any antibiotic versus placebo, Outcome 12 Caesarean section.

Comparison 1 Any antibiotic versus placebo, Outcome 15 Birth within 48 hours of randomisation.
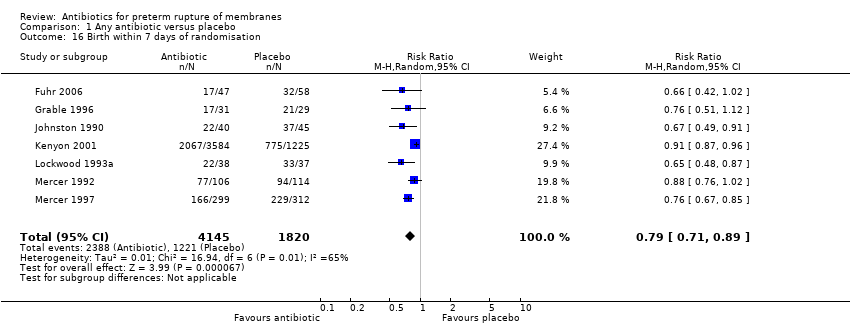
Comparison 1 Any antibiotic versus placebo, Outcome 16 Birth within 7 days of randomisation.
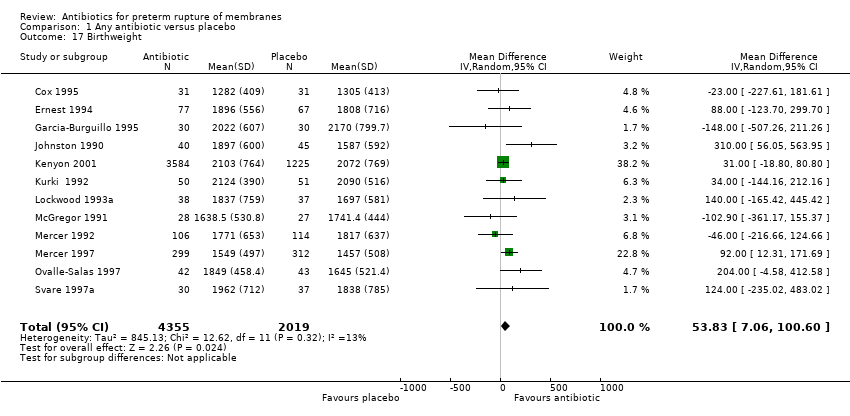
Comparison 1 Any antibiotic versus placebo, Outcome 17 Birthweight.

Comparison 1 Any antibiotic versus placebo, Outcome 18 Birthweight < 2500 g.

Comparison 1 Any antibiotic versus placebo, Outcome 19 Neonatal intensive care.

Comparison 1 Any antibiotic versus placebo, Outcome 20 Days in neonatal intensive care unit.
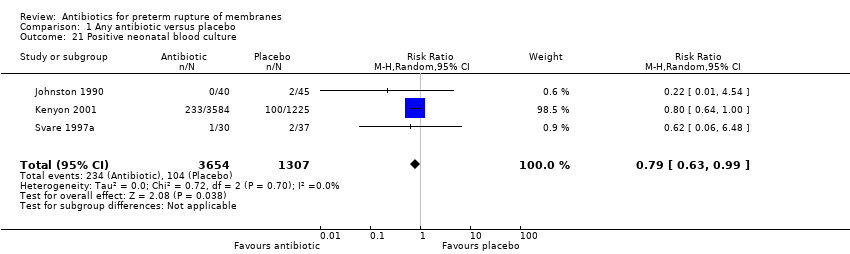
Comparison 1 Any antibiotic versus placebo, Outcome 21 Positive neonatal blood culture.

Comparison 1 Any antibiotic versus placebo, Outcome 22 Neonatal respiratory distress syndrome.

Comparison 1 Any antibiotic versus placebo, Outcome 23 Treatment with surfactant.
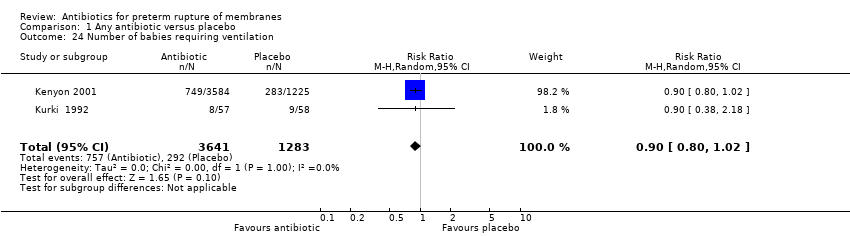
Comparison 1 Any antibiotic versus placebo, Outcome 24 Number of babies requiring ventilation.

Comparison 1 Any antibiotic versus placebo, Outcome 25 Number of babies requiring oxygen therapy.

Comparison 1 Any antibiotic versus placebo, Outcome 26 Neonatal oxygenation > 28 days.
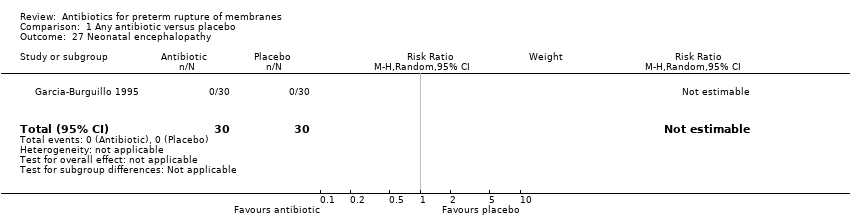
Comparison 1 Any antibiotic versus placebo, Outcome 27 Neonatal encephalopathy.

Comparison 1 Any antibiotic versus placebo, Outcome 28 Serious childhood disability at 7 years.

Comparison 2 Erythromycin versus co‐amoxiclav, Outcome 3 Major adverse drug reaction.

Comparison 2 Erythromycin versus co‐amoxiclav, Outcome 4 Maternal infection after delivery prior to discharge.

Comparison 2 Erythromycin versus co‐amoxiclav, Outcome 6 Caesarean section.
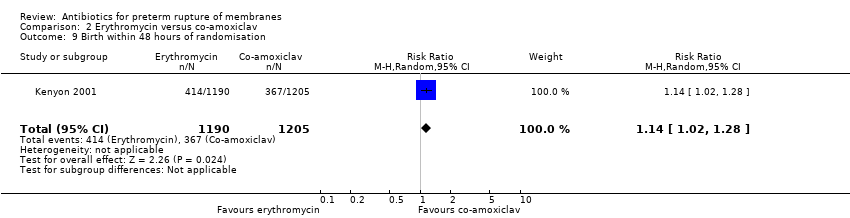
Comparison 2 Erythromycin versus co‐amoxiclav, Outcome 9 Birth within 48 hours of randomisation.

Comparison 2 Erythromycin versus co‐amoxiclav, Outcome 10 Birth within 7 days of randomisation.
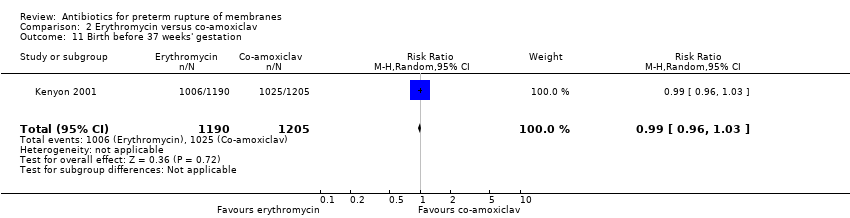
Comparison 2 Erythromycin versus co‐amoxiclav, Outcome 11 Birth before 37 weeks' gestation.

Comparison 2 Erythromycin versus co‐amoxiclav, Outcome 12 Birthweight.
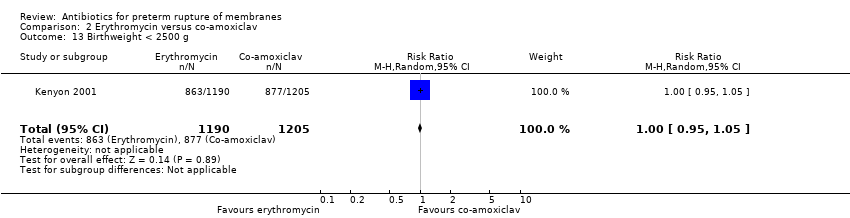
Comparison 2 Erythromycin versus co‐amoxiclav, Outcome 13 Birthweight < 2500 g.

Comparison 2 Erythromycin versus co‐amoxiclav, Outcome 14 Neonatal intensive care.

Comparison 2 Erythromycin versus co‐amoxiclav, Outcome 17 Positive neonatal blood culture.

Comparison 2 Erythromycin versus co‐amoxiclav, Outcome 18 Neonatal necrotising enterocolitis.
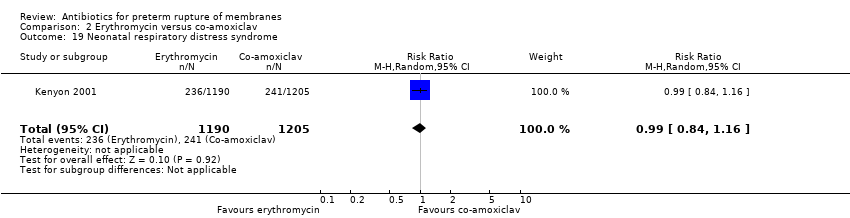
Comparison 2 Erythromycin versus co‐amoxiclav, Outcome 19 Neonatal respiratory distress syndrome.
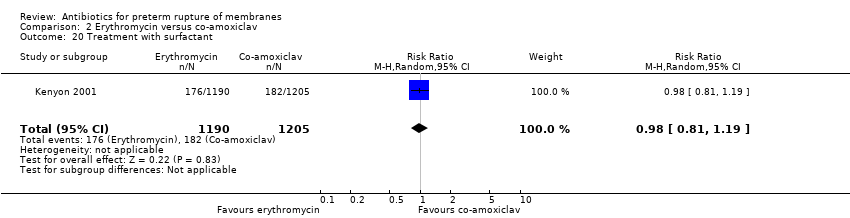
Comparison 2 Erythromycin versus co‐amoxiclav, Outcome 20 Treatment with surfactant.

Comparison 2 Erythromycin versus co‐amoxiclav, Outcome 21 Number of babies requiring ventilation.

Comparison 2 Erythromycin versus co‐amoxiclav, Outcome 22 Number of babies requiring oxygen therapy.

Comparison 2 Erythromycin versus co‐amoxiclav, Outcome 23 Neonatal oxygenation > 28 days.

Comparison 2 Erythromycin versus co‐amoxiclav, Outcome 24 Oxygen treatment > 36 weeks' postconceptual age.

Comparison 2 Erythromycin versus co‐amoxiclav, Outcome 26 Major cerebral abnormality on ultrasound before discharge.
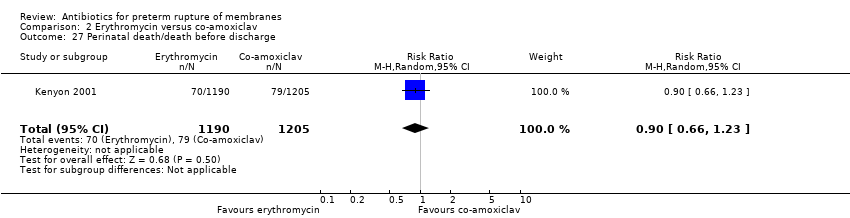
Comparison 2 Erythromycin versus co‐amoxiclav, Outcome 27 Perinatal death/death before discharge.

Comparison 2 Erythromycin versus co‐amoxiclav, Outcome 28 Serious childhood disability at 7 years.

Comparison 4 Antibiotics versus no antibiotic, Outcome 1 Perinatal death/death before discharge.
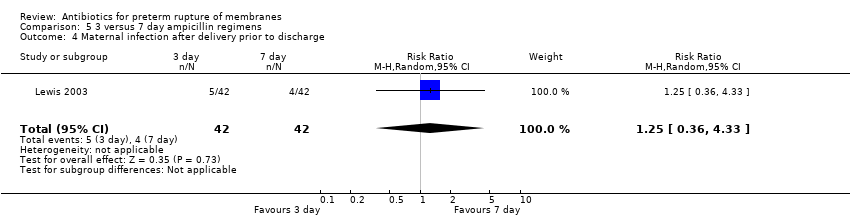
Comparison 5 3 versus 7 day ampicillin regimens, Outcome 4 Maternal infection after delivery prior to discharge.
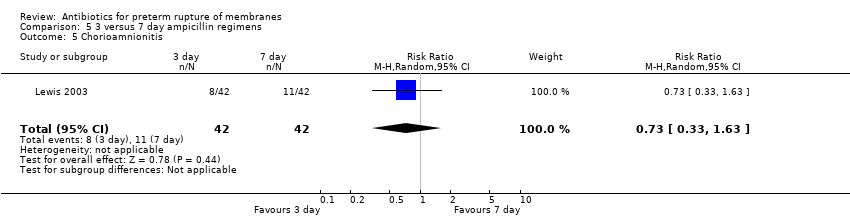
Comparison 5 3 versus 7 day ampicillin regimens, Outcome 5 Chorioamnionitis.
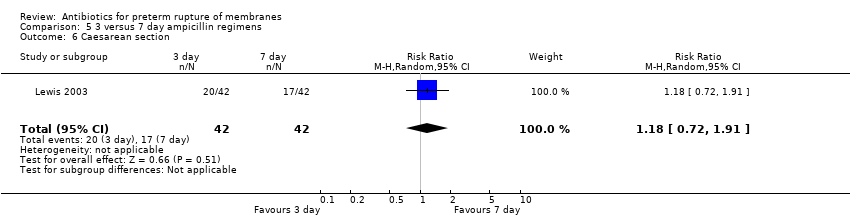
Comparison 5 3 versus 7 day ampicillin regimens, Outcome 6 Caesarean section.

Comparison 5 3 versus 7 day ampicillin regimens, Outcome 9 Birth within 48 hours of randomisation.

Comparison 5 3 versus 7 day ampicillin regimens, Outcome 10 Birth within 7 days of randomisation.

Comparison 5 3 versus 7 day ampicillin regimens, Outcome 14 Neonatal intensive care.
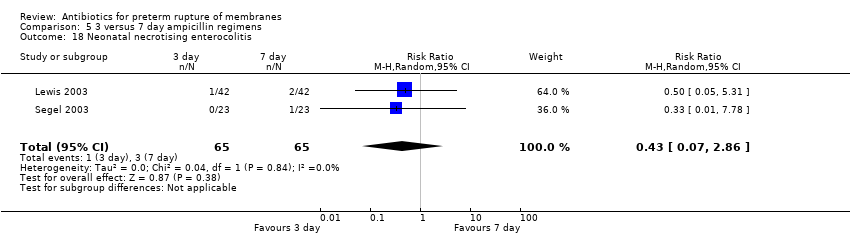
Comparison 5 3 versus 7 day ampicillin regimens, Outcome 18 Neonatal necrotising enterocolitis.

Comparison 5 3 versus 7 day ampicillin regimens, Outcome 19 Neonatal respiratory distress syndrome.

Comparison 5 3 versus 7 day ampicillin regimens, Outcome 26 Neonatal intraventricular haemorrhage.

Comparison 5 3 versus 7 day ampicillin regimens, Outcome 27 Perinatal death/death before discharge.
| Outcome or subgroup title | No. of studies | No. of participants | Statistical method | Effect size |
| 1 Maternal death Show forest plot | 3 | Risk Ratio (M‐H, Random, 95% CI) | Subtotals only | |
| 1.1 Any antibiotic versus placebo | 3 | 763 | Risk Ratio (M‐H, Random, 95% CI) | 0.0 [0.0, 0.0] |
| 1.2 All penicillin (excluding co‐amoxiclav) versus placebo | 1 | 85 | Risk Ratio (M‐H, Random, 95% CI) | 0.0 [0.0, 0.0] |
| 1.3 Beta lactum (including co‐amoxiclav) versus placebo | 0 | 0 | Risk Ratio (M‐H, Random, 95% CI) | 0.0 [0.0, 0.0] |
| 1.4 Macrolide (including erythromycin) versus placebo | 0 | 0 | Risk Ratio (M‐H, Random, 95% CI) | 0.0 [0.0, 0.0] |
| 1.5 Other antibiotic versus placebo | 2 | 678 | Risk Ratio (M‐H, Random, 95% CI) | 0.0 [0.0, 0.0] |
| 2 Serious maternal morbidity | 0 | Risk Ratio (M‐H, Random, 95% CI) | Subtotals only | |
| 2.1 Any antibiotic versus placebo | 0 | 0 | Risk Ratio (M‐H, Random, 95% CI) | 0.0 [0.0, 0.0] |
| 2.2 All penicillin (excluding co‐amoxiclav) versus placebo | 0 | 0 | Risk Ratio (M‐H, Random, 95% CI) | 0.0 [0.0, 0.0] |
| 2.3 Beta lactum (including co‐amoxiclav) versus placebo | 0 | 0 | Risk Ratio (M‐H, Random, 95% CI) | 0.0 [0.0, 0.0] |
| 2.4 Macrolide (including erythromycin) versus placebo | 0 | 0 | Risk Ratio (M‐H, Random, 95% CI) | 0.0 [0.0, 0.0] |
| 2.5 Other antibiotic versus placebo | 0 | 0 | Risk Ratio (M‐H, Random, 95% CI) | 0.0 [0.0, 0.0] |
| 3 Perinatal death/death before discharge Show forest plot | 12 | Risk Ratio (M‐H, Random, 95% CI) | Subtotals only | |
| 3.1 Any antibiotic versus placebo | 12 | 6301 | Risk Ratio (M‐H, Random, 95% CI) | 0.93 [0.76, 1.14] |
| 3.2 All penicillin (excluding co‐amoxiclav) versus placebo | 4 | 332 | Risk Ratio (M‐H, Random, 95% CI) | 0.78 [0.31, 1.97] |
| 3.3 Beta lactum (including co‐amoxiclav) versus placebo | 2 | 1880 | Risk Ratio (M‐H, Random, 95% CI) | 0.62 [0.15, 2.56] |
| 3.4 Macrolide (including erythromycin) versus placebo | 4 | 2138 | Risk Ratio (M‐H, Random, 95% CI) | 0.83 [0.43, 1.60] |
| 3.5 Other antibiotic versus placebo | 3 | 762 | Risk Ratio (M‐H, Random, 95% CI) | 1.13 [0.68, 1.88] |
| 4 Neonatal infection including pneumonia Show forest plot | 12 | Risk Ratio (M‐H, Random, 95% CI) | Subtotals only | |
| 4.1 Any antibiotic versus placebo | 12 | 1680 | Risk Ratio (M‐H, Random, 95% CI) | 0.67 [0.52, 0.85] |
| 4.2 All penicillin (excluding co‐amoxiclav) versus placebo | 5 | 521 | Risk Ratio (M‐H, Random, 95% CI) | 0.30 [0.13, 0.68] |
| 4.3 Beta lactum (including co‐amoxiclav) versus placebo | 1 | 62 | Risk Ratio (M‐H, Random, 95% CI) | 0.33 [0.01, 7.88] |
| 4.4 Macrolide (including erythromycin) versus placebo | 3 | 334 | Risk Ratio (M‐H, Random, 95% CI) | 0.79 [0.45, 1.37] |
| 4.5 Other antibiotic versus placebo | 3 | 763 | Risk Ratio (M‐H, Random, 95% CI) | 0.71 [0.53, 0.95] |
| 5 Neonatal necrotising enterocolitis Show forest plot | 11 | Risk Ratio (M‐H, Random, 95% CI) | Subtotals only | |
| 5.1 Any antibiotic versus placebo | 11 | 6229 | Risk Ratio (M‐H, Random, 95% CI) | 1.09 [0.65, 1.83] |
| 5.2 All penicillin (excluding co‐amoxiclav) versus placebo | 3 | 262 | Risk Ratio (M‐H, Random, 95% CI) | 0.85 [0.25, 2.97] |
| 5.3 Beta lactum (including co‐amoxiclav) versus placebo | 2 | 1880 | Risk Ratio (M‐H, Random, 95% CI) | 4.72 [1.57, 14.23] |
| 5.4 Macrolide (including erythromycin) versus placebo | 3 | 2076 | Risk Ratio (M‐H, Random, 95% CI) | 0.88 [0.45, 1.69] |
| 5.5 Other antibiotic versus placebo | 4 | 823 | Risk Ratio (M‐H, Random, 95% CI) | 0.89 [0.54, 1.47] |
| 6 Oxygen treatment > 36 weeks' postconceptual age Show forest plot | 1 | Risk Ratio (M‐H, Random, 95% CI) | Subtotals only | |
| 6.1 Any antibiotic versus placebo | 1 | 4809 | Risk Ratio (M‐H, Random, 95% CI) | 0.91 [0.70, 1.17] |
| 6.2 All penicillin (excluding co‐amoxiclav) versus placebo | 0 | 0 | Risk Ratio (M‐H, Random, 95% CI) | 0.0 [0.0, 0.0] |
| 6.3 Beta lactum (including co‐amoxiclav) versus placebo | 1 | 1818 | Risk Ratio (M‐H, Random, 95% CI) | 0.92 [0.63, 1.36] |
| 6.4 Macrolide (including erythromycin) versus placebo | 1 | 1803 | Risk Ratio (M‐H, Random, 95% CI) | 0.89 [0.61, 1.32] |
| 6.5 Other antibiotic versus placebo | 0 | 0 | Risk Ratio (M‐H, Random, 95% CI) | 0.0 [0.0, 0.0] |
| 7 Major cerebral abnormality on ultrasound before discharge Show forest plot | 12 | Risk Ratio (M‐H, Random, 95% CI) | Subtotals only | |
| 7.1 Any antibiotic versus placebo | 12 | 6289 | Risk Ratio (M‐H, Random, 95% CI) | 0.81 [0.68, 0.98] |
| 7.2 All penicillin (excluding co‐amoxiclav) versus placebo | 3 | 262 | Risk Ratio (M‐H, Random, 95% CI) | 0.49 [0.25, 0.96] |
| 7.3 Beta lactum (including co‐amoxiclav) versus placebo | 2 | 1880 | Risk Ratio (M‐H, Random, 95% CI) | 0.78 [0.52, 1.16] |
| 7.4 Macrolide (including erythromycin) versus placebo | 4 | 2136 | Risk Ratio (M‐H, Random, 95% CI) | 0.93 [0.60, 1.44] |
| 7.5 Other antibiotic versus placebo | 4 | 823 | Risk Ratio (M‐H, Random, 95% CI) | 0.85 [0.45, 1.64] |
| 8 Birth before 37 weeks' gestation Show forest plot | 3 | 4931 | Risk Ratio (M‐H, Random, 95% CI) | 1.00 [0.98, 1.03] |
| 9 Major adverse drug reaction Show forest plot | 3 | 5487 | Risk Ratio (M‐H, Random, 95% CI) | 0.0 [0.0, 0.0] |
| 10 Maternal infection after delivery prior to discharge Show forest plot | 4 | 5547 | Risk Ratio (M‐H, Random, 95% CI) | 0.91 [0.80, 1.02] |
| 11 Chorioamnionitis Show forest plot | 11 | 1559 | Risk Ratio (M‐H, Random, 95% CI) | 0.66 [0.46, 0.96] |
| 12 Caesarean section Show forest plot | 11 | 6317 | Risk Ratio (M‐H, Random, 95% CI) | 0.96 [0.88, 1.05] |
| 13 Days from birth till discharge of mother | 0 | 0 | Mean Difference (IV, Random, 95% CI) | 0.0 [0.0, 0.0] |
| 14 Days from randomisation to birth | 0 | 0 | Mean Difference (IV, Random, 95% CI) | 0.0 [0.0, 0.0] |
| 15 Birth within 48 hours of randomisation Show forest plot | 7 | 5927 | Risk Ratio (M‐H, Random, 95% CI) | 0.71 [0.58, 0.87] |
| 16 Birth within 7 days of randomisation Show forest plot | 7 | 5965 | Risk Ratio (M‐H, Random, 95% CI) | 0.79 [0.71, 0.89] |
| 17 Birthweight Show forest plot | 12 | 6374 | Mean Difference (IV, Random, 95% CI) | 53.83 [7.06, 100.60] |
| 18 Birthweight < 2500 g Show forest plot | 2 | 4876 | Risk Ratio (M‐H, Random, 95% CI) | 1.00 [0.96, 1.04] |
| 19 Neonatal intensive care Show forest plot | 4 | 5023 | Risk Ratio (M‐H, Random, 95% CI) | 0.98 [0.84, 1.13] |
| 20 Days in neonatal intensive care unit Show forest plot | 3 | 225 | Mean Difference (IV, Random, 95% CI) | ‐5.05 [‐9.77, ‐0.33] |
| 21 Positive neonatal blood culture Show forest plot | 3 | 4961 | Risk Ratio (M‐H, Random, 95% CI) | 0.79 [0.63, 0.99] |
| 22 Neonatal respiratory distress syndrome Show forest plot | 12 | 6287 | Risk Ratio (M‐H, Random, 95% CI) | 0.95 [0.83, 1.09] |
| 23 Treatment with surfactant Show forest plot | 1 | 4809 | Risk Ratio (M‐H, Random, 95% CI) | 0.83 [0.72, 0.96] |
| 24 Number of babies requiring ventilation Show forest plot | 2 | 4924 | Risk Ratio (M‐H, Random, 95% CI) | 0.90 [0.80, 1.02] |
| 25 Number of babies requiring oxygen therapy Show forest plot | 1 | 4809 | Risk Ratio (M‐H, Random, 95% CI) | 0.88 [0.81, 0.96] |
| 26 Neonatal oxygenation > 28 days Show forest plot | 3 | 5487 | Risk Ratio (M‐H, Random, 95% CI) | 0.79 [0.61, 1.03] |
| 27 Neonatal encephalopathy Show forest plot | 1 | 60 | Risk Ratio (M‐H, Random, 95% CI) | 0.0 [0.0, 0.0] |
| 28 Serious childhood disability at 7 years Show forest plot | 1 | 3171 | Risk Ratio (M‐H, Random, 95% CI) | 1.01 [0.91, 1.12] |
| Outcome or subgroup title | No. of studies | No. of participants | Statistical method | Effect size |
| 1 Maternal death | 0 | 0 | Risk Ratio (M‐H, Random, 95% CI) | 0.0 [0.0, 0.0] |
| 2 Serious maternal morbidity | 0 | 0 | Risk Ratio (M‐H, Random, 95% CI) | 0.0 [0.0, 0.0] |
| 3 Major adverse drug reaction Show forest plot | 1 | 2395 | Risk Ratio (M‐H, Random, 95% CI) | 0.0 [0.0, 0.0] |
| 4 Maternal infection after delivery prior to discharge Show forest plot | 1 | 2395 | Risk Ratio (M‐H, Random, 95% CI) | 1.02 [0.87, 1.20] |
| 5 Chorioamnionitis | 0 | 0 | Risk Ratio (M‐H, Random, 95% CI) | 0.0 [0.0, 0.0] |
| 6 Caesarean section Show forest plot | 1 | 2395 | Risk Ratio (M‐H, Random, 95% CI) | 1.02 [0.90, 1.16] |
| 7 Days from randomisation to birth | 0 | 0 | Mean Difference (IV, Random, 95% CI) | 0.0 [0.0, 0.0] |
| 8 Days from birth till discharge of mother | 0 | 0 | Mean Difference (IV, Random, 95% CI) | 0.0 [0.0, 0.0] |
| 9 Birth within 48 hours of randomisation Show forest plot | 1 | 2395 | Risk Ratio (M‐H, Random, 95% CI) | 1.14 [1.02, 1.28] |
| 10 Birth within 7 days of randomisation Show forest plot | 1 | 2395 | Risk Ratio (M‐H, Random, 95% CI) | 1.06 [0.99, 1.13] |
| 11 Birth before 37 weeks' gestation Show forest plot | 1 | 2395 | Risk Ratio (M‐H, Random, 95% CI) | 0.99 [0.96, 1.03] |
| 12 Birthweight Show forest plot | 1 | 2395 | Mean Difference (IV, Random, 95% CI) | 19.0 [‐41.92, 79.92] |
| 13 Birthweight < 2500 g Show forest plot | 1 | 2395 | Risk Ratio (M‐H, Random, 95% CI) | 1.00 [0.95, 1.05] |
| 14 Neonatal intensive care Show forest plot | 1 | 2395 | Risk Ratio (M‐H, Random, 95% CI) | 1.00 [0.95, 1.05] |
| 15 Days in neonatal intensive care unit | 0 | 0 | Mean Difference (IV, Random, 95% CI) | 0.0 [0.0, 0.0] |
| 16 Neonatal infection including pneumonia | 0 | 0 | Risk Ratio (M‐H, Random, 95% CI) | 0.0 [0.0, 0.0] |
| 17 Positive neonatal blood culture Show forest plot | 1 | 2395 | Risk Ratio (M‐H, Random, 95% CI) | 0.84 [0.62, 1.15] |
| 18 Neonatal necrotising enterocolitis Show forest plot | 1 | 2395 | Risk Ratio (M‐H, Random, 95% CI) | 0.46 [0.23, 0.94] |
| 19 Neonatal respiratory distress syndrome Show forest plot | 1 | 2395 | Risk Ratio (M‐H, Random, 95% CI) | 0.99 [0.84, 1.16] |
| 20 Treatment with surfactant Show forest plot | 1 | 2395 | Risk Ratio (M‐H, Random, 95% CI) | 0.98 [0.81, 1.19] |
| 21 Number of babies requiring ventilation Show forest plot | 1 | 2395 | Risk Ratio (M‐H, Random, 95% CI) | 1.00 [0.86, 1.17] |
| 22 Number of babies requiring oxygen therapy Show forest plot | 1 | 2395 | Risk Ratio (M‐H, Random, 95% CI) | 0.98 [0.87, 1.10] |
| 23 Neonatal oxygenation > 28 days Show forest plot | 1 | 2395 | Risk Ratio (M‐H, Random, 95% CI) | 0.86 [0.66, 1.12] |
| 24 Oxygen treatment > 36 weeks' postconceptual age Show forest plot | 1 | 2395 | Risk Ratio (M‐H, Random, 95% CI) | 0.97 [0.70, 1.34] |
| 25 Neonatal encephalopathy | 0 | 0 | Risk Ratio (M‐H, Random, 95% CI) | 0.0 [0.0, 0.0] |
| 26 Major cerebral abnormality on ultrasound before discharge Show forest plot | 1 | 2395 | Risk Ratio (M‐H, Random, 95% CI) | 1.10 [0.74, 1.63] |
| 27 Perinatal death/death before discharge Show forest plot | 1 | 2395 | Risk Ratio (M‐H, Random, 95% CI) | 0.90 [0.66, 1.23] |
| 28 Serious childhood disability at 7 years Show forest plot | 1 | 1612 | Risk Ratio (M‐H, Random, 95% CI) | 0.89 [0.79, 1.01] |
| Outcome or subgroup title | No. of studies | No. of participants | Statistical method | Effect size |
| 1 Perinatal death/death before discharge Show forest plot | 18 | Risk Ratio (M‐H, Random, 95% CI) | Subtotals only | |
| 1.1 Antibiotics versus no antibiotics (all studies) | 18 | 6872 | Risk Ratio (M‐H, Random, 95% CI) | 0.89 [0.74, 1.08] |
| 1.2 Antibiotics versus no treatment (no placebo) | 6 | 571 | Risk Ratio (M‐H, Random, 95% CI) | 0.69 [0.41, 1.14] |
| Outcome or subgroup title | No. of studies | No. of participants | Statistical method | Effect size |
| 1 Maternal death | 0 | 0 | Risk Ratio (M‐H, Random, 95% CI) | 0.0 [0.0, 0.0] |
| 2 Serious maternal morbidity | 0 | 0 | Risk Ratio (M‐H, Random, 95% CI) | 0.0 [0.0, 0.0] |
| 3 Major adverse drug reaction | 0 | 0 | Risk Ratio (M‐H, Random, 95% CI) | 0.0 [0.0, 0.0] |
| 4 Maternal infection after delivery prior to discharge Show forest plot | 1 | 84 | Risk Ratio (M‐H, Random, 95% CI) | 1.25 [0.36, 4.33] |
| 5 Chorioamnionitis Show forest plot | 1 | 84 | Risk Ratio (M‐H, Random, 95% CI) | 0.73 [0.33, 1.63] |
| 6 Caesarean section Show forest plot | 1 | 84 | Risk Ratio (M‐H, Random, 95% CI) | 1.18 [0.72, 1.91] |
| 7 Days from randomisation to birth | 0 | 0 | Mean Difference (IV, Random, 95% CI) | 0.0 [0.0, 0.0] |
| 8 Days from birth till discharge of mother | 0 | 0 | Mean Difference (IV, Random, 95% CI) | 0.0 [0.0, 0.0] |
| 9 Birth within 48 hours of randomisation Show forest plot | 1 | 84 | Risk Ratio (M‐H, Random, 95% CI) | 1.14 [0.46, 2.87] |
| 10 Birth within 7 days of randomisation Show forest plot | 1 | 84 | Risk Ratio (M‐H, Random, 95% CI) | 1.0 [0.70, 1.42] |
| 11 Birth before 37 weeks' gestation | 0 | 0 | Risk Ratio (M‐H, Random, 95% CI) | 0.0 [0.0, 0.0] |
| 12 Birthweight | 0 | 0 | Mean Difference (IV, Random, 95% CI) | 0.0 [0.0, 0.0] |
| 13 Birthweight < 2500 g | 0 | 0 | Risk Ratio (M‐H, Random, 95% CI) | 0.0 [0.0, 0.0] |
| 14 Neonatal intensive care Show forest plot | 1 | 84 | Risk Ratio (M‐H, Random, 95% CI) | 1.0 [0.84, 1.19] |
| 15 Days in neonatal intensive care unit | 0 | 0 | Mean Difference (IV, Random, 95% CI) | 0.0 [0.0, 0.0] |
| 16 Neonatal infection including pneumonia | 0 | 0 | Risk Ratio (M‐H, Random, 95% CI) | 0.0 [0.0, 0.0] |
| 17 Positive neonatal blood culture | 0 | 0 | Risk Ratio (M‐H, Random, 95% CI) | 0.0 [0.0, 0.0] |
| 18 Neonatal necrotising enterocolitis Show forest plot | 2 | 130 | Risk Ratio (M‐H, Random, 95% CI) | 0.43 [0.07, 2.86] |
| 19 Neonatal respiratory distress syndrome Show forest plot | 2 | 130 | Risk Ratio (M‐H, Random, 95% CI) | 0.96 [0.62, 1.49] |
| 20 Treatment with surfactant | 0 | 0 | Risk Ratio (M‐H, Random, 95% CI) | 0.0 [0.0, 0.0] |
| 21 Number of babies requiring ventilation | 0 | 0 | Risk Ratio (M‐H, Random, 95% CI) | 0.0 [0.0, 0.0] |
| 22 Number of babies requiring oxygen therapy | 0 | 0 | Risk Ratio (M‐H, Random, 95% CI) | 0.0 [0.0, 0.0] |
| 23 Neonatal oxygenation > 28 days | 0 | 0 | Risk Ratio (M‐H, Random, 95% CI) | 0.0 [0.0, 0.0] |
| 24 Oxygen treatment > 36 weeks' postconceptual age | 0 | 0 | Risk Ratio (M‐H, Random, 95% CI) | 0.0 [0.0, 0.0] |
| 25 Neonatal encephalopathy | 0 | 0 | Risk Ratio (M‐H, Random, 95% CI) | 0.0 [0.0, 0.0] |
| 26 Neonatal intraventricular haemorrhage Show forest plot | 2 | 130 | Risk Ratio (M‐H, Random, 95% CI) | 0.33 [0.04, 3.12] |
| 27 Perinatal death/death before discharge Show forest plot | 2 | 130 | Risk Ratio (M‐H, Random, 95% CI) | 0.40 [0.05, 2.94] |
| 28 Serious childhood disability at 7 years | 0 | 0 | Risk Ratio (M‐H, Random, 95% CI) | 0.0 [0.0, 0.0] |