Anticonceptivos orales para el dolor asociado con la endometriosis
Información
- DOI:
- https://doi.org/10.1002/14651858.CD001019.pub3Copiar DOI

- Base de datos:
-
- Cochrane Database of Systematic Reviews
- Versión publicada:
-
- 22 mayo 2018see what's new
- Tipo:
-
- Intervention
- Etapa:
-
- Review
- Grupo Editorial Cochrane:
-
Grupo Cochrane de Ginecología y fertilidad
- Copyright:
-
- Copyright © 2018 The Cochrane Collaboration. Published by John Wiley & Sons, Ltd.
Cifras del artículo
Altmetric:
Citado por:
Autores
Contributions of authors
JB, AP, TC: identified the trials for inclusion, extracted and entered data, and assessed trials for risk of bias.
SD and AP were available for content expertise, to assist with any disagreements in assessment by JB and TC, and both made comments and contributions to draft and final versions of the review update.
Sources of support
Internal sources
-
AP: University of Cambridge, UK.
-
JM and SK: University of Oxford, UK.
External sources
-
LJD Peninsula Medical School Foundation Bursary, UK.
-
LJD National Birthday Trust Fund, Wellbeing of Women, UK.
Declarations of interest
JB: none known.
TC: none known.
SD: none known.
AP: none known.
Acknowledgements
Thank you to the editorial base in Auckland.
2018 update: We would like to acknowledge the contributions of L‐J Davis, SS Kennedy and J Moore to previous versions of this review.
Version history
| Published | Title | Stage | Authors | Version |
| 2018 May 22 | Oral contraceptives for pain associated with endometriosis | Review | Julie Brown, Tineke J Crawford, Shree Datta, Andrew Prentice | |
| 2007 Jul 18 | Oral contraceptives for pain associated with endometriosis | Review | Lucy‐Jane Davis, Stephen S Kennedy, Jane Moore, Andrew Prentice | |
| 1997 Oct 20 | Modern combined oral contraceptives for pain associated with endometriosis | Review | Jane Moore, Stephen S Kennedy, Andrew Prentice | |
Differences between protocol and review
In the 2018 update of this review we:
-
removed the restriction on the duration of treatment that was previously an exclusion for participants;
-
changed the presentation of data from odds ratio to risk ratios for dichotomous data to comply with current Cochrane Gynaecology and Fertility Group guidance;
-
changed the primary outcome from "Pain symptoms of endometriosis and dysmenorrhoea: recurrence, frequency and severity (pain scores, days lost off work, use of pain killers)" to "self‐reported pain (dysmenorrhoea) at the end of treatment (as defined by trialists)."
-
In the 'Participants' section we clarified that trials reporting on women with endometrial deposits outside the uterus were excluded.
Keywords
MeSH
Medical Subject Headings (MeSH) Keywords
Medical Subject Headings Check Words
Female; Humans;
PICO

Study flow diagram.

Methodological quality graph: review authors' judgements about each methodological quality item presented as percentages across all included studies.
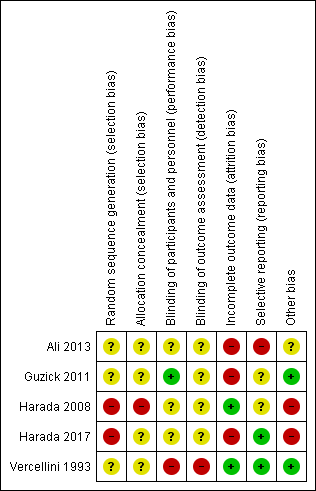
Methodological quality summary: review authors' judgements about each methodological quality item for each included study.

Forest plot of comparison: 1 Combined oral contractive pill (COCP) versus placebo/no treatment, outcome: 1.1 Self‐reported pain (dysmenorrhoea) at end of treatment.

Forest plot of comparison: 2 Combined oral contractive pill (COCP) versus other medical treatment, outcome: 2.1 Self‐reported pain (dysmenorrhoea) at end of treatment (continuous data).

Forest plot of comparison: 2 Combined oral contractive pill (COCP) versus other medical treatment, outcome: 2.2 Self‐reported pain (dysmenorrhoea): VAS (dichotomous data).

Forest plot of comparison: 2 Combined oral contractive pill (COCP) versus other medical treatment, outcome: 2.3 Self‐reported pain (dysmenorrhoea): VRS (dichotomous data).
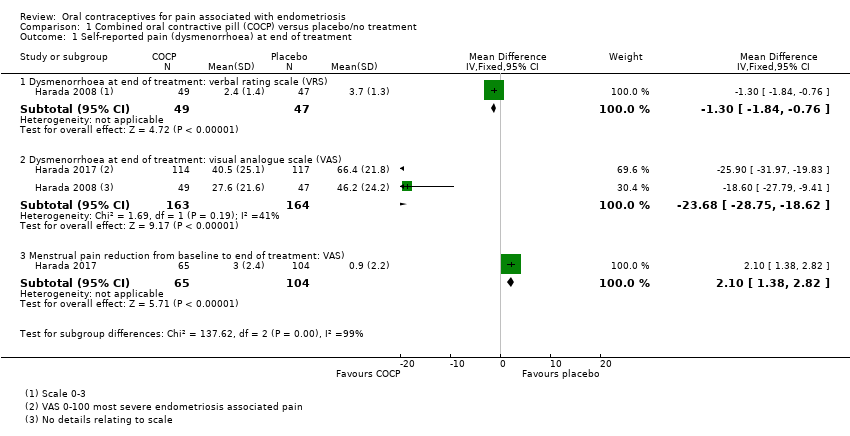
Comparison 1 Combined oral contractive pill (COCP) versus placebo/no treatment, Outcome 1 Self‐reported pain (dysmenorrhoea) at end of treatment.

Comparison 1 Combined oral contractive pill (COCP) versus placebo/no treatment, Outcome 2 Cyclical pain (non‐menstrual).

Comparison 1 Combined oral contractive pill (COCP) versus placebo/no treatment, Outcome 3 Dyspareunia.

Comparison 1 Combined oral contractive pill (COCP) versus placebo/no treatment, Outcome 4 Dyschezia (pain on defecation).

Comparison 1 Combined oral contractive pill (COCP) versus placebo/no treatment, Outcome 5 Satisfaction (very highly/highly satisfied).

Comparison 1 Combined oral contractive pill (COCP) versus placebo/no treatment, Outcome 6 Withdrawal from treatment.

Comparison 1 Combined oral contractive pill (COCP) versus placebo/no treatment, Outcome 7 Adverse effects occurring during treatment.

Comparison 2 Combined oral contractive pill (COCP) versus other medical treatment, Outcome 1 Self‐reported pain (dysmenorrhoea) at end of treatment (continuous data).
Comparison 2 Combined oral contractive pill (COCP) versus other medical treatment, Outcome 2 Self‐reported pain (dysmenorrhoea): VAS (dichotomous data).

Comparison 2 Combined oral contractive pill (COCP) versus other medical treatment, Outcome 3 Self‐reported pain (dysmenorrhoea): VRS (dichotomous data).
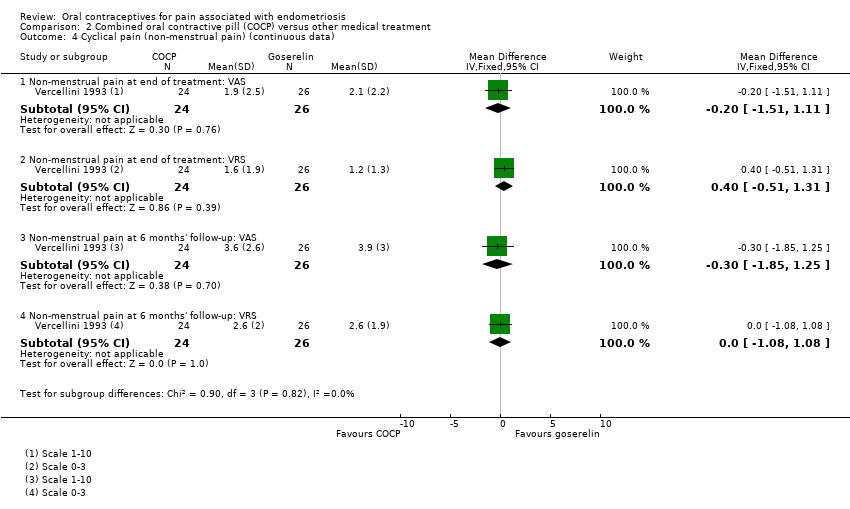
Comparison 2 Combined oral contractive pill (COCP) versus other medical treatment, Outcome 4 Cyclical pain (non‐menstrual pain) (continuous data).

Comparison 2 Combined oral contractive pill (COCP) versus other medical treatment, Outcome 5 Cyclical pain (non‐menstrual pain) (dichotomous data).

Comparison 2 Combined oral contractive pill (COCP) versus other medical treatment, Outcome 6 Dyspareunia (continuous data).

Comparison 2 Combined oral contractive pill (COCP) versus other medical treatment, Outcome 7 Dyspareunia (dichotomous data).

Comparison 2 Combined oral contractive pill (COCP) versus other medical treatment, Outcome 8 Withdrawal from treatment.

Comparison 2 Combined oral contractive pill (COCP) versus other medical treatment, Outcome 9 Adverse effects.
| Combined oral contraceptive pill (COCP) compared to placebo/no treatment for pain associated with endometriosis | ||||||
| Patient or population: women with endometriosis | ||||||
| Outcomes | Anticipated absolute effects* (95% CI) | Relative effect | No of participants | Quality of the evidence | Comments | |
| Risk with placebo/no treatment | Risk with COCP | |||||
| Self‐reported pain (dysmenorrhoea) at the end of treatment: dysmenorrhoea VRS | The mean self‐reported pain (dysmenorrhoea) at the end of treatment: Dysmenorrhoea VRS was 3.7 | MD 1.3 lower | ‐ | 96 | ⊕⊝⊝⊝ | VRS ranged from 0 to 3. |
| Self‐reported pain (dysmenorrhoea) at the end of treatment: dysmenorrhoea VAS | The mean self‐reported pain (dysmenorrhoea) at the end of treatment: Dysmenorrhoea VAS was 46.2 | MD 23.68 lower | ‐ | 327 | ⊕⊝⊝⊝ | No details provided for the VAS. |
| Self‐reported pain: menstrual pain reduction from baseline to end of treatment | The mean menstrual pain (reduction from baseline to end of treatment) was 3.00 | MD 2.10 lower (1.38 lower to 2.82 lower) | ‐ | 169 (1 RCT) | ⊕⊝⊝⊝ | Used a VAS from 0 to 10 where 10 was extreme pain. |
| *The risk in the intervention group (and its 95% confidence interval) is based on the assumed risk in the comparison group and the relative effect of the intervention (and its 95% CI). CI: confidence interval; COCP: combined oral contraceptive pill; MD: mean difference; RCT: randomised controlled trial; VAS: visual analogue scale; VRS: verbal rating scale. | ||||||
| GRADE Working Group grades of evidence | ||||||
| 1Imprecision: evidence was based on a single small trial; downgraded one level. 2Risk of bias: trial judged to be at high risk of bias; downgraded two levels. 3Imprecision: evidence based on a single trial including 96 women; wide confidence intervals; downgraded two levels. | ||||||
| Combined oral contraceptive pill (COCP) compared to other medical treatment for pain associated with endometriosis | ||||||
| Patient or population: women with endometriosis | ||||||
| Outcomes | Anticipated absolute effects* (95% CI) | Relative effect | No of participants | Quality of the evidence | Comments | |
| Risk with other medical treatment | Risk with COCP | |||||
| Self‐reported pain (dysmenorrhoea) at the end of treatment (continuous data): dysmenorrhoea at 6 months' follow‐up: VAS | The mean self‐reported pain (dysmenorrhoea) at the end of treatment (continuous data): dysmenorrhoea at 6 months' follow‐up was 7.5 | MD 0.1 lower | ‐ | 50 | ⊕⊝⊝⊝ | VAS ranged from 1 to 10. |
| Self‐reported pain (dysmenorrhoea) at the end of treatment (continuous data): dysmenorrhoea at 6 months' follow‐up: VRS | The mean self‐reported pain (dysmenorrhoea) at the end of treatment (continuous data): dysmenorrhoea at 6 months' follow‐up was 4.8 | MD 0.1 lower | ‐ | 50 | ⊕⊝⊝⊝ | VRS ranged from 0 to 3. |
| Self‐reported pain (dysmenorrhoea) (dichotomous data): reduction of pain to zero at 6 months' follow‐up: VAS | 38 per 1000 | 14 per 1000 | RR 0.36 | 50 | ⊕⊝⊝⊝ | VAS ranged from 1 to 10. |
| Self‐reported pain (dysmenorrhoea) (dichotomous data) ‐ reduction of pain to zero at 6 months' follow‐up: VRS | 1000 per 1000 | 1000 per 1000 | RR 1.00 | 49 | ⊕⊕⊝⊝ | VRS ranged from 0 to 3. |
| *The risk in the intervention group (and its 95% confidence interval) is based on the assumed risk in the comparison group and the relative effect of the intervention (and its 95% CI). CI: confidence interval; COCP: combined oral contraceptive pill; MD: mean difference; RCT: randomised controlled trial; RR: risk ratio; VAS: visual analogue scale; VRS: verbal rating scale. | ||||||
| GRADE Working Group grades of evidence | ||||||
| 1Risk of bias: no blinding and randomisation and allocation concealment unclear; downgraded one level. 2Imprecision: evidence from a single small trial including 50 women; wide confidence intervals crossing the line of no effect; downgraded two levels. 3Imprecision: evidence from a single small trial reporting data on 49 women; downgraded one level. | ||||||
| Outcome or subgroup title | No. of studies | No. of participants | Statistical method | Effect size |
| 1 Self‐reported pain (dysmenorrhoea) at end of treatment Show forest plot | 2 | Mean Difference (IV, Fixed, 95% CI) | Subtotals only | |
| 1.1 Dysmenorrhoea at end of treatment: verbal rating scale (VRS) | 1 | 96 | Mean Difference (IV, Fixed, 95% CI) | ‐1.30 [‐1.84, ‐0.76] |
| 1.2 Dysmenorrhoea at end of treatment: visual analogue scale (VAS) | 2 | 327 | Mean Difference (IV, Fixed, 95% CI) | ‐23.68 [‐28.75, ‐18.62] |
| 1.3 Menstrual pain reduction from baseline to end of treatment: VAS) | 1 | 169 | Mean Difference (IV, Fixed, 95% CI) | 2.1 [1.38, 2.82] |
| 2 Cyclical pain (non‐menstrual) Show forest plot | 2 | Mean Difference (IV, Fixed, 95% CI) | Subtotals only | |
| 2.1 Non‐menstrual pain at end of treatment: VRS | 1 | 96 | Mean Difference (IV, Fixed, 95% CI) | 0.10 [‐0.48, 0.68] |
| 2.2 Non‐menstrual pain at end of treatment: VAS | 1 | 96 | Mean Difference (IV, Fixed, 95% CI) | ‐1.90 [‐11.72, 7.92] |
| 2.3 Non‐menstrual pain reduction from baseline to end of treatment: VAS | 1 | 212 | Mean Difference (IV, Fixed, 95% CI) | 1.00 [0.30, 1.70] |
| 3 Dyspareunia Show forest plot | 1 | 89 | Mean Difference (IV, Fixed, 95% CI) | 1.4 [0.46, 2.34] |
| 4 Dyschezia (pain on defecation) Show forest plot | 1 | 231 | Mean Difference (IV, Fixed, 95% CI) | 1.2 [0.56, 1.84] |
| 5 Satisfaction (very highly/highly satisfied) Show forest plot | 1 | 258 | Risk Ratio (M‐H, Fixed, 95% CI) | 4.24 [2.44, 7.37] |
| 6 Withdrawal from treatment Show forest plot | 2 | 354 | Risk Ratio (M‐H, Fixed, 95% CI) | 1.34 [0.83, 2.18] |
| 7 Adverse effects occurring during treatment Show forest plot | 2 | Risk Ratio (M‐H, Fixed, 95% CI) | Subtotals only | |
| 7.1 Pregnancy | 1 | 96 | Risk Ratio (M‐H, Fixed, 95% CI) | 2.88 [0.12, 68.98] |
| 7.2 Spotting/irregular bleeding/menorrhagia | 2 | 354 | Risk Ratio (M‐H, Fixed, 95% CI) | 2.44 [1.44, 4.15] |
| 7.3 Nausea | 2 | 354 | Risk Ratio (M‐H, Fixed, 95% CI) | 4.14 [1.79, 9.54] |
| 7.4 Any treatment‐associated adverse effect | 1 | 258 | Risk Ratio (M‐H, Fixed, 95% CI) | 1.17 [1.00, 1.36] |
| Outcome or subgroup title | No. of studies | No. of participants | Statistical method | Effect size |
| 1 Self‐reported pain (dysmenorrhoea) at end of treatment (continuous data) Show forest plot | 1 | Mean Difference (IV, Fixed, 95% CI) | Subtotals only | |
| 1.1 Dysmenorrhoea at 6 months' follow‐up: visual analogue scale (VAS) | 1 | 50 | Mean Difference (IV, Fixed, 95% CI) | ‐0.10 [‐1.28, 1.08] |
| 1.2 Dysmenorrhoea at 6 months' follow‐up: verbal rating scale (VRS) | 1 | 50 | Mean Difference (IV, Fixed, 95% CI) | ‐0.10 [‐0.99, 0.79] |
| 2 Self‐reported pain (dysmenorrhoea): VAS (dichotomous data) Show forest plot | 1 | Risk Ratio (M‐H, Fixed, 95% CI) | Subtotals only | |
| 2.1 Reduction of pain to mild or zero at 6 months' follow‐up | 1 | 50 | Risk Ratio (M‐H, Fixed, 95% CI) | 0.90 [0.32, 2.58] |
| 2.2 Reduction of pain to zero at 6 months' follow‐up | 1 | 50 | Risk Ratio (M‐H, Fixed, 95% CI) | 0.36 [0.02, 8.43] |
| 3 Self‐reported pain (dysmenorrhoea): VRS (dichotomous data) Show forest plot | 1 | Risk Ratio (M‐H, Fixed, 95% CI) | Subtotals only | |
| 3.1 Reduction of pain to mild or zero at 6 months' follow‐up | 1 | 44 | Risk Ratio (M‐H, Fixed, 95% CI) | 0.94 [0.70, 1.28] |
| 3.2 Reduction of pain to zero at 6 months' follow‐up | 1 | 49 | Risk Ratio (M‐H, Fixed, 95% CI) | 1.0 [0.93, 1.08] |
| 4 Cyclical pain (non‐menstrual pain) (continuous data) Show forest plot | 1 | Mean Difference (IV, Fixed, 95% CI) | Subtotals only | |
| 4.1 Non‐menstrual pain at end of treatment: VAS | 1 | 50 | Mean Difference (IV, Fixed, 95% CI) | ‐0.20 [‐1.51, 1.11] |
| 4.2 Non‐menstrual pain at end of treatment: VRS | 1 | 50 | Mean Difference (IV, Fixed, 95% CI) | 0.40 [‐0.51, 1.31] |
| 4.3 Non‐menstrual pain at 6 months' follow‐up: VAS | 1 | 50 | Mean Difference (IV, Fixed, 95% CI) | ‐0.30 [‐1.85, 1.25] |
| 4.4 Non‐menstrual pain at 6 months' follow‐up: VRS | 1 | 50 | Mean Difference (IV, Fixed, 95% CI) | 0.0 [‐1.08, 1.08] |
| 5 Cyclical pain (non‐menstrual pain) (dichotomous data) Show forest plot | 1 | Risk Ratio (M‐H, Fixed, 95% CI) | Subtotals only | |
| 5.1 Reduction of pain to mild or zero at end of treatment: VAS | 1 | 50 | Risk Ratio (M‐H, Fixed, 95% CI) | 0.99 [0.81, 1.21] |
| 5.2 Reduction of pain to zero at end of treatment: VAS | 1 | 50 | Risk Ratio (M‐H, Fixed, 95% CI) | 0.98 [0.51, 1.89] |
| 5.3 Reduction of pain to mild or zero at end of treatment: VRS | 1 | 50 | Risk Ratio (M‐H, Fixed, 95% CI) | 0.99 [0.84, 1.17] |
| 5.4 Reduction to zero at end of treatment: VRS | 1 | 50 | Risk Ratio (M‐H, Fixed, 95% CI) | 0.98 [0.51, 1.89] |
| 5.5 Reduction of pain to mild or zero at 6 months' follow‐up: VAS | 1 | 50 | Risk Ratio (M‐H, Fixed, 95% CI) | 1.14 [0.85, 1.53] |
| 5.6 Reduction of pain to zero at 6 months' follow‐up: VAS | 1 | 50 | Risk Ratio (M‐H, Fixed, 95% CI) | 0.87 [0.26, 2.85] |
| 5.7 Reduction of pain to mild or zero at 6 months' follow‐up: VRS | 1 | 50 | Risk Ratio (M‐H, Fixed, 95% CI) | 0.91 [0.63, 1.32] |
| 5.8 Reduction of pain to zero at 6 months' follow‐up: VRS | 1 | 50 | Risk Ratio (M‐H, Fixed, 95% CI) | 0.87 [0.26, 2.85] |
| 6 Dyspareunia (continuous data) Show forest plot | 1 | Mean Difference (IV, Fixed, 95% CI) | Subtotals only | |
| 6.1 Dyspareunia at end of treatment: VAS | 1 | 43 | Mean Difference (IV, Fixed, 95% CI) | 1.80 [0.18, 3.42] |
| 6.2 Dyspareunia at end of treatment: VRS | 1 | 43 | Mean Difference (IV, Fixed, 95% CI) | 0.10 [‐0.41, 0.61] |
| 6.3 Dyspareunia at 6 months' follow‐up: VAS | 1 | 43 | Mean Difference (IV, Fixed, 95% CI) | 0.40 [‐1.30, 2.10] |
| 6.4 Dyspareunia at 6 months' follow‐up: VRS | 1 | 43 | Mean Difference (IV, Fixed, 95% CI) | 0.10 [‐0.47, 0.67] |
| 7 Dyspareunia (dichotomous data) Show forest plot | 1 | Risk Ratio (M‐H, Fixed, 95% CI) | Subtotals only | |
| 7.1 Reduction of pain to mild or zero at end of treatment: VAS | 1 | 43 | Risk Ratio (M‐H, Fixed, 95% CI) | 0.73 [0.53, 1.02] |
| 7.2 Reduction of pain to zero at end of treatment: VAS | 1 | 43 | Risk Ratio (M‐H, Fixed, 95% CI) | 0.52 [0.19, 1.48] |
| 7.3 Reduction of pain to mild or zero at end of treatment: VRS | 1 | 25 | Risk Ratio (M‐H, Fixed, 95% CI) | 0.96 [0.56, 1.65] |
| 7.4 Reduction of pain to zero at end of treatment: VRS | 1 | 38 | Risk Ratio (M‐H, Fixed, 95% CI) | 1.35 [0.99, 1.84] |
| 7.5 Reduction of pain to mild or zero at 6 months' follow‐up: VAS | 1 | 43 | Risk Ratio (M‐H, Fixed, 95% CI) | 1.05 [0.62, 1.78] |
| 7.6 Reduction of pain to zero at 6 months' follow‐up: VAS | 1 | 43 | Risk Ratio (M‐H, Fixed, 95% CI) | 0.70 [0.13, 3.77] |
| 7.7 Reduction of pain to mild or zero at 6 months' follow‐up: VRS | 1 | 43 | Risk Ratio (M‐H, Fixed, 95% CI) | 0.96 [0.55, 1.68] |
| 7.8 Reduction of pain to zero at 6 months' follow‐up: VRS | 1 | 43 | Risk Ratio (M‐H, Fixed, 95% CI) | 0.70 [0.13, 3.77] |
| 8 Withdrawal from treatment Show forest plot | 1 | 57 | Risk Ratio (M‐H, Fixed, 95% CI) | 1.38 [0.34, 5.62] |
| 9 Adverse effects Show forest plot | 1 | Risk Ratio (M‐H, Fixed, 95% CI) | Subtotals only | |
| 9.1 Hot flushes | 1 | 57 | Risk Ratio (M‐H, Fixed, 95% CI) | 0.04 [0.01, 0.30] |
| 9.2 Insomnia | 1 | 57 | Risk Ratio (M‐H, Fixed, 95% CI) | 0.07 [0.00, 1.15] |
| 9.3 Spotting/irregular bleeding | 1 | 57 | Risk Ratio (M‐H, Fixed, 95% CI) | 1.21 [0.46, 3.15] |
| 9.4 Decreased libido | 1 | 57 | Risk Ratio (M‐H, Fixed, 95% CI) | 0.69 [0.22, 2.19] |
| 9.5 Vaginal dryness | 1 | 57 | Risk Ratio (M‐H, Fixed, 95% CI) | 0.09 [0.01, 1.63] |
| 9.6 Mood change | 1 | 57 | Risk Ratio (M‐H, Fixed, 95% CI) | 1.04 [0.34, 3.19] |
| 9.7 Headache | 1 | 57 | Risk Ratio (M‐H, Fixed, 95% CI) | 1.55 [0.49, 4.92] |
| 9.8 Paraesthesia | 1 | 57 | Risk Ratio (M‐H, Fixed, 95% CI) | 0.35 [0.04, 3.12] |
| 9.9 Breast tenderness | 1 | 57 | Risk Ratio (M‐H, Fixed, 95% CI) | 1.73 [0.45, 6.55] |
| 9.10 Weight gain | 1 | 57 | Risk Ratio (M‐H, Fixed, 95% CI) | 2.07 [0.41, 10.43] |
| 9.11 Peripheral oedema | 1 | 57 | Risk Ratio (M‐H, Fixed, 95% CI) | 1.04 [0.07, 15.77] |
| 9.12 Joint pain | 1 | 57 | Risk Ratio (M‐H, Fixed, 95% CI) | 0.34 [0.01, 8.12] |