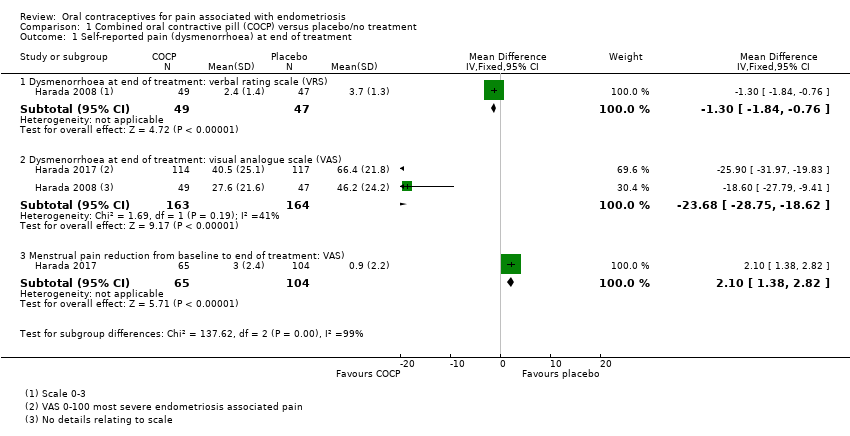
| 1 Self‐reported pain (dysmenorrhoea) at end of treatment (continuous data) Show forest plot | 1 | | Mean Difference (IV, Fixed, 95% CI) | Subtotals only |
|
| 1.1 Dysmenorrhoea at 6 months' follow‐up: visual analogue scale (VAS) | 1 | 50 | Mean Difference (IV, Fixed, 95% CI) | ‐0.10 [‐1.28, 1.08] |
| 1.2 Dysmenorrhoea at 6 months' follow‐up: verbal rating scale (VRS) | 1 | 50 | Mean Difference (IV, Fixed, 95% CI) | ‐0.10 [‐0.99, 0.79] |
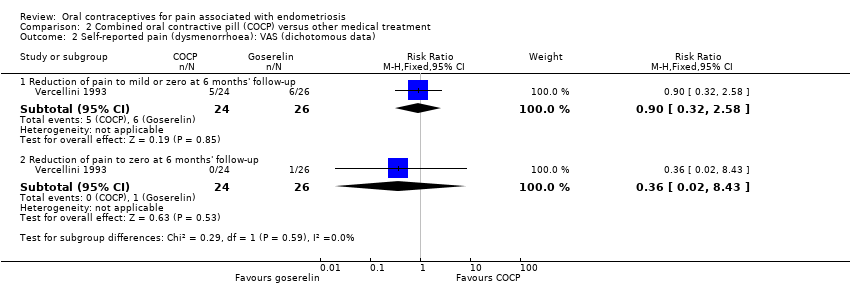
| 2 Self‐reported pain (dysmenorrhoea): VAS (dichotomous data) Show forest plot | 1 | | Risk Ratio (M‐H, Fixed, 95% CI) | Subtotals only |
|
| 2.1 Reduction of pain to mild or zero at 6 months' follow‐up | 1 | 50 | Risk Ratio (M‐H, Fixed, 95% CI) | 0.90 [0.32, 2.58] |
| 2.2 Reduction of pain to zero at 6 months' follow‐up | 1 | 50 | Risk Ratio (M‐H, Fixed, 95% CI) | 0.36 [0.02, 8.43] |
| 3 Self‐reported pain (dysmenorrhoea): VRS (dichotomous data) Show forest plot | 1 | | Risk Ratio (M‐H, Fixed, 95% CI) | Subtotals only |
|
| 3.1 Reduction of pain to mild or zero at 6 months' follow‐up | 1 | 44 | Risk Ratio (M‐H, Fixed, 95% CI) | 0.94 [0.70, 1.28] |
| 3.2 Reduction of pain to zero at 6 months' follow‐up | 1 | 49 | Risk Ratio (M‐H, Fixed, 95% CI) | 1.0 [0.93, 1.08] |
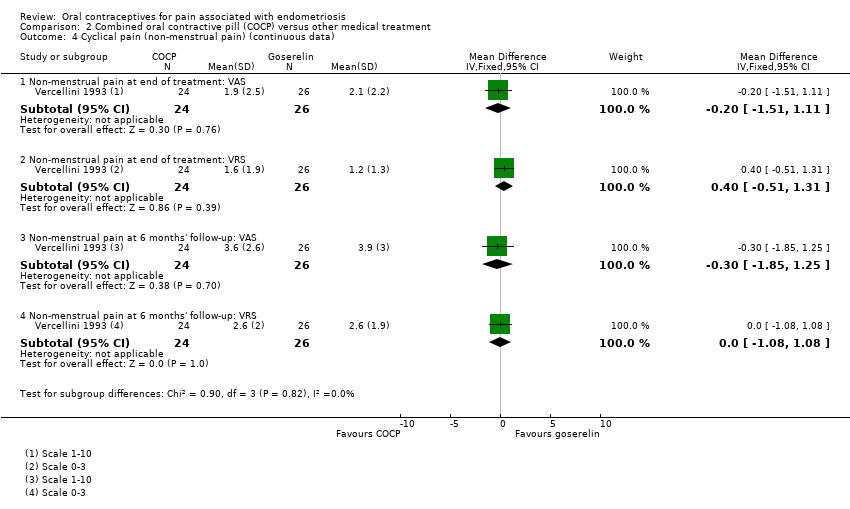
| 4 Cyclical pain (non‐menstrual pain) (continuous data) Show forest plot | 1 | | Mean Difference (IV, Fixed, 95% CI) | Subtotals only |
|
| 4.1 Non‐menstrual pain at end of treatment: VAS | 1 | 50 | Mean Difference (IV, Fixed, 95% CI) | ‐0.20 [‐1.51, 1.11] |
| 4.2 Non‐menstrual pain at end of treatment: VRS | 1 | 50 | Mean Difference (IV, Fixed, 95% CI) | 0.40 [‐0.51, 1.31] |
| 4.3 Non‐menstrual pain at 6 months' follow‐up: VAS | 1 | 50 | Mean Difference (IV, Fixed, 95% CI) | ‐0.30 [‐1.85, 1.25] |
| 4.4 Non‐menstrual pain at 6 months' follow‐up: VRS | 1 | 50 | Mean Difference (IV, Fixed, 95% CI) | 0.0 [‐1.08, 1.08] |
| 5 Cyclical pain (non‐menstrual pain) (dichotomous data) Show forest plot | 1 | | Risk Ratio (M‐H, Fixed, 95% CI) | Subtotals only |
|
| 5.1 Reduction of pain to mild or zero at end of treatment: VAS | 1 | 50 | Risk Ratio (M‐H, Fixed, 95% CI) | 0.99 [0.81, 1.21] |
| 5.2 Reduction of pain to zero at end of treatment: VAS | 1 | 50 | Risk Ratio (M‐H, Fixed, 95% CI) | 0.98 [0.51, 1.89] |
| 5.3 Reduction of pain to mild or zero at end of treatment: VRS | 1 | 50 | Risk Ratio (M‐H, Fixed, 95% CI) | 0.99 [0.84, 1.17] |
| 5.4 Reduction to zero at end of treatment: VRS | 1 | 50 | Risk Ratio (M‐H, Fixed, 95% CI) | 0.98 [0.51, 1.89] |
| 5.5 Reduction of pain to mild or zero at 6 months' follow‐up: VAS | 1 | 50 | Risk Ratio (M‐H, Fixed, 95% CI) | 1.14 [0.85, 1.53] |
| 5.6 Reduction of pain to zero at 6 months' follow‐up: VAS | 1 | 50 | Risk Ratio (M‐H, Fixed, 95% CI) | 0.87 [0.26, 2.85] |
| 5.7 Reduction of pain to mild or zero at 6 months' follow‐up: VRS | 1 | 50 | Risk Ratio (M‐H, Fixed, 95% CI) | 0.91 [0.63, 1.32] |
| 5.8 Reduction of pain to zero at 6 months' follow‐up: VRS | 1 | 50 | Risk Ratio (M‐H, Fixed, 95% CI) | 0.87 [0.26, 2.85] |
| 6 Dyspareunia (continuous data) Show forest plot | 1 | | Mean Difference (IV, Fixed, 95% CI) | Subtotals only |
|
| 6.1 Dyspareunia at end of treatment: VAS | 1 | 43 | Mean Difference (IV, Fixed, 95% CI) | 1.80 [0.18, 3.42] |
| 6.2 Dyspareunia at end of treatment: VRS | 1 | 43 | Mean Difference (IV, Fixed, 95% CI) | 0.10 [‐0.41, 0.61] |
| 6.3 Dyspareunia at 6 months' follow‐up: VAS | 1 | 43 | Mean Difference (IV, Fixed, 95% CI) | 0.40 [‐1.30, 2.10] |
| 6.4 Dyspareunia at 6 months' follow‐up: VRS | 1 | 43 | Mean Difference (IV, Fixed, 95% CI) | 0.10 [‐0.47, 0.67] |
| 7 Dyspareunia (dichotomous data) Show forest plot | 1 | | Risk Ratio (M‐H, Fixed, 95% CI) | Subtotals only |
|
| 7.1 Reduction of pain to mild or zero at end of treatment: VAS | 1 | 43 | Risk Ratio (M‐H, Fixed, 95% CI) | 0.73 [0.53, 1.02] |
| 7.2 Reduction of pain to zero at end of treatment: VAS | 1 | 43 | Risk Ratio (M‐H, Fixed, 95% CI) | 0.52 [0.19, 1.48] |
| 7.3 Reduction of pain to mild or zero at end of treatment: VRS | 1 | 25 | Risk Ratio (M‐H, Fixed, 95% CI) | 0.96 [0.56, 1.65] |
| 7.4 Reduction of pain to zero at end of treatment: VRS | 1 | 38 | Risk Ratio (M‐H, Fixed, 95% CI) | 1.35 [0.99, 1.84] |
| 7.5 Reduction of pain to mild or zero at 6 months' follow‐up: VAS | 1 | 43 | Risk Ratio (M‐H, Fixed, 95% CI) | 1.05 [0.62, 1.78] |
| 7.6 Reduction of pain to zero at 6 months' follow‐up: VAS | 1 | 43 | Risk Ratio (M‐H, Fixed, 95% CI) | 0.70 [0.13, 3.77] |
| 7.7 Reduction of pain to mild or zero at 6 months' follow‐up: VRS | 1 | 43 | Risk Ratio (M‐H, Fixed, 95% CI) | 0.96 [0.55, 1.68] |
| 7.8 Reduction of pain to zero at 6 months' follow‐up: VRS | 1 | 43 | Risk Ratio (M‐H, Fixed, 95% CI) | 0.70 [0.13, 3.77] |
| 8 Withdrawal from treatment Show forest plot | 1 | 57 | Risk Ratio (M‐H, Fixed, 95% CI) | 1.38 [0.34, 5.62] |
|
| 9 Adverse effects Show forest plot | 1 | | Risk Ratio (M‐H, Fixed, 95% CI) | Subtotals only |
|
| 9.1 Hot flushes | 1 | 57 | Risk Ratio (M‐H, Fixed, 95% CI) | 0.04 [0.01, 0.30] |
| 9.2 Insomnia | 1 | 57 | Risk Ratio (M‐H, Fixed, 95% CI) | 0.07 [0.00, 1.15] |
| 9.3 Spotting/irregular bleeding | 1 | 57 | Risk Ratio (M‐H, Fixed, 95% CI) | 1.21 [0.46, 3.15] |
| 9.4 Decreased libido | 1 | 57 | Risk Ratio (M‐H, Fixed, 95% CI) | 0.69 [0.22, 2.19] |
| 9.5 Vaginal dryness | 1 | 57 | Risk Ratio (M‐H, Fixed, 95% CI) | 0.09 [0.01, 1.63] |
| 9.6 Mood change | 1 | 57 | Risk Ratio (M‐H, Fixed, 95% CI) | 1.04 [0.34, 3.19] |
| 9.7 Headache | 1 | 57 | Risk Ratio (M‐H, Fixed, 95% CI) | 1.55 [0.49, 4.92] |
| 9.8 Paraesthesia | 1 | 57 | Risk Ratio (M‐H, Fixed, 95% CI) | 0.35 [0.04, 3.12] |
| 9.9 Breast tenderness | 1 | 57 | Risk Ratio (M‐H, Fixed, 95% CI) | 1.73 [0.45, 6.55] |
| 9.10 Weight gain | 1 | 57 | Risk Ratio (M‐H, Fixed, 95% CI) | 2.07 [0.41, 10.43] |
| 9.11 Peripheral oedema | 1 | 57 | Risk Ratio (M‐H, Fixed, 95% CI) | 1.04 [0.07, 15.77] |
| 9.12 Joint pain | 1 | 57 | Risk Ratio (M‐H, Fixed, 95% CI) | 0.34 [0.01, 8.12] |