| 1 Fever Show forest plot | 40 | 7180 | Risk Ratio (M‐H, Random, 95% CI) | 0.45 [0.39, 0.52] |
|
| 1.1 Elective cesarean delivery | 9 | 1814 | Risk Ratio (M‐H, Random, 95% CI) | 0.49 [0.32, 0.75] |
| 1.2 Non‐elective cesarean delivery | 15 | 2292 | Risk Ratio (M‐H, Random, 95% CI) | 0.40 [0.31, 0.51] |
| 1.3 Both elective and non‐elective, or undefined cesarean delivery | 21 | 3074 | Risk Ratio (M‐H, Random, 95% CI) | 0.47 [0.38, 0.58] |
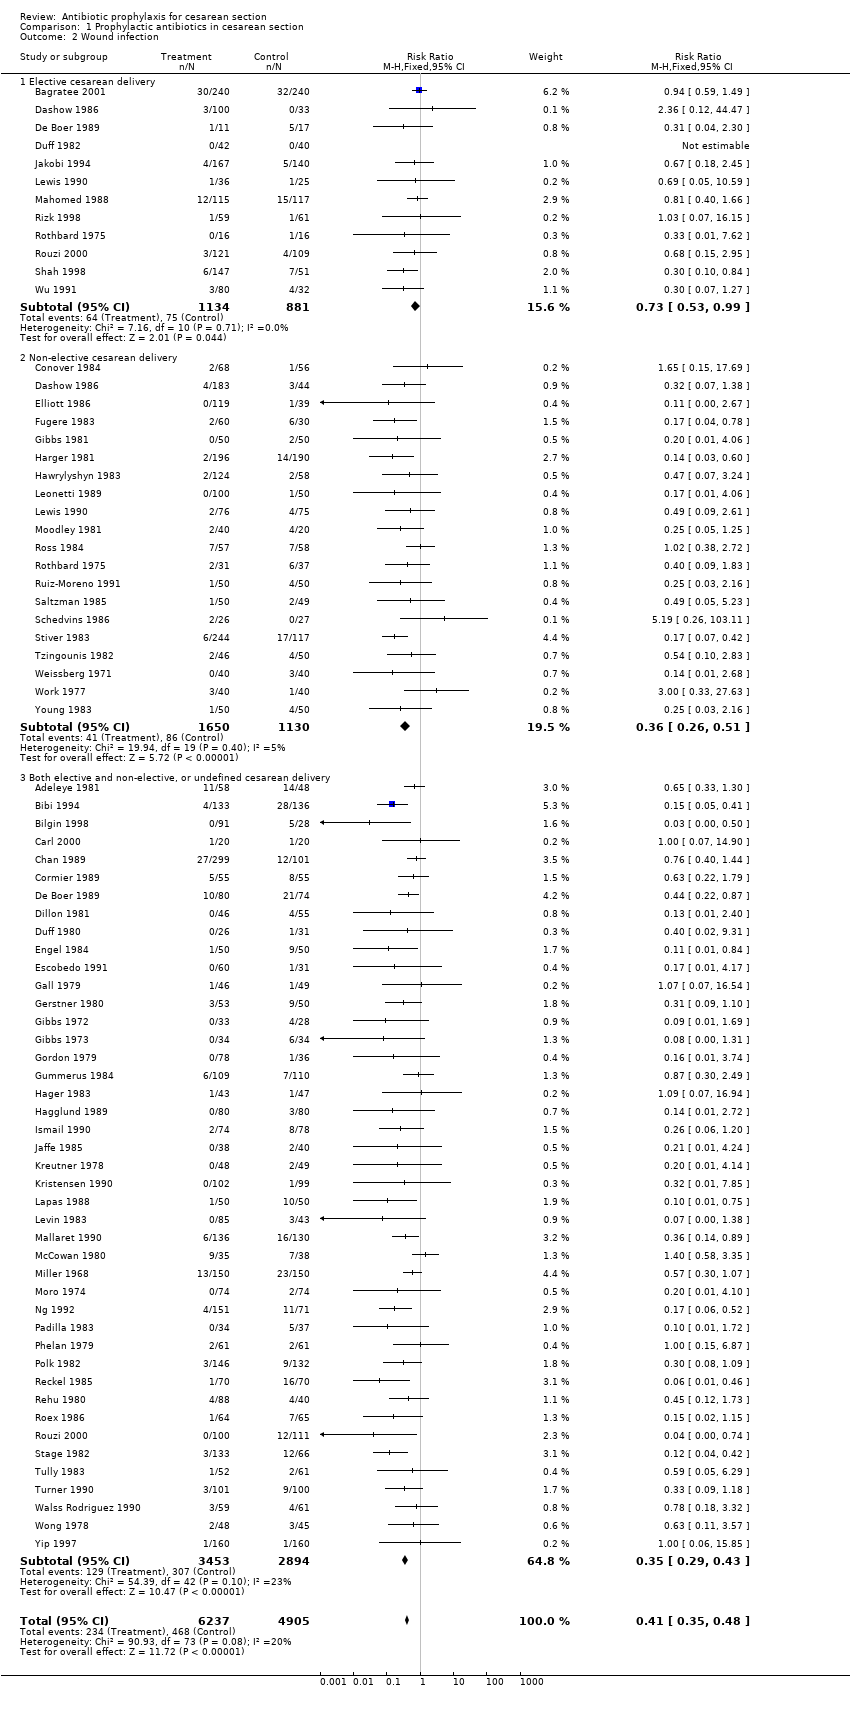
| 2 Wound infection Show forest plot | 70 | 11142 | Risk Ratio (M‐H, Fixed, 95% CI) | 0.41 [0.35, 0.48] |
|
| 2.1 Elective cesarean delivery | 12 | 2015 | Risk Ratio (M‐H, Fixed, 95% CI) | 0.73 [0.53, 0.99] |
| 2.2 Non‐elective cesarean delivery | 20 | 2780 | Risk Ratio (M‐H, Fixed, 95% CI) | 0.36 [0.26, 0.51] |
| 2.3 Both elective and non‐elective, or undefined cesarean delivery | 43 | 6347 | Risk Ratio (M‐H, Fixed, 95% CI) | 0.35 [0.29, 0.43] |
| 3 Endometritis Show forest plot | 76 | 11957 | Risk Ratio (M‐H, Random, 95% CI) | 0.39 [0.34, 0.43] |
|
| 3.1 Elective cesarean delivery | 12 | 2037 | Risk Ratio (M‐H, Random, 95% CI) | 0.38 [0.22, 0.64] |
| 3.2 Non‐elective cesarean delivery | 23 | 3132 | Risk Ratio (M‐H, Random, 95% CI) | 0.39 [0.34, 0.46] |
| 3.3 Both elective and non‐elective, or undefined cesarean delivery | 48 | 6788 | Risk Ratio (M‐H, Random, 95% CI) | 0.36 [0.30, 0.44] |
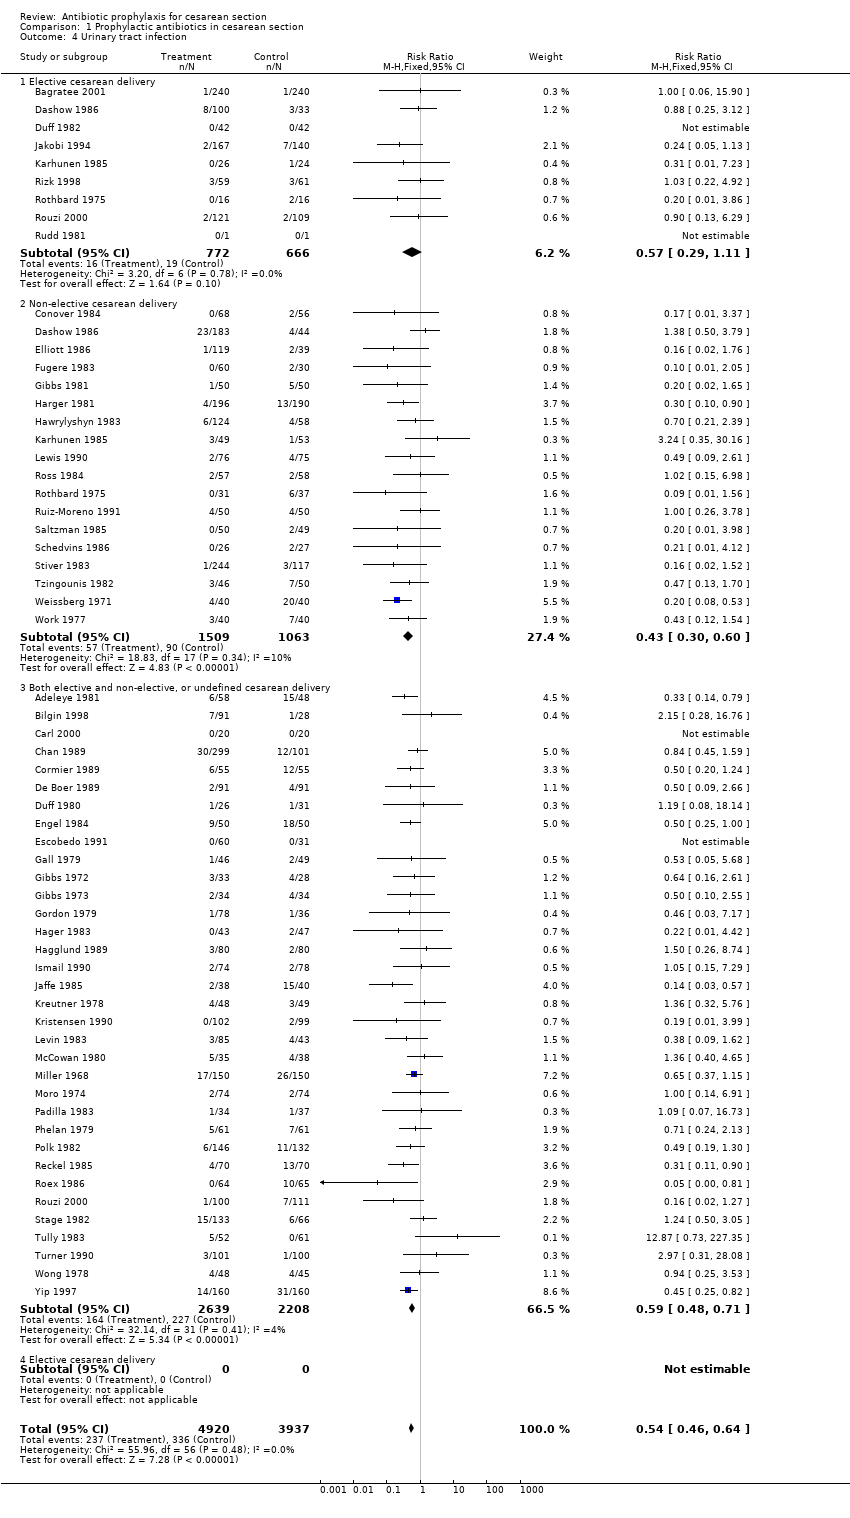
| 4 Urinary tract infection Show forest plot | 57 | 8857 | Risk Ratio (M‐H, Fixed, 95% CI) | 0.54 [0.46, 0.64] |
|
| 4.1 Elective cesarean delivery | 9 | 1438 | Risk Ratio (M‐H, Fixed, 95% CI) | 0.57 [0.29, 1.11] |
| 4.2 Non‐elective cesarean delivery | 18 | 2572 | Risk Ratio (M‐H, Fixed, 95% CI) | 0.43 [0.30, 0.60] |
| 4.3 Both elective and non‐elective, or undefined cesarean delivery | 34 | 4847 | Risk Ratio (M‐H, Fixed, 95% CI) | 0.59 [0.48, 0.71] |
| 4.4 Elective cesarean delivery | 0 | 0 | Risk Ratio (M‐H, Fixed, 95% CI) | 0.0 [0.0, 0.0] |
| 5 Serious infectious morbidity/death Show forest plot | 29 | 4760 | Risk Ratio (M‐H, Fixed, 95% CI) | 0.42 [0.28, 0.65] |
|
| 5.1 Elective cesarean delivery | 3 | 445 | Risk Ratio (M‐H, Fixed, 95% CI) | 1.01 [0.04, 24.21] |
| 5.2 Non‐elective cesarean delivery | 8 | 1336 | Risk Ratio (M‐H, Fixed, 95% CI) | 0.28 [0.13, 0.61] |
| 5.3 Both elective and non‐elective, or undefined cesarean delivery | 20 | 2979 | Risk Ratio (M‐H, Fixed, 95% CI) | 0.50 [0.30, 0.84] |
| 6 Maternal side‐effects Show forest plot | 11 | 1976 | Risk Ratio (M‐H, Fixed, 95% CI) | 2.02 [0.91, 4.50] |
|
| 6.1 Elective cesarean delivery | 0 | 0 | Risk Ratio (M‐H, Fixed, 95% CI) | 0.0 [0.0, 0.0] |
| 6.2 Non‐elective cesarean delivery | 7 | 1268 | Risk Ratio (M‐H, Fixed, 95% CI) | 1.73 [0.67, 4.43] |
| 6.3 Both elective and non‐elective, or undefined cesarean delivery | 5 | 708 | Risk Ratio (M‐H, Fixed, 95% CI) | 2.93 [0.63, 13.74] |
| 7 Days in hospital (mother) Show forest plot | 15 | 2964 | Mean Difference (IV, Random, 95% CI) | ‐0.47 [‐0.68, ‐0.26] |
|
| 7.1 Elective cesarean delivery | 3 | 830 | Mean Difference (IV, Random, 95% CI) | ‐0.37 [‐0.73, ‐0.02] |
| 7.2 Non‐elective cesarean delivery | 3 | 586 | Mean Difference (IV, Random, 95% CI) | ‐0.45 [‐0.77, ‐0.13] |
| 7.3 Both elective and non‐elective, or undefined cesarean delivery | 10 | 1548 | Mean Difference (IV, Random, 95% CI) | ‐0.54 [‐0.88, ‐0.19] |