Suplementos de ácidos grasos poliinsaturados de cadena larga para recién nacidos prematuros
Información
- DOI:
- https://doi.org/10.1002/14651858.CD000375.pub5Copiar DOI

- Base de datos:
-
- Cochrane Database of Systematic Reviews
- Versión publicada:
-
- 20 diciembre 2016see what's new
- Tipo:
-
- Intervention
- Etapa:
-
- Review
- Grupo Editorial Cochrane:
-
Grupo Cochrane de Neonatología
- Copyright:
-
- Copyright © 2017 The Cochrane Collaboration. Published by John Wiley & Sons, Ltd.
Cifras del artículo
Altmetric:
Citado por:
Autores
Contributions of authors
2000 original review:
KS: Design and preparation of protocol, literature search, assessment of eligibility and quality of studies, data extraction and data analysis, writing of manuscript.
2004 review update:
KS: Assessment of eligibility and quality of studies, review of manuscript.
SP: Literature search, assessment of eligibility and quality of studies, data extraction and data analysis, writing of manuscript.
2008 review update:
KS: Review of manuscript, guidance and supervision for planning of the meta‐analysis.
SMS: Literature search, assessment of eligibility and quality of studies, data extraction and data analysis, writing of manuscript.
SP: Literature search, assessment of eligibility and study quality, review of manuscript.
2010 review update:
SMS: Literature search, assessment of eligibility and quality of studies, data extraction and data analysis, writing of manuscript.
SP: Assessment of eligibility and study quality, data extraction, review of manuscript.
KS: Assessment of eligibility and study quality, review of manuscript, guidance and supervision for update of the meta‐analysis.
2016 review update:
SS: Review of the manuscript.
KS: Review of the manuscript.
SP: Review of the manuscript.
SR: Literature search, assessed eligibility and reassessed risk of bias of included studies, shared writing of manuscript.
KM: Literature search, assessed eligibility and reassessed risk of bias of included studies, added study flow diagram, bias graph and table, updated 'Summary of findings' table, shared writing of manuscript.
Sources of support
Internal sources
-
No sources of support supplied
External sources
-
Eunice Kennedy Shriver National Institute of Child Health and Human Development, National Institutes of Health, Department of Health and Human Services, USA.
Editorial support of the Cochrane Neonatal Review Group has been funded with Federal funds from the Eunice Kennedy Shriver National Institute of Child Health and Human Development National Institutes of Health, Department of Health and Human Services, USA, under Contract No. HHSN275201600005C
-
National Institute for Health Research, UK.
Editorial support for Cochrane Neonatal has been funded with funds from a UK National Institute of Health Research Grant (NIHR) Cochrane Programme Grant (13/89/12). The views expressed in this publication are those of the authors and not necessarily those of the NHS, the NIHR, or the UK Department of Health.
Declarations of interest
None.
Acknowledgements
We gratefully acknowledge the assistance of Dr Maria Makrides with interpretation of VEP.
We thank Dr Sharon Groh‐Wargo, Dr Deborah Diersen‐Schade, Prof Berthold Koletzko, and Prof Alexandre Lapillonne for provision of additional data and/or clarification of study methodology.
We also thank Ms Marta Rossignoli, librarian at Princess Margaret Hospital, for her valuable help in performing the literature search for the current update (2016).
Editorial support of the Cochrane Neonatal Review Group has been funded with Federal funds from the Eunice Kennedy Shriver National Institute of Child Health and Human Development National Institutes of Health, Department of Health and Human Services, USA, under Contract No. HHSN267200603418C.
Version history
| Published | Title | Stage | Authors | Version |
| 2016 Dec 20 | Longchain polyunsaturated fatty acid supplementation in preterm infants | Review | Kwi Moon, Shripada C Rao, Sven M Schulzke, Sanjay K Patole, Karen Simmer | |
| 2011 Feb 16 | Longchain polyunsaturated fatty acid supplementation in preterm infants | Review | Sven M Schulzke, Sanjay K Patole, Karen Simmer | |
| 2008 Jan 23 | Longchain polyunsaturated fatty acid supplementation in preterm infants | Review | Karen Simmer, Sven Schulzke, Sanjay Patole | |
| 2004 Jan 26 | Longchain polyunsaturated fatty acid supplementation in preterm infants | Review | Karen Simmer, Sanjay Patole | |
| 1998 Oct 15 | Longchain polyunsaturated fatty acid supplementation in preterm infants | Review | Karen Simmer | |
Differences between protocol and review
We added the methodology and plan for 'Summary of findings' tables and GRADE recommendations, which were not included in the original protocol.
Keywords
MeSH
Medical Subject Headings (MeSH) Keywords
- *Dietary Supplements;
- Arachidonic Acid [administration & dosage];
- Docosahexaenoic Acids [administration & dosage];
- Fatty Acids, Unsaturated [*administration & dosage];
- Infant Formula [*chemistry];
- Infant Nutritional Physiological Phenomena;
- Infant, Premature [*growth & development];
- Intelligence [physiology];
- Randomized Controlled Trials as Topic;
- Vision, Ocular [physiology];
- Visual Acuity [*physiology];
Medical Subject Headings Check Words
Humans; Infant, Newborn;
PICO
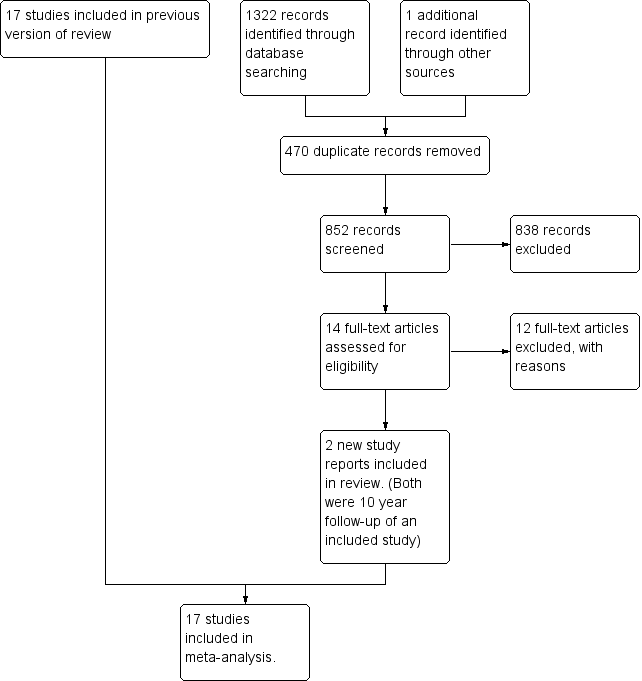
Study flow diagram.

Risk of bias graph: review authors' judgements about each risk of bias item presented as percentages across all included studies.
Forest plot of comparison: 1 Supplement vs control, outcome: 1.6 Visual acuity (log cycles/degree) at 12 months post‐term.
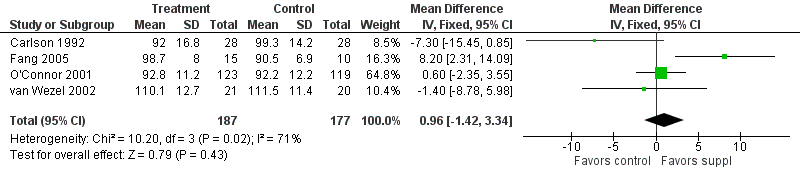
Forest plot of comparison: 1 Supplement vs control, outcome: 1.13 Bayley MDI at 12 months post‐term.

Forest plot of comparison: 1 Supplement vs control, outcome: 1.14 Bayley PDI at 12 months post‐term.

Forest plot of comparison: 1 Supplement vs control, outcome: 1.28 Weight at 12 months post‐term (kg).
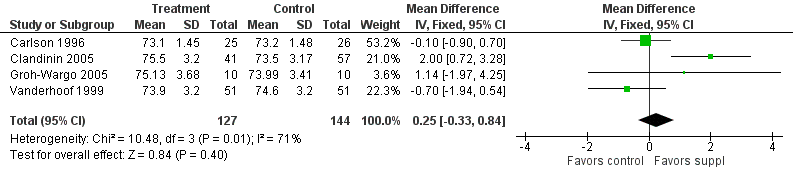
Forest plot of comparison: 1 Supplement vs control, outcome: 1.29 Length at 12 months post‐term (cm).

Forest plot of comparison: 1 Supplement vs control, outcome: 1.30 Head circumference at 12 months post‐term (cm).

Comparison 1 Supplement vs control, Outcome 1 Visual acuity (log cycles/degree) at term.
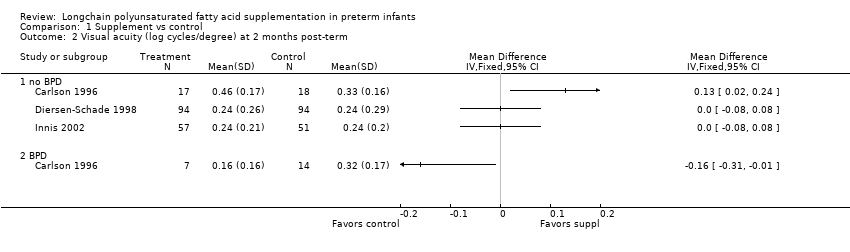
Comparison 1 Supplement vs control, Outcome 2 Visual acuity (log cycles/degree) at 2 months post‐term.
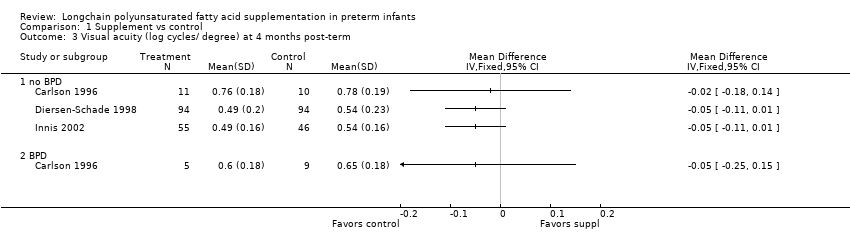
Comparison 1 Supplement vs control, Outcome 3 Visual acuity (log cycles/ degree) at 4 months post‐term.
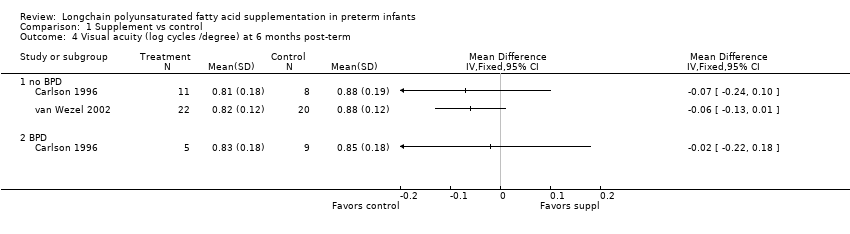
Comparison 1 Supplement vs control, Outcome 4 Visual acuity (log cycles /degree) at 6 months post‐term.

Comparison 1 Supplement vs control, Outcome 5 Visual acuity (log cycles/degree) at 9 months post‐term.

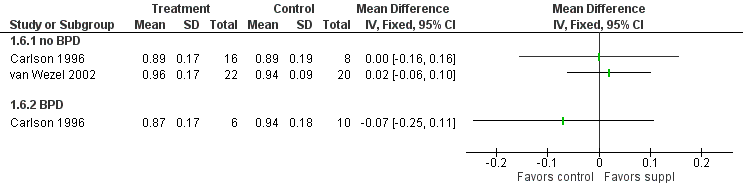
Comparison 1 Supplement vs control, Outcome 6 Visual acuity (log cycles/degree) at 12 months post‐term.

Comparison 1 Supplement vs control, Outcome 7 Rod ERG at 36 wk PCA.
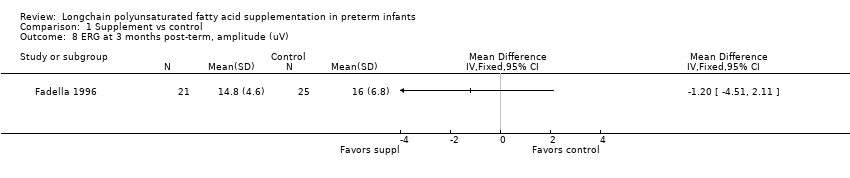
Comparison 1 Supplement vs control, Outcome 8 ERG at 3 months post‐term, amplitude (uV).
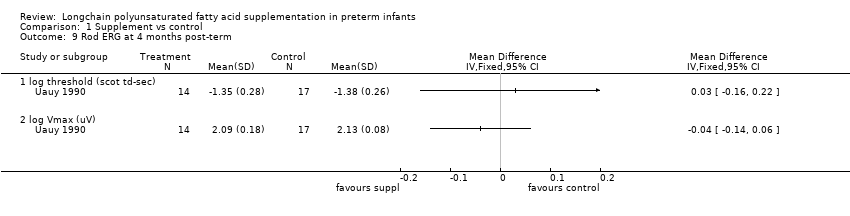
Comparison 1 Supplement vs control, Outcome 9 Rod ERG at 4 months post‐term.
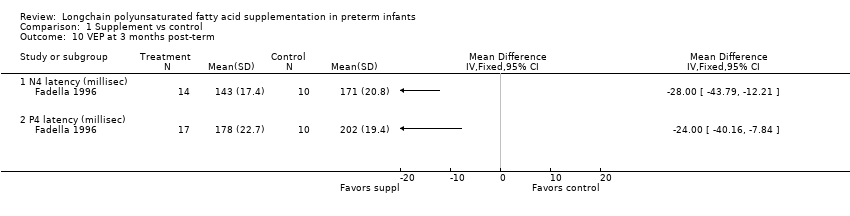
Comparison 1 Supplement vs control, Outcome 10 VEP at 3 months post‐term.

Comparison 1 Supplement vs control, Outcome 11 Fagan infant test at 12 months post‐term.
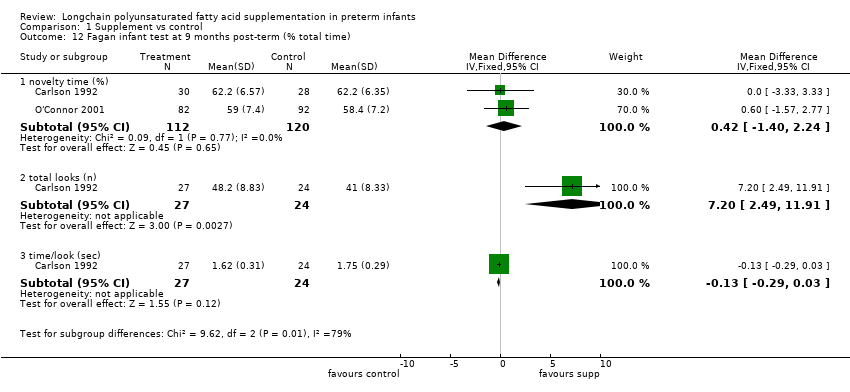
Comparison 1 Supplement vs control, Outcome 12 Fagan infant test at 9 months post‐term (% total time).
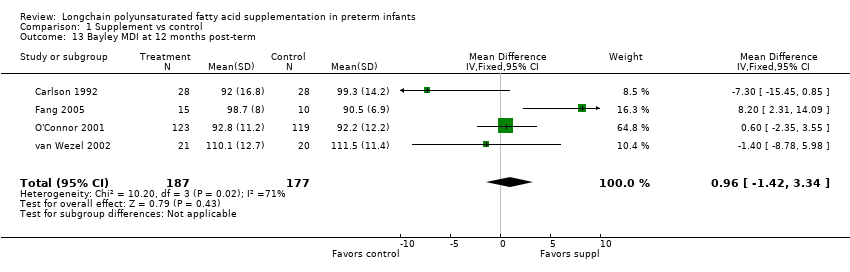
Comparison 1 Supplement vs control, Outcome 13 Bayley MDI at 12 months post‐term.

Comparison 1 Supplement vs control, Outcome 14 Bayley PDI at 12 months post‐term.
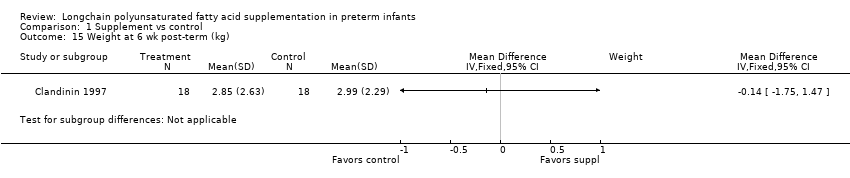
Comparison 1 Supplement vs control, Outcome 15 Weight at 6 wk post‐term (kg).

Comparison 1 Supplement vs control, Outcome 16 Length at 6 wk post‐term (cm).
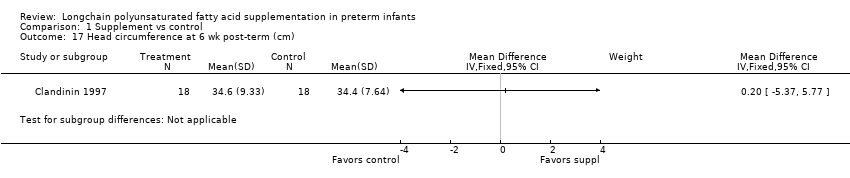
Comparison 1 Supplement vs control, Outcome 17 Head circumference at 6 wk post‐term (cm).
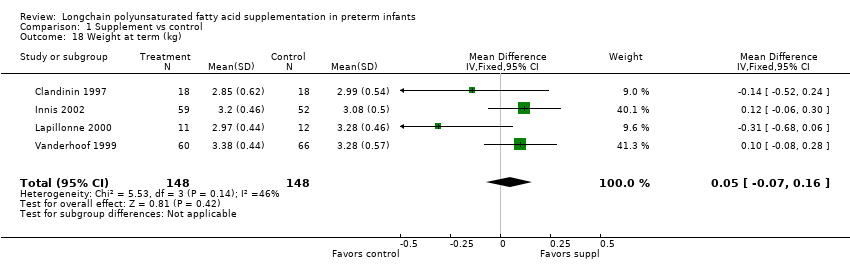
Comparison 1 Supplement vs control, Outcome 18 Weight at term (kg).
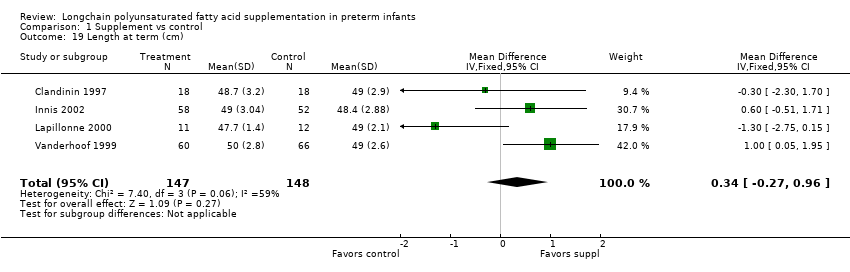
Comparison 1 Supplement vs control, Outcome 19 Length at term (cm).

Comparison 1 Supplement vs control, Outcome 20 Head circ at term (cm).

Comparison 1 Supplement vs control, Outcome 21 Weight at 2 months post‐term (kg).

Comparison 1 Supplement vs control, Outcome 22 Length at 2 months post‐term (cm).

Comparison 1 Supplement vs control, Outcome 23 Head circumference at 2 months post‐term (cm).
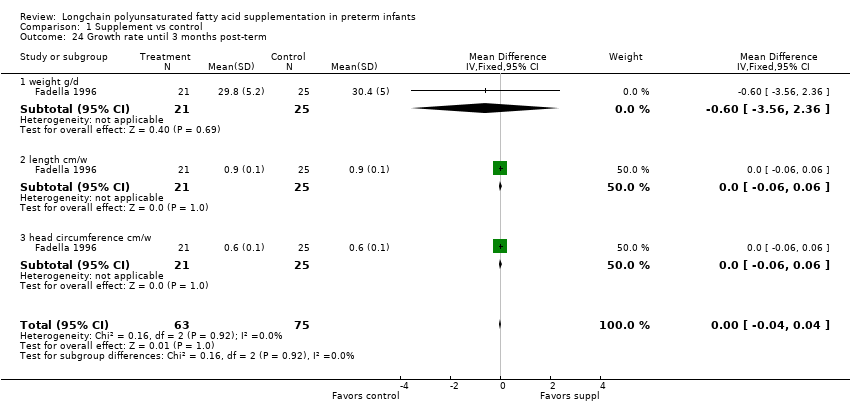
Comparison 1 Supplement vs control, Outcome 24 Growth rate until 3 months post‐term.

Comparison 1 Supplement vs control, Outcome 25 Weight at 4 months post‐term (kg).
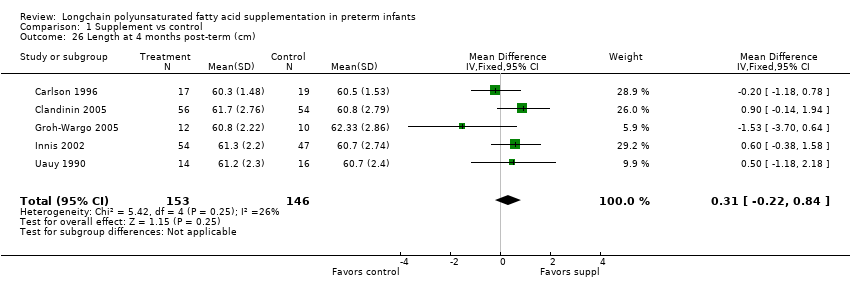
Comparison 1 Supplement vs control, Outcome 26 Length at 4 months post‐term (cm).

Comparison 1 Supplement vs control, Outcome 27 Head circumference at 4 months post‐term (cm).

Comparison 1 Supplement vs control, Outcome 28 Weight at 12 months post‐term (kg).
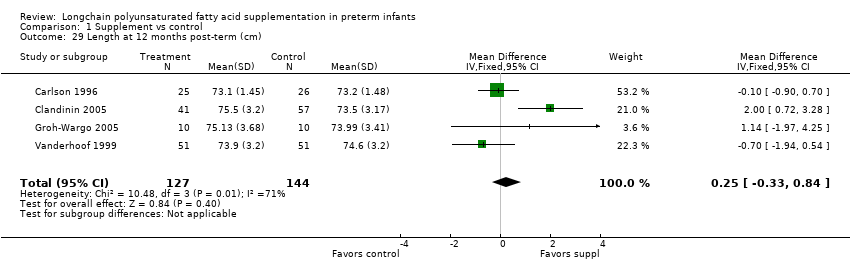
Comparison 1 Supplement vs control, Outcome 29 Length at 12 months post‐term (cm).

Comparison 1 Supplement vs control, Outcome 30 Head circumference at 12 months post‐term (cm).

Comparison 1 Supplement vs control, Outcome 31 Normalised weight at 12 months post‐term.

Comparison 1 Supplement vs control, Outcome 32 Normalised length at 12 months post‐term.

Comparison 1 Supplement vs control, Outcome 33 Normalised head circumference at 12 months post‐term.

Comparison 1 Supplement vs control, Outcome 34 Lipid peroxidation (TBARS ‐azide/+azide x 100%), 4 months post‐term.

Comparison 1 Supplement vs control, Outcome 35 RBC fragility (hemolysis with 8% to 10% H2O2) , 4 months post‐term.

Comparison 1 Supplement vs control, Outcome 36 Infant bleeding time 4 months post‐term (ped device, min).

Comparison 1 Supplement vs control, Outcome 37 Bayley MDI at 18 months post‐term.

Comparison 1 Supplement vs control, Outcome 38 Bayley PDI at 18 months post‐term.

Comparison 1 Supplement vs control, Outcome 39 KPS Developmental Screening Inventory at 9 months post‐term (overall quotient).

Comparison 1 Supplement vs control, Outcome 40 Weight at 9 months post‐term.

Comparison 1 Supplement vs control, Outcome 41 Length at 9 months post‐term.

Comparison 1 Supplement vs control, Outcome 42 Head circumference at 9 months post‐term.

Comparison 1 Supplement vs control, Outcome 43 Normailsed weight at 9 months post‐term.
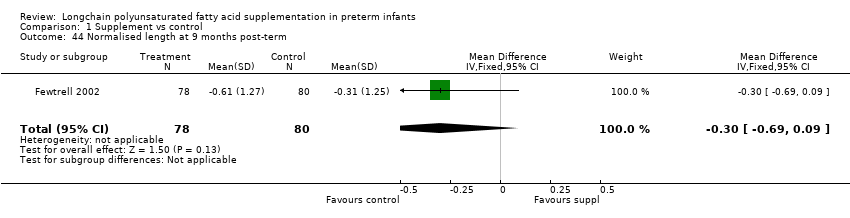
Comparison 1 Supplement vs control, Outcome 44 Normalised length at 9 months post‐term.

Comparison 1 Supplement vs control, Outcome 45 Normalised head circumference at 9 months post‐term.

Comparison 1 Supplement vs control, Outcome 46 Weight at 18 months post‐term.

Comparison 1 Supplement vs control, Outcome 47 Length at 18 months post‐term.

Comparison 1 Supplement vs control, Outcome 48 Head circumference at 18 months post‐term.

Comparison 1 Supplement vs control, Outcome 49 Normalised weight at 18 months post‐term.
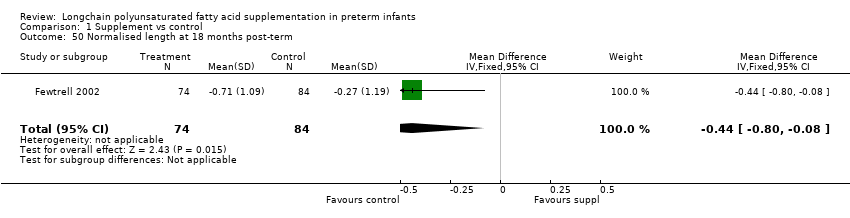
Comparison 1 Supplement vs control, Outcome 50 Normalised length at 18 months post‐term.

Comparison 1 Supplement vs control, Outcome 51 Normalised head circumference at 18 months post‐term.
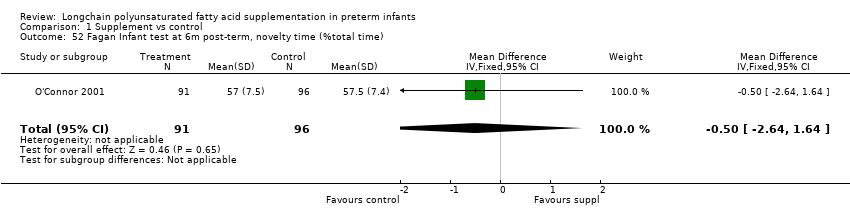
Comparison 1 Supplement vs control, Outcome 52 Fagan Infant test at 6m post‐term, novelty time (%total time).
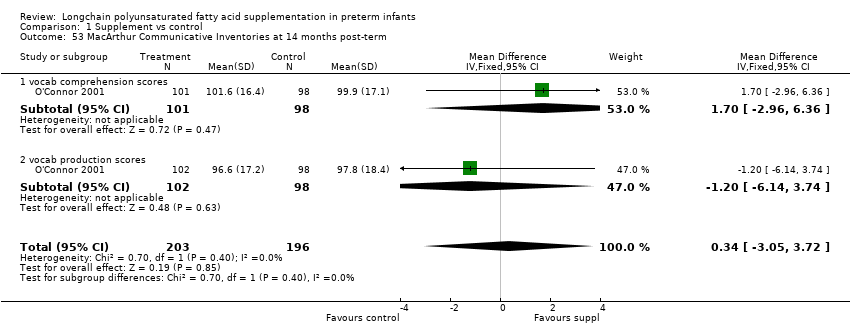
Comparison 1 Supplement vs control, Outcome 53 MacArthur Communicative Inventories at 14 months post‐term.

Comparison 1 Supplement vs control, Outcome 54 Bayley MDI at 24 months post‐term.
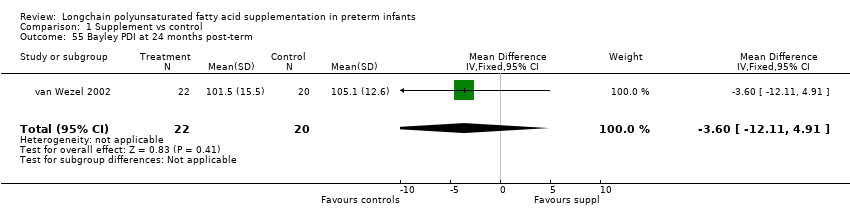
Comparison 1 Supplement vs control, Outcome 55 Bayley PDI at 24 months post‐term.

Comparison 1 Supplement vs control, Outcome 56 Weight at 10 years.
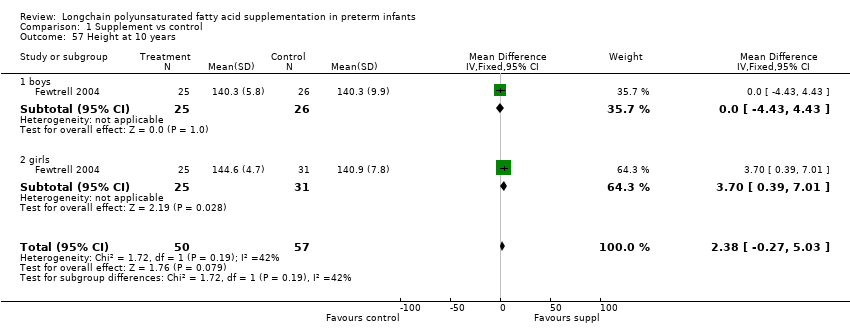
Comparison 1 Supplement vs control, Outcome 57 Height at 10 years.
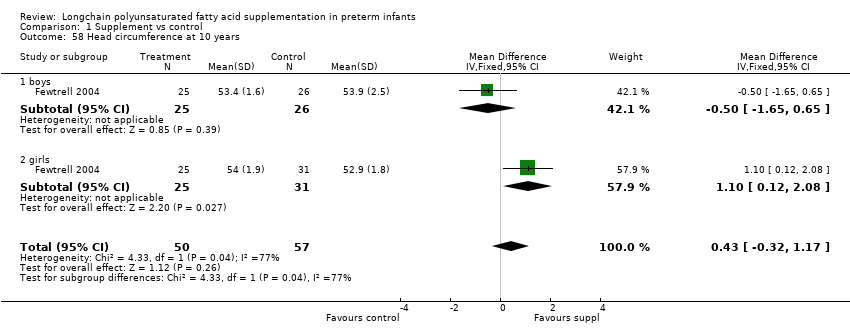
Comparison 1 Supplement vs control, Outcome 58 Head circumference at 10 years.
| LCPUFA supplemented formula compared with standard formula for clinical outcomes (visual function, neurodevelopment and physical growth) | ||||||
| Patient or population: Preterm infants on enteral feed Settings: Neonatal Intensive Care Units Intervention: LCPUFA supplemented formula Comparison: Standard Formula | ||||||
| Outcomes | Illustrative comparative risks* (95% CI) | Relative effect | No of Participants | Quality of the evidence | Comments | |
| Assumed risk | Corresponding risk | |||||
| Standard milk formula | LCPUFA supplemented milk formula | |||||
| Visual acuity at 12 months post‐term (log/cycles/degree) | Data could not be pooled | Data could not be pooled | NA | 82 | ⊕⊕⊝⊝ | Downgraded 2 levels due to very small sample, unclear random sequence generation in one of the RCTs. Meta‐analysis could not be performed. |
| Bayley MDI at 12 months post‐term | The mean MDI ranged across control groups from | The mean MDI ranged across the intervention groups from 92 to 110.1 | MD: 0.96 (95% CI: −1.42 to 3.34) | 364 | ⊕⊕⊝⊝ | Downgraded 2 levels. Reasons: small sample, unclear allocation concealment and random sequence generation in 2 of the RCTs, and very small effect size (MD) and high statistical heterogeneity (I² = 71%) |
| Bayley PDI at 12 months post‐term | The mean PDI ranged across control groups from 86.3 to 102.1 | The mean PDI ranged across the intervention groups from 82.2 to 98 | MD: 0.23 (95% CI: ‐2.77 to 3.22) | 353 (4 RCTs) | ⊕⊕⊝⊝ | Downgraded 2 levels. Reasons: small sample, unclear risk of allocation concealment in 2 of the RCTs. Very small effect size (MD) and high statistical heterogeneity (I² = 81%). |
| Weight at 12 months post‐term (kg) | The mean weight ranged across control groups from 8.85 kg to 9.62 kg | The mean weight ranged across the intervention groups from 9.02 kg to 9.36 kg | MD: −0.10 (95% CI: −0.31 to 0.12) | 271 (4 RCTs) | ⊕⊕⊝⊝ | Downgraded 2 levels. Reasons: small sample, high or unclear risk of attrition bias in 3 studies and unclear method of randomisation in 1 study. Very small effect size (MD) and high statistical heterogeneity (I² = 65%) |
| Length at 12 months post‐term (cm) | The mean length ranged across control groups from 73.2 cm to 74.6 cm | The mean length ranged across the intervention groups from 73.1 cm to 75.5 cm | MD: 0.25 (CI: −0.33 to 0.84) | 271 (4 RCTs) | ⊕⊕⊝⊝ | Downgraded 2 levels. Reasons: small sample, high or unclear risk of attrition bias in 3 included studies and unclear method of randomisation in 1 study. Very small effect size (MD) and high statistical heterogeneity (I² = 71%) |
| Head circumference at 12 months post‐term (cm) | The mean head circumference ranged across control group from 45.8 cm to 46.43 cm | The mean head circumference ranged across the intervention groups from 45.9 cm to 46.31 cm | MD: −0.15 (CI: −0.53 to 0.23) | 271 (4 RCTs) | ⊕⊕⊝⊝ | Downgraded 2 levels. Reasons: small sample, high or unclear risk of attrition bias in 3 included studies and unclear method of randomisation in one study. Very small effect size (MD). |
| *The basis for the assumed risk (e.g. the median control group risk across studies) is provided in footnotes. The corresponding risk (and its 95% confidence interval) is based on the assumed risk in the comparison group and the relative effect of the intervention (and its 95% CI). | ||||||
| GRADE Working Group grades of evidence | ||||||
| Outcome or subgroup title | No. of studies | No. of participants | Statistical method | Effect size |
| 1 Visual acuity (log cycles/degree) at term Show forest plot | 1 | Mean Difference (IV, Fixed, 95% CI) | Totals not selected | |
| 1.1 no BPD | 1 | Mean Difference (IV, Fixed, 95% CI) | 0.0 [0.0, 0.0] | |
| 1.2 BPD | 1 | Mean Difference (IV, Fixed, 95% CI) | 0.0 [0.0, 0.0] | |
| 2 Visual acuity (log cycles/degree) at 2 months post‐term Show forest plot | 3 | Mean Difference (IV, Fixed, 95% CI) | Totals not selected | |
| 2.1 no BPD | 3 | Mean Difference (IV, Fixed, 95% CI) | 0.0 [0.0, 0.0] | |
| 2.2 BPD | 1 | Mean Difference (IV, Fixed, 95% CI) | 0.0 [0.0, 0.0] | |
| 3 Visual acuity (log cycles/ degree) at 4 months post‐term Show forest plot | 3 | Mean Difference (IV, Fixed, 95% CI) | Totals not selected | |
| 3.1 no BPD | 3 | Mean Difference (IV, Fixed, 95% CI) | 0.0 [0.0, 0.0] | |
| 3.2 BPD | 1 | Mean Difference (IV, Fixed, 95% CI) | 0.0 [0.0, 0.0] | |
| 4 Visual acuity (log cycles /degree) at 6 months post‐term Show forest plot | 2 | Mean Difference (IV, Fixed, 95% CI) | Totals not selected | |
| 4.1 no BPD | 2 | Mean Difference (IV, Fixed, 95% CI) | 0.0 [0.0, 0.0] | |
| 4.2 BPD | 1 | Mean Difference (IV, Fixed, 95% CI) | 0.0 [0.0, 0.0] | |
| 5 Visual acuity (log cycles/degree) at 9 months post‐term Show forest plot | 1 | Mean Difference (IV, Fixed, 95% CI) | Totals not selected | |
| 5.1 no BPD | 1 | Mean Difference (IV, Fixed, 95% CI) | 0.0 [0.0, 0.0] | |
| 5.2 BPD | 1 | Mean Difference (IV, Fixed, 95% CI) | 0.0 [0.0, 0.0] | |
| 6 Visual acuity (log cycles/degree) at 12 months post‐term Show forest plot | 2 | Mean Difference (IV, Fixed, 95% CI) | Totals not selected | |
| 6.1 no BPD | 2 | Mean Difference (IV, Fixed, 95% CI) | 0.0 [0.0, 0.0] | |
| 6.2 BPD | 1 | Mean Difference (IV, Fixed, 95% CI) | 0.0 [0.0, 0.0] | |
| 7 Rod ERG at 36 wk PCA Show forest plot | 1 | Mean Difference (IV, Fixed, 95% CI) | Totals not selected | |
| 7.1 log threshold (scot td‐sec) | 1 | Mean Difference (IV, Fixed, 95% CI) | 0.0 [0.0, 0.0] | |
| 7.2 log Vmax (uV) | 1 | Mean Difference (IV, Fixed, 95% CI) | 0.0 [0.0, 0.0] | |
| 8 ERG at 3 months post‐term, amplitude (uV) Show forest plot | 1 | Mean Difference (IV, Fixed, 95% CI) | Totals not selected | |
| 9 Rod ERG at 4 months post‐term Show forest plot | 1 | Mean Difference (IV, Fixed, 95% CI) | Totals not selected | |
| 9.1 log threshold (scot td‐sec) | 1 | Mean Difference (IV, Fixed, 95% CI) | 0.0 [0.0, 0.0] | |
| 9.2 log Vmax (uV) | 1 | Mean Difference (IV, Fixed, 95% CI) | 0.0 [0.0, 0.0] | |
| 10 VEP at 3 months post‐term Show forest plot | 1 | Mean Difference (IV, Fixed, 95% CI) | Totals not selected | |
| 10.1 N4 latency (millisec) | 1 | Mean Difference (IV, Fixed, 95% CI) | 0.0 [0.0, 0.0] | |
| 10.2 P4 latency (millisec) | 1 | Mean Difference (IV, Fixed, 95% CI) | 0.0 [0.0, 0.0] | |
| 11 Fagan infant test at 12 months post‐term Show forest plot | 2 | Mean Difference (IV, Fixed, 95% CI) | Subtotals only | |
| 11.1 novelty time (% total time) | 2 | 84 | Mean Difference (IV, Fixed, 95% CI) | ‐4.11 [‐7.47, ‐0.76] |
| 11.2 total looks (n) | 2 | 84 | Mean Difference (IV, Fixed, 95% CI) | 5.52 [2.16, 8.87] |
| 11.3 time/look (sec) | 2 | 84 | Mean Difference (IV, Fixed, 95% CI) | ‐0.09 [‐0.21, 0.02] |
| 12 Fagan infant test at 9 months post‐term (% total time) Show forest plot | 2 | Mean Difference (IV, Fixed, 95% CI) | Subtotals only | |
| 12.1 novelty time (%) | 2 | 232 | Mean Difference (IV, Fixed, 95% CI) | 0.42 [‐1.40, 2.24] |
| 12.2 total looks (n) | 1 | 51 | Mean Difference (IV, Fixed, 95% CI) | 7.20 [2.49, 11.91] |
| 12.3 time/look (sec) | 1 | 51 | Mean Difference (IV, Fixed, 95% CI) | ‐0.13 [‐0.29, 0.03] |
| 13 Bayley MDI at 12 months post‐term Show forest plot | 4 | 364 | Mean Difference (IV, Fixed, 95% CI) | 0.96 [‐1.42, 3.34] |
| 14 Bayley PDI at 12 months post‐term Show forest plot | 4 | 353 | Mean Difference (IV, Fixed, 95% CI) | 0.23 [‐2.77, 3.22] |
| 15 Weight at 6 wk post‐term (kg) Show forest plot | 1 | Mean Difference (IV, Fixed, 95% CI) | Subtotals only | |
| 16 Length at 6 wk post‐term (cm) Show forest plot | 1 | Mean Difference (IV, Fixed, 95% CI) | Subtotals only | |
| 17 Head circumference at 6 wk post‐term (cm) Show forest plot | 1 | Mean Difference (IV, Fixed, 95% CI) | Subtotals only | |
| 18 Weight at term (kg) Show forest plot | 4 | 296 | Mean Difference (IV, Fixed, 95% CI) | 0.05 [‐0.07, 0.16] |
| 19 Length at term (cm) Show forest plot | 4 | 295 | Mean Difference (IV, Fixed, 95% CI) | 0.34 [‐0.27, 0.96] |
| 20 Head circ at term (cm) Show forest plot | 3 | 185 | Mean Difference (IV, Fixed, 95% CI) | 0.18 [‐0.26, 0.62] |
| 21 Weight at 2 months post‐term (kg) Show forest plot | 5 | 485 | Mean Difference (IV, Fixed, 95% CI) | 0.21 [0.08, 0.33] |
| 22 Length at 2 months post‐term (cm) Show forest plot | 4 | 297 | Mean Difference (IV, Fixed, 95% CI) | 0.47 [0.00, 0.94] |
| 23 Head circumference at 2 months post‐term (cm) Show forest plot | 3 | 187 | Mean Difference (IV, Fixed, 95% CI) | 0.03 [‐0.33, 0.38] |
| 24 Growth rate until 3 months post‐term Show forest plot | 1 | 138 | Mean Difference (IV, Fixed, 95% CI) | ‐0.00 [‐0.04, 0.04] |
| 24.1 weight g/d | 1 | 46 | Mean Difference (IV, Fixed, 95% CI) | ‐0.60 [‐3.56, 2.36] |
| 24.2 length cm/w | 1 | 46 | Mean Difference (IV, Fixed, 95% CI) | 0.0 [‐0.06, 0.06] |
| 24.3 head circumference cm/w | 1 | 46 | Mean Difference (IV, Fixed, 95% CI) | 0.0 [‐0.06, 0.06] |
| 25 Weight at 4 months post‐term (kg) Show forest plot | 6 | 489 | Mean Difference (IV, Fixed, 95% CI) | 0.14 [‐0.01, 0.29] |
| 26 Length at 4 months post‐term (cm) Show forest plot | 5 | 299 | Mean Difference (IV, Fixed, 95% CI) | 0.31 [‐0.22, 0.84] |
| 27 Head circumference at 4 months post‐term (cm) Show forest plot | 4 | 198 | Mean Difference (IV, Fixed, 95% CI) | ‐0.09 [‐0.48, 0.30] |
| 28 Weight at 12 months post‐term (kg) Show forest plot | 4 | 271 | Mean Difference (IV, Fixed, 95% CI) | ‐0.10 [‐0.31, 0.12] |
| 29 Length at 12 months post‐term (cm) Show forest plot | 4 | 271 | Mean Difference (IV, Fixed, 95% CI) | 0.25 [‐0.33, 0.84] |
| 30 Head circumference at 12 months post‐term (cm) Show forest plot | 4 | 271 | Mean Difference (IV, Fixed, 95% CI) | ‐0.15 [‐0.53, 0.23] |
| 31 Normalised weight at 12 months post‐term Show forest plot | 2 | 116 | Mean Difference (IV, Fixed, 95% CI) | ‐0.33 [‐0.56, ‐0.09] |
| 32 Normalised length at 12 months post‐term Show forest plot | 2 | 116 | Mean Difference (IV, Fixed, 95% CI) | 0.03 [‐0.16, 0.22] |
| 33 Normalised head circumference at 12 months post‐term Show forest plot | 2 | 116 | Mean Difference (IV, Fixed, 95% CI) | ‐0.14 [‐0.38, 0.10] |
| 34 Lipid peroxidation (TBARS ‐azide/+azide x 100%), 4 months post‐term Show forest plot | 1 | Mean Difference (IV, Fixed, 95% CI) | Totals not selected | |
| 35 RBC fragility (hemolysis with 8% to 10% H2O2) , 4 months post‐term Show forest plot | 1 | Mean Difference (IV, Fixed, 95% CI) | Totals not selected | |
| 36 Infant bleeding time 4 months post‐term (ped device, min) Show forest plot | 1 | Mean Difference (IV, Fixed, 95% CI) | Totals not selected | |
| 37 Bayley MDI at 18 months post‐term Show forest plot | 3 | 494 | Mean Difference (IV, Fixed, 95% CI) | 2.40 [‐0.33, 5.12] |
| 38 Bayley PDI at 18 months post‐term Show forest plot | 3 | 496 | Mean Difference (IV, Fixed, 95% CI) | 0.74 [‐1.90, 3.37] |
| 39 KPS Developmental Screening Inventory at 9 months post‐term (overall quotient) Show forest plot | 1 | 158 | Mean Difference (IV, Fixed, 95% CI) | 1.50 [‐1.70, 4.70] |
| 40 Weight at 9 months post‐term Show forest plot | 2 | 374 | Mean Difference (IV, Fixed, 95% CI) | ‐0.01 [‐0.22, 0.21] |
| 41 Length at 9 months post‐term Show forest plot | 2 | 374 | Mean Difference (IV, Fixed, 95% CI) | 0.02 [‐0.58, 0.61] |
| 42 Head circumference at 9 months post‐term Show forest plot | 2 | 374 | Mean Difference (IV, Fixed, 95% CI) | ‐0.03 [‐0.37, 0.30] |
| 43 Normailsed weight at 9 months post‐term Show forest plot | 1 | 158 | Mean Difference (IV, Fixed, 95% CI) | ‐0.35 [‐0.72, 0.02] |
| 44 Normalised length at 9 months post‐term Show forest plot | 1 | 158 | Mean Difference (IV, Fixed, 95% CI) | ‐0.3 [‐0.69, 0.09] |
| 45 Normalised head circumference at 9 months post‐term Show forest plot | 1 | 158 | Mean Difference (IV, Fixed, 95% CI) | ‐0.10 [‐0.51, 0.31] |
| 46 Weight at 18 months post‐term Show forest plot | 2 | 396 | Mean Difference (IV, Fixed, 95% CI) | ‐0.14 [‐0.39, 0.10] |
| 47 Length at 18 months post‐term Show forest plot | 2 | 396 | Mean Difference (IV, Fixed, 95% CI) | ‐0.28 [‐0.91, 0.35] |
| 48 Head circumference at 18 months post‐term Show forest plot | 2 | 396 | Mean Difference (IV, Fixed, 95% CI) | ‐0.18 [‐0.53, 0.18] |
| 49 Normalised weight at 18 months post‐term Show forest plot | 1 | 158 | Mean Difference (IV, Fixed, 95% CI) | ‐0.33 [‐0.68, 0.02] |
| 50 Normalised length at 18 months post‐term Show forest plot | 1 | 158 | Mean Difference (IV, Fixed, 95% CI) | ‐0.44 [‐0.80, ‐0.08] |
| 51 Normalised head circumference at 18 months post‐term Show forest plot | 1 | 158 | Mean Difference (IV, Fixed, 95% CI) | ‐0.10 [‐0.52, 0.32] |
| 52 Fagan Infant test at 6m post‐term, novelty time (%total time) Show forest plot | 1 | 187 | Mean Difference (IV, Fixed, 95% CI) | ‐0.5 [‐2.64, 1.64] |
| 53 MacArthur Communicative Inventories at 14 months post‐term Show forest plot | 1 | 399 | Mean Difference (IV, Fixed, 95% CI) | 0.34 [‐3.05, 3.72] |
| 53.1 vocab comprehension scores | 1 | 199 | Mean Difference (IV, Fixed, 95% CI) | 1.70 [‐2.96, 6.36] |
| 53.2 vocab production scores | 1 | 200 | Mean Difference (IV, Fixed, 95% CI) | ‐1.20 [‐6.14, 3.74] |
| 54 Bayley MDI at 24 months post‐term Show forest plot | 1 | 42 | Mean Difference (IV, Fixed, 95% CI) | 4.10 [‐8.06, 16.26] |
| 55 Bayley PDI at 24 months post‐term Show forest plot | 1 | 42 | Mean Difference (IV, Fixed, 95% CI) | ‐3.60 [‐12.11, 4.91] |
| 56 Weight at 10 years Show forest plot | 1 | 107 | Mean Difference (IV, Fixed, 95% CI) | 2.30 [‐1.45, 6.06] |
| 56.1 boys | 1 | 51 | Mean Difference (IV, Fixed, 95% CI) | ‐1.43 [‐7.08, 4.22] |
| 56.2 girls | 1 | 56 | Mean Difference (IV, Fixed, 95% CI) | 5.26 [0.23, 10.29] |
| 57 Height at 10 years Show forest plot | 1 | 107 | Mean Difference (IV, Fixed, 95% CI) | 2.38 [‐0.27, 5.03] |
| 57.1 boys | 1 | 51 | Mean Difference (IV, Fixed, 95% CI) | 0.0 [‐4.43, 4.43] |
| 57.2 girls | 1 | 56 | Mean Difference (IV, Fixed, 95% CI) | 3.70 [0.39, 7.01] |
| 58 Head circumference at 10 years Show forest plot | 1 | 107 | Mean Difference (IV, Fixed, 95% CI) | 0.43 [‐0.32, 1.17] |
| 58.1 boys | 1 | 51 | Mean Difference (IV, Fixed, 95% CI) | ‐0.5 [‐1.65, 0.65] |
| 58.2 girls | 1 | 56 | Mean Difference (IV, Fixed, 95% CI) | 1.10 [0.12, 2.08] |