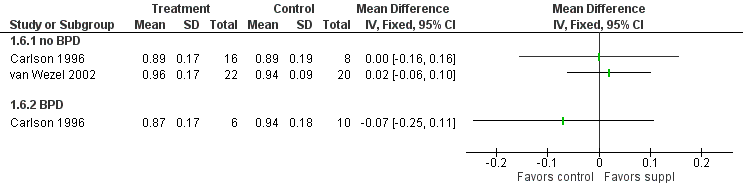
| 1 Visual acuity (log cycles/degree) at term Show forest plot | 1 | | Mean Difference (IV, Fixed, 95% CI) | Totals not selected |
|
| 1.1 no BPD | 1 | | Mean Difference (IV, Fixed, 95% CI) | 0.0 [0.0, 0.0] |
| 1.2 BPD | 1 | | Mean Difference (IV, Fixed, 95% CI) | 0.0 [0.0, 0.0] |
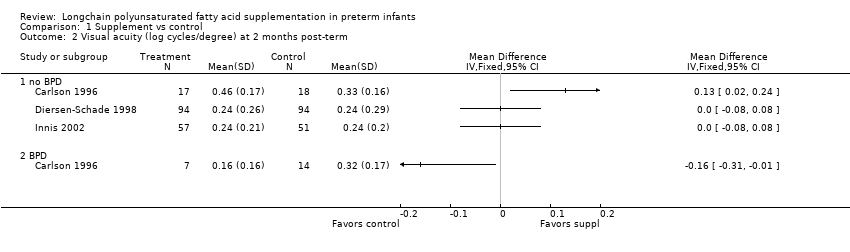
| 2 Visual acuity (log cycles/degree) at 2 months post‐term Show forest plot | 3 | | Mean Difference (IV, Fixed, 95% CI) | Totals not selected |
|
| 2.1 no BPD | 3 | | Mean Difference (IV, Fixed, 95% CI) | 0.0 [0.0, 0.0] |
| 2.2 BPD | 1 | | Mean Difference (IV, Fixed, 95% CI) | 0.0 [0.0, 0.0] |
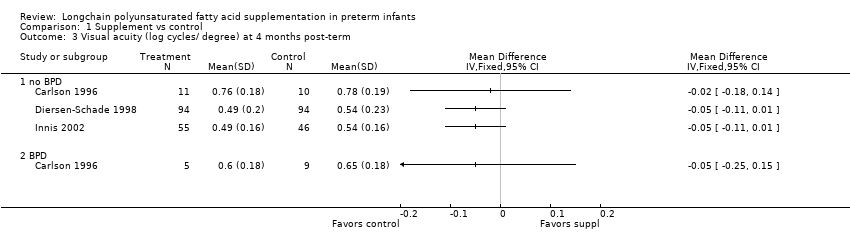
| 3 Visual acuity (log cycles/ degree) at 4 months post‐term Show forest plot | 3 | | Mean Difference (IV, Fixed, 95% CI) | Totals not selected |
|
| 3.1 no BPD | 3 | | Mean Difference (IV, Fixed, 95% CI) | 0.0 [0.0, 0.0] |
| 3.2 BPD | 1 | | Mean Difference (IV, Fixed, 95% CI) | 0.0 [0.0, 0.0] |
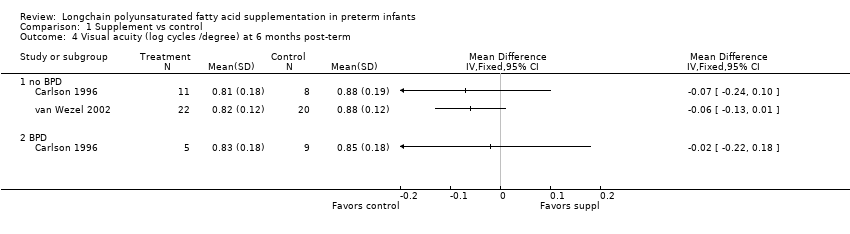
| 4 Visual acuity (log cycles /degree) at 6 months post‐term Show forest plot | 2 | | Mean Difference (IV, Fixed, 95% CI) | Totals not selected |
|
| 4.1 no BPD | 2 | | Mean Difference (IV, Fixed, 95% CI) | 0.0 [0.0, 0.0] |
| 4.2 BPD | 1 | | Mean Difference (IV, Fixed, 95% CI) | 0.0 [0.0, 0.0] |
| 5 Visual acuity (log cycles/degree) at 9 months post‐term Show forest plot | 1 | | Mean Difference (IV, Fixed, 95% CI) | Totals not selected |
|
| 5.1 no BPD | 1 | | Mean Difference (IV, Fixed, 95% CI) | 0.0 [0.0, 0.0] |
| 5.2 BPD | 1 | | Mean Difference (IV, Fixed, 95% CI) | 0.0 [0.0, 0.0] |
| 6 Visual acuity (log cycles/degree) at 12 months post‐term Show forest plot | 2 | | Mean Difference (IV, Fixed, 95% CI) | Totals not selected |
|
| 6.1 no BPD | 2 | | Mean Difference (IV, Fixed, 95% CI) | 0.0 [0.0, 0.0] |
| 6.2 BPD | 1 | | Mean Difference (IV, Fixed, 95% CI) | 0.0 [0.0, 0.0] |
| 7 Rod ERG at 36 wk PCA Show forest plot | 1 | | Mean Difference (IV, Fixed, 95% CI) | Totals not selected |
|
| 7.1 log threshold (scot td‐sec) | 1 | | Mean Difference (IV, Fixed, 95% CI) | 0.0 [0.0, 0.0] |
| 7.2 log Vmax (uV) | 1 | | Mean Difference (IV, Fixed, 95% CI) | 0.0 [0.0, 0.0] |
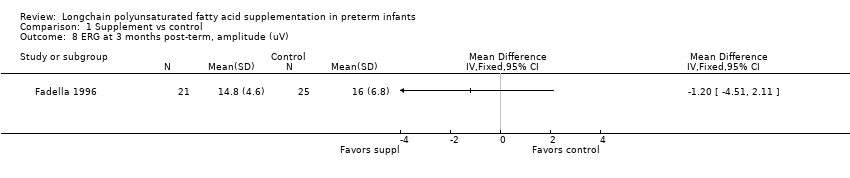
| 8 ERG at 3 months post‐term, amplitude (uV) Show forest plot | 1 | | Mean Difference (IV, Fixed, 95% CI) | Totals not selected |
|
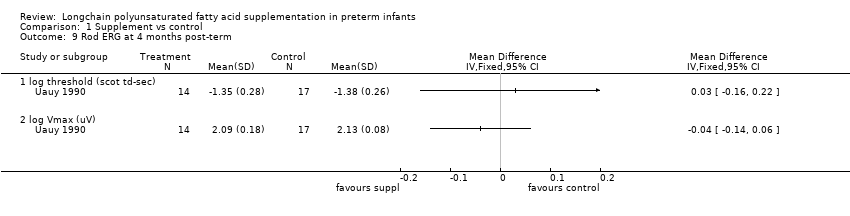
| 9 Rod ERG at 4 months post‐term Show forest plot | 1 | | Mean Difference (IV, Fixed, 95% CI) | Totals not selected |
|
| 9.1 log threshold (scot td‐sec) | 1 | | Mean Difference (IV, Fixed, 95% CI) | 0.0 [0.0, 0.0] |
| 9.2 log Vmax (uV) | 1 | | Mean Difference (IV, Fixed, 95% CI) | 0.0 [0.0, 0.0] |
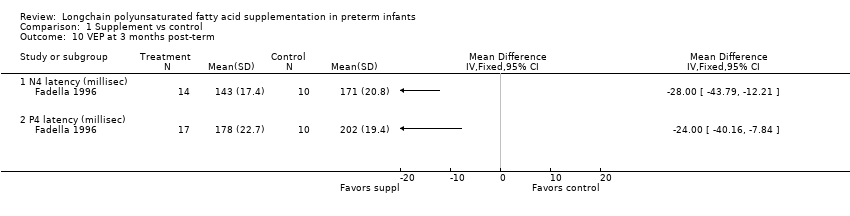
| 10 VEP at 3 months post‐term Show forest plot | 1 | | Mean Difference (IV, Fixed, 95% CI) | Totals not selected |
|
| 10.1 N4 latency (millisec) | 1 | | Mean Difference (IV, Fixed, 95% CI) | 0.0 [0.0, 0.0] |
| 10.2 P4 latency (millisec) | 1 | | Mean Difference (IV, Fixed, 95% CI) | 0.0 [0.0, 0.0] |
| 11 Fagan infant test at 12 months post‐term Show forest plot | 2 | | Mean Difference (IV, Fixed, 95% CI) | Subtotals only |
|
| 11.1 novelty time (% total time) | 2 | 84 | Mean Difference (IV, Fixed, 95% CI) | ‐4.11 [‐7.47, ‐0.76] |
| 11.2 total looks (n) | 2 | 84 | Mean Difference (IV, Fixed, 95% CI) | 5.52 [2.16, 8.87] |
| 11.3 time/look (sec) | 2 | 84 | Mean Difference (IV, Fixed, 95% CI) | ‐0.09 [‐0.21, 0.02] |
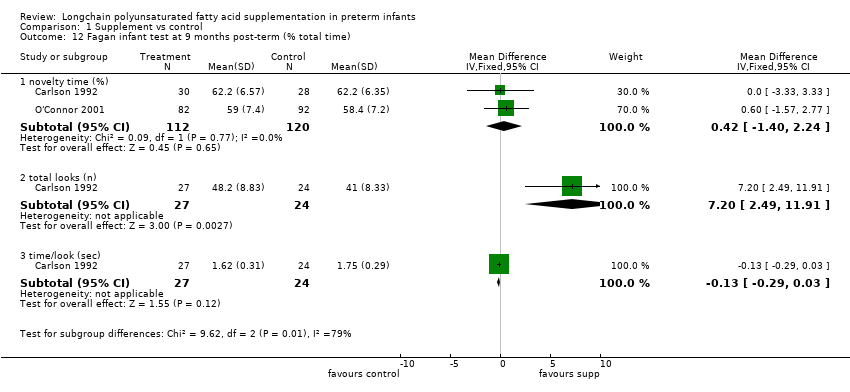
| 12 Fagan infant test at 9 months post‐term (% total time) Show forest plot | 2 | | Mean Difference (IV, Fixed, 95% CI) | Subtotals only |
|
| 12.1 novelty time (%) | 2 | 232 | Mean Difference (IV, Fixed, 95% CI) | 0.42 [‐1.40, 2.24] |
| 12.2 total looks (n) | 1 | 51 | Mean Difference (IV, Fixed, 95% CI) | 7.20 [2.49, 11.91] |
| 12.3 time/look (sec) | 1 | 51 | Mean Difference (IV, Fixed, 95% CI) | ‐0.13 [‐0.29, 0.03] |
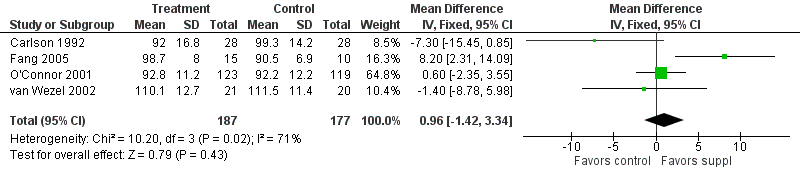
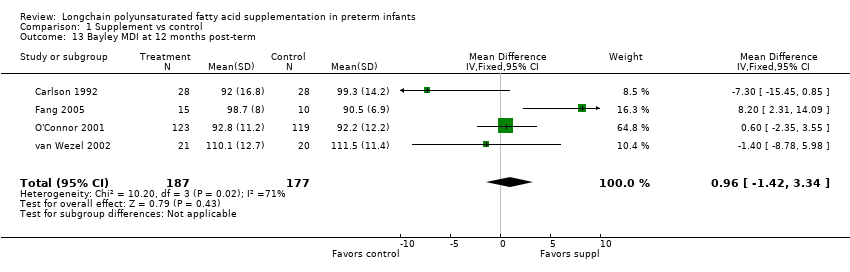
| 13 Bayley MDI at 12 months post‐term Show forest plot | 4 | 364 | Mean Difference (IV, Fixed, 95% CI) | 0.96 [‐1.42, 3.34] |
|
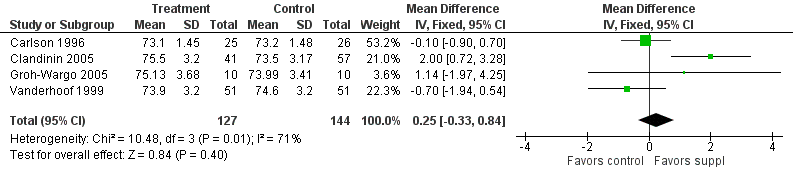
| 14 Bayley PDI at 12 months post‐term Show forest plot | 4 | 353 | Mean Difference (IV, Fixed, 95% CI) | 0.23 [‐2.77, 3.22] |
|
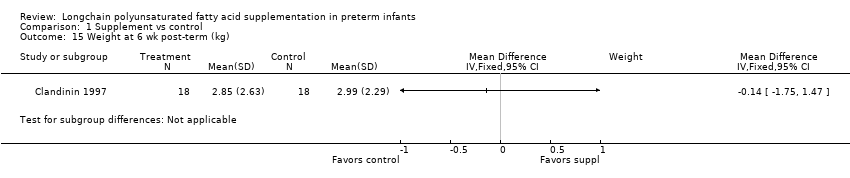
| 15 Weight at 6 wk post‐term (kg) Show forest plot | 1 | | Mean Difference (IV, Fixed, 95% CI) | Subtotals only |
|
| 16 Length at 6 wk post‐term (cm) Show forest plot | 1 | | Mean Difference (IV, Fixed, 95% CI) | Subtotals only |
|
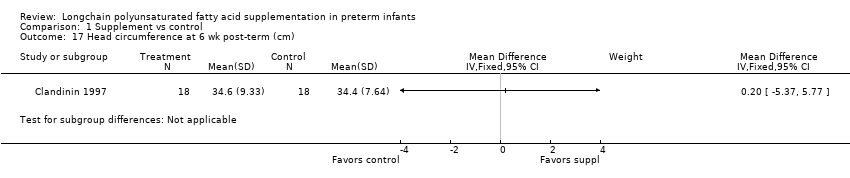
| 17 Head circumference at 6 wk post‐term (cm) Show forest plot | 1 | | Mean Difference (IV, Fixed, 95% CI) | Subtotals only |
|
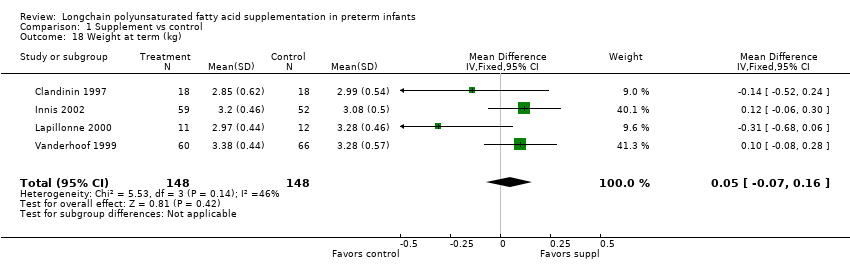
| 18 Weight at term (kg) Show forest plot | 4 | 296 | Mean Difference (IV, Fixed, 95% CI) | 0.05 [‐0.07, 0.16] |
|
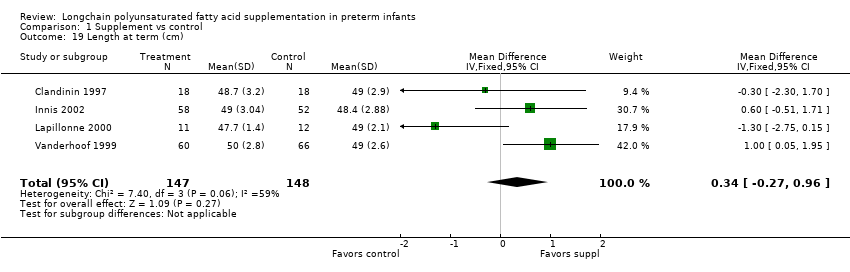
| 19 Length at term (cm) Show forest plot | 4 | 295 | Mean Difference (IV, Fixed, 95% CI) | 0.34 [‐0.27, 0.96] |
|
| 20 Head circ at term (cm) Show forest plot | 3 | 185 | Mean Difference (IV, Fixed, 95% CI) | 0.18 [‐0.26, 0.62] |
|
| 21 Weight at 2 months post‐term (kg) Show forest plot | 5 | 485 | Mean Difference (IV, Fixed, 95% CI) | 0.21 [0.08, 0.33] |
|
| 22 Length at 2 months post‐term (cm) Show forest plot | 4 | 297 | Mean Difference (IV, Fixed, 95% CI) | 0.47 [0.00, 0.94] |
|
| 23 Head circumference at 2 months post‐term (cm) Show forest plot | 3 | 187 | Mean Difference (IV, Fixed, 95% CI) | 0.03 [‐0.33, 0.38] |
|
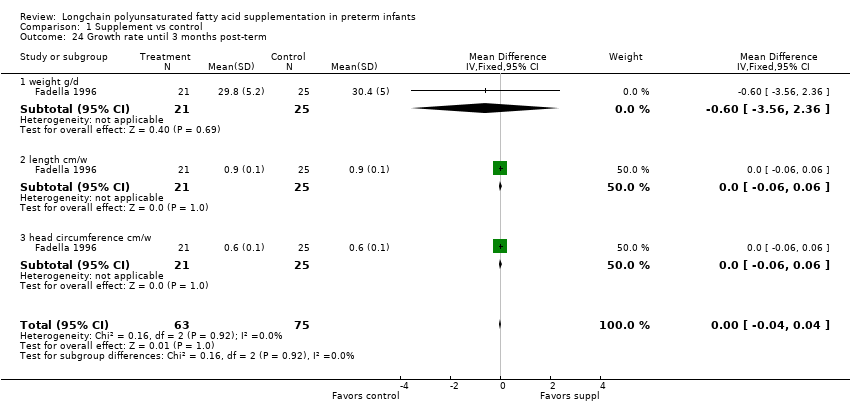
| 24 Growth rate until 3 months post‐term Show forest plot | 1 | 138 | Mean Difference (IV, Fixed, 95% CI) | ‐0.00 [‐0.04, 0.04] |
|
| 24.1 weight g/d | 1 | 46 | Mean Difference (IV, Fixed, 95% CI) | ‐0.60 [‐3.56, 2.36] |
| 24.2 length cm/w | 1 | 46 | Mean Difference (IV, Fixed, 95% CI) | 0.0 [‐0.06, 0.06] |
| 24.3 head circumference cm/w | 1 | 46 | Mean Difference (IV, Fixed, 95% CI) | 0.0 [‐0.06, 0.06] |
| 25 Weight at 4 months post‐term (kg) Show forest plot | 6 | 489 | Mean Difference (IV, Fixed, 95% CI) | 0.14 [‐0.01, 0.29] |
|
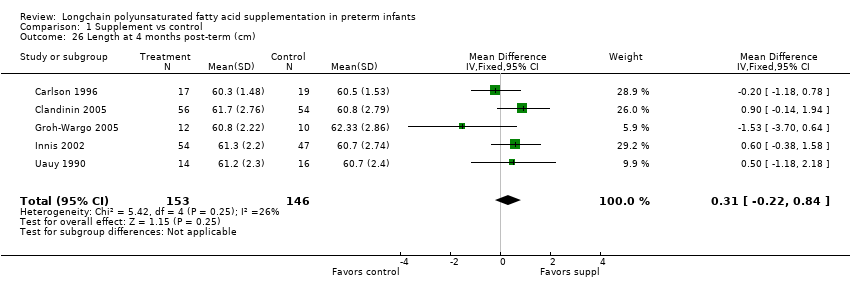
| 26 Length at 4 months post‐term (cm) Show forest plot | 5 | 299 | Mean Difference (IV, Fixed, 95% CI) | 0.31 [‐0.22, 0.84] |
|
| 27 Head circumference at 4 months post‐term (cm) Show forest plot | 4 | 198 | Mean Difference (IV, Fixed, 95% CI) | ‐0.09 [‐0.48, 0.30] |
|
| 28 Weight at 12 months post‐term (kg) Show forest plot | 4 | 271 | Mean Difference (IV, Fixed, 95% CI) | ‐0.10 [‐0.31, 0.12] |
|
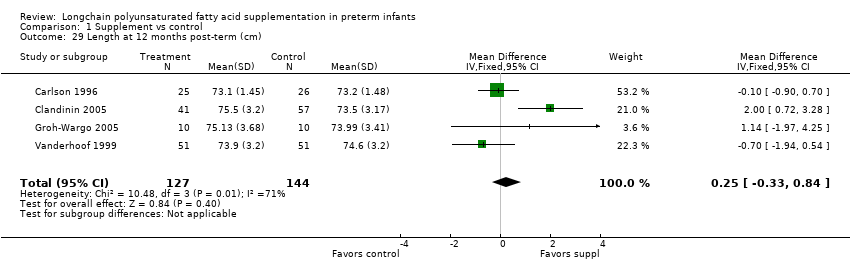
| 29 Length at 12 months post‐term (cm) Show forest plot | 4 | 271 | Mean Difference (IV, Fixed, 95% CI) | 0.25 [‐0.33, 0.84] |
|
| 30 Head circumference at 12 months post‐term (cm) Show forest plot | 4 | 271 | Mean Difference (IV, Fixed, 95% CI) | ‐0.15 [‐0.53, 0.23] |
|
| 31 Normalised weight at 12 months post‐term Show forest plot | 2 | 116 | Mean Difference (IV, Fixed, 95% CI) | ‐0.33 [‐0.56, ‐0.09] |
|
| 32 Normalised length at 12 months post‐term Show forest plot | 2 | 116 | Mean Difference (IV, Fixed, 95% CI) | 0.03 [‐0.16, 0.22] |
|
| 33 Normalised head circumference at 12 months post‐term Show forest plot | 2 | 116 | Mean Difference (IV, Fixed, 95% CI) | ‐0.14 [‐0.38, 0.10] |
|
| 34 Lipid peroxidation (TBARS ‐azide/+azide x 100%), 4 months post‐term Show forest plot | 1 | | Mean Difference (IV, Fixed, 95% CI) | Totals not selected |
|
| 35 RBC fragility (hemolysis with 8% to 10% H2O2) , 4 months post‐term Show forest plot | 1 | | Mean Difference (IV, Fixed, 95% CI) | Totals not selected |
|
| 36 Infant bleeding time 4 months post‐term (ped device, min) Show forest plot | 1 | | Mean Difference (IV, Fixed, 95% CI) | Totals not selected |
|
| 37 Bayley MDI at 18 months post‐term Show forest plot | 3 | 494 | Mean Difference (IV, Fixed, 95% CI) | 2.40 [‐0.33, 5.12] |
|
| 38 Bayley PDI at 18 months post‐term Show forest plot | 3 | 496 | Mean Difference (IV, Fixed, 95% CI) | 0.74 [‐1.90, 3.37] |
|
| 39 KPS Developmental Screening Inventory at 9 months post‐term (overall quotient) Show forest plot | 1 | 158 | Mean Difference (IV, Fixed, 95% CI) | 1.50 [‐1.70, 4.70] |
|
| 40 Weight at 9 months post‐term Show forest plot | 2 | 374 | Mean Difference (IV, Fixed, 95% CI) | ‐0.01 [‐0.22, 0.21] |
|
| 41 Length at 9 months post‐term Show forest plot | 2 | 374 | Mean Difference (IV, Fixed, 95% CI) | 0.02 [‐0.58, 0.61] |
|
| 42 Head circumference at 9 months post‐term Show forest plot | 2 | 374 | Mean Difference (IV, Fixed, 95% CI) | ‐0.03 [‐0.37, 0.30] |
|
| 43 Normailsed weight at 9 months post‐term Show forest plot | 1 | 158 | Mean Difference (IV, Fixed, 95% CI) | ‐0.35 [‐0.72, 0.02] |
|
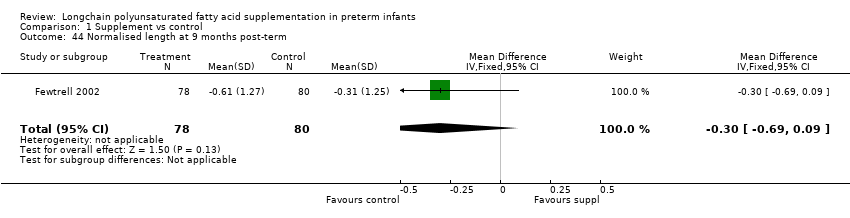
| 44 Normalised length at 9 months post‐term Show forest plot | 1 | 158 | Mean Difference (IV, Fixed, 95% CI) | ‐0.3 [‐0.69, 0.09] |
|
| 45 Normalised head circumference at 9 months post‐term Show forest plot | 1 | 158 | Mean Difference (IV, Fixed, 95% CI) | ‐0.10 [‐0.51, 0.31] |
|
| 46 Weight at 18 months post‐term Show forest plot | 2 | 396 | Mean Difference (IV, Fixed, 95% CI) | ‐0.14 [‐0.39, 0.10] |
|
| 47 Length at 18 months post‐term Show forest plot | 2 | 396 | Mean Difference (IV, Fixed, 95% CI) | ‐0.28 [‐0.91, 0.35] |
|
| 48 Head circumference at 18 months post‐term Show forest plot | 2 | 396 | Mean Difference (IV, Fixed, 95% CI) | ‐0.18 [‐0.53, 0.18] |
|
| 49 Normalised weight at 18 months post‐term Show forest plot | 1 | 158 | Mean Difference (IV, Fixed, 95% CI) | ‐0.33 [‐0.68, 0.02] |
|
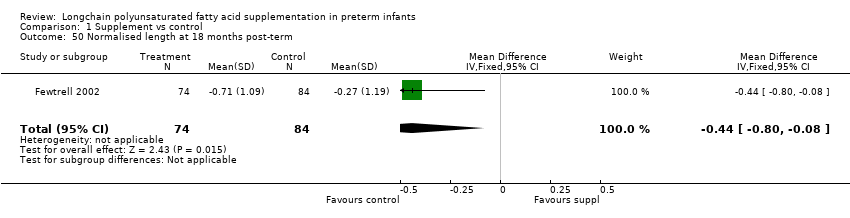
| 50 Normalised length at 18 months post‐term Show forest plot | 1 | 158 | Mean Difference (IV, Fixed, 95% CI) | ‐0.44 [‐0.80, ‐0.08] |
|
| 51 Normalised head circumference at 18 months post‐term Show forest plot | 1 | 158 | Mean Difference (IV, Fixed, 95% CI) | ‐0.10 [‐0.52, 0.32] |
|
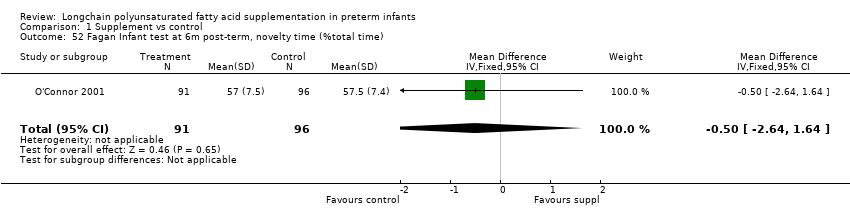
| 52 Fagan Infant test at 6m post‐term, novelty time (%total time) Show forest plot | 1 | 187 | Mean Difference (IV, Fixed, 95% CI) | ‐0.5 [‐2.64, 1.64] |
|
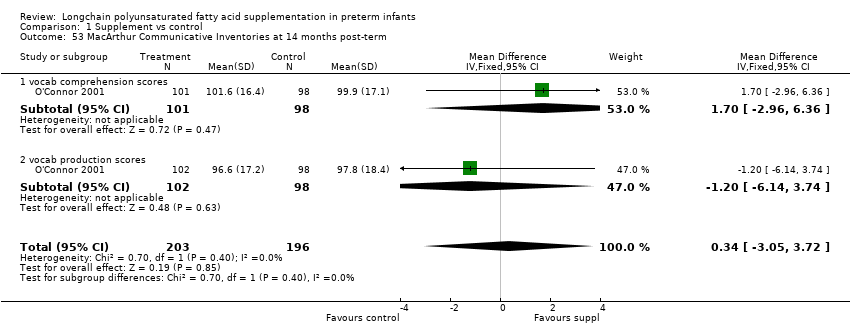
| 53 MacArthur Communicative Inventories at 14 months post‐term Show forest plot | 1 | 399 | Mean Difference (IV, Fixed, 95% CI) | 0.34 [‐3.05, 3.72] |
|
| 53.1 vocab comprehension scores | 1 | 199 | Mean Difference (IV, Fixed, 95% CI) | 1.70 [‐2.96, 6.36] |
| 53.2 vocab production scores | 1 | 200 | Mean Difference (IV, Fixed, 95% CI) | ‐1.20 [‐6.14, 3.74] |
| 54 Bayley MDI at 24 months post‐term Show forest plot | 1 | 42 | Mean Difference (IV, Fixed, 95% CI) | 4.10 [‐8.06, 16.26] |
|
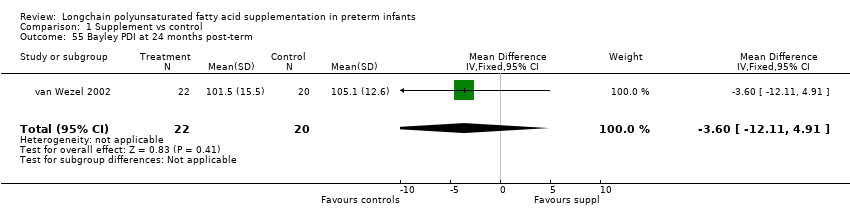
| 55 Bayley PDI at 24 months post‐term Show forest plot | 1 | 42 | Mean Difference (IV, Fixed, 95% CI) | ‐3.60 [‐12.11, 4.91] |
|
| 56 Weight at 10 years Show forest plot | 1 | 107 | Mean Difference (IV, Fixed, 95% CI) | 2.30 [‐1.45, 6.06] |
|
| 56.1 boys | 1 | 51 | Mean Difference (IV, Fixed, 95% CI) | ‐1.43 [‐7.08, 4.22] |
| 56.2 girls | 1 | 56 | Mean Difference (IV, Fixed, 95% CI) | 5.26 [0.23, 10.29] |
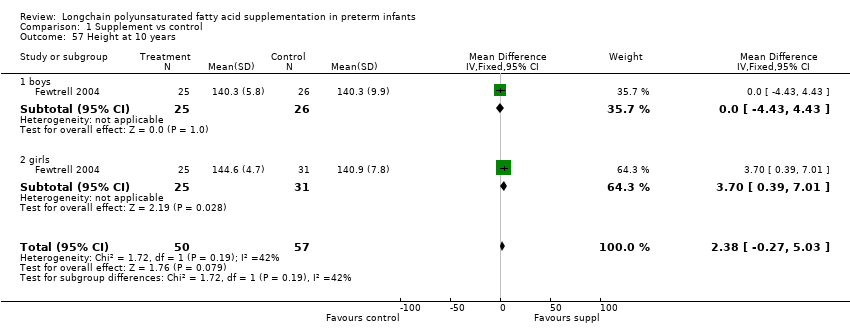
| 57 Height at 10 years Show forest plot | 1 | 107 | Mean Difference (IV, Fixed, 95% CI) | 2.38 [‐0.27, 5.03] |
|
| 57.1 boys | 1 | 51 | Mean Difference (IV, Fixed, 95% CI) | 0.0 [‐4.43, 4.43] |
| 57.2 girls | 1 | 56 | Mean Difference (IV, Fixed, 95% CI) | 3.70 [0.39, 7.01] |
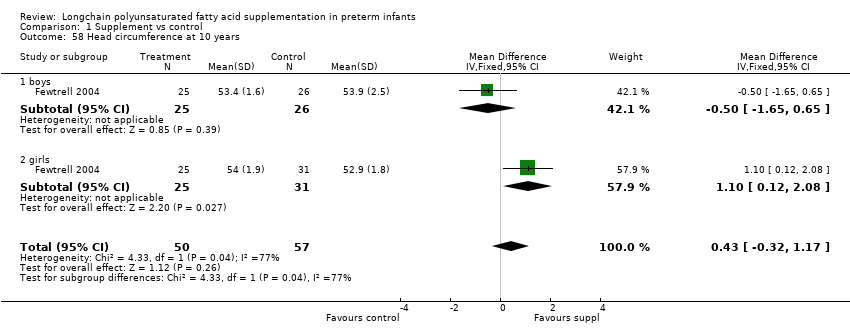
| 58 Head circumference at 10 years Show forest plot | 1 | 107 | Mean Difference (IV, Fixed, 95% CI) | 0.43 [‐0.32, 1.17] |
|
| 58.1 boys | 1 | 51 | Mean Difference (IV, Fixed, 95% CI) | ‐0.5 [‐1.65, 0.65] |
| 58.2 girls | 1 | 56 | Mean Difference (IV, Fixed, 95% CI) | 1.10 [0.12, 2.08] |