Suplementos de ácidos grasos poliinsaturados de cadena larga para recién nacidos prematuros
Appendices
Appendix 1. Central Register of Controlled Trials (CENTRAL) search strategy (searched 28/02/16)
#1 MESH descriptor: [Fatty Acids, Unsaturated] explode all trees
#2 MESH descriptor: [Lipids] explode all trees
#3 "longchain polyunsaturated fatty acid" or "long chain polyunsaturated fatty acid" or "LCPUFA"
#4 "polyunsaturated fatty acid" or "PUFA"
#5 "fish oil" or "marine oil" or "algal oil"
#6 “docosahexaenoic acid” or “DHA”
#7 “arachidonic acid”
#8 “eicosapentaenoic acid” or “EPA”
#9 lipid
#10 “omega‐3” or “omega‐6”
#11 “linoleic acid” or “linolenic acid”
#12 #1 or #2 or #3 or #4 or #5 or #6 or #7 or #8 or #9 or #10 or #11
#13 MeSH descriptor: [Infant, Low Birth Weight] explode all trees
#14 MeSH descriptor: [Infant, Premature] explode all trees
#15 “small for gestational age”
#16 "low birthweight" or "low birth weight" or lbw
#17 preterm or “pre term” or premature
#18 #13 OR #14 OR #15 OR #16 OR #17
#19 #12 and #18
Appendix 2. MEDLINE (OvidSP) search strategy (searched 28/02/16)
1 exp Fatty Acids, Unsaturated/
2 exp Lipids/
3 (longchain polyunsaturated fatty acid* or long chain polyunsaturated fatty acid* or LCPUFA).tw.
4 (polyunsaturated fatty acid* or PUFA).tw.
5 (fish oil* or marine oil* or algal oil*).tw.
6 (docosahexaenoic acid* or DHA).tw.
7 arachidonic acid*.tw.
8 (eicosapentaenoic acid* or EPA).tw.
9 lipid*.tw.
10 (omega‐3 or omega‐6).tw.
11 (linoleic acid* or linolenic acid*).tw.
12 1 or 2 or 3 or 4 or 5 or 6 or 7 or 8 or 9 or 10 or 11
13 exp Infant, Low Birth Weight/
14 exp Infant, Premature/
15 (small adj2 gestational age).tw.
16 ((low adj1 birthweight) or (low adj1 birth weight)).tw.
17 (preterm or pre‐term or prematur* or lbw).tw.
18 15 or 16 or 17
19 (infan* or newborn* or neonate*).tw.
20 18 and 19
21 13 or 14 or 20
22 randomized controlled trial.pt.
23 controlled clinical trial.pt.
24 randomi?ed.ab.
25 placebo.ab.
26 randomly.ab.
27 trial.ab.
28 exp Clinical Trials as Topic/
29 22 or 23 or 24 or 25 or 26 or 27 or 28
30 exp animals/ not humans.sh.
31 29 not 30
32 12 and 21 and 31
Appendix 3. Embase (OvidSP) search strategy (searched 28/02/16)
1 exp unsaturated fatty acid/
2 exp long chain fatty acid/
3 exp fish oil/
4 exp lipid/
5 (longchain polyunsaturated fatty acid* or long chain polyunsaturated fatty acid* or LCPUFA).tw.
6 (polyunsaturated fatty acid* or PUFA).tw.
7 (fish oil* or marine oil* or algal oil*).tw.
8 (docosahexaenoic acid* or DHA).tw.
9 arachidonic acid*.tw.
10 (icosapentaenoic acid* or eicosapentaenoic acid* or EPA).tw.
11 lipid*.tw.
12 (omega‐3 or omega‐6).tw.
13 (linoleic acid* or linolenic acid*).tw.
14 1 or 2 or 3 or 4 or 5 or 6 or 7 or 8 or 9 or 10 or 11 or 12 or 13
15 exp prematurity/
16 exp low birth weight/
17 (small adj2 gestational age).tw.
18 ((low adj1 birthweight) or (low adj1 birth weight)).tw.
19 (preterm or pre‐term or prematur* or lbw).tw.
20 17 or 18 or 19
21 (infan* or newborn* or neonate*).tw.
22 20 and 21
23 15 or 16 or 22
24 exp controlled clinical trial/
25 randomized controlled trial/
26 exp triple blind procedure/
27 single blind procedure/
28 double blind procedure/
29 crossover procedure/
30 clinical trial/
31 exp placebo/
32 exp randomization/
33 random*.tw.
34 placebo*.tw.
35 ((singl* or doubl* or trebl* or tripl*) adj1 (blind* or mask*)).tw.
36 (crossover or cross over).tw.
37 trial.tw.
38 24 or 25 or 26 or 27 or 28 or 29 or 30 or 31 or 32 or 33 or 34 or 35 or 36 or 37
39 (animal/ or non human/) not human/
40 38 not 39
41 14 and 23 and 40
Appendix 4. CINAHL (EBSCO) search strategy (searched 28/02/16)
S34 S12 AND S21 AND S33
S33 S22 OR S23 OR S24 OR S25 OR S26 OR S27 OR S28 OR S29 OR S30 OR S31 OR S32
S32 (sing* OR doubl* OR tripl* OR trepl*) OR (blind* OR mask*)
S31 crossover OR cross over
S30 (MH "Crossover Design")
S29 trial
S28 random*
S27 (MH "Quantitative Studies")
S26 (MH "Random Assignment")S25 placebo*
S24 (MH "Placebos")
S23 PT clinical trial
S22 (MH "Clinical Trials+")
S21 S13 OR S14 OR S20
S20 S18 AND S19
S19 infan* OR newborn* OR neonate*
S18 S15 OR S16 OR S17
S17 preterm OR pre‐term OR prematur* OR lbw
S16 low birthweight OR low birth weightS15 small for gestational age
S14 (MH "Infant, Low Birth Weight+")
S13 (MH "Infant, Premature")
S12 S1 OR S2 OR S3 OR S4 OR S5 OR S6 OR S7 OR S8 OR S9 OR S10 OR S11
S11 (linoleic acid* OR linolenic acid*)
S10 (omega‐3 OR omega‐6)
S9 lipid*
S8 (eicosapentaenoic acid* OR EPA)
S7 arachidonic acid*
S6 (docosahexaenoic acid* OR DHA)
S5 (fish oil* OR marine oil* OR algal oil*)
S4 (polyunsaturated fatty acid* OR PUFA)
S3 (longchain polyunsaturated fatty acid* OR long chain polyunsaturated fatty acid* OR LCPUFA)
S2 (MH "Lipids+")
S1 (MH "Fatty Acids, Unsaturated+")
Appendix 5. MEDLINE (OvidSP) In Process & Other Non‐indexed Citations search stategy (search 28/02/16)
1 (longchain polyunsaturated fatty acid* or long chain polyunsaturated fatty acid* or LCPUFA).mp.
2 (polyunsaturated fatty acid* or PUFA).mp.
3 (fish oil* or marine oil* or algal oil*).mp.
4 (docosahexaenoic acid* or DHA).mp.
5 arachidonic acid*.mp.
6 (eicosapentaenoic acid* or EPA).mp.
7 lipid*.mp.
8 (omega‐3 or omega‐6).mp.
9 (linoleic acid* or linolenic acid*).mp.
10 1 or 2 or 3 or 4 or 5 or 6 or 7 or 8 or 9
11 (small adj2 gestational age).mp.
12 ((low adj1 birthweight) or (low adj1 birth weight)).mp.
13 (preterm or pre‐term or prematur* or lbw).mp.
14 11 or 12 or 13
15 (infan* or newborn* or neonate*).mp.
16 14 and 15
17 random*.mp.
18 placebo*.mp.
19 trial*.mp.
20 17 or 18 or 19
21 10 and 16 and 20
Appendix 6. 'Risk of bias' tool
We evaluated the following and entered the findings into the risk of bias tables:
1) Random sequence generation (checking for possible selection bias). Was the allocation sequence adequately generated?
For each included study, we categorized the method used to generate the allocation sequence as:
‐ Low (any truly random process e.g. random number table; computer random number generator);
‐ High (any non random process e.g. odd or even date of birth; hospital or clinic record number);
‐ Unclear.
(2) Allocation concealment (checking for possible selection bias). Was allocation adequately concealed?
For each included study, we categorized the method used to conceal the allocation sequence as:
‐ Low (e.g. telephone or central randomisation; consecutively numbered sealed opaque envelopes);
‐ High (open random allocation; unsealed or non‐opaque envelopes, alternation; date of birth);
‐ Unclear.
(3) Blinding (checking for possible performance bias and detection bias). Was knowledge of the allocated intervention adequately prevented during the study? At study entry? At the time of outcome assessment?
For each included study, we categorized the methods used to blind study participants and personnel from knowledge of which intervention a participant received. Blinding was assessed separately for different outcomes or classes of outcomes. We categorized the methods as:
‐ Low, High or Unclear for participants;
‐ Low, High or Unclear for personnel;
‐ Low, High or Unclear for outcome assessors.
(4) Incomplete outcome data (checking for possible attrition bias through withdrawals, dropouts, protocol deviations). Were incomplete outcome data adequately addressed?
For each included study and for each outcome, we described the completeness of data including attrition and exclusions from the analysis. We noted whether attrition and exclusions were reported, the numbers included in the analysis at each stage (compared with the total randomised participants), reasons for attrition or exclusion where reported, and whether missing data were balanced across groups or were related to outcomes. Where sufficient information was reported or supplied by the trial authors, we re‐included missing data in the analyses. We categorized the methods as:
‐ Low (< 20% missing data);
‐ High (≥ 20% missing data):
‐ Unclear.
(5) Selective reporting bias. Are reports of the study free of suggestion of selective outcome reporting?
For each included study, we described how we investigated the possibility of selective outcome reporting bias and what we found. We assessed the methods as:
‐ Low (where it is clear that all of the study’s pre‐specified outcomes and all expected outcomes of interest to the review have been reported);
‐ High (where not all the study’s pre‐specified outcomes have been reported; one or more reported primary outcomes were not pre‐specified; outcomes of interest are reported incompletely and so cannot be used; study fails to include results of a key outcome that would have been expected to have been reported);
‐ Unclear.
(6) Other sources of bias. Was the study apparently free of other problems that could put it at a high risk of bias?
For each included study, we described any important concerns we had about other possible sources of bias (for example, whether there was a potential source of bias related to the specific study design or whether the trial was stopped early due to some data‐dependent process). We assessed whether each study was free of other problems that could put it at risk of bias as:
‐ Low; High; or unclear.
If needed, we planned to explore the impact of the level of bias through undertaking sensitivity analyses.
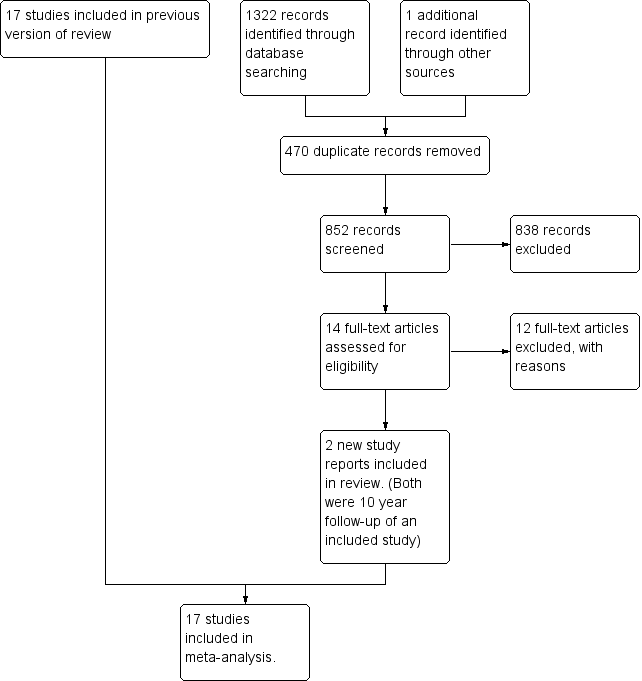
Study flow diagram.

Risk of bias graph: review authors' judgements about each risk of bias item presented as percentages across all included studies.
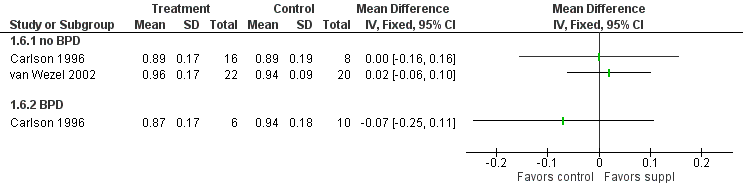
Forest plot of comparison: 1 Supplement vs control, outcome: 1.6 Visual acuity (log cycles/degree) at 12 months post‐term.
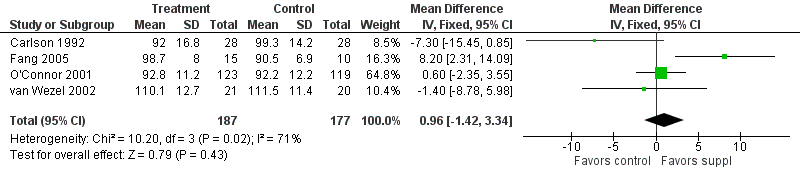
Forest plot of comparison: 1 Supplement vs control, outcome: 1.13 Bayley MDI at 12 months post‐term.

Forest plot of comparison: 1 Supplement vs control, outcome: 1.14 Bayley PDI at 12 months post‐term.

Forest plot of comparison: 1 Supplement vs control, outcome: 1.28 Weight at 12 months post‐term (kg).
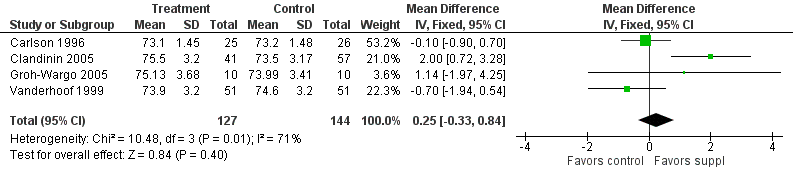
Forest plot of comparison: 1 Supplement vs control, outcome: 1.29 Length at 12 months post‐term (cm).

Forest plot of comparison: 1 Supplement vs control, outcome: 1.30 Head circumference at 12 months post‐term (cm).

Comparison 1 Supplement vs control, Outcome 1 Visual acuity (log cycles/degree) at term.
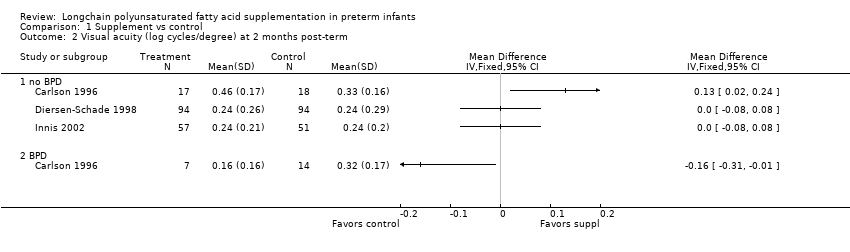
Comparison 1 Supplement vs control, Outcome 2 Visual acuity (log cycles/degree) at 2 months post‐term.
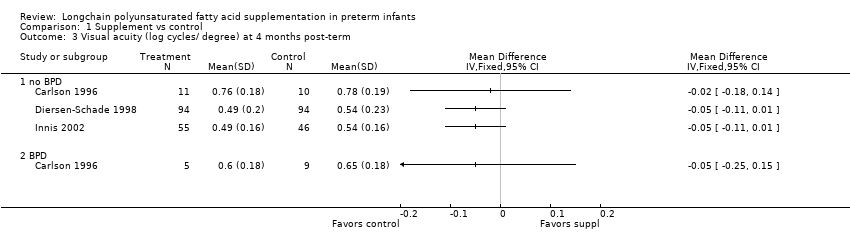
Comparison 1 Supplement vs control, Outcome 3 Visual acuity (log cycles/ degree) at 4 months post‐term.
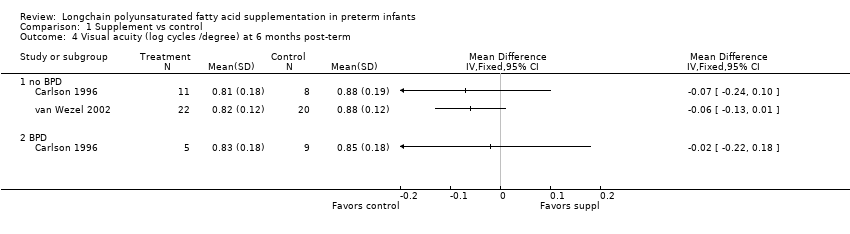
Comparison 1 Supplement vs control, Outcome 4 Visual acuity (log cycles /degree) at 6 months post‐term.

Comparison 1 Supplement vs control, Outcome 5 Visual acuity (log cycles/degree) at 9 months post‐term.

Comparison 1 Supplement vs control, Outcome 6 Visual acuity (log cycles/degree) at 12 months post‐term.

Comparison 1 Supplement vs control, Outcome 7 Rod ERG at 36 wk PCA.
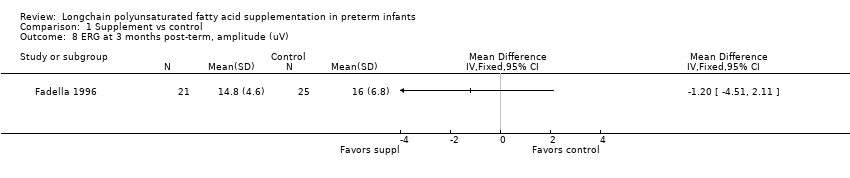
Comparison 1 Supplement vs control, Outcome 8 ERG at 3 months post‐term, amplitude (uV).
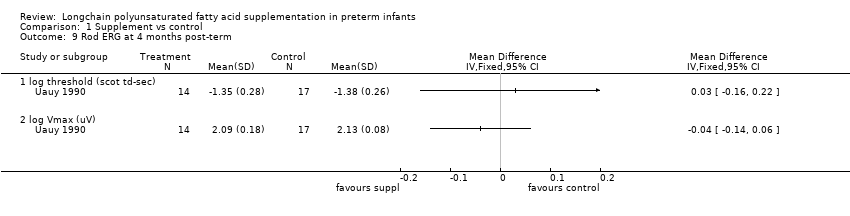
Comparison 1 Supplement vs control, Outcome 9 Rod ERG at 4 months post‐term.
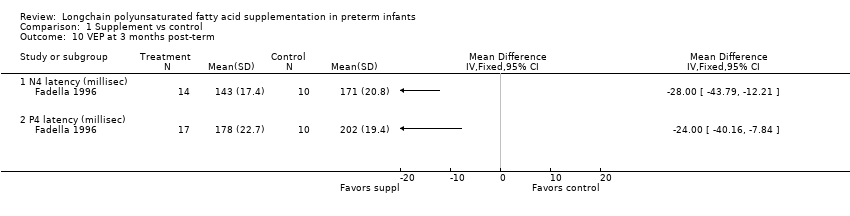
Comparison 1 Supplement vs control, Outcome 10 VEP at 3 months post‐term.

Comparison 1 Supplement vs control, Outcome 11 Fagan infant test at 12 months post‐term.
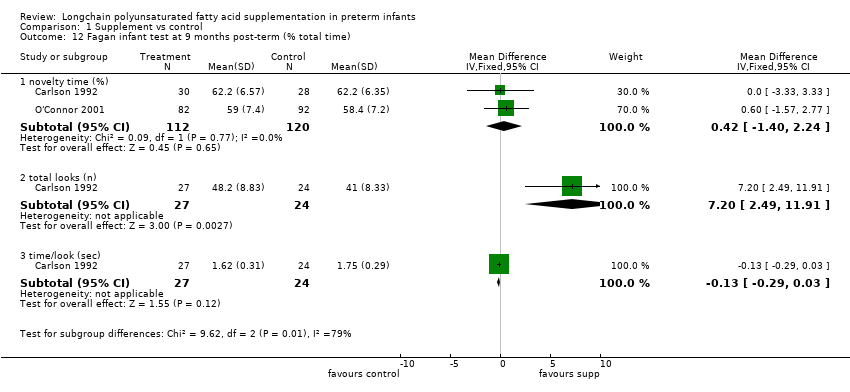
Comparison 1 Supplement vs control, Outcome 12 Fagan infant test at 9 months post‐term (% total time).
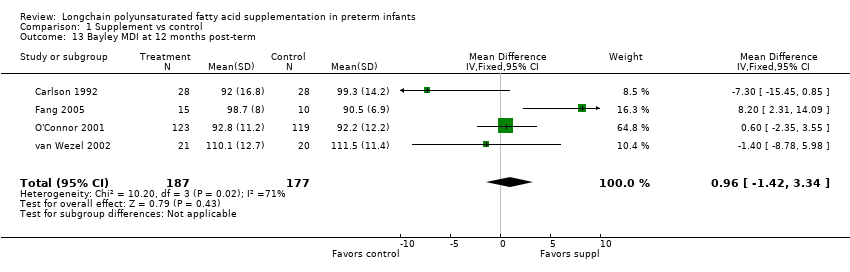
Comparison 1 Supplement vs control, Outcome 13 Bayley MDI at 12 months post‐term.

Comparison 1 Supplement vs control, Outcome 14 Bayley PDI at 12 months post‐term.
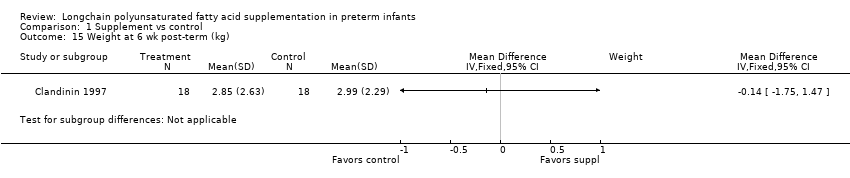
Comparison 1 Supplement vs control, Outcome 15 Weight at 6 wk post‐term (kg).

Comparison 1 Supplement vs control, Outcome 16 Length at 6 wk post‐term (cm).
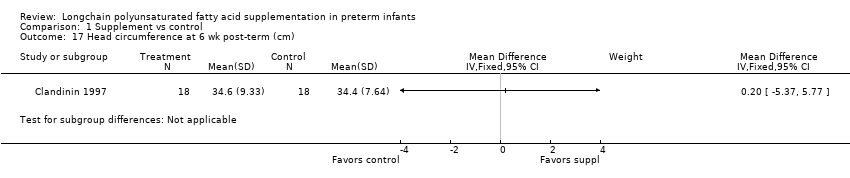
Comparison 1 Supplement vs control, Outcome 17 Head circumference at 6 wk post‐term (cm).
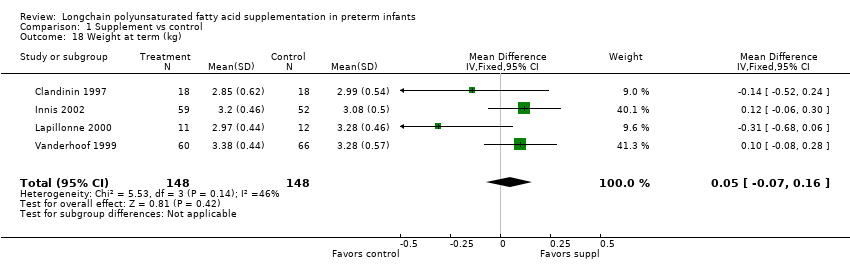
Comparison 1 Supplement vs control, Outcome 18 Weight at term (kg).
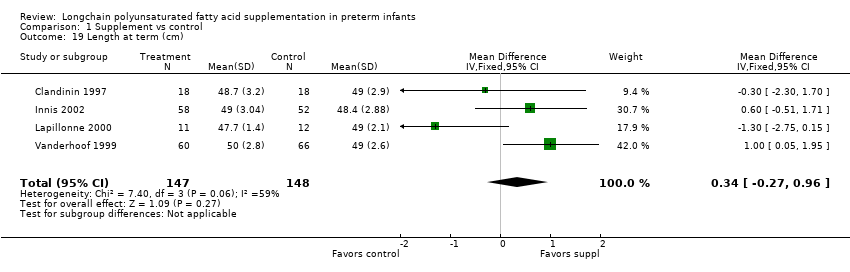
Comparison 1 Supplement vs control, Outcome 19 Length at term (cm).

Comparison 1 Supplement vs control, Outcome 20 Head circ at term (cm).

Comparison 1 Supplement vs control, Outcome 21 Weight at 2 months post‐term (kg).

Comparison 1 Supplement vs control, Outcome 22 Length at 2 months post‐term (cm).

Comparison 1 Supplement vs control, Outcome 23 Head circumference at 2 months post‐term (cm).
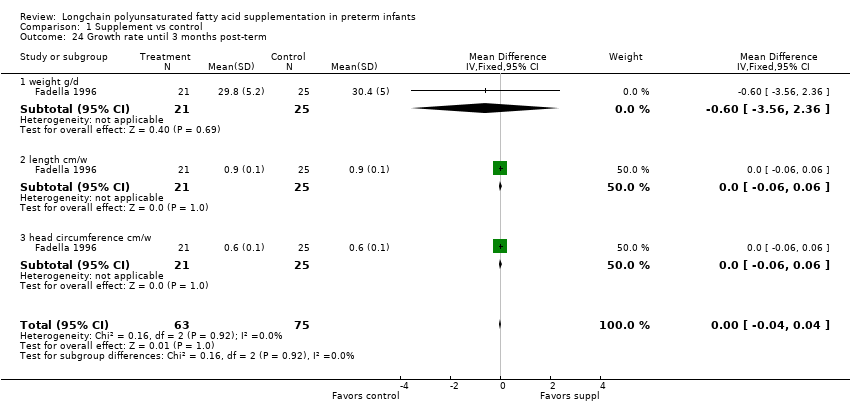
Comparison 1 Supplement vs control, Outcome 24 Growth rate until 3 months post‐term.

Comparison 1 Supplement vs control, Outcome 25 Weight at 4 months post‐term (kg).
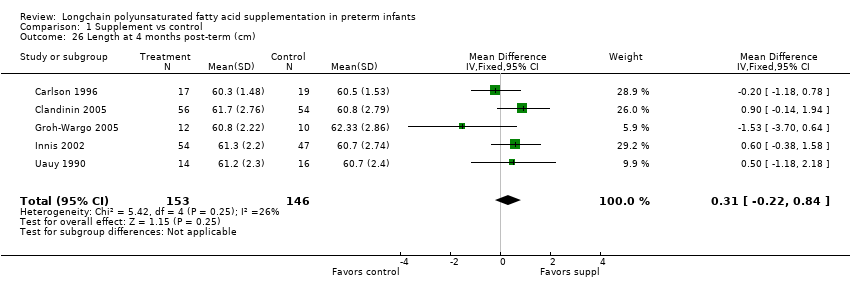
Comparison 1 Supplement vs control, Outcome 26 Length at 4 months post‐term (cm).

Comparison 1 Supplement vs control, Outcome 27 Head circumference at 4 months post‐term (cm).

Comparison 1 Supplement vs control, Outcome 28 Weight at 12 months post‐term (kg).
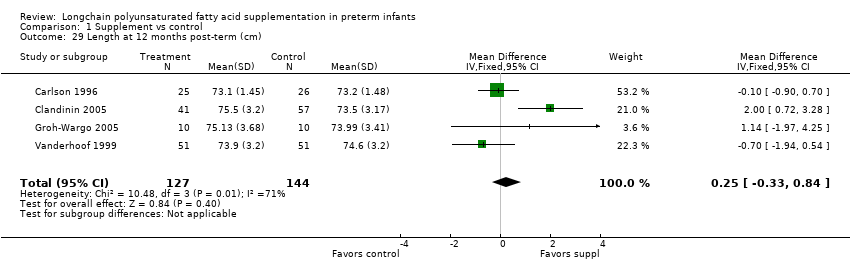
Comparison 1 Supplement vs control, Outcome 29 Length at 12 months post‐term (cm).

Comparison 1 Supplement vs control, Outcome 30 Head circumference at 12 months post‐term (cm).

Comparison 1 Supplement vs control, Outcome 31 Normalised weight at 12 months post‐term.

Comparison 1 Supplement vs control, Outcome 32 Normalised length at 12 months post‐term.

Comparison 1 Supplement vs control, Outcome 33 Normalised head circumference at 12 months post‐term.

Comparison 1 Supplement vs control, Outcome 34 Lipid peroxidation (TBARS ‐azide/+azide x 100%), 4 months post‐term.

Comparison 1 Supplement vs control, Outcome 35 RBC fragility (hemolysis with 8% to 10% H2O2) , 4 months post‐term.

Comparison 1 Supplement vs control, Outcome 36 Infant bleeding time 4 months post‐term (ped device, min).

Comparison 1 Supplement vs control, Outcome 37 Bayley MDI at 18 months post‐term.

Comparison 1 Supplement vs control, Outcome 38 Bayley PDI at 18 months post‐term.

Comparison 1 Supplement vs control, Outcome 39 KPS Developmental Screening Inventory at 9 months post‐term (overall quotient).

Comparison 1 Supplement vs control, Outcome 40 Weight at 9 months post‐term.

Comparison 1 Supplement vs control, Outcome 41 Length at 9 months post‐term.

Comparison 1 Supplement vs control, Outcome 42 Head circumference at 9 months post‐term.

Comparison 1 Supplement vs control, Outcome 43 Normailsed weight at 9 months post‐term.
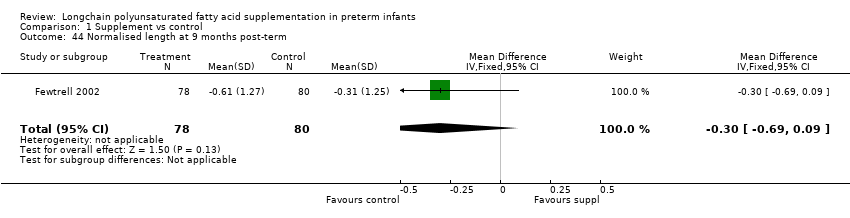
Comparison 1 Supplement vs control, Outcome 44 Normalised length at 9 months post‐term.

Comparison 1 Supplement vs control, Outcome 45 Normalised head circumference at 9 months post‐term.

Comparison 1 Supplement vs control, Outcome 46 Weight at 18 months post‐term.

Comparison 1 Supplement vs control, Outcome 47 Length at 18 months post‐term.

Comparison 1 Supplement vs control, Outcome 48 Head circumference at 18 months post‐term.

Comparison 1 Supplement vs control, Outcome 49 Normalised weight at 18 months post‐term.
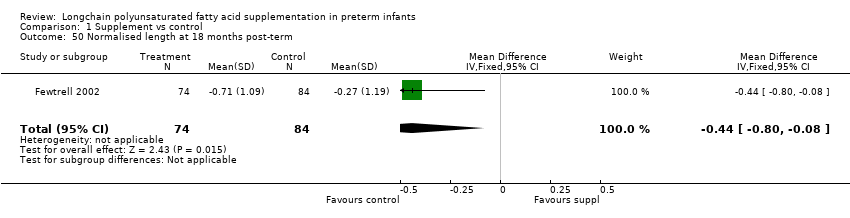
Comparison 1 Supplement vs control, Outcome 50 Normalised length at 18 months post‐term.

Comparison 1 Supplement vs control, Outcome 51 Normalised head circumference at 18 months post‐term.
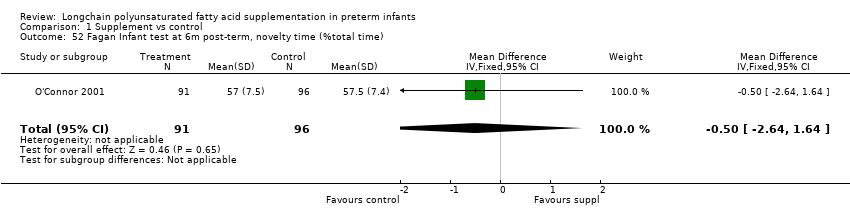
Comparison 1 Supplement vs control, Outcome 52 Fagan Infant test at 6m post‐term, novelty time (%total time).
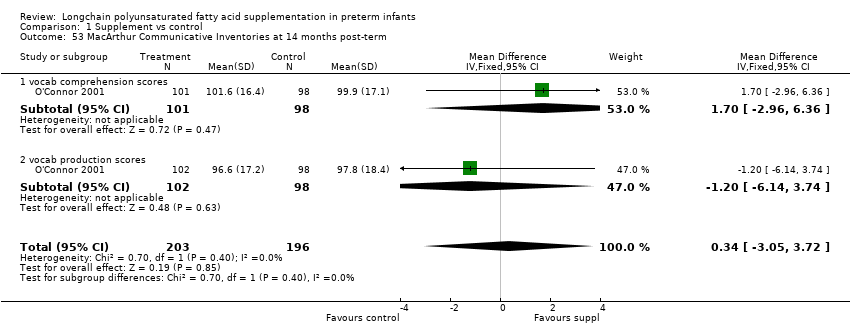
Comparison 1 Supplement vs control, Outcome 53 MacArthur Communicative Inventories at 14 months post‐term.

Comparison 1 Supplement vs control, Outcome 54 Bayley MDI at 24 months post‐term.
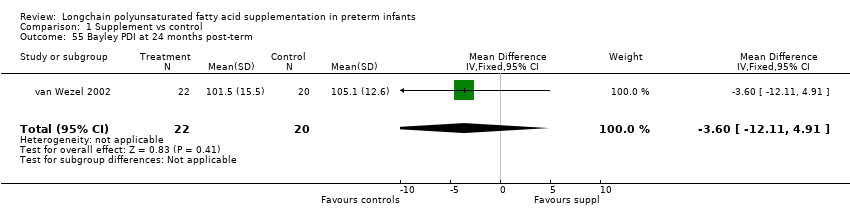
Comparison 1 Supplement vs control, Outcome 55 Bayley PDI at 24 months post‐term.

Comparison 1 Supplement vs control, Outcome 56 Weight at 10 years.
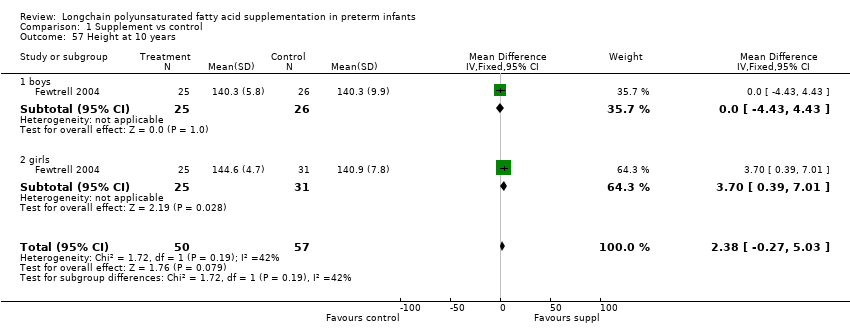
Comparison 1 Supplement vs control, Outcome 57 Height at 10 years.
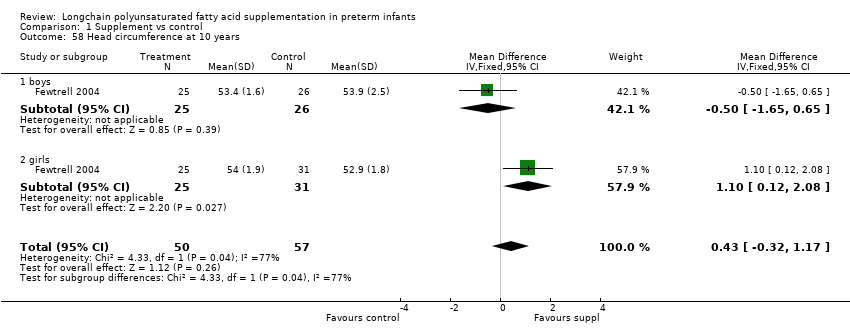
Comparison 1 Supplement vs control, Outcome 58 Head circumference at 10 years.
| LCPUFA supplemented formula compared with standard formula for clinical outcomes (visual function, neurodevelopment and physical growth) | ||||||
| Patient or population: Preterm infants on enteral feed Settings: Neonatal Intensive Care Units Intervention: LCPUFA supplemented formula Comparison: Standard Formula | ||||||
| Outcomes | Illustrative comparative risks* (95% CI) | Relative effect | No of Participants | Quality of the evidence | Comments | |
| Assumed risk | Corresponding risk | |||||
| Standard milk formula | LCPUFA supplemented milk formula | |||||
| Visual acuity at 12 months post‐term (log/cycles/degree) | Data could not be pooled | Data could not be pooled | NA | 82 | ⊕⊕⊝⊝ | Downgraded 2 levels due to very small sample, unclear random sequence generation in one of the RCTs. Meta‐analysis could not be performed. |
| Bayley MDI at 12 months post‐term | The mean MDI ranged across control groups from | The mean MDI ranged across the intervention groups from 92 to 110.1 | MD: 0.96 (95% CI: −1.42 to 3.34) | 364 | ⊕⊕⊝⊝ | Downgraded 2 levels. Reasons: small sample, unclear allocation concealment and random sequence generation in 2 of the RCTs, and very small effect size (MD) and high statistical heterogeneity (I² = 71%) |
| Bayley PDI at 12 months post‐term | The mean PDI ranged across control groups from 86.3 to 102.1 | The mean PDI ranged across the intervention groups from 82.2 to 98 | MD: 0.23 (95% CI: ‐2.77 to 3.22) | 353 (4 RCTs) | ⊕⊕⊝⊝ | Downgraded 2 levels. Reasons: small sample, unclear risk of allocation concealment in 2 of the RCTs. Very small effect size (MD) and high statistical heterogeneity (I² = 81%). |
| Weight at 12 months post‐term (kg) | The mean weight ranged across control groups from 8.85 kg to 9.62 kg | The mean weight ranged across the intervention groups from 9.02 kg to 9.36 kg | MD: −0.10 (95% CI: −0.31 to 0.12) | 271 (4 RCTs) | ⊕⊕⊝⊝ | Downgraded 2 levels. Reasons: small sample, high or unclear risk of attrition bias in 3 studies and unclear method of randomisation in 1 study. Very small effect size (MD) and high statistical heterogeneity (I² = 65%) |
| Length at 12 months post‐term (cm) | The mean length ranged across control groups from 73.2 cm to 74.6 cm | The mean length ranged across the intervention groups from 73.1 cm to 75.5 cm | MD: 0.25 (CI: −0.33 to 0.84) | 271 (4 RCTs) | ⊕⊕⊝⊝ | Downgraded 2 levels. Reasons: small sample, high or unclear risk of attrition bias in 3 included studies and unclear method of randomisation in 1 study. Very small effect size (MD) and high statistical heterogeneity (I² = 71%) |
| Head circumference at 12 months post‐term (cm) | The mean head circumference ranged across control group from 45.8 cm to 46.43 cm | The mean head circumference ranged across the intervention groups from 45.9 cm to 46.31 cm | MD: −0.15 (CI: −0.53 to 0.23) | 271 (4 RCTs) | ⊕⊕⊝⊝ | Downgraded 2 levels. Reasons: small sample, high or unclear risk of attrition bias in 3 included studies and unclear method of randomisation in one study. Very small effect size (MD). |
| *The basis for the assumed risk (e.g. the median control group risk across studies) is provided in footnotes. The corresponding risk (and its 95% confidence interval) is based on the assumed risk in the comparison group and the relative effect of the intervention (and its 95% CI). | ||||||
| GRADE Working Group grades of evidence | ||||||
| Outcome or subgroup title | No. of studies | No. of participants | Statistical method | Effect size |
| 1 Visual acuity (log cycles/degree) at term Show forest plot | 1 | Mean Difference (IV, Fixed, 95% CI) | Totals not selected | |
| 1.1 no BPD | 1 | Mean Difference (IV, Fixed, 95% CI) | 0.0 [0.0, 0.0] | |
| 1.2 BPD | 1 | Mean Difference (IV, Fixed, 95% CI) | 0.0 [0.0, 0.0] | |
| 2 Visual acuity (log cycles/degree) at 2 months post‐term Show forest plot | 3 | Mean Difference (IV, Fixed, 95% CI) | Totals not selected | |
| 2.1 no BPD | 3 | Mean Difference (IV, Fixed, 95% CI) | 0.0 [0.0, 0.0] | |
| 2.2 BPD | 1 | Mean Difference (IV, Fixed, 95% CI) | 0.0 [0.0, 0.0] | |
| 3 Visual acuity (log cycles/ degree) at 4 months post‐term Show forest plot | 3 | Mean Difference (IV, Fixed, 95% CI) | Totals not selected | |
| 3.1 no BPD | 3 | Mean Difference (IV, Fixed, 95% CI) | 0.0 [0.0, 0.0] | |
| 3.2 BPD | 1 | Mean Difference (IV, Fixed, 95% CI) | 0.0 [0.0, 0.0] | |
| 4 Visual acuity (log cycles /degree) at 6 months post‐term Show forest plot | 2 | Mean Difference (IV, Fixed, 95% CI) | Totals not selected | |
| 4.1 no BPD | 2 | Mean Difference (IV, Fixed, 95% CI) | 0.0 [0.0, 0.0] | |
| 4.2 BPD | 1 | Mean Difference (IV, Fixed, 95% CI) | 0.0 [0.0, 0.0] | |
| 5 Visual acuity (log cycles/degree) at 9 months post‐term Show forest plot | 1 | Mean Difference (IV, Fixed, 95% CI) | Totals not selected | |
| 5.1 no BPD | 1 | Mean Difference (IV, Fixed, 95% CI) | 0.0 [0.0, 0.0] | |
| 5.2 BPD | 1 | Mean Difference (IV, Fixed, 95% CI) | 0.0 [0.0, 0.0] | |
| 6 Visual acuity (log cycles/degree) at 12 months post‐term Show forest plot | 2 | Mean Difference (IV, Fixed, 95% CI) | Totals not selected | |
| 6.1 no BPD | 2 | Mean Difference (IV, Fixed, 95% CI) | 0.0 [0.0, 0.0] | |
| 6.2 BPD | 1 | Mean Difference (IV, Fixed, 95% CI) | 0.0 [0.0, 0.0] | |
| 7 Rod ERG at 36 wk PCA Show forest plot | 1 | Mean Difference (IV, Fixed, 95% CI) | Totals not selected | |
| 7.1 log threshold (scot td‐sec) | 1 | Mean Difference (IV, Fixed, 95% CI) | 0.0 [0.0, 0.0] | |
| 7.2 log Vmax (uV) | 1 | Mean Difference (IV, Fixed, 95% CI) | 0.0 [0.0, 0.0] | |
| 8 ERG at 3 months post‐term, amplitude (uV) Show forest plot | 1 | Mean Difference (IV, Fixed, 95% CI) | Totals not selected | |
| 9 Rod ERG at 4 months post‐term Show forest plot | 1 | Mean Difference (IV, Fixed, 95% CI) | Totals not selected | |
| 9.1 log threshold (scot td‐sec) | 1 | Mean Difference (IV, Fixed, 95% CI) | 0.0 [0.0, 0.0] | |
| 9.2 log Vmax (uV) | 1 | Mean Difference (IV, Fixed, 95% CI) | 0.0 [0.0, 0.0] | |
| 10 VEP at 3 months post‐term Show forest plot | 1 | Mean Difference (IV, Fixed, 95% CI) | Totals not selected | |
| 10.1 N4 latency (millisec) | 1 | Mean Difference (IV, Fixed, 95% CI) | 0.0 [0.0, 0.0] | |
| 10.2 P4 latency (millisec) | 1 | Mean Difference (IV, Fixed, 95% CI) | 0.0 [0.0, 0.0] | |
| 11 Fagan infant test at 12 months post‐term Show forest plot | 2 | Mean Difference (IV, Fixed, 95% CI) | Subtotals only | |
| 11.1 novelty time (% total time) | 2 | 84 | Mean Difference (IV, Fixed, 95% CI) | ‐4.11 [‐7.47, ‐0.76] |
| 11.2 total looks (n) | 2 | 84 | Mean Difference (IV, Fixed, 95% CI) | 5.52 [2.16, 8.87] |
| 11.3 time/look (sec) | 2 | 84 | Mean Difference (IV, Fixed, 95% CI) | ‐0.09 [‐0.21, 0.02] |
| 12 Fagan infant test at 9 months post‐term (% total time) Show forest plot | 2 | Mean Difference (IV, Fixed, 95% CI) | Subtotals only | |
| 12.1 novelty time (%) | 2 | 232 | Mean Difference (IV, Fixed, 95% CI) | 0.42 [‐1.40, 2.24] |
| 12.2 total looks (n) | 1 | 51 | Mean Difference (IV, Fixed, 95% CI) | 7.20 [2.49, 11.91] |
| 12.3 time/look (sec) | 1 | 51 | Mean Difference (IV, Fixed, 95% CI) | ‐0.13 [‐0.29, 0.03] |
| 13 Bayley MDI at 12 months post‐term Show forest plot | 4 | 364 | Mean Difference (IV, Fixed, 95% CI) | 0.96 [‐1.42, 3.34] |
| 14 Bayley PDI at 12 months post‐term Show forest plot | 4 | 353 | Mean Difference (IV, Fixed, 95% CI) | 0.23 [‐2.77, 3.22] |
| 15 Weight at 6 wk post‐term (kg) Show forest plot | 1 | Mean Difference (IV, Fixed, 95% CI) | Subtotals only | |
| 16 Length at 6 wk post‐term (cm) Show forest plot | 1 | Mean Difference (IV, Fixed, 95% CI) | Subtotals only | |
| 17 Head circumference at 6 wk post‐term (cm) Show forest plot | 1 | Mean Difference (IV, Fixed, 95% CI) | Subtotals only | |
| 18 Weight at term (kg) Show forest plot | 4 | 296 | Mean Difference (IV, Fixed, 95% CI) | 0.05 [‐0.07, 0.16] |
| 19 Length at term (cm) Show forest plot | 4 | 295 | Mean Difference (IV, Fixed, 95% CI) | 0.34 [‐0.27, 0.96] |
| 20 Head circ at term (cm) Show forest plot | 3 | 185 | Mean Difference (IV, Fixed, 95% CI) | 0.18 [‐0.26, 0.62] |
| 21 Weight at 2 months post‐term (kg) Show forest plot | 5 | 485 | Mean Difference (IV, Fixed, 95% CI) | 0.21 [0.08, 0.33] |
| 22 Length at 2 months post‐term (cm) Show forest plot | 4 | 297 | Mean Difference (IV, Fixed, 95% CI) | 0.47 [0.00, 0.94] |
| 23 Head circumference at 2 months post‐term (cm) Show forest plot | 3 | 187 | Mean Difference (IV, Fixed, 95% CI) | 0.03 [‐0.33, 0.38] |
| 24 Growth rate until 3 months post‐term Show forest plot | 1 | 138 | Mean Difference (IV, Fixed, 95% CI) | ‐0.00 [‐0.04, 0.04] |
| 24.1 weight g/d | 1 | 46 | Mean Difference (IV, Fixed, 95% CI) | ‐0.60 [‐3.56, 2.36] |
| 24.2 length cm/w | 1 | 46 | Mean Difference (IV, Fixed, 95% CI) | 0.0 [‐0.06, 0.06] |
| 24.3 head circumference cm/w | 1 | 46 | Mean Difference (IV, Fixed, 95% CI) | 0.0 [‐0.06, 0.06] |
| 25 Weight at 4 months post‐term (kg) Show forest plot | 6 | 489 | Mean Difference (IV, Fixed, 95% CI) | 0.14 [‐0.01, 0.29] |
| 26 Length at 4 months post‐term (cm) Show forest plot | 5 | 299 | Mean Difference (IV, Fixed, 95% CI) | 0.31 [‐0.22, 0.84] |
| 27 Head circumference at 4 months post‐term (cm) Show forest plot | 4 | 198 | Mean Difference (IV, Fixed, 95% CI) | ‐0.09 [‐0.48, 0.30] |
| 28 Weight at 12 months post‐term (kg) Show forest plot | 4 | 271 | Mean Difference (IV, Fixed, 95% CI) | ‐0.10 [‐0.31, 0.12] |
| 29 Length at 12 months post‐term (cm) Show forest plot | 4 | 271 | Mean Difference (IV, Fixed, 95% CI) | 0.25 [‐0.33, 0.84] |
| 30 Head circumference at 12 months post‐term (cm) Show forest plot | 4 | 271 | Mean Difference (IV, Fixed, 95% CI) | ‐0.15 [‐0.53, 0.23] |
| 31 Normalised weight at 12 months post‐term Show forest plot | 2 | 116 | Mean Difference (IV, Fixed, 95% CI) | ‐0.33 [‐0.56, ‐0.09] |
| 32 Normalised length at 12 months post‐term Show forest plot | 2 | 116 | Mean Difference (IV, Fixed, 95% CI) | 0.03 [‐0.16, 0.22] |
| 33 Normalised head circumference at 12 months post‐term Show forest plot | 2 | 116 | Mean Difference (IV, Fixed, 95% CI) | ‐0.14 [‐0.38, 0.10] |
| 34 Lipid peroxidation (TBARS ‐azide/+azide x 100%), 4 months post‐term Show forest plot | 1 | Mean Difference (IV, Fixed, 95% CI) | Totals not selected | |
| 35 RBC fragility (hemolysis with 8% to 10% H2O2) , 4 months post‐term Show forest plot | 1 | Mean Difference (IV, Fixed, 95% CI) | Totals not selected | |
| 36 Infant bleeding time 4 months post‐term (ped device, min) Show forest plot | 1 | Mean Difference (IV, Fixed, 95% CI) | Totals not selected | |
| 37 Bayley MDI at 18 months post‐term Show forest plot | 3 | 494 | Mean Difference (IV, Fixed, 95% CI) | 2.40 [‐0.33, 5.12] |
| 38 Bayley PDI at 18 months post‐term Show forest plot | 3 | 496 | Mean Difference (IV, Fixed, 95% CI) | 0.74 [‐1.90, 3.37] |
| 39 KPS Developmental Screening Inventory at 9 months post‐term (overall quotient) Show forest plot | 1 | 158 | Mean Difference (IV, Fixed, 95% CI) | 1.50 [‐1.70, 4.70] |
| 40 Weight at 9 months post‐term Show forest plot | 2 | 374 | Mean Difference (IV, Fixed, 95% CI) | ‐0.01 [‐0.22, 0.21] |
| 41 Length at 9 months post‐term Show forest plot | 2 | 374 | Mean Difference (IV, Fixed, 95% CI) | 0.02 [‐0.58, 0.61] |
| 42 Head circumference at 9 months post‐term Show forest plot | 2 | 374 | Mean Difference (IV, Fixed, 95% CI) | ‐0.03 [‐0.37, 0.30] |
| 43 Normailsed weight at 9 months post‐term Show forest plot | 1 | 158 | Mean Difference (IV, Fixed, 95% CI) | ‐0.35 [‐0.72, 0.02] |
| 44 Normalised length at 9 months post‐term Show forest plot | 1 | 158 | Mean Difference (IV, Fixed, 95% CI) | ‐0.3 [‐0.69, 0.09] |
| 45 Normalised head circumference at 9 months post‐term Show forest plot | 1 | 158 | Mean Difference (IV, Fixed, 95% CI) | ‐0.10 [‐0.51, 0.31] |
| 46 Weight at 18 months post‐term Show forest plot | 2 | 396 | Mean Difference (IV, Fixed, 95% CI) | ‐0.14 [‐0.39, 0.10] |
| 47 Length at 18 months post‐term Show forest plot | 2 | 396 | Mean Difference (IV, Fixed, 95% CI) | ‐0.28 [‐0.91, 0.35] |
| 48 Head circumference at 18 months post‐term Show forest plot | 2 | 396 | Mean Difference (IV, Fixed, 95% CI) | ‐0.18 [‐0.53, 0.18] |
| 49 Normalised weight at 18 months post‐term Show forest plot | 1 | 158 | Mean Difference (IV, Fixed, 95% CI) | ‐0.33 [‐0.68, 0.02] |
| 50 Normalised length at 18 months post‐term Show forest plot | 1 | 158 | Mean Difference (IV, Fixed, 95% CI) | ‐0.44 [‐0.80, ‐0.08] |
| 51 Normalised head circumference at 18 months post‐term Show forest plot | 1 | 158 | Mean Difference (IV, Fixed, 95% CI) | ‐0.10 [‐0.52, 0.32] |
| 52 Fagan Infant test at 6m post‐term, novelty time (%total time) Show forest plot | 1 | 187 | Mean Difference (IV, Fixed, 95% CI) | ‐0.5 [‐2.64, 1.64] |
| 53 MacArthur Communicative Inventories at 14 months post‐term Show forest plot | 1 | 399 | Mean Difference (IV, Fixed, 95% CI) | 0.34 [‐3.05, 3.72] |
| 53.1 vocab comprehension scores | 1 | 199 | Mean Difference (IV, Fixed, 95% CI) | 1.70 [‐2.96, 6.36] |
| 53.2 vocab production scores | 1 | 200 | Mean Difference (IV, Fixed, 95% CI) | ‐1.20 [‐6.14, 3.74] |
| 54 Bayley MDI at 24 months post‐term Show forest plot | 1 | 42 | Mean Difference (IV, Fixed, 95% CI) | 4.10 [‐8.06, 16.26] |
| 55 Bayley PDI at 24 months post‐term Show forest plot | 1 | 42 | Mean Difference (IV, Fixed, 95% CI) | ‐3.60 [‐12.11, 4.91] |
| 56 Weight at 10 years Show forest plot | 1 | 107 | Mean Difference (IV, Fixed, 95% CI) | 2.30 [‐1.45, 6.06] |
| 56.1 boys | 1 | 51 | Mean Difference (IV, Fixed, 95% CI) | ‐1.43 [‐7.08, 4.22] |
| 56.2 girls | 1 | 56 | Mean Difference (IV, Fixed, 95% CI) | 5.26 [0.23, 10.29] |
| 57 Height at 10 years Show forest plot | 1 | 107 | Mean Difference (IV, Fixed, 95% CI) | 2.38 [‐0.27, 5.03] |
| 57.1 boys | 1 | 51 | Mean Difference (IV, Fixed, 95% CI) | 0.0 [‐4.43, 4.43] |
| 57.2 girls | 1 | 56 | Mean Difference (IV, Fixed, 95% CI) | 3.70 [0.39, 7.01] |
| 58 Head circumference at 10 years Show forest plot | 1 | 107 | Mean Difference (IV, Fixed, 95% CI) | 0.43 [‐0.32, 1.17] |
| 58.1 boys | 1 | 51 | Mean Difference (IV, Fixed, 95% CI) | ‐0.5 [‐1.65, 0.65] |
| 58.2 girls | 1 | 56 | Mean Difference (IV, Fixed, 95% CI) | 1.10 [0.12, 2.08] |