| 1 Patients with an exacerbation of asthma Show forest plot | 2 | 4412 | Risk Difference (M‐H, Fixed, 95% CI) | ‐0.00 [‐0.02, 0.02] |
|
| 1.1 First‐time vaccinees | 2 | 948 | Risk Difference (M‐H, Fixed, 95% CI) | 0.02 [‐0.03, 0.07] |
| 1.2 Repeat vaccinees | 2 | 3464 | Risk Difference (M‐H, Fixed, 95% CI) | ‐0.01 [‐0.03, 0.02] |
| 2 Patients with a fall in PEF of over 30% Show forest plot | 2 | 4252 | Risk Difference (M‐H, Fixed, 95% CI) | 0.00 [‐0.02, 0.03] |
|
| 2.1 First‐time vaccinees | 1 | 194 | Risk Difference (M‐H, Fixed, 95% CI) | 0.06 [0.01, 0.11] |
| 2.2 Repeat vacinees | 1 | 328 | Risk Difference (M‐H, Fixed, 95% CI) | 0.01 [‐0.01, 0.03] |
| 2.3 Vaccination status unspecified | 1 | 3730 | Risk Difference (M‐H, Fixed, 95% CI) | 0.00 [‐0.02, 0.02] |
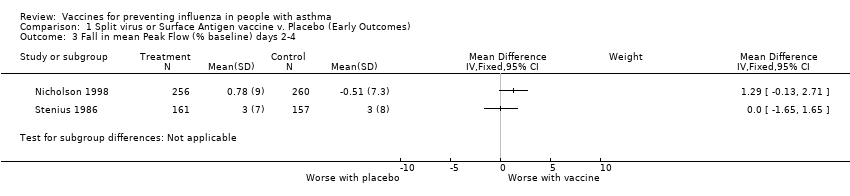
| 3 Fall in mean Peak Flow (% baseline) days 2‐4 Show forest plot | 2 | | Mean Difference (IV, Fixed, 95% CI) | Subtotals only |
|
| 4 Change in airways responsiveness Show forest plot | | | Other data | No numeric data |
|
| 5 Increased nebuliser usage (days 1‐3) Show forest plot | 1 | | Risk Difference (M‐H, Fixed, 95% CI) | Totals not selected |
|
| 6 Increased use of bronchodilators following vaccination (days 1‐3) Show forest plot | 3 | 4228 | Risk Difference (M‐H, Fixed, 95% CI) | ‐0.00 [‐0.02, 0.01] |
|
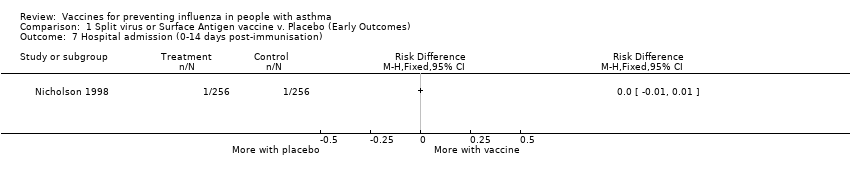
| 7 Hospital admission (0‐14 days post‐immunisation) Show forest plot | 1 | | Risk Difference (M‐H, Fixed, 95% CI) | Totals not selected |
|
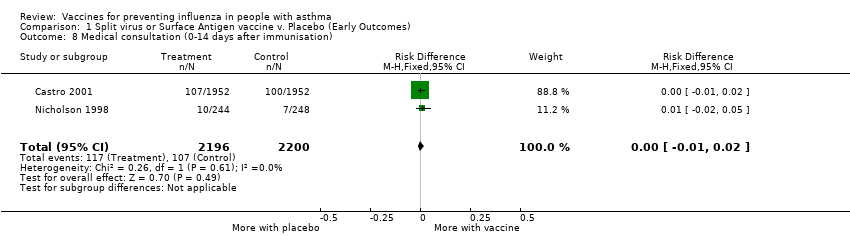
| 8 Medical consultation (0‐14 days after immunisation) Show forest plot | 2 | 4396 | Risk Difference (M‐H, Fixed, 95% CI) | 0.00 [‐0.01, 0.02] |
|
| 9 New or increased oral steroid use (0‐14 days after immunisation) Show forest plot | 2 | 4419 | Risk Difference (M‐H, Fixed, 95% CI) | 0.00 [‐0.01, 0.01] |
|
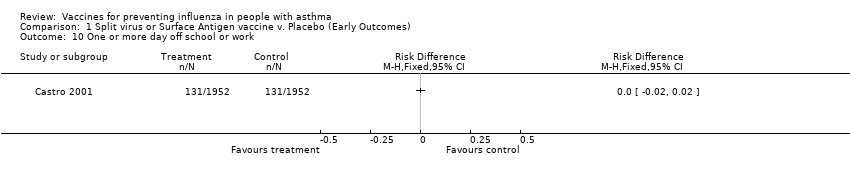
| 10 One or more day off school or work Show forest plot | 1 | | Risk Difference (M‐H, Fixed, 95% CI) | Totals not selected |
|
| 11 Number of symptom free days in fortnight after vaccination Show forest plot | 1 | | Mean Difference (IV, Fixed, 95% CI) | Totals not selected |
|
| 12 Change in asthma symptoms in the week following vaccination. Show forest plot | | | Other data | No numeric data |
|