Enemas durante el trabajo de parto
Resumen
Antecedentes
Aunque la administración de enemas durante el trabajo de parto suele reflejar la preferencia del profesional sanitario que lo atiende, los enemas pueden causar molestias a las mujeres.
Objetivos
Evaluar los efectos de los enemas aplicados durante el periodo de dilatación del trabajo de parto sobre los resultados maternos y neonatales.
Métodos de búsqueda
Se realizaron búsquedas en el Registro de Ensayos del Grupo Cochrane de Embarazo y Parto (31 de mayo 2013), el Registro Cochrane Central de Ensayos Controlados y la Base de Datos de Resúmenes de Revisiones de Efectividad (The Cochrane Library 2013, número 5), PubMed (1966 a 31 de mayo 2013), LILACS (31 de mayo 2013), el portal de búsqueda de la International Clinical Trials Registry Platform (ICTRP) (31 de mayo 2013), Health Technology Assessment Program, Reino Unido (31 de mayo 2013), Medical Research Council, Reino Unido (31 de mayo 2013), The Wellcome Trust, Reino Unido (31 de mayo 2013) y las listas de referencia de los artículos recuperados.
Criterios de selección
Ensayos controlados aleatorizados (ECA) en los que se administraron enemas durante el periodo de dilatación del trabajo de parto y que evaluaron posibles resultados de morbilidad neonatal, o morbilidad puerperal o mortalidad.
Obtención y análisis de los datos
Dos autores de la revisión evaluaron de forma independiente los estudios para su inclusión.
Resultados principales
Cuatro ECA (1917 mujeres) cumplieron los criterios de inclusión. Solo un estudio se consideró con bajo riesgo de sesgo. En el metanálisis que se realizó de dos ensayos no se encontraron diferencias significativas en las tasas de infección para las puérperas (dos ECA; 594 mujeres; riesgo relativo [RR] 0,66; confianza [IC] del 95%: 0,42 a 1,04). No se encontraron diferencias significativas en las tasas de infección umbilical neonatal (dos ECA; 592 mujeres; RR 3,16; IC del 95%: 0,50 a 19,82; I² 0%. Además, el metanálisis de dos estudios mostró que no hubo diferencias significativas en el grado de desgarro perineal entre los grupos. Por último, el metanálisis de dos ensayos no encontró diferencias significativas en la duración media del trabajo de parto.
Conclusiones de los autores
La evidencia proporcionada por los cuatro ECA incluidos muestran que los enemas no tienen un efecto beneficioso significativo sobre las tasas de infección, como la infección de las heridas perineales u otras infecciones neonatales, ni sobre la satisfacción de las mujeres. Estos hallazgos hablan en contra de la administración sistemático de enemas durante el parto, por lo que se debe desalentar dicha práctica.
PICO
Resumen en términos sencillos
Enemas durante el trabajo de parto
La evidencia de la investigación científica no apoya la administración sistemática de enemas durante el periodo de dilatación del trabajo de parto.
Administrar a las mujeres enemas durante el trabajo de parto ha sido una práctica habitual en las salas de parto de muchos países y entornos. Ocasionalmente las mujeres tienen pérdidas a través del ano durante el parto y se pensó que un enema en el trabajo de parto temprano reduciría estas pérdidas de heces y la consiguiente vergüenza para las mujeres. También se pensó que vaciar el intestino daría más espacio para que el bebé naciera, reduciría la duración del trabajo de parto y disminuiría las posibilidades de infección para la madre y para el recién nacido. También se indicó que reduciría las evacuaciones intestinales después del parto, que a menudo preocupan a las mujeres. Las desventajas indicadas fueron que es un procedimiento muy desagradable que causa mayor dolor a las mujeres durante el parto y que, debido a que los enemas podrían producir pérdidas fecales acuosas durante el parto, podrían aumentar potencialmente el riesgo de infecciones. La revisión identificó cinco estudios con 1917 mujeres. Estos estudios no encontraron diferencias significativas en los resultados evaluados para la mujer y para el recién nacido. Sin embargo, ninguno de los ensayos evaluó el dolor de la mujer durante el trabajo de parto y no hubo datos suficientes para evaluar los resultados adversos poco frecuentes. Por lo tanto, la evidencia habla en contra de la administración sistemática de enemas durante el parto.
Authors' conclusions
Background
Enemas are frequently used in obstetric settings depending on the preference of, and the resources available to, the person attending the delivery (Cuervo 2006; Drayton 1984). Several consumer web pages on the Internet widely recommend their use in labour (Curtis 2007; PregnancyWeekly.com). Since this intervention may generate discomfort to women, increase the cost of delivery, and the workload on wards, an evaluation of the effectiveness of enemas during labour is important. A survey that evaluated the use of routine interventions and practices in labour and birth as reported by women in the Maternity Experiences Survey of the Canadian Perinatal Surveillance System found that 5.4% (95% confidence interval 4.7 to 6.0) of women reported having an enema. The authors also found that there were regional variations in rates ranging from 1.9% to 13.0% and that younger (15 to 19 years) and older (aged 40 years and older) women having their first baby, or with lower levels of education and family income were more likely to report having had an enema (Chalmers 2009). Other studies conducted in South East Asia countries (SEA‐ORCHID Study Group 2008), Colombia (Conde‐Agudelo 2008), Brazil (Sodré 2007) and Jordan (Sweidan 2008) found high rates of unnecessary practices of enema in labour. Another study reported that 37% of hospitals (193/521) had a "no enema/suppository" policy on admission in 2003 while 88% (282/322) did have in 2007 (Levitt 2011).
Some researchers (Lopes 2001; Romney 1981) have proposed that enemas should be used because:
(i) they will lessen the degree of contamination of broken skin with faeces, thus reducing puerperal infections;
(ii) women may regard cleaning their bowels as something good;
(iii) they hope that they may diminish neonatal and puerperal infection rates by reducing contamination with faeces;
(iv) for women who have not opened their bowels in the previous 24 hours and have an obviously loaded rectum on initial pelvic examination, bowel movement soon after delivery may cause discomfort with an episiotomy.
Others (Cuervo 2006) have opposed the use of enemas on the basis of:
(i) unproven effectiveness;
(ii) watery faeces may increase contamination, potentially increasing maternal and neonatal infections;
(iii) it is widely accepted that this intervention generates discomfort to women and increases the costs of care.
The effectiveness of enemas has been measured using different maternal and neonatal outcomes such as puerperal (approximate six‐week period lasting from childbirth to the return of normal uterine size) infections and/or neonatal (relating to the first 28 days of life) infections. The duration of follow‐up depends on the measured maternal or neonatal outcome; in one study (Cuervo 2006) the primary outcomes were the diagnosis of infections in newborns or women during the month following delivery.
Enemas may also add to the workload of delivery wards and increase the cost of delivery. Enemas are known to cause discomfort and it is unclear if their potential benefit exceeds their inconvenience, cost and potential harms (Yeat 2011). Rare serious adverse events, such as perforations of the rectosigmoid colon or septic shock induced by cleansing enemas have been reported, usually in older women (Gayer 2002; Paran 1999). Considering that there are opposing views and theories, and uncertainties about the use of this intervention, scientific methods are needed to assess the effects of enemas to allow people to make a well‐informed choice. We considered it was therefore important to assess the effects of enemas used during labour on women and newborn.
Objectives
To assess the effects of enemas applied during the first stage of labour on maternal and neonatal outcomes.
Methods
Criteria for considering studies for this review
Types of studies
Randomised controlled trials comparing the use of enema versus no enema, or comparing different types of enemas.
Types of participants
Women during the first stage of labour.
Types of interventions
Enemas (of high or low volume, soapsuds, saline solutions, medicated or tap water).
Types of outcome measures
We planned to measure the effectiveness of enemas at four to six weeks of birth. However, we also collected data on different follow‐up periods depending on the trialists report.
Primary outcomes
Maternal or neonatal mortality
Puerperal outcomes
-
Complications of episiotomy and perineal tears such as episiotomy dehiscence (splitting of a surgical wound) or infection (i.e. purulent effusion from perineal tears).
-
Endometritis (i.e. fever and purulent vaginal discharge).
Neonatal outcomes
-
Neonatal infections such as: umbilical infection (foul smell with periumbilical erythema (redness of the skin)); respiratory tract infections (any infection of the respiratory tract, i.e. lower and/or upper tract); meningitis (serious inflammation of the meninges); or sepsis (as defined by trialists).
Secondary outcomes
-
Perineal wound repair.
-
Perineal tear/episiotomy wound (not a pre‐specified outcome).
-
Need for any analgesia during labour.
-
Economic outcomes.
-
Duration of labour and its different stages.
-
One‐minute Apgar of the newborn.
-
Five‐minute Apgar of the newborn.
-
Faecal soiling during first stage of labour.
-
Faecal soiling during delivery.
-
Duration of labour and labour stages.
-
Levels of satisfaction of parturients and\or medical staff (not a pre‐specified outcome).
-
Overall pain during labour (not a pre‐specified outcome).
-
Other pelvic Infections (infections involving the tissues or organs in the pelvis i.e. vulvovaginitis, myometritis etc.).
-
Urinary tract infection.
-
Other puerperal infections.
-
Need for systemic antibiotics (maternal and neonatal).
-
Other neonatal infections (not a pre‐specified outcome).
-
Ophthalmic infection (i.e. purulent drainage in the eye after the sixth day of delivery) or dacryocystitis (inflammation of the lacrimal sac).
-
Skin infections (i.e. cellulitis or impetigo).
-
Intestinal infections.
-
Rare serious adverse effects (i.e. perforations of the rectosigmoid colon or septic shock. Not a pre‐specified outcome).
-
Delivery type (caesarean section) (not a pre‐specified outcome).
-
Birthweight (not a pre‐specified outcome).
Search methods for identification of studies
Electronic searches
We searched the Cochrane Pregnancy and Childbirth Group's Trials Register by contacting the Trials Search Co‐ordinator (31 May 2013).
The Cochrane Pregnancy and Childbirth Group’s Trials Register is maintained by the Trials Search Co‐ordinator and contains trials identified from:
-
monthly searches of the Cochrane Central Register of Controlled Trials (CENTRAL);
-
weekly searches of MEDLINE;
-
weekly searches of Embase;
-
handsearches of 30 journals and the proceedings of major conferences;
-
weekly current awareness alerts for a further 44 journals plus monthly BioMed Central email alerts.
Details of the search strategies for CENTRAL, MEDLINE and Embase, the list of handsearched journals and conference proceedings, and the list of journals reviewed via the current awareness service can be found in the ‘Specialized Register’ section within the editorial information about the Cochrane Pregnancy and Childbirth Group.
Trials identified through the searching activities described above are each assigned to a review topic (or topics). The Trials Search Co‐ordinator searches the register for each review using the topic list rather than keywords.
In addition, we searched CENTRAL and the Database of Abstracts of Reviews of Effectiveness (DARE) (The Cochrane Library 2013, Issue 5), PubMed (1966 to 31 May 2013), LILACS (1982 to 31 May 2013) using the search strategy listed in Appendix 1.
In order to further identify ongoing RCTs and unpublished studies, we searched the following databases (31 May 2013).
-
Search Portal of the International Clinical Trials Registry Platform (ICTRP)
-
Health Technology Assessment Program (HTA) [United Kingdom]
-
Medical Research Council [United Kingdom]
-
The Wellcome Trust [United Kingdom]
See:Appendix 1 for search strategy used.
Searching other resources
We also searched the reviews previously published in the Cochrane Pregnancy and Childbirth database on enemas (Hay‐Smith 1995a; Hay‐Smith 1995b; Hay‐Smith 1995c; Hay‐Smith 1995d).
We did not apply any language restrictions.
Data collection and analysis
For the methods to be used to assess trials identified in the future updates, seeAppendix 2.
1. Study selection
One review author, Ludovic Reveiz (LR), checked the titles and abstracts identified from the searches. If it was clear that the study was not a randomised controlled trial (RCT) evaluating enemas in pregnant women during labour, we excluded it. If we were unclear about the above, then two review authors assessed the full report of the study independently (LR and Hernando Gaitan (HG)) to determine if it fulfilled the inclusion criteria. The two authors resolved disagreements by consensus. Otherwise, we would have consulted the third review author (Luis Gabriel Cuervo) but this situation did not happen. The table Characteristics of excluded studies lists the reasons behind the exclusion of trials.
2. Risk of bias assessment
Two review authors (LR, HG) independently assessed risk of bias for each study as described in the Cochrane Handbook for Systematic Reviews of Interventions (Higgins 2011). We planned to resolve disagreements through dialogue leading to consensus and if we could not reach the latter, to invite the third review author to weigh in to decide by majority. We considered the possible sources of bias described below and assessed these in the 'Risk of bias' table for each included study. We classified each one of these sources as of low, high or unclear risk of bias by answering 'yes', 'no' or 'unclear' to each one of the items in the 'Risk of bias' table. Whenever possible, we gave more information about these answers using the 'Description' boxes with a clarifying comment or a quoted sentence taken directly from the original article.
(1) Sequence generation
We described, for each included study, the methods used to generate the allocation sequence in sufficient detail to allow an assessment of whether it produced comparable groups.
(2) Allocation concealment
We described, for each included study, the methods used to conceal the allocation sequence in sufficient detail, and therefore, determined whether the intervention allocation could have been foreseen before, or during recruitment, or changed after assignment.
(3) Blinding of participants, healthcare professionals and outcome assessors
We described, for each included study, the methods used to blind study participants, healthcare professionals and outcome appraisers to the intervention the participant received. We also provided information on whether the intended blinding was effective. If blinding was unclear, we assessed whether the information provided was likely to have introduced bias.
(4) Incomplete outcome data
We described, for each included study the completeness of data. We assessed whether incomplete data were adequately addressed.
(5) Selective reporting
We described, for each included study, the possibility that outcomes were selectively reported.
(6) Other potential sources of bias
We described, for each included study, any important concerns about other possible sources of bias.
(7) Overall risk of bias
We made explicit judgements about whether studies were at high, moderate or low risk of bias, according to the criteria given in the Handbook (Higgins 2011). With reference to (1) to (6) above, we estimated the magnitude and direction of the bias and whether we considered it was likely to have impacted on the findings.
3. Data extraction
Two review authors (LR and HG) carried out data extraction using a pre‐designed data extraction form. We resolved disagreements among all three review authors. We actively sought missing data from authors using their registered contact details, plus complementary Internet searches when needed. We included these data if retrieved.
4. Analysis
To estimate statistical differences between treatments, we pooled the results of RCTs that assessed the effects of similar interventions, and calculated a weighted‐treatment effect across RCTs using the fixed‐effect model. We expressed the results as follows:
-
for dichotomous outcomes: as risk ratio (RR) (RCTs, participants; RR, 95% confidence intervals (CI));
-
for continuous outcomes: as mean difference (MD) (RCTs; participants; MD and 95% CI).
We expressed results as number needed to treat where appropriate. We summarised available information in accordance with the review protocol. We identified and listed quasi‐randomised and non‐randomised controlled studies for reference, but we did not discuss them further. To provide a better balance of information, we also included qualitative descriptions of available information on adverse effects, when possible. We reported results as rate ratios. We imputed conservative standard deviations where necessary using the P value from an independent two‐sample T‐test (Higgins 2011). For the pooled analysis, we calculated the I² statistic, which describes the percentage of total variation across studies caused by heterogeneity; less than 25% was considered as low level heterogeneity; 25% to 50% as moderate level, and higher than 50% as high level heterogeneity (Higgins 2011).
Results
Description of studies
Results of the search
The search identified 102 references. An initial trawl through this list, undertaken by two review authors, excluded 90 references that did not comply with the inclusion criteria. We screened 12 trials: we excluded eight and included four RCTs that recruited a total of 1917 women. For this update we did not identify any additional trials for inclusion. The search of clinical trial registers (International Clinical Trials Registry Platform) identified 78 trials but found no ongoing RCTs complying with the inclusion criteria.
Included studies
Drayton 1984: the RCT was conducted at the University Hospital of Wales, Cardiff (UK). The characteristics of participating women are poorly described. Inclusion criteria were fulfilled by 370 women invited to participate, of whom 222 (60%) agreed to randomisation. The intervention group received a low‐volume disposable phosphate enema during the first stage of labour. Caesarean section rates were not described in this study. Randomisation was stratified between primigravidae (43%) and multigravidae (57%).
Kovavisarach 2005: this RCT was conducted in Thailand; 1100 term‐pregnant women admitted for delivery were randomly allocated to receive either enema or no enema (539 participants to enema and 561 participants to no enema) from 1 February 2002 to 15 June 2002. Stratification by parity was not done. Seventy‐three women, who delivered by caesarean section due to obstetric indications after an unsuccessful trial of labour were excluded (39 with enema versus 34 with no enema). Newborns were followed up for four days through clinical observation during hospitalisation to assess neonatal infections. We were unable to reach the authors by e‐mail when we sought additional information. The authors measured satisfaction level in pregnant women and medical staff with Likert scales with scores ranked as: excellent, good, average, fair or poor.
Cuervo 2006: this RCT was conducted in a tertiary care referral hospital in Bogota, Colombia. Of the women invited to participate, 16 were not eligible and one declined to participate. In total, 443 women were randomised, achieving well‐balanced groups (221 allocated to enema versus 222 to control) from February 1997 to February 1998. Twelve per cent of the participants had a caesarean section. Stratification by parity was done. The RCT did not evaluate women's preferences or known adverse effects of enemas, such as pain, discomfort, embarrassment or diarrhoea.
Clarke 2007: this RCT was conducted in the United States; 152 pregnant women admitted for delivery were randomly allocated to receive either standardised enema soap solution within 30 minutes of enrolment or no enema (75 women to enema and 77 to no enema). The characteristics of participating women are poorly described. The primary outcome was the time interval from enrolment to delivery. Secondary outcomes included intrapartum infection rate, faecal soiling at delivery, mode of delivery and patient satisfaction.
Excluded studies
Eight studies were excluded from the review for different reasons including non‐randomised studies, inadequate randomisation, different type of participants or interventions (see Excluded studies).
Risk of bias in included studies
Allocation
The allocation strategy and the method of allocation concealment were considered adequate for one trial (Cuervo 2006) and unclear for the other three (Clarke 2007; Drayton 1984; Kovavisarach 2005).
Blinding
Blinding was not used in any of the four trials.
Incomplete outcome data
Two studies were considered to have low risk of bias (Cuervo 2006; Kovavisarach 2005) while the other two had an unclear risk of bias (Clarke 2007; Drayton 1984).
Selective reporting
The study protocol was not available for any of the studies.
Other potential sources of bias
One study had a high risk of bias (Drayton 1984), while one was judged as having unclear (Clarke 2007) and two low risk of bias (Cuervo 2006; Kovavisarach 2005).
Overall, only one study was judged as having low risk of bias (Cuervo 2006). A brief description is provided for each study (see Figure 1; Figure 2). For more details, seeRisk of bias in included studies.

'Risk of bias' graph: review authors' judgements about each risk of bias item presented as percentages across all included studies.
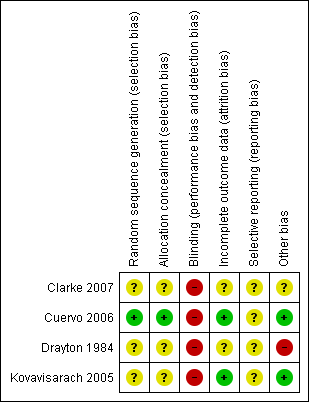
'Risk of bias' summary: review authors' judgements about each risk of bias item for each included study.
Effects of interventions
Enema versus no enema
Four trials, involving 1917 women, fulfilled the inclusion criteria for the review: Drayton 1984, (222 women); Kovavisarach 2005, (1100 women); Cuervo 2006, (443 women) and Clarke 2007 (152 women). Findings of individual trials are found in Table 1.
| Study ID | Comments |
| The RCT from Wales investigated the incidence of maternal and neonatal infections. None of the women had a perineal wound infection. Regarding neonatal infections, no significant differences were found between the enema and the no‐enema groups (one RCT; 222 women; risk ratio (RR) 0.89, 95% confidence interval (CI) 0.31 to 2.56; Analysis 1.2). The RCT also evaluated women's views on enemas. In the no‐enema group, 14.1% of women willingly accepted to receive a future enema compared to 39.6% in the enema group (P < 0.01). | |
| In the trial from Thailand, the duration of labour was shorter in the enema group (1027 women; 409.4 minutes versus 459.8 minutes; mean difference (MD) ‐50.40, 95% CI ‐75.68 to ‐25.12; P < 0.001; Analysis 1.21) but no adjustment was done by parity. No significant differences were found in the route of delivery, degree of perineal tear and perineal wound infection rates. No neonatal infections occurred during the four‐day follow‐up, which seems a short time to identify infections comprehensively. No significant differences were found with regard to satisfaction between women receiving an enema versus those not receiving an enema, as assessed using a five‐point Likert scale (1027 women; 3.58 versus 3.58; MD 0.00, CI 95% ‐0.10 to 0.10; P = 0.922; Analysis 1.23). Satisfaction levels of labour attendants and healthcare providers were significantly higher in the enema group (P < 0.01) than in the control group (measured using the Likert scale). | |
| The trial from Colombia investigated the effect of enemas on labour duration adjusted by parity. It found no statistically significant differences between groups for delivery types, episiotomy rates, or prescription of antibiotics. No significant differences were found in lower and upper respiratory tract infections rates. Similarly, no significant differences were found for ophthalmic infection rates, skin infections, or intestinal infections. The authors reported no significant differences in the distribution between groups for newborns' "Ballard" score, birthweight, diagnosis of neonatal apnoea, or the administration of ocular and umbilical prophylaxis. Twelve per cent of women had caesarean sections with no significant differences in rates between groups. In addition, no significant differences were found for the duration of labour (for all women for first stage of labour: median 515 minutes with enemas versus 585 minutes without enemas, P = 0.24; for second stage of labour: mean 43.2 minutes with enemas and 38 minutes without; MD 5.20, 95% CI ‐2.56 to 12.96; P=0.19; Analysis 1.22). These results could not be aggregated with the RCT from Thailand (Kovavisarach 2005) as times did not follow a normal distribution and, therefore, trialists considered non‐parametric measures (differences between medians). Finally, there were no significant difference in the degree of perineal tear between groups. The Colombian RCT found no significant differences between groups in the rate of neonatal infection after one month of follow‐up (370 newborns; RR 1.12, 95% CI 0.76 to 1.67; Analysis 1.4) | |
| In the trial from the United States, the mean times to delivery were 504.7 minutes and 392.7 minutes for enema and no enema respectively (152 women; MD 112, 95% CI 48.13 to 175.87; Analysis 1.21); we estimated the standard deviations because these were not provided by the researchers. Intrapartum infection rates were significantly higher in the enema group (RR 4.62, 95% CI 1.03 to 20.68; Analysis 1.33). However, when controlling for duration of membrane rupture, enema use fell below the level of significance for infection (no data was provided by trialists). Women who received enemas had significantly less faecal soiling at delivery (RR 0.36, 95% CI 0.17 to 0.75; Analysis 1.20). There was no significant difference in the mode of delivery between the two groups. No neonatal outcomes were reported. |
RCT: randomised controlled trial
Primary outcomes
No significant differences were found in neonatal umbilical infection rates (two RCTs ; 592 women; risk ratio (RR) 3.16, 95% confidence interval (CI) 0.50 to 19.82; I² 0%; Analysis 1.5). However, these results should be interpreted with caution as one of the studies (Drayton 1984) did not report time of follow‐up of participants and did not describe the means to assess infections.
No significant differences were found for any other primary outcomes.
Secondary outcomes
In meta‐analyses of two studies there were no significant differences in the degree of perineal tear between groups (Cuervo 2006; Kovavisarach 2005) (Analysis 1.10; Analysis 1.12). In the meta‐analysis we conducted of two trials (Cuervo 2006; Drayton 1984), we found no significant difference in infection rates for puerperal women (two RCTs; 594 women; RR 0.66, 95% CI 0.42 to 1.04; Analysis 1.32). Finally, meta‐analysis of two trials (Clarke 2007; Kovavisarach 2005) found no significant differences in the mean duration of labour (Analysis 1.21); however heterogeneity was very high (I² 95%).
There was less faecal soiling (one RCT; 152 women; RR 0.36, 95% CI 0.17 to 0.75; Analysis 1.20), higher satisfaction levels of labour attendants, accoucheurs and perineorrhaphy operators (one RCT; 1027 women; mean difference (MD) 0.17, 95% 0.08 to 0.26; MD 0.26, 95% 015 to 0.37; MD 0.11, 95% 0.02 to 0.20; Analysis 1.24; Analysis 1.25; Analysis 1.26) and more intrapartum infection rates (one RCT; 152 women; RR 4.62, 95% CI 1.03 to 20.68; Analysis 1.33) in the group of women randomised to receive enemas compared to those that did not.
No significant differences were found for any other secondary outcomes.
The four RCTs did not report any serious adverse event.
Enema versus different type of enema
No trials were found.
Discussion
Summary of main results
The objective of this review was to address the effects of enemas during the first stage of labour. The use of enema does not result in improved maternal or neonatal outcomes: there was no difference in the rate of infection, such as perineal wound infection and neonatal infection. Pooled results of two trials (Cuervo 2006; Drayton 1984) found no significant difference in infection rates for puerperal women, in the rate of neonatal umbilical infection, differences in the degree of perineal tear between groups (Cuervo 2006; Kovavisarach 2005) or in the mean duration of labour (Cuervo 2006; Kovavisarach 2005).
Quality of the evidence
The quality of the evidence available for comparisons was high to moderate, mainly because there were only one or two studies for each treatment comparison and main results were imprecise in some cases, as reflected in wide confidence intervals.
Even though blinding of outcome assessors was not done, it is unlikely that this had any influence on the assessment of objective outcome measures most relevant to patients, specifically, infection outcomes. However, other subjective outcomes such as levels of satisfaction, could be open to biased assessments. Similarly, the selection of patients by the recruiter may have been influenced by the lack of allocation concealment in three of the four studies.
Potential biases in the review process
It is unlikely that publication bias is an issue, given that all included studies presented results not favourable for the more active interventions. Also, the search strategy was very comprehensive, including a search of the most important clinical trials registers. Contact with the authors of the included studies was made, and data were analysed and extracted independently by at least two review authors.
All relevant data for the objectives of this review were available from the publications of included studies. However, given that there was not an increased risk of specific types of infection with the interventions, it might be more relevant to use outcomes that reflect severity and timing of infection, rather than specific infections (i.e. whether before or after discharge from hospital after birth, need for antibiotics, or admission to special care). We will address this issue in the next update.
Agreements and disagreements with other studies or reviews
Our review provides evidence derived from four trials using different outcomes. The findings provide grounds against the routine administration of enemas during labour. These are in line with the findings from quasi‐experimental studies (Lopes 2001; Tzeng 2005). The results suggest that it is unlikely that enemas have any beneficial effects on clinical outcomes large enough to outweigh the inconvenience, costs or potential adverse effects.
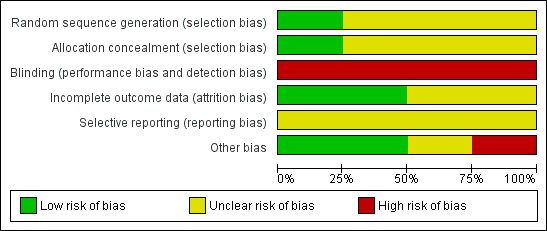
'Risk of bias' graph: review authors' judgements about each risk of bias item presented as percentages across all included studies.

'Risk of bias' summary: review authors' judgements about each risk of bias item for each included study.

Comparison 1 Enema versus no enema, Outcome 1 Episiotomy dehiscence.

Comparison 1 Enema versus no enema, Outcome 2 Neonatal infection (all infections, including umbilical).
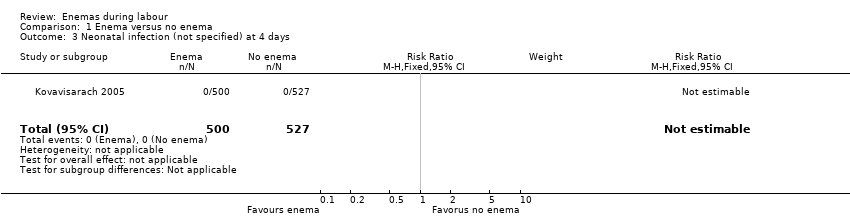
Comparison 1 Enema versus no enema, Outcome 3 Neonatal infection (not specified) at 4 days.

Comparison 1 Enema versus no enema, Outcome 4 Neonatal Infection (any infectious outcome, during the first month of life).

Comparison 1 Enema versus no enema, Outcome 5 Neonatal infection: umbilical infection.
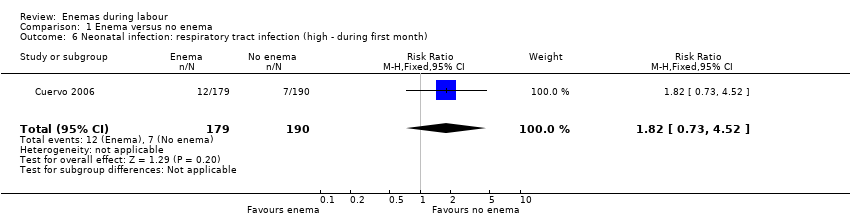
Comparison 1 Enema versus no enema, Outcome 6 Neonatal infection: respiratory tract infection (high ‐ during first month).
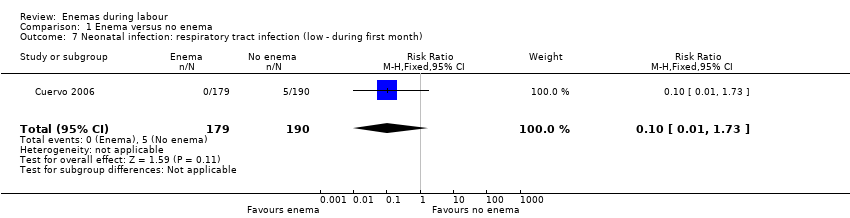
Comparison 1 Enema versus no enema, Outcome 7 Neonatal infection: respiratory tract infection (low ‐ during first month).

Comparison 1 Enema versus no enema, Outcome 8 Neonatal infection: meningitis.

Comparison 1 Enema versus no enema, Outcome 9 Neontal infection: sepsis.
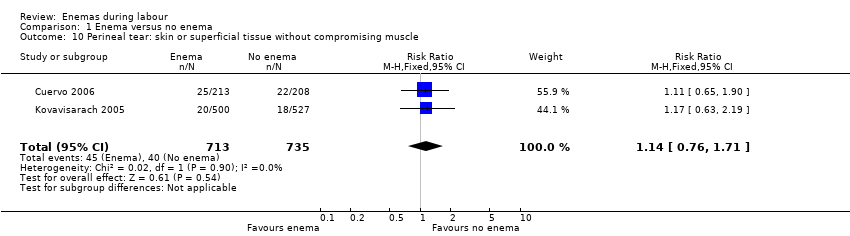
Comparison 1 Enema versus no enema, Outcome 10 Perineal tear: skin or superficial tissue without compromising muscle.
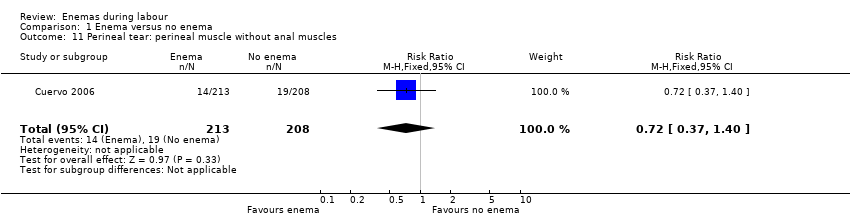
Comparison 1 Enema versus no enema, Outcome 11 Perineal tear: perineal muscle without anal muscles.
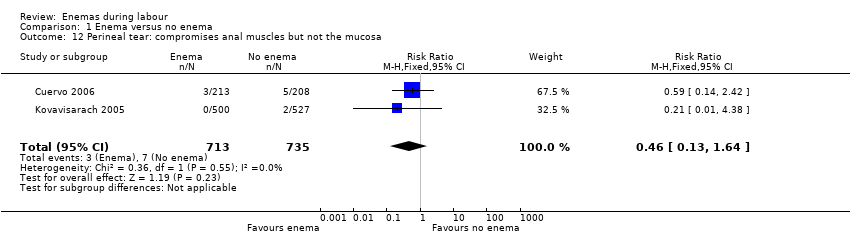
Comparison 1 Enema versus no enema, Outcome 12 Perineal tear: compromises anal muscles but not the mucosa.
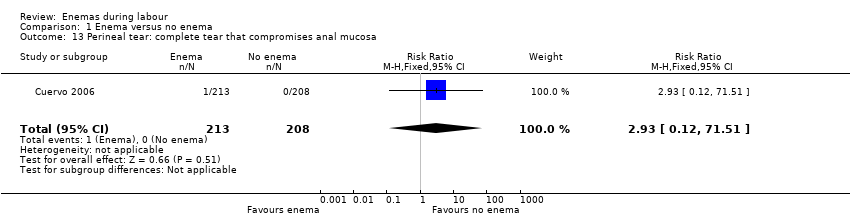
Comparison 1 Enema versus no enema, Outcome 13 Perineal tear: complete tear that compromises anal mucosa.

Comparison 1 Enema versus no enema, Outcome 14 No episiotomy wound ‐ no further tear.

Comparison 1 Enema versus no enema, Outcome 15 No episiotomy wound ‐ further tear: 1st degree tear.
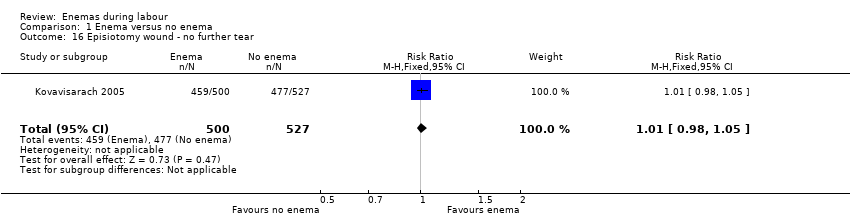
Comparison 1 Enema versus no enema, Outcome 16 Episiotomy wound ‐ no further tear.

Comparison 1 Enema versus no enema, Outcome 17 Episiotomy wound ‐ further tear: 3rd degree tear.

Comparison 1 Enema versus no enema, Outcome 18 One‐minute Apgar < 7.
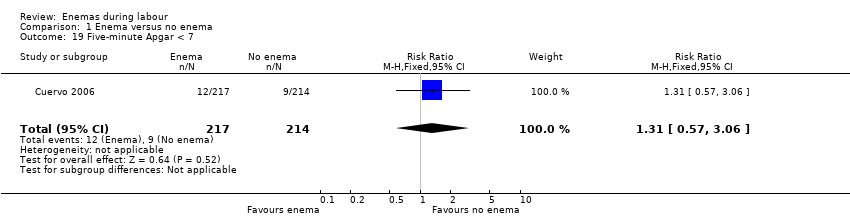
Comparison 1 Enema versus no enema, Outcome 19 Five‐minute Apgar < 7.

Comparison 1 Enema versus no enema, Outcome 20 Faecal soiling during delivery.

Comparison 1 Enema versus no enema, Outcome 21 Duration of labour (minutes).

Comparison 1 Enema versus no enema, Outcome 22 Duration of labour (second stage).
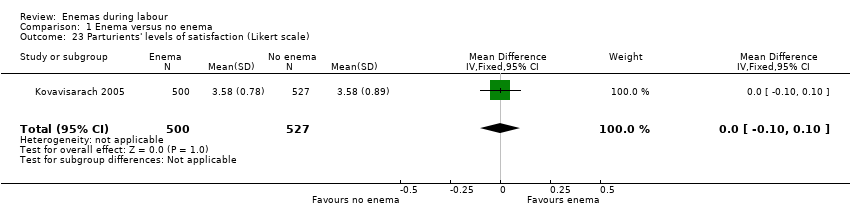
Comparison 1 Enema versus no enema, Outcome 23 Parturients' levels of satisfaction (Likert scale).
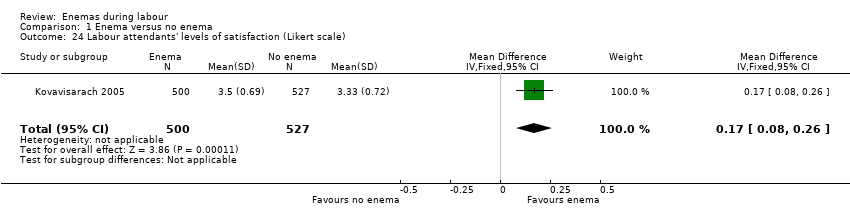
Comparison 1 Enema versus no enema, Outcome 24 Labour attendants' levels of satisfaction (Likert scale).
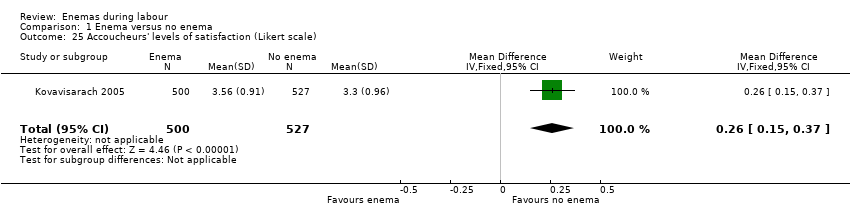
Comparison 1 Enema versus no enema, Outcome 25 Accoucheurs' levels of satisfaction (Likert scale).

Comparison 1 Enema versus no enema, Outcome 26 Perineorrhaphy operators' levels of satisfaction (Likert scale).

Comparison 1 Enema versus no enema, Outcome 27 Pelvic infection: infected episiotomy.
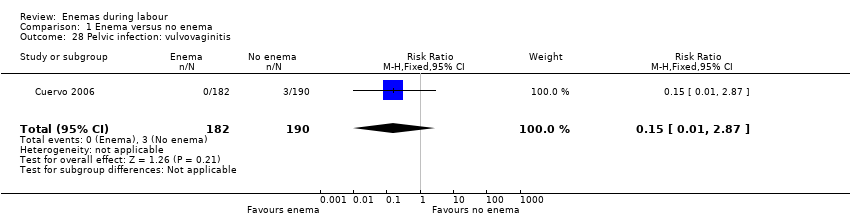
Comparison 1 Enema versus no enema, Outcome 28 Pelvic infection: vulvovaginitis.
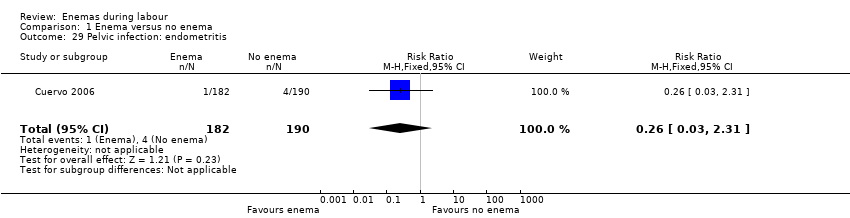
Comparison 1 Enema versus no enema, Outcome 29 Pelvic infection: endometritis.

Comparison 1 Enema versus no enema, Outcome 30 Pelvic infection: myometritis.
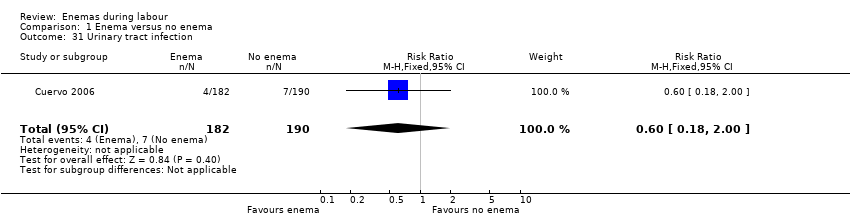
Comparison 1 Enema versus no enema, Outcome 31 Urinary tract infection.
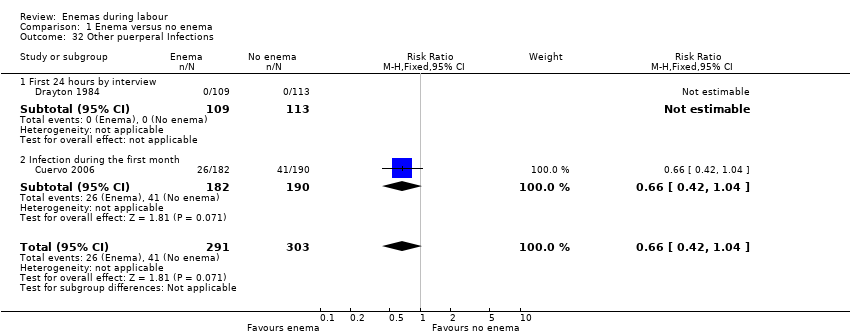
Comparison 1 Enema versus no enema, Outcome 32 Other puerperal Infections.

Comparison 1 Enema versus no enema, Outcome 33 Other puerperal infections: Intrapartum infection rates.
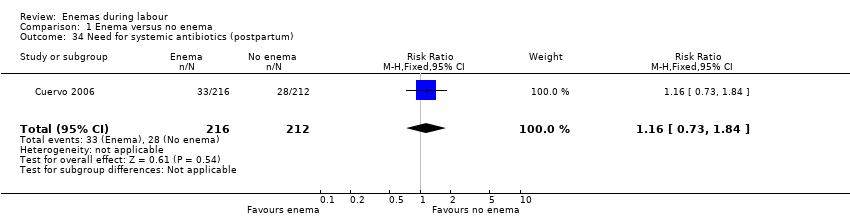
Comparison 1 Enema versus no enema, Outcome 34 Need for systemic antibiotics (postpartum).
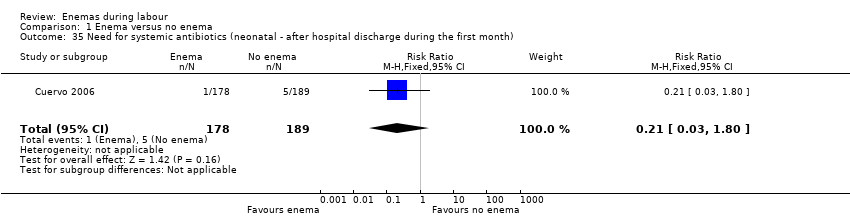
Comparison 1 Enema versus no enema, Outcome 35 Need for systemic antibiotics (neonatal ‐ after hospital discharge during the first month).

Comparison 1 Enema versus no enema, Outcome 36 Opthalmic infection (dacriocistitis or conjunctivitis in first month).
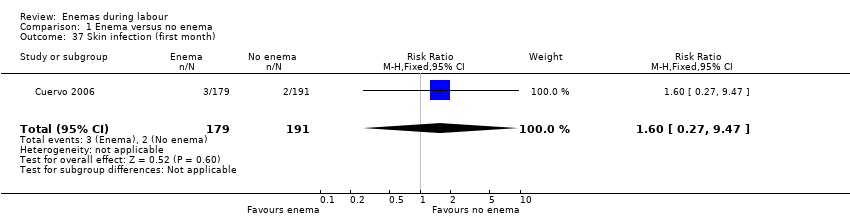
Comparison 1 Enema versus no enema, Outcome 37 Skin infection (first month).

Comparison 1 Enema versus no enema, Outcome 38 Intestinal infection.
| Study ID | Comments |
| The RCT from Wales investigated the incidence of maternal and neonatal infections. None of the women had a perineal wound infection. Regarding neonatal infections, no significant differences were found between the enema and the no‐enema groups (one RCT; 222 women; risk ratio (RR) 0.89, 95% confidence interval (CI) 0.31 to 2.56; Analysis 1.2). The RCT also evaluated women's views on enemas. In the no‐enema group, 14.1% of women willingly accepted to receive a future enema compared to 39.6% in the enema group (P < 0.01). | |
| In the trial from Thailand, the duration of labour was shorter in the enema group (1027 women; 409.4 minutes versus 459.8 minutes; mean difference (MD) ‐50.40, 95% CI ‐75.68 to ‐25.12; P < 0.001; Analysis 1.21) but no adjustment was done by parity. No significant differences were found in the route of delivery, degree of perineal tear and perineal wound infection rates. No neonatal infections occurred during the four‐day follow‐up, which seems a short time to identify infections comprehensively. No significant differences were found with regard to satisfaction between women receiving an enema versus those not receiving an enema, as assessed using a five‐point Likert scale (1027 women; 3.58 versus 3.58; MD 0.00, CI 95% ‐0.10 to 0.10; P = 0.922; Analysis 1.23). Satisfaction levels of labour attendants and healthcare providers were significantly higher in the enema group (P < 0.01) than in the control group (measured using the Likert scale). | |
| The trial from Colombia investigated the effect of enemas on labour duration adjusted by parity. It found no statistically significant differences between groups for delivery types, episiotomy rates, or prescription of antibiotics. No significant differences were found in lower and upper respiratory tract infections rates. Similarly, no significant differences were found for ophthalmic infection rates, skin infections, or intestinal infections. The authors reported no significant differences in the distribution between groups for newborns' "Ballard" score, birthweight, diagnosis of neonatal apnoea, or the administration of ocular and umbilical prophylaxis. Twelve per cent of women had caesarean sections with no significant differences in rates between groups. In addition, no significant differences were found for the duration of labour (for all women for first stage of labour: median 515 minutes with enemas versus 585 minutes without enemas, P = 0.24; for second stage of labour: mean 43.2 minutes with enemas and 38 minutes without; MD 5.20, 95% CI ‐2.56 to 12.96; P=0.19; Analysis 1.22). These results could not be aggregated with the RCT from Thailand (Kovavisarach 2005) as times did not follow a normal distribution and, therefore, trialists considered non‐parametric measures (differences between medians). Finally, there were no significant difference in the degree of perineal tear between groups. The Colombian RCT found no significant differences between groups in the rate of neonatal infection after one month of follow‐up (370 newborns; RR 1.12, 95% CI 0.76 to 1.67; Analysis 1.4) | |
| In the trial from the United States, the mean times to delivery were 504.7 minutes and 392.7 minutes for enema and no enema respectively (152 women; MD 112, 95% CI 48.13 to 175.87; Analysis 1.21); we estimated the standard deviations because these were not provided by the researchers. Intrapartum infection rates were significantly higher in the enema group (RR 4.62, 95% CI 1.03 to 20.68; Analysis 1.33). However, when controlling for duration of membrane rupture, enema use fell below the level of significance for infection (no data was provided by trialists). Women who received enemas had significantly less faecal soiling at delivery (RR 0.36, 95% CI 0.17 to 0.75; Analysis 1.20). There was no significant difference in the mode of delivery between the two groups. No neonatal outcomes were reported. | |
| RCT: randomised controlled trial | |
| Outcome or subgroup title | No. of studies | No. of participants | Statistical method | Effect size |
| 1 Episiotomy dehiscence Show forest plot | 1 | 372 | Risk Ratio (M‐H, Fixed, 95% CI) | 0.69 [0.41, 1.14] |
| 2 Neonatal infection (all infections, including umbilical) Show forest plot | 1 | 222 | Risk Ratio (M‐H, Fixed, 95% CI) | 0.89 [0.31, 2.56] |
| 3 Neonatal infection (not specified) at 4 days Show forest plot | 1 | 1027 | Risk Ratio (M‐H, Fixed, 95% CI) | 0.0 [0.0, 0.0] |
| 4 Neonatal Infection (any infectious outcome, during the first month of life) Show forest plot | 1 | 370 | Risk Ratio (M‐H, Fixed, 95% CI) | 1.12 [0.76, 1.67] |
| 5 Neonatal infection: umbilical infection Show forest plot | 2 | 592 | Risk Ratio (M‐H, Fixed, 95% CI) | 3.16 [0.50, 19.82] |
| 6 Neonatal infection: respiratory tract infection (high ‐ during first month) Show forest plot | 1 | 369 | Risk Ratio (M‐H, Fixed, 95% CI) | 1.82 [0.73, 4.52] |
| 7 Neonatal infection: respiratory tract infection (low ‐ during first month) Show forest plot | 1 | 369 | Risk Ratio (M‐H, Fixed, 95% CI) | 0.10 [0.01, 1.73] |
| 8 Neonatal infection: meningitis Show forest plot | 1 | 370 | Risk Ratio (M‐H, Fixed, 95% CI) | 0.0 [0.0, 0.0] |
| 9 Neontal infection: sepsis Show forest plot | 1 | 370 | Risk Ratio (M‐H, Fixed, 95% CI) | 0.0 [0.0, 0.0] |
| 10 Perineal tear: skin or superficial tissue without compromising muscle Show forest plot | 2 | 1448 | Risk Ratio (M‐H, Fixed, 95% CI) | 1.14 [0.76, 1.71] |
| 11 Perineal tear: perineal muscle without anal muscles Show forest plot | 1 | 421 | Risk Ratio (M‐H, Fixed, 95% CI) | 0.72 [0.37, 1.40] |
| 12 Perineal tear: compromises anal muscles but not the mucosa Show forest plot | 2 | 1448 | Risk Ratio (M‐H, Fixed, 95% CI) | 0.46 [0.13, 1.64] |
| 13 Perineal tear: complete tear that compromises anal mucosa Show forest plot | 1 | 421 | Risk Ratio (M‐H, Fixed, 95% CI) | 2.93 [0.12, 71.51] |
| 14 No episiotomy wound ‐ no further tear Show forest plot | 1 | 1027 | Risk Ratio (M‐H, Fixed, 95% CI) | 0.74 [0.43, 1.27] |
| 15 No episiotomy wound ‐ further tear: 1st degree tear Show forest plot | 1 | 1027 | Risk Ratio (M‐H, Fixed, 95% CI) | 1.17 [0.63, 2.19] |
| 16 Episiotomy wound ‐ no further tear Show forest plot | 1 | 1027 | Risk Ratio (M‐H, Fixed, 95% CI) | 1.01 [0.98, 1.05] |
| 17 Episiotomy wound ‐ further tear: 3rd degree tear Show forest plot | 1 | 1027 | Risk Ratio (M‐H, Fixed, 95% CI) | 0.21 [0.01, 4.38] |
| 18 One‐minute Apgar < 7 Show forest plot | 1 | 431 | Risk Ratio (M‐H, Fixed, 95% CI) | 1.31 [0.57, 3.06] |
| 19 Five‐minute Apgar < 7 Show forest plot | 1 | 431 | Risk Ratio (M‐H, Fixed, 95% CI) | 1.31 [0.57, 3.06] |
| 20 Faecal soiling during delivery Show forest plot | 1 | 152 | Risk Ratio (M‐H, Fixed, 95% CI) | 0.36 [0.17, 0.75] |
| 21 Duration of labour (minutes) Show forest plot | 2 | 1179 | Mean Difference (IV, Random, 95% CI) | 28.04 [‐131.01, 187.10] |
| 22 Duration of labour (second stage) Show forest plot | 1 | 347 | Mean Difference (IV, Fixed, 95% CI) | 5.20 [‐2.56, 12.96] |
| 23 Parturients' levels of satisfaction (Likert scale) Show forest plot | 1 | 1027 | Mean Difference (IV, Fixed, 95% CI) | 0.0 [‐0.10, 0.10] |
| 24 Labour attendants' levels of satisfaction (Likert scale) Show forest plot | 1 | 1027 | Mean Difference (IV, Fixed, 95% CI) | 0.17 [0.08, 0.26] |
| 25 Accoucheurs' levels of satisfaction (Likert scale) Show forest plot | 1 | 1027 | Mean Difference (IV, Fixed, 95% CI) | 0.26 [0.15, 0.37] |
| 26 Perineorrhaphy operators' levels of satisfaction (Likert scale) Show forest plot | 1 | 1027 | Mean Difference (IV, Fixed, 95% CI) | 0.11 [0.02, 0.20] |
| 27 Pelvic infection: infected episiotomy Show forest plot | 1 | 372 | Risk Ratio (M‐H, Fixed, 95% CI) | 0.60 [0.18, 2.00] |
| 28 Pelvic infection: vulvovaginitis Show forest plot | 1 | 372 | Risk Ratio (M‐H, Fixed, 95% CI) | 0.15 [0.01, 2.87] |
| 29 Pelvic infection: endometritis Show forest plot | 1 | 372 | Risk Ratio (M‐H, Fixed, 95% CI) | 0.26 [0.03, 2.31] |
| 30 Pelvic infection: myometritis Show forest plot | 1 | 372 | Risk Ratio (M‐H, Fixed, 95% CI) | 3.13 [0.13, 76.37] |
| 31 Urinary tract infection Show forest plot | 1 | 372 | Risk Ratio (M‐H, Fixed, 95% CI) | 0.60 [0.18, 2.00] |
| 32 Other puerperal Infections Show forest plot | 2 | 594 | Risk Ratio (M‐H, Fixed, 95% CI) | 0.66 [0.42, 1.04] |
| 32.1 First 24 hours by interview | 1 | 222 | Risk Ratio (M‐H, Fixed, 95% CI) | 0.0 [0.0, 0.0] |
| 32.2 Infection during the first month | 1 | 372 | Risk Ratio (M‐H, Fixed, 95% CI) | 0.66 [0.42, 1.04] |
| 33 Other puerperal infections: Intrapartum infection rates Show forest plot | 1 | 152 | Risk Ratio (M‐H, Fixed, 95% CI) | 4.62 [1.03, 20.68] |
| 34 Need for systemic antibiotics (postpartum) Show forest plot | 1 | 428 | Risk Ratio (M‐H, Fixed, 95% CI) | 1.16 [0.73, 1.84] |
| 35 Need for systemic antibiotics (neonatal ‐ after hospital discharge during the first month) Show forest plot | 1 | 367 | Risk Ratio (M‐H, Fixed, 95% CI) | 0.21 [0.03, 1.80] |
| 36 Opthalmic infection (dacriocistitis or conjunctivitis in first month) Show forest plot | 1 | 370 | Risk Ratio (M‐H, Fixed, 95% CI) | 1.03 [0.62, 1.71] |
| 37 Skin infection (first month) Show forest plot | 1 | 370 | Risk Ratio (M‐H, Fixed, 95% CI) | 1.60 [0.27, 9.47] |
| 38 Intestinal infection Show forest plot | 1 | 368 | Risk Ratio (M‐H, Fixed, 95% CI) | 1.07 [0.07, 16.94] |