Enemas during labour
Information
- DOI:
- https://doi.org/10.1002/14651858.CD000330.pub4Copy DOI

- Database:
-
- Cochrane Database of Systematic Reviews
- Version published:
-
- 22 July 2013see what's new
- Type:
-
- Intervention
- Stage:
-
- Review
- Cochrane Editorial Group:
-
Cochrane Pregnancy and Childbirth Group
- Copyright:
-
- Copyright © 2013 The Cochrane Collaboration. Published by John Wiley & Sons, Ltd.
Article metrics
Altmetric:
Cited by:
Authors
Contributions of authors
All authors approved the final version of the 2013 update.
Ludovic Reveiz assessed the identified papers, drafted the conclusions and contributed to the writing of the review. He ensured the appropriate use of the statistical tests used and extracted the data. Ludovic Reveiz is now the guarantor of the review.
Hernando Gaitan assessed the identified papers, drafted the conclusions and contributed to the writing of the review.
Luis Gabriel Cuervo led the development of the first version and the first update of the review and commented on drafts of this update.
Declarations of interest
Dr Luis Gabriel Cuervo conducted a randomised controlled trial included in this review. His study fulfilled the inclusion criteria for this review. For this review, he was not involved in the selection of studies or in the appraisal of his study. Information from this study was independently collected and appraised by the other review authors.
Acknowledgements
We would like to thank Lynn Hampson for her assistance with the search for trials and Sonja Henderson, Denise Atherton and Rebecca Smyth from the Cochrane Pregnancy and Childbirth Group.
This review is published as a Cochrane Review in the Cochrane Database of Systematic Reviews 2013, Issue 7. Cochrane Reviews are regularly updated as new evidence emerges and in response to comments and criticisms, and the Cochrane Database of Systematic Reviews should be consulted for the most recent version of the Review.
The Pan American Health Organization and Hernando G Gaitán retain copyright and all other rights in their respective contributions to the manuscript of this Review as submitted for publication.
The National Institute for Health Research (NIHR) is the largest single funder of the Cochrane Pregnancy and Childbirth Group. The views and opinions expressed therein are those of the authors and do not necessarily reflect those of the NIHR, NHS or the Department of Health.
Version history
| Published | Title | Stage | Authors | Version |
| 2013 Jul 22 | Enemas during labour | Review | Ludovic Reveiz, Hernando G Gaitán, Luis Gabriel Cuervo | |
| 2013 May 31 | Enemas during labour | Review | Ludovic Reveiz, Hernando G Gaitán, Luis Gabriel Cuervo | |
| 2007 Oct 17 | Enemas during labour | Review | Ludovic Reveiz, Hernando G Gaitán, Luis Gabriel Cuervo | |
| 1999 Oct 25 | Enemas during labour | Review | L G Cuervo, M N Rodríguez, M B Delgado, Luis Gabriel Cuervo‐Amore | |
Differences between protocol and review
Levels of satisfaction of parturients and medical staff, delivery types (caesarean section), other neonatal infections, perineal tear/episiotomy wound, serious adverse effects, respiratory infection, overall pain during labour and birthweight were not pre‐specified outcomes but were included in the review as secondary outcomes.
Keywords
MeSH
Medical Subject Headings (MeSH) Keywords
Medical Subject Headings Check Words
Female; Humans; Pregnancy;
PICOs

'Risk of bias' graph: review authors' judgements about each risk of bias item presented as percentages across all included studies.
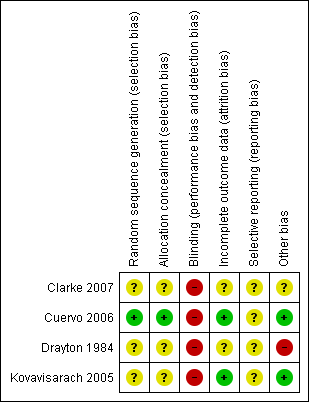
'Risk of bias' summary: review authors' judgements about each risk of bias item for each included study.

Comparison 1 Enema versus no enema, Outcome 1 Episiotomy dehiscence.

Comparison 1 Enema versus no enema, Outcome 2 Neonatal infection (all infections, including umbilical).

Comparison 1 Enema versus no enema, Outcome 3 Neonatal infection (not specified) at 4 days.

Comparison 1 Enema versus no enema, Outcome 4 Neonatal Infection (any infectious outcome, during the first month of life).

Comparison 1 Enema versus no enema, Outcome 5 Neonatal infection: umbilical infection.

Comparison 1 Enema versus no enema, Outcome 6 Neonatal infection: respiratory tract infection (high ‐ during first month).

Comparison 1 Enema versus no enema, Outcome 7 Neonatal infection: respiratory tract infection (low ‐ during first month).

Comparison 1 Enema versus no enema, Outcome 8 Neonatal infection: meningitis.

Comparison 1 Enema versus no enema, Outcome 9 Neontal infection: sepsis.

Comparison 1 Enema versus no enema, Outcome 10 Perineal tear: skin or superficial tissue without compromising muscle.

Comparison 1 Enema versus no enema, Outcome 11 Perineal tear: perineal muscle without anal muscles.

Comparison 1 Enema versus no enema, Outcome 12 Perineal tear: compromises anal muscles but not the mucosa.

Comparison 1 Enema versus no enema, Outcome 13 Perineal tear: complete tear that compromises anal mucosa.

Comparison 1 Enema versus no enema, Outcome 14 No episiotomy wound ‐ no further tear.

Comparison 1 Enema versus no enema, Outcome 15 No episiotomy wound ‐ further tear: 1st degree tear.

Comparison 1 Enema versus no enema, Outcome 16 Episiotomy wound ‐ no further tear.

Comparison 1 Enema versus no enema, Outcome 17 Episiotomy wound ‐ further tear: 3rd degree tear.

Comparison 1 Enema versus no enema, Outcome 18 One‐minute Apgar < 7.

Comparison 1 Enema versus no enema, Outcome 19 Five‐minute Apgar < 7.

Comparison 1 Enema versus no enema, Outcome 20 Faecal soiling during delivery.

Comparison 1 Enema versus no enema, Outcome 21 Duration of labour (minutes).

Comparison 1 Enema versus no enema, Outcome 22 Duration of labour (second stage).

Comparison 1 Enema versus no enema, Outcome 23 Parturients' levels of satisfaction (Likert scale).

Comparison 1 Enema versus no enema, Outcome 24 Labour attendants' levels of satisfaction (Likert scale).

Comparison 1 Enema versus no enema, Outcome 25 Accoucheurs' levels of satisfaction (Likert scale).

Comparison 1 Enema versus no enema, Outcome 26 Perineorrhaphy operators' levels of satisfaction (Likert scale).

Comparison 1 Enema versus no enema, Outcome 27 Pelvic infection: infected episiotomy.

Comparison 1 Enema versus no enema, Outcome 28 Pelvic infection: vulvovaginitis.

Comparison 1 Enema versus no enema, Outcome 29 Pelvic infection: endometritis.

Comparison 1 Enema versus no enema, Outcome 30 Pelvic infection: myometritis.

Comparison 1 Enema versus no enema, Outcome 31 Urinary tract infection.

Comparison 1 Enema versus no enema, Outcome 32 Other puerperal Infections.

Comparison 1 Enema versus no enema, Outcome 33 Other puerperal infections: Intrapartum infection rates.

Comparison 1 Enema versus no enema, Outcome 34 Need for systemic antibiotics (postpartum).

Comparison 1 Enema versus no enema, Outcome 35 Need for systemic antibiotics (neonatal ‐ after hospital discharge during the first month).

Comparison 1 Enema versus no enema, Outcome 36 Opthalmic infection (dacriocistitis or conjunctivitis in first month).

Comparison 1 Enema versus no enema, Outcome 37 Skin infection (first month).

Comparison 1 Enema versus no enema, Outcome 38 Intestinal infection.
| Study ID | Comments |
| The RCT from Wales investigated the incidence of maternal and neonatal infections. None of the women had a perineal wound infection. Regarding neonatal infections, no significant differences were found between the enema and the no‐enema groups (one RCT; 222 women; risk ratio (RR) 0.89, 95% confidence interval (CI) 0.31 to 2.56; Analysis 1.2). The RCT also evaluated women's views on enemas. In the no‐enema group, 14.1% of women willingly accepted to receive a future enema compared to 39.6% in the enema group (P < 0.01). | |
| In the trial from Thailand, the duration of labour was shorter in the enema group (1027 women; 409.4 minutes versus 459.8 minutes; mean difference (MD) ‐50.40, 95% CI ‐75.68 to ‐25.12; P < 0.001; Analysis 1.21) but no adjustment was done by parity. No significant differences were found in the route of delivery, degree of perineal tear and perineal wound infection rates. No neonatal infections occurred during the four‐day follow‐up, which seems a short time to identify infections comprehensively. No significant differences were found with regard to satisfaction between women receiving an enema versus those not receiving an enema, as assessed using a five‐point Likert scale (1027 women; 3.58 versus 3.58; MD 0.00, CI 95% ‐0.10 to 0.10; P = 0.922; Analysis 1.23). Satisfaction levels of labour attendants and healthcare providers were significantly higher in the enema group (P < 0.01) than in the control group (measured using the Likert scale). | |
| The trial from Colombia investigated the effect of enemas on labour duration adjusted by parity. It found no statistically significant differences between groups for delivery types, episiotomy rates, or prescription of antibiotics. No significant differences were found in lower and upper respiratory tract infections rates. Similarly, no significant differences were found for ophthalmic infection rates, skin infections, or intestinal infections. The authors reported no significant differences in the distribution between groups for newborns' "Ballard" score, birthweight, diagnosis of neonatal apnoea, or the administration of ocular and umbilical prophylaxis. Twelve per cent of women had caesarean sections with no significant differences in rates between groups. In addition, no significant differences were found for the duration of labour (for all women for first stage of labour: median 515 minutes with enemas versus 585 minutes without enemas, P = 0.24; for second stage of labour: mean 43.2 minutes with enemas and 38 minutes without; MD 5.20, 95% CI ‐2.56 to 12.96; P=0.19; Analysis 1.22). These results could not be aggregated with the RCT from Thailand (Kovavisarach 2005) as times did not follow a normal distribution and, therefore, trialists considered non‐parametric measures (differences between medians). Finally, there were no significant difference in the degree of perineal tear between groups. The Colombian RCT found no significant differences between groups in the rate of neonatal infection after one month of follow‐up (370 newborns; RR 1.12, 95% CI 0.76 to 1.67; Analysis 1.4) | |
| In the trial from the United States, the mean times to delivery were 504.7 minutes and 392.7 minutes for enema and no enema respectively (152 women; MD 112, 95% CI 48.13 to 175.87; Analysis 1.21); we estimated the standard deviations because these were not provided by the researchers. Intrapartum infection rates were significantly higher in the enema group (RR 4.62, 95% CI 1.03 to 20.68; Analysis 1.33). However, when controlling for duration of membrane rupture, enema use fell below the level of significance for infection (no data was provided by trialists). Women who received enemas had significantly less faecal soiling at delivery (RR 0.36, 95% CI 0.17 to 0.75; Analysis 1.20). There was no significant difference in the mode of delivery between the two groups. No neonatal outcomes were reported. | |
| RCT: randomised controlled trial | |
| Outcome or subgroup title | No. of studies | No. of participants | Statistical method | Effect size |
| 1 Episiotomy dehiscence Show forest plot | 1 | 372 | Risk Ratio (M‐H, Fixed, 95% CI) | 0.69 [0.41, 1.14] |
| 2 Neonatal infection (all infections, including umbilical) Show forest plot | 1 | 222 | Risk Ratio (M‐H, Fixed, 95% CI) | 0.89 [0.31, 2.56] |
| 3 Neonatal infection (not specified) at 4 days Show forest plot | 1 | 1027 | Risk Ratio (M‐H, Fixed, 95% CI) | 0.0 [0.0, 0.0] |
| 4 Neonatal Infection (any infectious outcome, during the first month of life) Show forest plot | 1 | 370 | Risk Ratio (M‐H, Fixed, 95% CI) | 1.12 [0.76, 1.67] |
| 5 Neonatal infection: umbilical infection Show forest plot | 2 | 592 | Risk Ratio (M‐H, Fixed, 95% CI) | 3.16 [0.50, 19.82] |
| 6 Neonatal infection: respiratory tract infection (high ‐ during first month) Show forest plot | 1 | 369 | Risk Ratio (M‐H, Fixed, 95% CI) | 1.82 [0.73, 4.52] |
| 7 Neonatal infection: respiratory tract infection (low ‐ during first month) Show forest plot | 1 | 369 | Risk Ratio (M‐H, Fixed, 95% CI) | 0.10 [0.01, 1.73] |
| 8 Neonatal infection: meningitis Show forest plot | 1 | 370 | Risk Ratio (M‐H, Fixed, 95% CI) | 0.0 [0.0, 0.0] |
| 9 Neontal infection: sepsis Show forest plot | 1 | 370 | Risk Ratio (M‐H, Fixed, 95% CI) | 0.0 [0.0, 0.0] |
| 10 Perineal tear: skin or superficial tissue without compromising muscle Show forest plot | 2 | 1448 | Risk Ratio (M‐H, Fixed, 95% CI) | 1.14 [0.76, 1.71] |
| 11 Perineal tear: perineal muscle without anal muscles Show forest plot | 1 | 421 | Risk Ratio (M‐H, Fixed, 95% CI) | 0.72 [0.37, 1.40] |
| 12 Perineal tear: compromises anal muscles but not the mucosa Show forest plot | 2 | 1448 | Risk Ratio (M‐H, Fixed, 95% CI) | 0.46 [0.13, 1.64] |
| 13 Perineal tear: complete tear that compromises anal mucosa Show forest plot | 1 | 421 | Risk Ratio (M‐H, Fixed, 95% CI) | 2.93 [0.12, 71.51] |
| 14 No episiotomy wound ‐ no further tear Show forest plot | 1 | 1027 | Risk Ratio (M‐H, Fixed, 95% CI) | 0.74 [0.43, 1.27] |
| 15 No episiotomy wound ‐ further tear: 1st degree tear Show forest plot | 1 | 1027 | Risk Ratio (M‐H, Fixed, 95% CI) | 1.17 [0.63, 2.19] |
| 16 Episiotomy wound ‐ no further tear Show forest plot | 1 | 1027 | Risk Ratio (M‐H, Fixed, 95% CI) | 1.01 [0.98, 1.05] |
| 17 Episiotomy wound ‐ further tear: 3rd degree tear Show forest plot | 1 | 1027 | Risk Ratio (M‐H, Fixed, 95% CI) | 0.21 [0.01, 4.38] |
| 18 One‐minute Apgar < 7 Show forest plot | 1 | 431 | Risk Ratio (M‐H, Fixed, 95% CI) | 1.31 [0.57, 3.06] |
| 19 Five‐minute Apgar < 7 Show forest plot | 1 | 431 | Risk Ratio (M‐H, Fixed, 95% CI) | 1.31 [0.57, 3.06] |
| 20 Faecal soiling during delivery Show forest plot | 1 | 152 | Risk Ratio (M‐H, Fixed, 95% CI) | 0.36 [0.17, 0.75] |
| 21 Duration of labour (minutes) Show forest plot | 2 | 1179 | Mean Difference (IV, Random, 95% CI) | 28.04 [‐131.01, 187.10] |
| 22 Duration of labour (second stage) Show forest plot | 1 | 347 | Mean Difference (IV, Fixed, 95% CI) | 5.20 [‐2.56, 12.96] |
| 23 Parturients' levels of satisfaction (Likert scale) Show forest plot | 1 | 1027 | Mean Difference (IV, Fixed, 95% CI) | 0.0 [‐0.10, 0.10] |
| 24 Labour attendants' levels of satisfaction (Likert scale) Show forest plot | 1 | 1027 | Mean Difference (IV, Fixed, 95% CI) | 0.17 [0.08, 0.26] |
| 25 Accoucheurs' levels of satisfaction (Likert scale) Show forest plot | 1 | 1027 | Mean Difference (IV, Fixed, 95% CI) | 0.26 [0.15, 0.37] |
| 26 Perineorrhaphy operators' levels of satisfaction (Likert scale) Show forest plot | 1 | 1027 | Mean Difference (IV, Fixed, 95% CI) | 0.11 [0.02, 0.20] |
| 27 Pelvic infection: infected episiotomy Show forest plot | 1 | 372 | Risk Ratio (M‐H, Fixed, 95% CI) | 0.60 [0.18, 2.00] |
| 28 Pelvic infection: vulvovaginitis Show forest plot | 1 | 372 | Risk Ratio (M‐H, Fixed, 95% CI) | 0.15 [0.01, 2.87] |
| 29 Pelvic infection: endometritis Show forest plot | 1 | 372 | Risk Ratio (M‐H, Fixed, 95% CI) | 0.26 [0.03, 2.31] |
| 30 Pelvic infection: myometritis Show forest plot | 1 | 372 | Risk Ratio (M‐H, Fixed, 95% CI) | 3.13 [0.13, 76.37] |
| 31 Urinary tract infection Show forest plot | 1 | 372 | Risk Ratio (M‐H, Fixed, 95% CI) | 0.60 [0.18, 2.00] |
| 32 Other puerperal Infections Show forest plot | 2 | 594 | Risk Ratio (M‐H, Fixed, 95% CI) | 0.66 [0.42, 1.04] |
| 32.1 First 24 hours by interview | 1 | 222 | Risk Ratio (M‐H, Fixed, 95% CI) | 0.0 [0.0, 0.0] |
| 32.2 Infection during the first month | 1 | 372 | Risk Ratio (M‐H, Fixed, 95% CI) | 0.66 [0.42, 1.04] |
| 33 Other puerperal infections: Intrapartum infection rates Show forest plot | 1 | 152 | Risk Ratio (M‐H, Fixed, 95% CI) | 4.62 [1.03, 20.68] |
| 34 Need for systemic antibiotics (postpartum) Show forest plot | 1 | 428 | Risk Ratio (M‐H, Fixed, 95% CI) | 1.16 [0.73, 1.84] |
| 35 Need for systemic antibiotics (neonatal ‐ after hospital discharge during the first month) Show forest plot | 1 | 367 | Risk Ratio (M‐H, Fixed, 95% CI) | 0.21 [0.03, 1.80] |
| 36 Opthalmic infection (dacriocistitis or conjunctivitis in first month) Show forest plot | 1 | 370 | Risk Ratio (M‐H, Fixed, 95% CI) | 1.03 [0.62, 1.71] |
| 37 Skin infection (first month) Show forest plot | 1 | 370 | Risk Ratio (M‐H, Fixed, 95% CI) | 1.60 [0.27, 9.47] |
| 38 Intestinal infection Show forest plot | 1 | 368 | Risk Ratio (M‐H, Fixed, 95% CI) | 1.07 [0.07, 16.94] |