| 1 Episiotomy dehiscence Show forest plot | 1 | 372 | Risk Ratio (M‐H, Fixed, 95% CI) | 0.69 [0.41, 1.14] |
|
| 2 Neonatal infection (all infections, including umbilical) Show forest plot | 1 | 222 | Risk Ratio (M‐H, Fixed, 95% CI) | 0.89 [0.31, 2.56] |
|
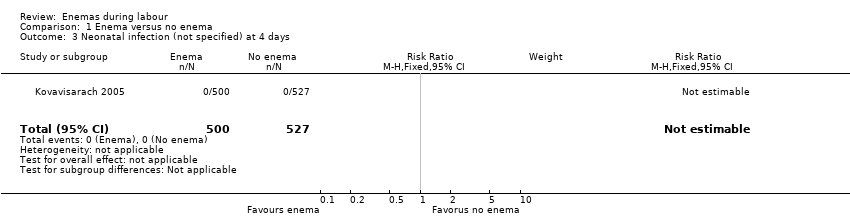
| 3 Neonatal infection (not specified) at 4 days Show forest plot | 1 | 1027 | Risk Ratio (M‐H, Fixed, 95% CI) | 0.0 [0.0, 0.0] |
|
| 4 Neonatal Infection (any infectious outcome, during the first month of life) Show forest plot | 1 | 370 | Risk Ratio (M‐H, Fixed, 95% CI) | 1.12 [0.76, 1.67] |
|
| 5 Neonatal infection: umbilical infection Show forest plot | 2 | 592 | Risk Ratio (M‐H, Fixed, 95% CI) | 3.16 [0.50, 19.82] |
|
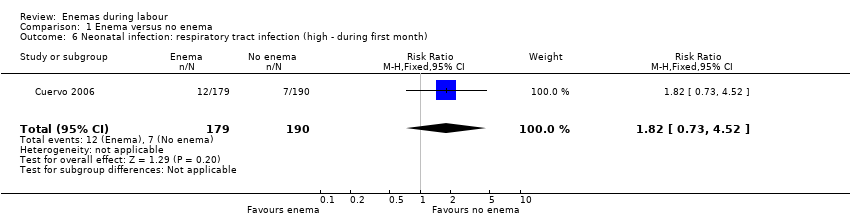
| 6 Neonatal infection: respiratory tract infection (high ‐ during first month) Show forest plot | 1 | 369 | Risk Ratio (M‐H, Fixed, 95% CI) | 1.82 [0.73, 4.52] |
|
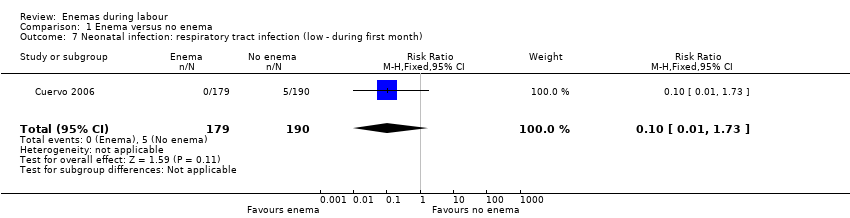
| 7 Neonatal infection: respiratory tract infection (low ‐ during first month) Show forest plot | 1 | 369 | Risk Ratio (M‐H, Fixed, 95% CI) | 0.10 [0.01, 1.73] |
|
| 8 Neonatal infection: meningitis Show forest plot | 1 | 370 | Risk Ratio (M‐H, Fixed, 95% CI) | 0.0 [0.0, 0.0] |
|
| 9 Neontal infection: sepsis Show forest plot | 1 | 370 | Risk Ratio (M‐H, Fixed, 95% CI) | 0.0 [0.0, 0.0] |
|
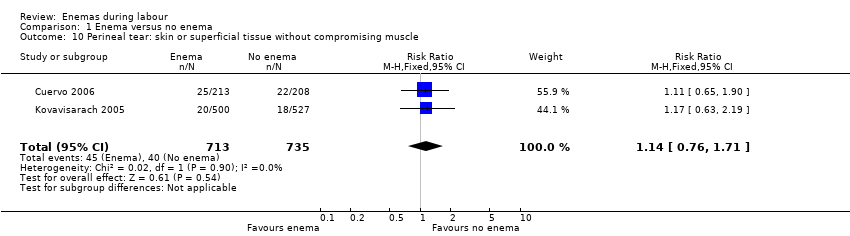
| 10 Perineal tear: skin or superficial tissue without compromising muscle Show forest plot | 2 | 1448 | Risk Ratio (M‐H, Fixed, 95% CI) | 1.14 [0.76, 1.71] |
|
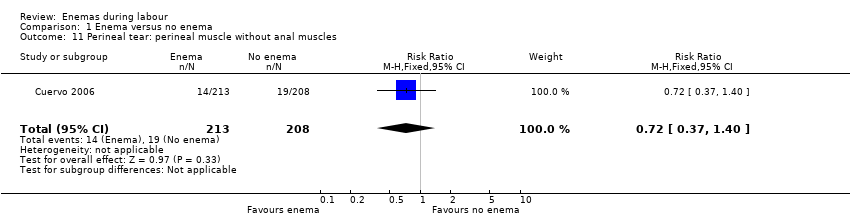
| 11 Perineal tear: perineal muscle without anal muscles Show forest plot | 1 | 421 | Risk Ratio (M‐H, Fixed, 95% CI) | 0.72 [0.37, 1.40] |
|
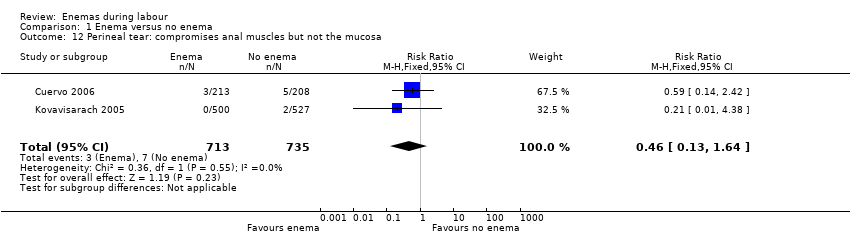
| 12 Perineal tear: compromises anal muscles but not the mucosa Show forest plot | 2 | 1448 | Risk Ratio (M‐H, Fixed, 95% CI) | 0.46 [0.13, 1.64] |
|
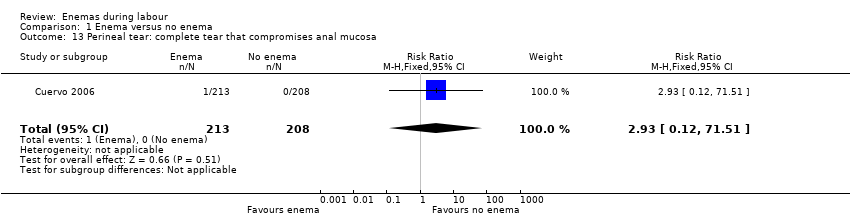
| 13 Perineal tear: complete tear that compromises anal mucosa Show forest plot | 1 | 421 | Risk Ratio (M‐H, Fixed, 95% CI) | 2.93 [0.12, 71.51] |
|
| 14 No episiotomy wound ‐ no further tear Show forest plot | 1 | 1027 | Risk Ratio (M‐H, Fixed, 95% CI) | 0.74 [0.43, 1.27] |
|
| 15 No episiotomy wound ‐ further tear: 1st degree tear Show forest plot | 1 | 1027 | Risk Ratio (M‐H, Fixed, 95% CI) | 1.17 [0.63, 2.19] |
|
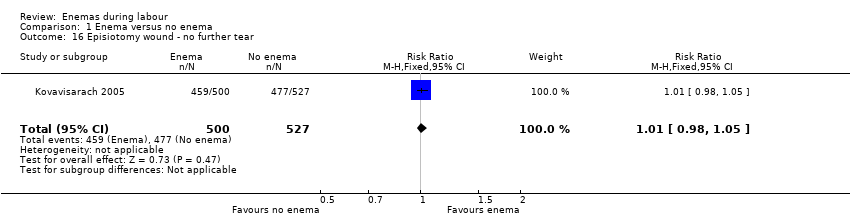
| 16 Episiotomy wound ‐ no further tear Show forest plot | 1 | 1027 | Risk Ratio (M‐H, Fixed, 95% CI) | 1.01 [0.98, 1.05] |
|
| 17 Episiotomy wound ‐ further tear: 3rd degree tear Show forest plot | 1 | 1027 | Risk Ratio (M‐H, Fixed, 95% CI) | 0.21 [0.01, 4.38] |
|
| 18 One‐minute Apgar < 7 Show forest plot | 1 | 431 | Risk Ratio (M‐H, Fixed, 95% CI) | 1.31 [0.57, 3.06] |
|
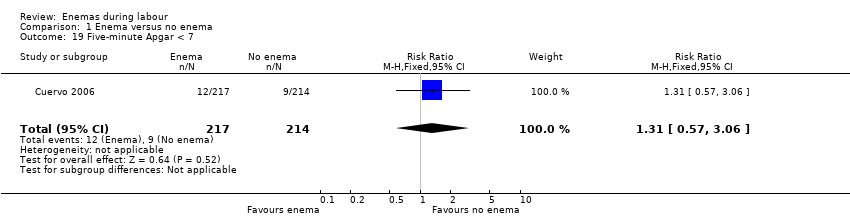
| 19 Five‐minute Apgar < 7 Show forest plot | 1 | 431 | Risk Ratio (M‐H, Fixed, 95% CI) | 1.31 [0.57, 3.06] |
|
| 20 Faecal soiling during delivery Show forest plot | 1 | 152 | Risk Ratio (M‐H, Fixed, 95% CI) | 0.36 [0.17, 0.75] |
|
| 21 Duration of labour (minutes) Show forest plot | 2 | 1179 | Mean Difference (IV, Random, 95% CI) | 28.04 [‐131.01, 187.10] |
|
| 22 Duration of labour (second stage) Show forest plot | 1 | 347 | Mean Difference (IV, Fixed, 95% CI) | 5.20 [‐2.56, 12.96] |
|
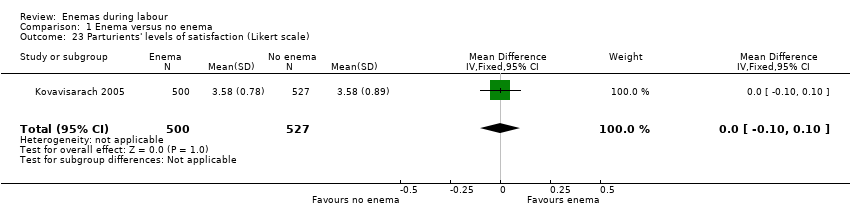
| 23 Parturients' levels of satisfaction (Likert scale) Show forest plot | 1 | 1027 | Mean Difference (IV, Fixed, 95% CI) | 0.0 [‐0.10, 0.10] |
|
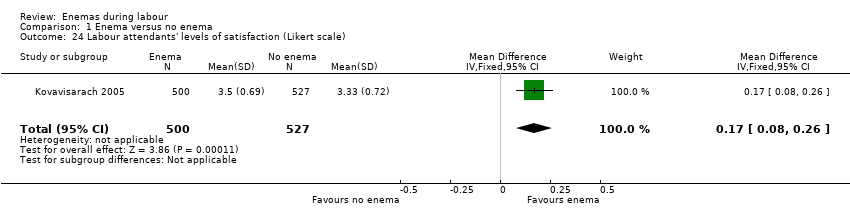
| 24 Labour attendants' levels of satisfaction (Likert scale) Show forest plot | 1 | 1027 | Mean Difference (IV, Fixed, 95% CI) | 0.17 [0.08, 0.26] |
|
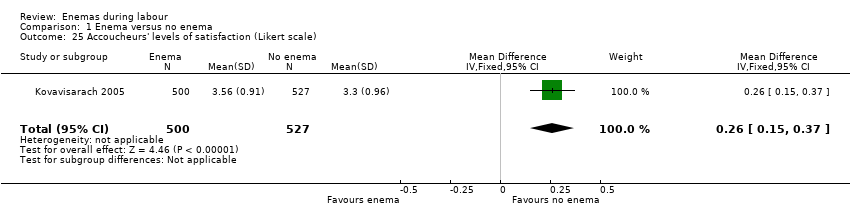
| 25 Accoucheurs' levels of satisfaction (Likert scale) Show forest plot | 1 | 1027 | Mean Difference (IV, Fixed, 95% CI) | 0.26 [0.15, 0.37] |
|
| 26 Perineorrhaphy operators' levels of satisfaction (Likert scale) Show forest plot | 1 | 1027 | Mean Difference (IV, Fixed, 95% CI) | 0.11 [0.02, 0.20] |
|
| 27 Pelvic infection: infected episiotomy Show forest plot | 1 | 372 | Risk Ratio (M‐H, Fixed, 95% CI) | 0.60 [0.18, 2.00] |
|
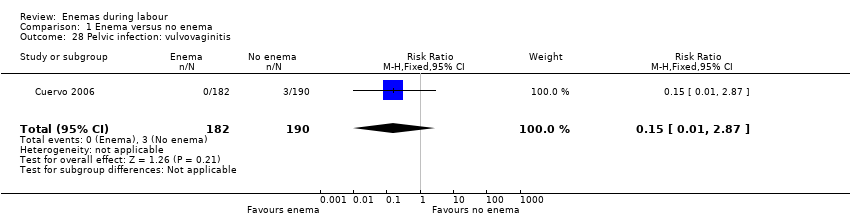
| 28 Pelvic infection: vulvovaginitis Show forest plot | 1 | 372 | Risk Ratio (M‐H, Fixed, 95% CI) | 0.15 [0.01, 2.87] |
|
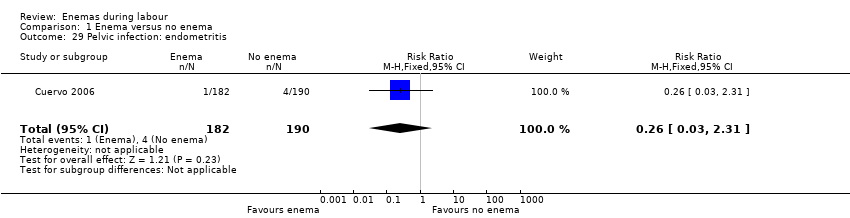
| 29 Pelvic infection: endometritis Show forest plot | 1 | 372 | Risk Ratio (M‐H, Fixed, 95% CI) | 0.26 [0.03, 2.31] |
|
| 30 Pelvic infection: myometritis Show forest plot | 1 | 372 | Risk Ratio (M‐H, Fixed, 95% CI) | 3.13 [0.13, 76.37] |
|
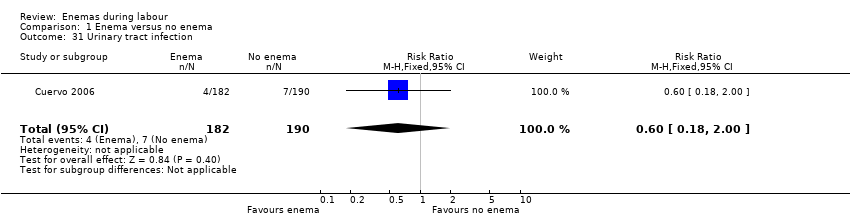
| 31 Urinary tract infection Show forest plot | 1 | 372 | Risk Ratio (M‐H, Fixed, 95% CI) | 0.60 [0.18, 2.00] |
|
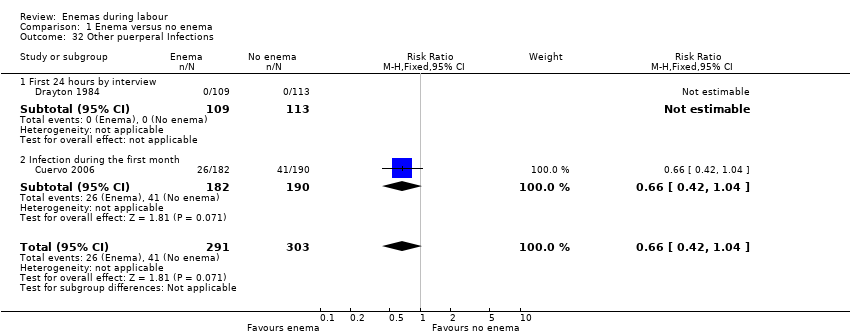
| 32 Other puerperal Infections Show forest plot | 2 | 594 | Risk Ratio (M‐H, Fixed, 95% CI) | 0.66 [0.42, 1.04] |
|
| 32.1 First 24 hours by interview | 1 | 222 | Risk Ratio (M‐H, Fixed, 95% CI) | 0.0 [0.0, 0.0] |
| 32.2 Infection during the first month | 1 | 372 | Risk Ratio (M‐H, Fixed, 95% CI) | 0.66 [0.42, 1.04] |
| 33 Other puerperal infections: Intrapartum infection rates Show forest plot | 1 | 152 | Risk Ratio (M‐H, Fixed, 95% CI) | 4.62 [1.03, 20.68] |
|
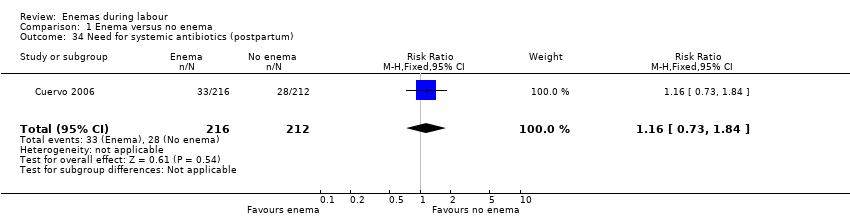
| 34 Need for systemic antibiotics (postpartum) Show forest plot | 1 | 428 | Risk Ratio (M‐H, Fixed, 95% CI) | 1.16 [0.73, 1.84] |
|
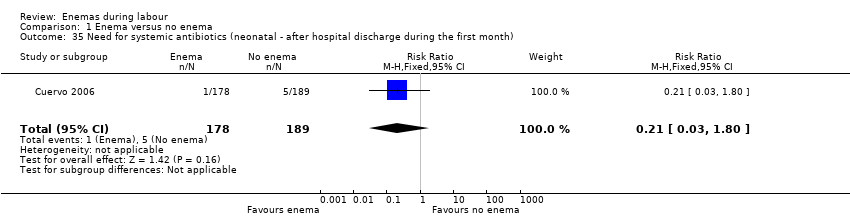
| 35 Need for systemic antibiotics (neonatal ‐ after hospital discharge during the first month) Show forest plot | 1 | 367 | Risk Ratio (M‐H, Fixed, 95% CI) | 0.21 [0.03, 1.80] |
|
| 36 Opthalmic infection (dacriocistitis or conjunctivitis in first month) Show forest plot | 1 | 370 | Risk Ratio (M‐H, Fixed, 95% CI) | 1.03 [0.62, 1.71] |
|
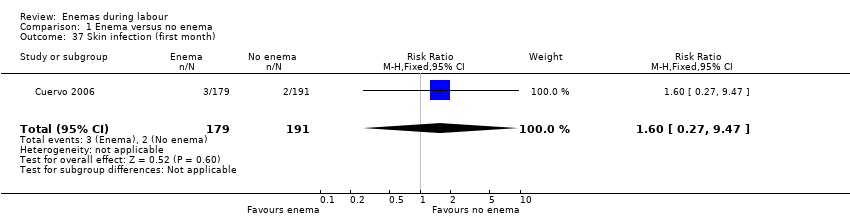
| 37 Skin infection (first month) Show forest plot | 1 | 370 | Risk Ratio (M‐H, Fixed, 95% CI) | 1.60 [0.27, 9.47] |
|
| 38 Intestinal infection Show forest plot | 1 | 368 | Risk Ratio (M‐H, Fixed, 95% CI) | 1.07 [0.07, 16.94] |
|