Enemas durante el trabajo de parto
Appendices
Appendix 1. Search strategies
Review authors searched the Cochrane Central Register of Controlled Trials (CENTRAL) and the Database of Abstracts of Reviews of Effectiveness (DARE) (The Cochrane Library 2013, Issue 5), PubMed (1966 to 31 May 2013) and LILACS (1982 to 31 May 2013) using the search strategy:
enema* AND (labor OR labour OR intrapartum OR delivery OR pregnan*).
Review authors also searched the following on 31 May 2013 using the word 'enema':
-
Search Portal of the International Clinical Trials Registry Platform (ICTRP)
-
Health Technology Assessment Program (HTA) [United Kingdom]
-
Medical Research Council [United Kingdom]
-
The Wellcome Trust [United Kingdom]
Appendix 2. Methods to be used in future updates
Data extraction and management
We will design a form to extract data. For eligible studies, at least two review authors will extract the data using the agreed form. We will resolve discrepancies through discussion or, if required, we will consult the third author. We will enter data into Review Manager software (RevMan 2012) and check for accuracy.
When information regarding any of the above is unclear, we will attempt to contact authors of the original reports to provide further details.
Assessment of risk of bias in included studies
Two review authors will independently assess risk of bias for each study using the criteria outlined in the Cochrane Handbook for Systematic Reviews of Interventions (Higgins 2011). We will resolve any disagreement by discussion or by involving a third author.
(1) Random sequence generation (checking for possible selection bias)
We will describe for each included study the method used to generate the allocation sequence in sufficient detail to allow an assessment of whether it should produce comparable groups.
We will assess the method as:
-
low risk of bias (any truly random process, e.g. random number table; computer random number generator),
-
high risk of bias (any non‐random process, e.g. odd or even date of birth; hospital or clinic record number) or,
-
unclear risk of bias.
(2) Allocation concealment (checking for possible selection bias)
We will describe for each included study the method used to conceal allocation to interventions prior to assignment and will assess whether intervention allocation could have been foreseen in advance of, or during recruitment, or changed after assignment.
We will assess the methods as:
-
low risk of bias (e.g. telephone or central randomisation; consecutively numbered sealed opaque envelopes);
-
high risk of bias (open random allocation; unsealed or non‐opaque envelopes, alternation; date of birth);
-
unclear risk of bias.
(3.1) Blinding of participants and personnel (checking for possible performance bias)
We will describe for each included study the methods used, if any, to blind study participants and personnel from knowledge of which intervention a participant received. We will consider that studies are at low risk of bias if they were blinded, or if we judge that the lack of blinding would be unlikely to affect results. We will assess blinding separately for different outcomes or classes of outcomes.
We will assess the methods as:
-
low, high or unclear risk of bias for participants;
-
low, high or unclear risk of bias for personnel;
(3.2) Blinding of outcome assessment (checking for possible detection bias)
We will describe for each included study the methods used, if any, to blind outcome assessors from knowledge of which intervention a participant received. We will assess blinding separately for different outcomes or classes of outcomes.
We will assess methods used to blind outcome assessment as:
-
low, high or unclear risk of bias.
(4) Incomplete outcome data (checking for possible attrition bias due to the amount, nature and handling of incomplete outcome data)
We will describe for each included study, and for each outcome or class of outcomes, the completeness of data including attrition and exclusions from the analysis. We will state whether attrition and exclusions were reported and the numbers included in the analysis at each stage (compared with the total randomised participants), reasons for attrition or exclusion where reported, and whether missing data were balanced across groups or were related to outcomes. Where sufficient information is reported, or can be supplied by the trial authors, we will re‐include missing data in the analyses which we undertake.
We will assess methods as:
-
low risk of bias (e.g. no missing outcome data; missing outcome data balanced across groups);
-
high risk of bias (e.g. numbers or reasons for missing data imbalanced across groups; ‘as treated’ analysis done with substantial departure of intervention received from that assigned at randomization);
-
unclear risk of bias.
(5) Selective reporting (checking for reporting bias)
We will describe for each included study how we investigated the possibility of selective outcome reporting bias and what we found.
We will assess the methods as:
-
low risk of bias (where it is clear that all of the study’s pre‐specified outcomes and all expected outcomes of interest to the review have been reported);
-
high risk of bias (where not all the study’s pre‐specified outcomes have been reported; one or more reported primary outcomes were not pre‐specified; outcomes of interest are reported incompletely and so cannot be used; study fails to include results of a key outcome that would have been expected to have been reported);
-
unclear risk of bias.
(6) Other bias (checking for bias due to problems not covered by 1 to 5 above)
We will describe for each included study any important concerns we have about other possible sources of bias.
We will assess whether each study was free of other problems that could put it at risk of bias:
-
low risk of other bias;
-
high risk of other bias;
-
unclear whether there is risk of other bias.
(7) Overall risk of bias
We will make explicit judgements about whether studies are at high risk of bias, according to the criteria given in the Handbook (Higgins 2011). With reference to (1) to (6) above, we will assess the likely magnitude and direction of the bias and whether we consider it is likely to impact on the findings. We will explore the impact of the level of bias through undertaking sensitivity analyses ‐ see Sensitivity analysis.
Measures of treatment effect
Dichotomous data
For dichotomous data, we will present results as summary risk ratio with 95% confidence intervals.
Continuous data
For continuous data, we will use the mean difference if outcomes are measured in the same way between trials. We will use the standardised mean difference to combine trials that measure the same outcome, but use different methods.
Unit of analysis issues
Cluster‐randomised trials
We will include cluster‐randomised trials in the analyses along with individually randomised trials. We will adjust their sample sizes using the methods described in the Handbook using an estimate of the intracluster correlation co‐efficient (ICC) derived from the trial (if possible), from a similar trial or from a study of a similar population. If we use ICCs from other sources, we will report this and conduct sensitivity analyses to investigate the effect of variation in the ICC. If we identify both cluster‐randomised trials and individually‐randomised trials, we plan to synthesise the relevant information. We will consider it reasonable to combine the results from both if there is little heterogeneity between the study designs and the interaction between the effect of intervention and the choice of randomisation unit is considered to be unlikely.
We will also acknowledge heterogeneity in the randomisation unit and perform a sensitivity analysis to investigate the effects of the randomisation unit.
Cross‐over trials
This study design is not eligible for inclusion in this review.
Dealing with missing data
For included studies, we will note levels of attrition. We will explore the impact of including studies with high levels of missing data in the overall assessment of treatment effect by using sensitivity analysis.
For all outcomes, we will carry out analyses, as far as possible, on an intention‐to‐treat basis, i.e. we will attempt to include all participants randomised to each group in the analyses, and all participants will be analysed in the group to which they were allocated, regardless of whether or not they received the allocated intervention. The denominator for each outcome in each trial will be the number randomised minus any participants whose outcomes are known to be missing.
Assessment of heterogeneity
We will assess statistical heterogeneity in each meta‐analysis using the T2, I² and Chi² statistics. We will regard heterogeneity as substantial if I2 is greater than 30% and either T2 is greater than zero, or there is a low P‐value (< 0.10) in the Chi² test for heterogeneity.
Assessment of reporting biases
If there are 10 or more studies in the meta‐analysis we will investigate reporting biases (such as publication bias) using funnel plots. We will assess funnel plot asymmetry visually. If asymmetry is suggested by a visual assessment, we will perform exploratory analyses to investigate it.
Data synthesis
We will carry out statistical analysis using the Review Manager software (RevMan 2012). We will use fixed‐effect meta‐analysis for combining data where it is reasonable to assume that studies are estimating the same underlying treatment effect: i.e. where trials are examining the same intervention, and the trials’ populations and methods are judged sufficiently similar. If there is clinical heterogeneity sufficient to expect that the underlying treatment effects differ between trials, or if substantial statistical heterogeneity is detected, we will use random‐effects meta‐analysis to produce an overall summary if an average treatment effect across trials is considered clinically meaningful. The random‐effects summary will be treated as the average range of possible treatment effects and we will discuss the clinical implications of treatment effects differing between trials. If the average treatment effect is not clinically meaningful we will not combine trials.
If we use random‐effects analyses, the results will be presented as the average treatment effect with 95% confidence intervals, and the estimates of T2 and I2.
Subgroup analysis and investigation of heterogeneity
If we identify substantial heterogeneity, we will investigate it using subgroup analyses and sensitivity analyses. We will consider whether an overall summary is meaningful and, if it is, use random‐effects analysis to produce it.
We plan to carry out the following subgroup analyses:
1. Parity (primiparous versus non‐primiparous).
2. Gestational age.
The following primary outcomes will be used in subgroup analyses:
-
Complications of episiotomy and perineal tears.
-
Endometritis.
-
Neonatal infections.
We will assess subgroup differences by interaction tests available within RevMan (RevMan 2012). We will report the results of subgroup analyses quoting the χ2 statistic and p‐value, and the interaction test I² value.
Sensitivity analysis
In the event of significant heterogeneity, we will perform sensitivity analysis excluding trials with greater risk of bias to determine the effect on the results. Studies with high or unclear risk of bias for selection and/or attrition bias will be considered at high risk of bias and excluded in sensitivity analyses.
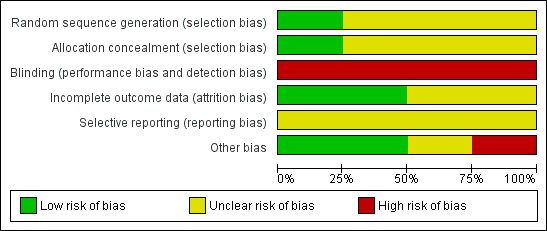
'Risk of bias' graph: review authors' judgements about each risk of bias item presented as percentages across all included studies.

'Risk of bias' summary: review authors' judgements about each risk of bias item for each included study.

Comparison 1 Enema versus no enema, Outcome 1 Episiotomy dehiscence.

Comparison 1 Enema versus no enema, Outcome 2 Neonatal infection (all infections, including umbilical).
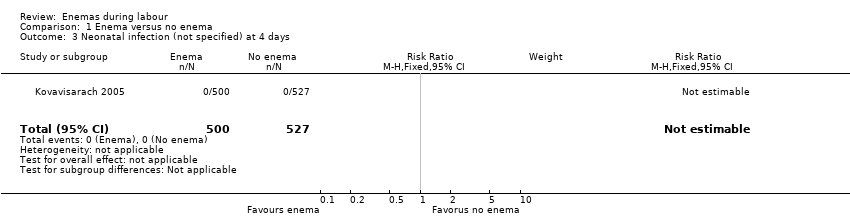
Comparison 1 Enema versus no enema, Outcome 3 Neonatal infection (not specified) at 4 days.

Comparison 1 Enema versus no enema, Outcome 4 Neonatal Infection (any infectious outcome, during the first month of life).

Comparison 1 Enema versus no enema, Outcome 5 Neonatal infection: umbilical infection.
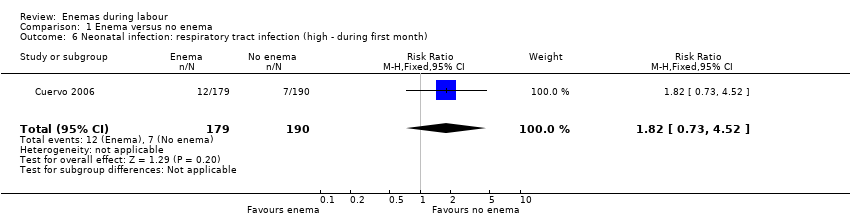
Comparison 1 Enema versus no enema, Outcome 6 Neonatal infection: respiratory tract infection (high ‐ during first month).
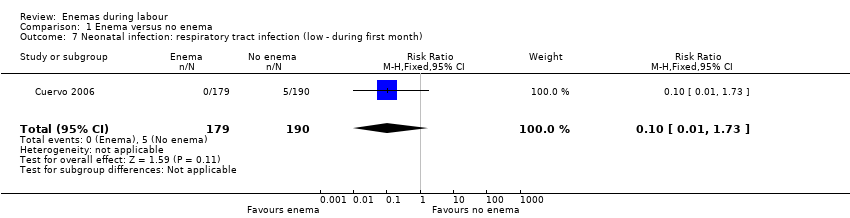
Comparison 1 Enema versus no enema, Outcome 7 Neonatal infection: respiratory tract infection (low ‐ during first month).

Comparison 1 Enema versus no enema, Outcome 8 Neonatal infection: meningitis.

Comparison 1 Enema versus no enema, Outcome 9 Neontal infection: sepsis.
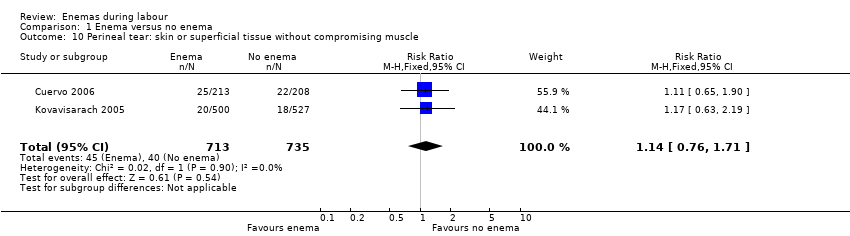
Comparison 1 Enema versus no enema, Outcome 10 Perineal tear: skin or superficial tissue without compromising muscle.
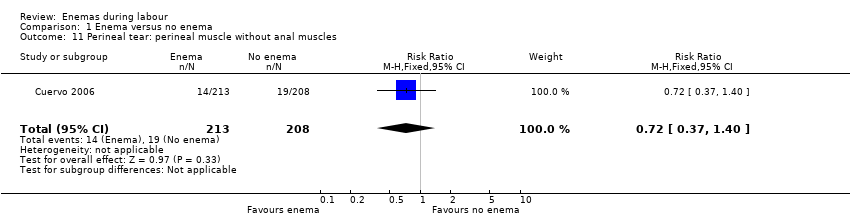
Comparison 1 Enema versus no enema, Outcome 11 Perineal tear: perineal muscle without anal muscles.
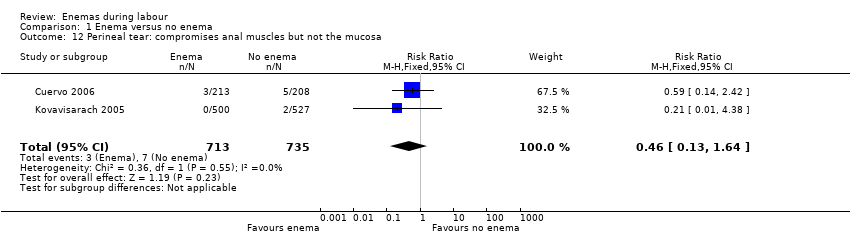
Comparison 1 Enema versus no enema, Outcome 12 Perineal tear: compromises anal muscles but not the mucosa.
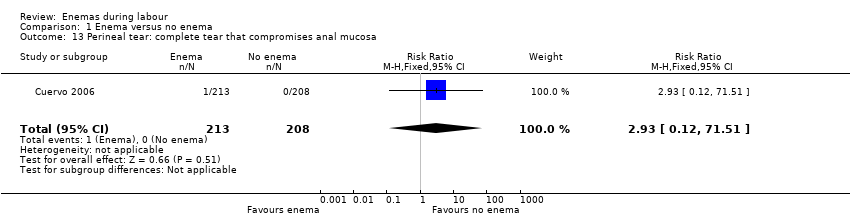
Comparison 1 Enema versus no enema, Outcome 13 Perineal tear: complete tear that compromises anal mucosa.

Comparison 1 Enema versus no enema, Outcome 14 No episiotomy wound ‐ no further tear.

Comparison 1 Enema versus no enema, Outcome 15 No episiotomy wound ‐ further tear: 1st degree tear.
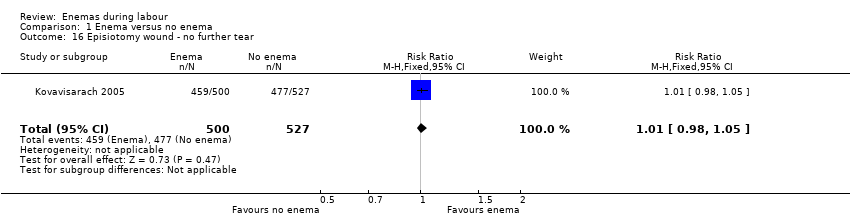
Comparison 1 Enema versus no enema, Outcome 16 Episiotomy wound ‐ no further tear.

Comparison 1 Enema versus no enema, Outcome 17 Episiotomy wound ‐ further tear: 3rd degree tear.

Comparison 1 Enema versus no enema, Outcome 18 One‐minute Apgar < 7.
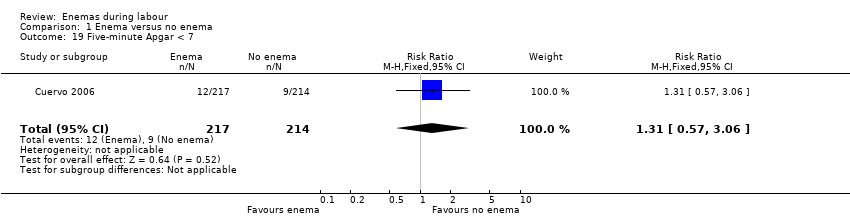
Comparison 1 Enema versus no enema, Outcome 19 Five‐minute Apgar < 7.

Comparison 1 Enema versus no enema, Outcome 20 Faecal soiling during delivery.

Comparison 1 Enema versus no enema, Outcome 21 Duration of labour (minutes).

Comparison 1 Enema versus no enema, Outcome 22 Duration of labour (second stage).
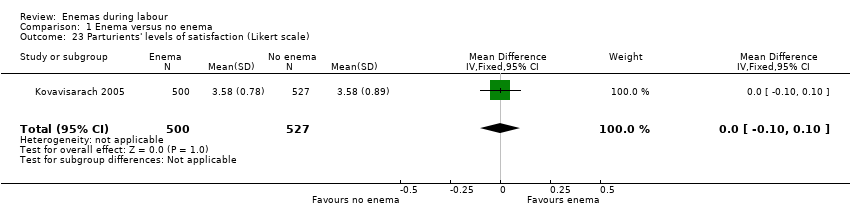
Comparison 1 Enema versus no enema, Outcome 23 Parturients' levels of satisfaction (Likert scale).
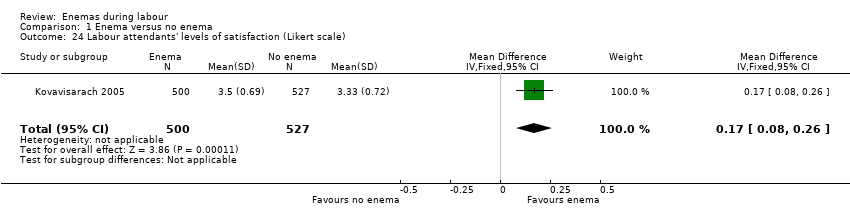
Comparison 1 Enema versus no enema, Outcome 24 Labour attendants' levels of satisfaction (Likert scale).
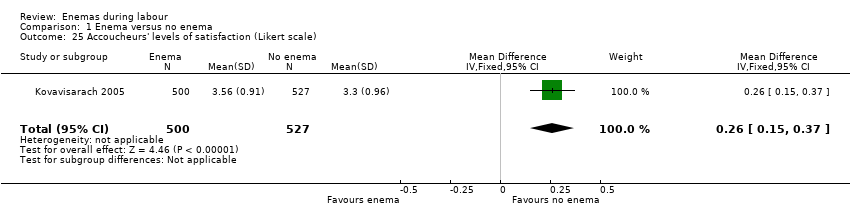
Comparison 1 Enema versus no enema, Outcome 25 Accoucheurs' levels of satisfaction (Likert scale).

Comparison 1 Enema versus no enema, Outcome 26 Perineorrhaphy operators' levels of satisfaction (Likert scale).

Comparison 1 Enema versus no enema, Outcome 27 Pelvic infection: infected episiotomy.
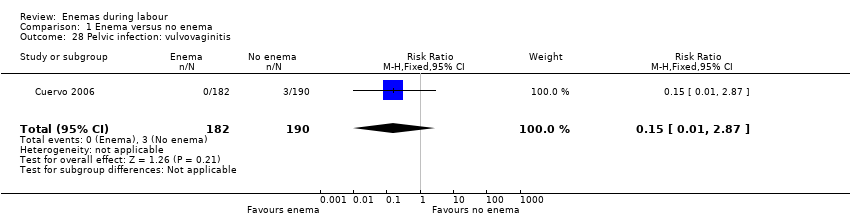
Comparison 1 Enema versus no enema, Outcome 28 Pelvic infection: vulvovaginitis.
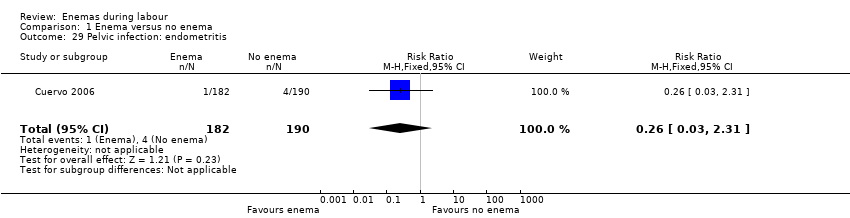
Comparison 1 Enema versus no enema, Outcome 29 Pelvic infection: endometritis.

Comparison 1 Enema versus no enema, Outcome 30 Pelvic infection: myometritis.
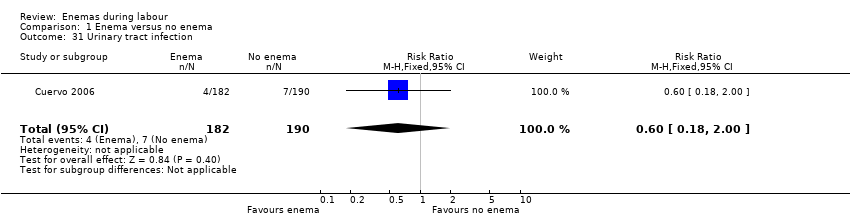
Comparison 1 Enema versus no enema, Outcome 31 Urinary tract infection.
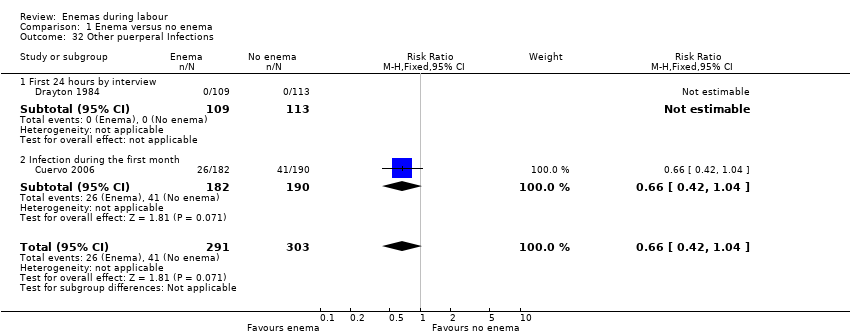
Comparison 1 Enema versus no enema, Outcome 32 Other puerperal Infections.

Comparison 1 Enema versus no enema, Outcome 33 Other puerperal infections: Intrapartum infection rates.
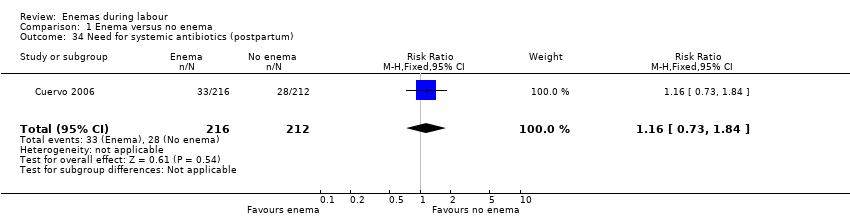
Comparison 1 Enema versus no enema, Outcome 34 Need for systemic antibiotics (postpartum).
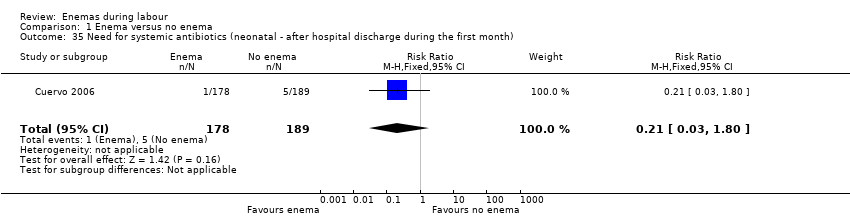
Comparison 1 Enema versus no enema, Outcome 35 Need for systemic antibiotics (neonatal ‐ after hospital discharge during the first month).

Comparison 1 Enema versus no enema, Outcome 36 Opthalmic infection (dacriocistitis or conjunctivitis in first month).
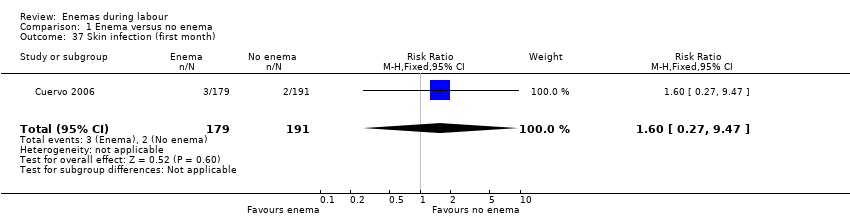
Comparison 1 Enema versus no enema, Outcome 37 Skin infection (first month).

Comparison 1 Enema versus no enema, Outcome 38 Intestinal infection.
| Study ID | Comments |
| The RCT from Wales investigated the incidence of maternal and neonatal infections. None of the women had a perineal wound infection. Regarding neonatal infections, no significant differences were found between the enema and the no‐enema groups (one RCT; 222 women; risk ratio (RR) 0.89, 95% confidence interval (CI) 0.31 to 2.56; Analysis 1.2). The RCT also evaluated women's views on enemas. In the no‐enema group, 14.1% of women willingly accepted to receive a future enema compared to 39.6% in the enema group (P < 0.01). | |
| In the trial from Thailand, the duration of labour was shorter in the enema group (1027 women; 409.4 minutes versus 459.8 minutes; mean difference (MD) ‐50.40, 95% CI ‐75.68 to ‐25.12; P < 0.001; Analysis 1.21) but no adjustment was done by parity. No significant differences were found in the route of delivery, degree of perineal tear and perineal wound infection rates. No neonatal infections occurred during the four‐day follow‐up, which seems a short time to identify infections comprehensively. No significant differences were found with regard to satisfaction between women receiving an enema versus those not receiving an enema, as assessed using a five‐point Likert scale (1027 women; 3.58 versus 3.58; MD 0.00, CI 95% ‐0.10 to 0.10; P = 0.922; Analysis 1.23). Satisfaction levels of labour attendants and healthcare providers were significantly higher in the enema group (P < 0.01) than in the control group (measured using the Likert scale). | |
| The trial from Colombia investigated the effect of enemas on labour duration adjusted by parity. It found no statistically significant differences between groups for delivery types, episiotomy rates, or prescription of antibiotics. No significant differences were found in lower and upper respiratory tract infections rates. Similarly, no significant differences were found for ophthalmic infection rates, skin infections, or intestinal infections. The authors reported no significant differences in the distribution between groups for newborns' "Ballard" score, birthweight, diagnosis of neonatal apnoea, or the administration of ocular and umbilical prophylaxis. Twelve per cent of women had caesarean sections with no significant differences in rates between groups. In addition, no significant differences were found for the duration of labour (for all women for first stage of labour: median 515 minutes with enemas versus 585 minutes without enemas, P = 0.24; for second stage of labour: mean 43.2 minutes with enemas and 38 minutes without; MD 5.20, 95% CI ‐2.56 to 12.96; P=0.19; Analysis 1.22). These results could not be aggregated with the RCT from Thailand (Kovavisarach 2005) as times did not follow a normal distribution and, therefore, trialists considered non‐parametric measures (differences between medians). Finally, there were no significant difference in the degree of perineal tear between groups. The Colombian RCT found no significant differences between groups in the rate of neonatal infection after one month of follow‐up (370 newborns; RR 1.12, 95% CI 0.76 to 1.67; Analysis 1.4) | |
| In the trial from the United States, the mean times to delivery were 504.7 minutes and 392.7 minutes for enema and no enema respectively (152 women; MD 112, 95% CI 48.13 to 175.87; Analysis 1.21); we estimated the standard deviations because these were not provided by the researchers. Intrapartum infection rates were significantly higher in the enema group (RR 4.62, 95% CI 1.03 to 20.68; Analysis 1.33). However, when controlling for duration of membrane rupture, enema use fell below the level of significance for infection (no data was provided by trialists). Women who received enemas had significantly less faecal soiling at delivery (RR 0.36, 95% CI 0.17 to 0.75; Analysis 1.20). There was no significant difference in the mode of delivery between the two groups. No neonatal outcomes were reported. | |
| RCT: randomised controlled trial | |
| Outcome or subgroup title | No. of studies | No. of participants | Statistical method | Effect size |
| 1 Episiotomy dehiscence Show forest plot | 1 | 372 | Risk Ratio (M‐H, Fixed, 95% CI) | 0.69 [0.41, 1.14] |
| 2 Neonatal infection (all infections, including umbilical) Show forest plot | 1 | 222 | Risk Ratio (M‐H, Fixed, 95% CI) | 0.89 [0.31, 2.56] |
| 3 Neonatal infection (not specified) at 4 days Show forest plot | 1 | 1027 | Risk Ratio (M‐H, Fixed, 95% CI) | 0.0 [0.0, 0.0] |
| 4 Neonatal Infection (any infectious outcome, during the first month of life) Show forest plot | 1 | 370 | Risk Ratio (M‐H, Fixed, 95% CI) | 1.12 [0.76, 1.67] |
| 5 Neonatal infection: umbilical infection Show forest plot | 2 | 592 | Risk Ratio (M‐H, Fixed, 95% CI) | 3.16 [0.50, 19.82] |
| 6 Neonatal infection: respiratory tract infection (high ‐ during first month) Show forest plot | 1 | 369 | Risk Ratio (M‐H, Fixed, 95% CI) | 1.82 [0.73, 4.52] |
| 7 Neonatal infection: respiratory tract infection (low ‐ during first month) Show forest plot | 1 | 369 | Risk Ratio (M‐H, Fixed, 95% CI) | 0.10 [0.01, 1.73] |
| 8 Neonatal infection: meningitis Show forest plot | 1 | 370 | Risk Ratio (M‐H, Fixed, 95% CI) | 0.0 [0.0, 0.0] |
| 9 Neontal infection: sepsis Show forest plot | 1 | 370 | Risk Ratio (M‐H, Fixed, 95% CI) | 0.0 [0.0, 0.0] |
| 10 Perineal tear: skin or superficial tissue without compromising muscle Show forest plot | 2 | 1448 | Risk Ratio (M‐H, Fixed, 95% CI) | 1.14 [0.76, 1.71] |
| 11 Perineal tear: perineal muscle without anal muscles Show forest plot | 1 | 421 | Risk Ratio (M‐H, Fixed, 95% CI) | 0.72 [0.37, 1.40] |
| 12 Perineal tear: compromises anal muscles but not the mucosa Show forest plot | 2 | 1448 | Risk Ratio (M‐H, Fixed, 95% CI) | 0.46 [0.13, 1.64] |
| 13 Perineal tear: complete tear that compromises anal mucosa Show forest plot | 1 | 421 | Risk Ratio (M‐H, Fixed, 95% CI) | 2.93 [0.12, 71.51] |
| 14 No episiotomy wound ‐ no further tear Show forest plot | 1 | 1027 | Risk Ratio (M‐H, Fixed, 95% CI) | 0.74 [0.43, 1.27] |
| 15 No episiotomy wound ‐ further tear: 1st degree tear Show forest plot | 1 | 1027 | Risk Ratio (M‐H, Fixed, 95% CI) | 1.17 [0.63, 2.19] |
| 16 Episiotomy wound ‐ no further tear Show forest plot | 1 | 1027 | Risk Ratio (M‐H, Fixed, 95% CI) | 1.01 [0.98, 1.05] |
| 17 Episiotomy wound ‐ further tear: 3rd degree tear Show forest plot | 1 | 1027 | Risk Ratio (M‐H, Fixed, 95% CI) | 0.21 [0.01, 4.38] |
| 18 One‐minute Apgar < 7 Show forest plot | 1 | 431 | Risk Ratio (M‐H, Fixed, 95% CI) | 1.31 [0.57, 3.06] |
| 19 Five‐minute Apgar < 7 Show forest plot | 1 | 431 | Risk Ratio (M‐H, Fixed, 95% CI) | 1.31 [0.57, 3.06] |
| 20 Faecal soiling during delivery Show forest plot | 1 | 152 | Risk Ratio (M‐H, Fixed, 95% CI) | 0.36 [0.17, 0.75] |
| 21 Duration of labour (minutes) Show forest plot | 2 | 1179 | Mean Difference (IV, Random, 95% CI) | 28.04 [‐131.01, 187.10] |
| 22 Duration of labour (second stage) Show forest plot | 1 | 347 | Mean Difference (IV, Fixed, 95% CI) | 5.20 [‐2.56, 12.96] |
| 23 Parturients' levels of satisfaction (Likert scale) Show forest plot | 1 | 1027 | Mean Difference (IV, Fixed, 95% CI) | 0.0 [‐0.10, 0.10] |
| 24 Labour attendants' levels of satisfaction (Likert scale) Show forest plot | 1 | 1027 | Mean Difference (IV, Fixed, 95% CI) | 0.17 [0.08, 0.26] |
| 25 Accoucheurs' levels of satisfaction (Likert scale) Show forest plot | 1 | 1027 | Mean Difference (IV, Fixed, 95% CI) | 0.26 [0.15, 0.37] |
| 26 Perineorrhaphy operators' levels of satisfaction (Likert scale) Show forest plot | 1 | 1027 | Mean Difference (IV, Fixed, 95% CI) | 0.11 [0.02, 0.20] |
| 27 Pelvic infection: infected episiotomy Show forest plot | 1 | 372 | Risk Ratio (M‐H, Fixed, 95% CI) | 0.60 [0.18, 2.00] |
| 28 Pelvic infection: vulvovaginitis Show forest plot | 1 | 372 | Risk Ratio (M‐H, Fixed, 95% CI) | 0.15 [0.01, 2.87] |
| 29 Pelvic infection: endometritis Show forest plot | 1 | 372 | Risk Ratio (M‐H, Fixed, 95% CI) | 0.26 [0.03, 2.31] |
| 30 Pelvic infection: myometritis Show forest plot | 1 | 372 | Risk Ratio (M‐H, Fixed, 95% CI) | 3.13 [0.13, 76.37] |
| 31 Urinary tract infection Show forest plot | 1 | 372 | Risk Ratio (M‐H, Fixed, 95% CI) | 0.60 [0.18, 2.00] |
| 32 Other puerperal Infections Show forest plot | 2 | 594 | Risk Ratio (M‐H, Fixed, 95% CI) | 0.66 [0.42, 1.04] |
| 32.1 First 24 hours by interview | 1 | 222 | Risk Ratio (M‐H, Fixed, 95% CI) | 0.0 [0.0, 0.0] |
| 32.2 Infection during the first month | 1 | 372 | Risk Ratio (M‐H, Fixed, 95% CI) | 0.66 [0.42, 1.04] |
| 33 Other puerperal infections: Intrapartum infection rates Show forest plot | 1 | 152 | Risk Ratio (M‐H, Fixed, 95% CI) | 4.62 [1.03, 20.68] |
| 34 Need for systemic antibiotics (postpartum) Show forest plot | 1 | 428 | Risk Ratio (M‐H, Fixed, 95% CI) | 1.16 [0.73, 1.84] |
| 35 Need for systemic antibiotics (neonatal ‐ after hospital discharge during the first month) Show forest plot | 1 | 367 | Risk Ratio (M‐H, Fixed, 95% CI) | 0.21 [0.03, 1.80] |
| 36 Opthalmic infection (dacriocistitis or conjunctivitis in first month) Show forest plot | 1 | 370 | Risk Ratio (M‐H, Fixed, 95% CI) | 1.03 [0.62, 1.71] |
| 37 Skin infection (first month) Show forest plot | 1 | 370 | Risk Ratio (M‐H, Fixed, 95% CI) | 1.60 [0.27, 9.47] |
| 38 Intestinal infection Show forest plot | 1 | 368 | Risk Ratio (M‐H, Fixed, 95% CI) | 1.07 [0.07, 16.94] |