Resección y ablación del endometrio versus histerectomía para el sangrado menstrual abundante
Información
- DOI:
- https://doi.org/10.1002/14651858.CD000329.pub2Copiar DOI

- Base de datos:
-
- Cochrane Database of Systematic Reviews
- Versión publicada:
-
- 29 noviembre 2013see what's new
- Tipo:
-
- Intervention
- Etapa:
-
- Review
- Grupo Editorial Cochrane:
-
Grupo Cochrane de Ginecología y fertilidad
- Copyright:
-
- Copyright © 2013 The Cochrane Collaboration. Published by John Wiley & Sons, Ltd.
Cifras del artículo
Altmetric:
Citado por:
Autores
Contributions of authors
In the 2013 version of the review, Dr Rosalie Fergusson rewrote all sections of the review, including updating the protocol in line with current Cochrane Collaboration standards.
Dr Rosalie Fergusson and Anne Lethaby performed searches for relevant studies, selected studies for inclusion based on the protocol criteria, assessed the included trials for quality and performed data extraction and entered data, aside from the sections involving cost, for the 2013 update. They also incorporated changes suggested by the peer review.
In the 2008 version of the review, Dr Sasha Shepperd was involved in selection of trials for inclusion and independently assessed the quality of the included studies and performed data extraction. She performed a significant role in editing the final draft and analysing the cost data. Dr Cindy Farquhar wrote the conclusions to the first published version of the review and helped edit the final draft when the review was first published.
Sources of support
Internal sources
-
Department of Obstetrics and Gynaecology, National Women's Hospital, Auckland, New Zealand.
External sources
-
NHS Executive, Anglia and Oxford Region R&D Programme, UK.
-
Health Research Council, Auckland, New Zealand.
Declarations of interest
No conflicts of interest were reported.
Acknowledgements
The review authors acknowledge the helpful comments of those who refereed previous versions of this review. We are especially grateful to Professor Pier Crosignani, Dr Kay Dickerson and Dr Sbracia, who answered queries and provided additional material for this review. Special thanks are also due to Helen Nagels, Managing Editor of the Menstrual Disorders and Subfertility Group, for her professionalism and help with the inevitable problems that arose, and to Marion Showell, Trials Search Co‐ordinator, for her assistance in identifying trials.
The authors of the 2013 update acknowledge the contribution of Dr Inez Cooke, who wrote the protocol for the 2008 review.
Version history
| Published | Title | Stage | Authors | Version |
| 2021 Feb 23 | Endometrial resection and ablation versus hysterectomy for heavy menstrual bleeding | Review | Magdalena Bofill Rodriguez, Anne Lethaby, Rosalie J Fergusson | |
| 2019 Aug 29 | Endometrial resection and ablation versus hysterectomy for heavy menstrual bleeding | Review | Rosalie J Fergusson, Magdalena Bofill Rodriguez, Anne Lethaby, Cindy Farquhar | |
| 2013 Nov 29 | Endometrial resection and ablation versus hysterectomy for heavy menstrual bleeding | Review | Rosalie J Fergusson, Anne Lethaby, Sasha Shepperd, Cindy Farquhar | |
| 1999 Apr 26 | Endometrial resection and ablation versus hysterectomy for heavy menstrual bleeding | Review | Anne Lethaby, Sasha Shepperd, Cindy Farquhar, Inez Cooke | |
Keywords
MeSH
Medical Subject Headings (MeSH) Keywords
- Bias;
- Endometrial Ablation Techniques [adverse effects, *methods];
- Endometrium [*surgery];
- Hysterectomy [adverse effects, *methods];
- Hysteroscopy;
- Menorrhagia [*surgery];
- Minimally Invasive Surgical Procedures;
- Operative Time;
- Patient Satisfaction;
- Quality of Life;
- Randomized Controlled Trials as Topic;
- Treatment Outcome;
Medical Subject Headings Check Words
Female; Humans;
PICO

Study screening and selection process (2008 to 2013).

Methodological quality graph: review authors' judgements about each methodological quality item presented as percentages across all included studies.
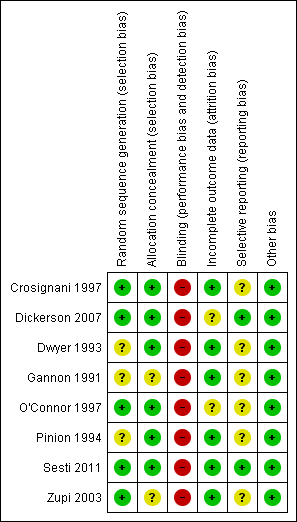
Methodological quality summary: review authors' judgements about each methodological quality item for each included study.

Forest plot of comparison: 1 Endometrial resection/ablation versus hysterectomy, outcome: 1.1 Woman's perception (proportion with improvement in bleeding symptoms).

Forest plot of comparison: 1 Endometrial resection/ablation versus hysterectomy, outcome: 1.3 Proportion requiring further surgery for HMB.
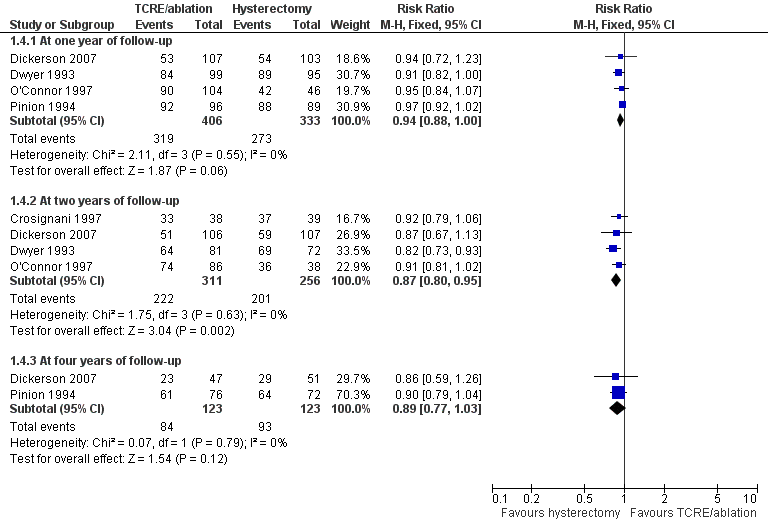
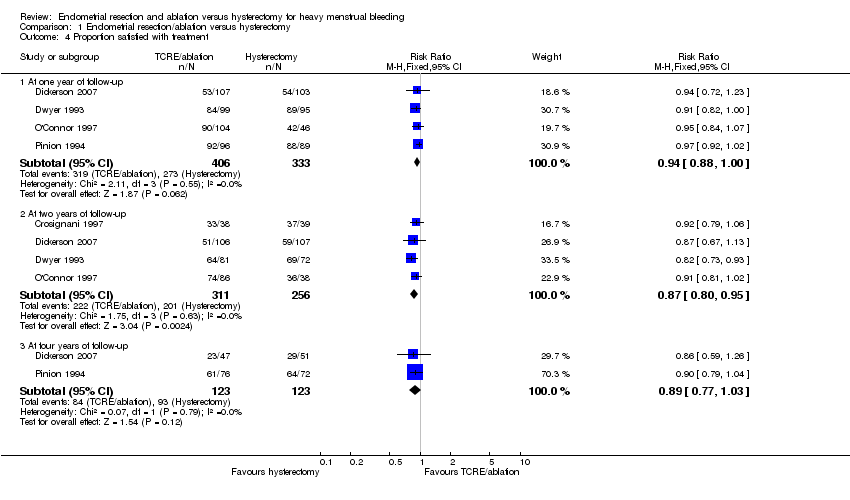
Forest plot of comparison: 1 Endometrial resection/ablation versus hysterectomy, outcome: 1.4 Proportion satisfied with treatment.

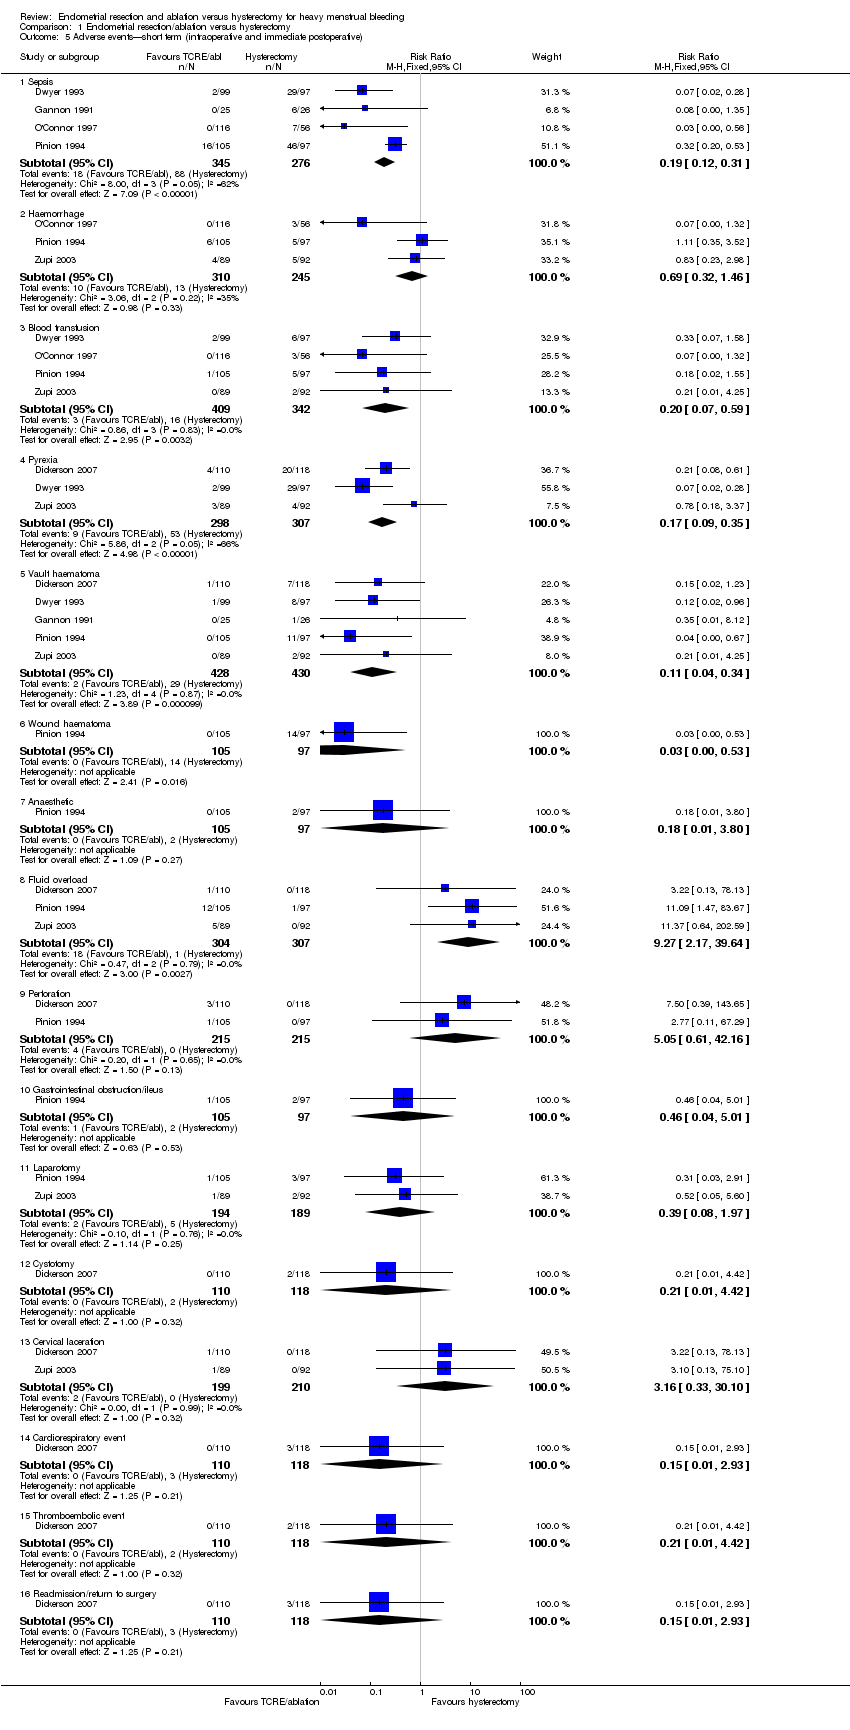
Forest plot of comparison: 1 Endometrial resection/ablation versus hysterectomy, outcome: 1.5 Adverse events—short term (intraoperative and immediate postoperative).

Forest plot of comparison: 1 Endometrial resection/ablation versus hysterectomy, outcome: 1.6 Adverse events—long term (after hospital discharge).

Forest plot of comparison: 1 Endometrial resection/ablation versus hysterectomy, outcome: 1.7 Quality of life scores (continuous data).

Comparison 1 Endometrial resection/ablation versus hysterectomy, Outcome 1 Woman's perception (proportion with improvement in bleeding symptoms).

Comparison 1 Endometrial resection/ablation versus hysterectomy, Outcome 2 PBAC score (continuous data).

Comparison 1 Endometrial resection/ablation versus hysterectomy, Outcome 3 Proportion requiring further surgery for HMB.
Comparison 1 Endometrial resection/ablation versus hysterectomy, Outcome 4 Proportion satisfied with treatment.
Comparison 1 Endometrial resection/ablation versus hysterectomy, Outcome 5 Adverse events—short term (intraoperative and immediate postoperative).

Comparison 1 Endometrial resection/ablation versus hysterectomy, Outcome 6 Adverse events—long term (after hospital discharge).

Comparison 1 Endometrial resection/ablation versus hysterectomy, Outcome 7 Quality of life scores (continuous data).

Comparison 1 Endometrial resection/ablation versus hysterectomy, Outcome 8 Quality of life (proportion with improvement).

Comparison 1 Endometrial resection/ablation versus hysterectomy, Outcome 9 Duration of surgery (minutes).

Comparison 1 Endometrial resection/ablation versus hysterectomy, Outcome 10 Time to return to work (weeks).
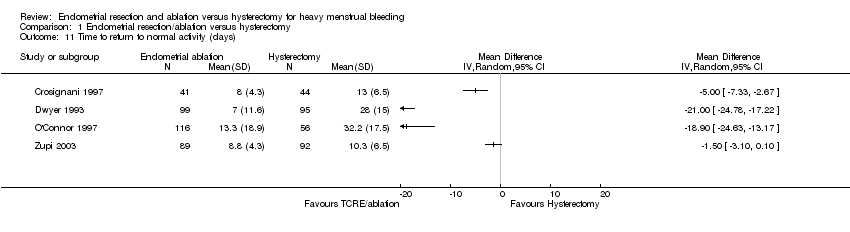
Comparison 1 Endometrial resection/ablation versus hysterectomy, Outcome 11 Time to return to normal activity (days).

Comparison 1 Endometrial resection/ablation versus hysterectomy, Outcome 12 Duration of hospital stay (days).
| Study | |
| Dwyer 1993 | FOUR MONTHS FOLLOW UP 2.2 YEARS OF FOLLOW UP |
| Gannon 1991 | INITIAL COSTS (NHS) |
| Pinion 1994 | ONE YEAR OF FOLLOW UP FOUR YEARS OF FOLLOW UP |
Comparison 1 Endometrial resection/ablation versus hysterectomy, Outcome 13 Total health service cost per woman.
| Study | |
| Pinion 1994 | ONE YEAR OF FOLLOW UP Mean annual savings from sanitary protection after treatment in UK pounds in 1994: |
Comparison 1 Endometrial resection/ablation versus hysterectomy, Outcome 14 Total individual cost per woman.
| Endometrial resection/ablation for heavy menstrual bleeding | ||||||
| Patient or population: women with heavy menstrual bleeding | ||||||
| Outcomes | Illustrative comparative risks* (95% CI) | Relative effect | No of participants | Quality of the evidence | Comments | |
| Assumed risk | Corresponding risk | |||||
| Control | Endometrial resection/ablation | |||||
| Woman's perception (proportion with improvement in bleeding symptoms)—within one year of follow‐up | 978 per 1,000 | 890 per 1,000 | RR 0.91 | 650 | ⊕⊕⊝⊝ | |
| PBAC score (continuous data)—at one year of follow‐up | Mean PBAC score (continuous data) at one year of follow‐up in the intervention groups was | 68 | ⊕⊕⊕⊝ | |||
| Adverse events—short term (intraoperative and immediate postoperative)—sepsis | 319 per 1,000 | 61 per 1,000 | RR 0.19 | 621 | ⊕⊕⊕⊝ | |
| Proportion requiring further surgery for HMB—within one year after surgery | 2 per 1,0003 | 36 per 1,000 | RR 14.94 | 887 | ⊕⊕⊝⊝ | |
| Proportion satisfied with treatment—at one year of follow‐up | 820 per 1,000 | 771 per 1,000 | RR 0.94 | 739 | ⊕⊕⊕⊝ | |
| *The basis for the assumed risk (e.g. the median control group risk across studies) is provided in footnotes. The corresponding risk (and its 95% confidence interval) is based on the assumed risk in the comparison group and the relative effect of the intervention (and its 95% CI). | ||||||
| GRADE Working Group grades of evidence. | ||||||
| 1Lack of blinding (although unfeasible) is likely to bias women's responses. 3Result suggests incomplete operation—rare. | ||||||
| Outcome or subgroup title | No. of studies | No. of participants | Statistical method | Effect size |
| 1 Woman's perception (proportion with improvement in bleeding symptoms) Show forest plot | 5 | Risk Ratio (M‐H, Fixed, 95% CI) | Subtotals only | |
| 1.1 Within one year of follow‐up | 4 | 650 | Risk Ratio (M‐H, Fixed, 95% CI) | 0.89 [0.85, 0.93] |
| 1.2 At two years of follow‐up | 2 | 292 | Risk Ratio (M‐H, Fixed, 95% CI) | 0.92 [0.86, 0.99] |
| 1.3 At four years of follow‐up | 2 | 237 | Risk Ratio (M‐H, Fixed, 95% CI) | 0.93 [0.88, 0.99] |
| 2 PBAC score (continuous data) Show forest plot | 1 | Mean Difference (IV, Fixed, 95% CI) | Subtotals only | |
| 2.1 At one year of follow‐up | 1 | 68 | Mean Difference (IV, Fixed, 95% CI) | 24.4 [16.01, 32.79] |
| 2.2 At two years of follow‐up | 1 | 68 | Mean Difference (IV, Fixed, 95% CI) | 44.0 [36.09, 51.91] |
| 3 Proportion requiring further surgery for HMB Show forest plot | 8 | Risk Ratio (M‐H, Fixed, 95% CI) | Subtotals only | |
| 3.1 Within one year after surgery | 6 | 887 | Risk Ratio (M‐H, Fixed, 95% CI) | 14.94 [5.24, 42.57] |
| 3.2 At two years after surgery | 6 | 930 | Risk Ratio (M‐H, Fixed, 95% CI) | 23.36 [8.30, 65.75] |
| 3.3 At three years after surgery | 1 | 172 | Risk Ratio (M‐H, Fixed, 95% CI) | 11.10 [1.54, 80.14] |
| 3.4 At four years after surgery | 1 | 197 | Risk Ratio (M‐H, Fixed, 95% CI) | 36.32 [5.09, 259.21] |
| 4 Proportion satisfied with treatment Show forest plot | 5 | Risk Ratio (M‐H, Fixed, 95% CI) | Subtotals only | |
| 4.1 At one year of follow‐up | 4 | 739 | Risk Ratio (M‐H, Fixed, 95% CI) | 0.94 [0.88, 1.00] |
| 4.2 At two years of follow‐up | 4 | 567 | Risk Ratio (M‐H, Fixed, 95% CI) | 0.87 [0.80, 0.95] |
| 4.3 At four years of follow‐up | 2 | 246 | Risk Ratio (M‐H, Fixed, 95% CI) | 0.89 [0.77, 1.03] |
| 5 Adverse events—short term (intraoperative and immediate postoperative) Show forest plot | 6 | Risk Ratio (M‐H, Fixed, 95% CI) | Subtotals only | |
| 5.1 Sepsis | 4 | 621 | Risk Ratio (M‐H, Fixed, 95% CI) | 0.19 [0.12, 0.31] |
| 5.2 Haemorrhage | 3 | 555 | Risk Ratio (M‐H, Fixed, 95% CI) | 0.69 [0.32, 1.46] |
| 5.3 Blood transfusion | 4 | 751 | Risk Ratio (M‐H, Fixed, 95% CI) | 0.20 [0.07, 0.59] |
| 5.4 Pyrexia | 3 | 605 | Risk Ratio (M‐H, Fixed, 95% CI) | 0.17 [0.09, 0.35] |
| 5.5 Vault haematoma | 5 | 858 | Risk Ratio (M‐H, Fixed, 95% CI) | 0.11 [0.04, 0.34] |
| 5.6 Wound haematoma | 1 | 202 | Risk Ratio (M‐H, Fixed, 95% CI) | 0.03 [0.00, 0.53] |
| 5.7 Anaesthetic | 1 | 202 | Risk Ratio (M‐H, Fixed, 95% CI) | 0.18 [0.01, 3.80] |
| 5.8 Fluid overload | 3 | 611 | Risk Ratio (M‐H, Fixed, 95% CI) | 9.27 [2.17, 39.64] |
| 5.9 Perforation | 2 | 430 | Risk Ratio (M‐H, Fixed, 95% CI) | 5.05 [0.61, 42.16] |
| 5.10 Gastrointestinal obstruction/ileus | 1 | 202 | Risk Ratio (M‐H, Fixed, 95% CI) | 0.46 [0.04, 5.01] |
| 5.11 Laparotomy | 2 | 383 | Risk Ratio (M‐H, Fixed, 95% CI) | 0.39 [0.08, 1.97] |
| 5.12 Cystotomy | 1 | 228 | Risk Ratio (M‐H, Fixed, 95% CI) | 0.21 [0.01, 4.42] |
| 5.13 Cervical laceration | 2 | 409 | Risk Ratio (M‐H, Fixed, 95% CI) | 3.16 [0.33, 30.10] |
| 5.14 Cardiorespiratory event | 1 | 228 | Risk Ratio (M‐H, Fixed, 95% CI) | 0.15 [0.01, 2.93] |
| 5.15 Thromboembolic event | 1 | 228 | Risk Ratio (M‐H, Fixed, 95% CI) | 0.21 [0.01, 4.42] |
| 5.16 Readmission/return to surgery | 1 | 228 | Risk Ratio (M‐H, Fixed, 95% CI) | 0.15 [0.01, 2.93] |
| 6 Adverse events—long term (after hospital discharge) Show forest plot | 2 | Risk Ratio (M‐H, Fixed, 95% CI) | Subtotals only | |
| 6.1 Sepsis | 1 | 172 | Risk Ratio (M‐H, Fixed, 95% CI) | 0.27 [0.13, 0.58] |
| 6.2 Haematoma | 2 | 368 | Risk Ratio (M‐H, Fixed, 95% CI) | 0.59 [0.15, 2.37] |
| 6.3 Haemorrhage | 1 | 196 | Risk Ratio (M‐H, Fixed, 95% CI) | 2.94 [0.12, 71.30] |
| 7 Quality of life scores (continuous data) Show forest plot | 6 | Mean Difference (IV, Fixed, 95% CI) | Subtotals only | |
| 7.1 SF‐36 at one year—Role Limitation (physical) | 1 | 181 | Mean Difference (IV, Fixed, 95% CI) | ‐0.80 [‐4.99, 3.39] |
| 7.2 SF‐36 at one year—Role Limitation (emotional) | 1 | 181 | Mean Difference (IV, Fixed, 95% CI) | ‐3.90 [‐8.21, 0.41] |
| 7.3 SF‐36 at one year—Social Functioning | 1 | 181 | Mean Difference (IV, Fixed, 95% CI) | ‐21.20 [‐24.73, ‐17.67] |
| 7.4 SF‐36 at one year—Mental Health | 2 | 385 | Mean Difference (IV, Fixed, 95% CI) | ‐1.53 [‐5.06, 2.01] |
| 7.5 SF‐36 at one year—Energy | 2 | 211 | Mean Difference (IV, Fixed, 95% CI) | ‐10.99 [‐14.45, ‐7.53] |
| 7.6 SF‐36 at one year—Pain | 2 | 391 | Mean Difference (IV, Fixed, 95% CI) | ‐1.91 [‐5.67, 1.86] |
| 7.7 SF‐36 at one year—General Health Perception | 2 | 385 | Mean Difference (IV, Fixed, 95% CI) | ‐7.27 [‐10.72, ‐3.81] |
| 7.8 SF‐36 at one year—Physical Functioning | 1 | 181 | Mean Difference (IV, Fixed, 95% CI) | ‐1.20 [‐5.34, 2.94] |
| 7.9 SF‐36 at two years—Role Limitation (physical) | 3 | 300 | Mean Difference (IV, Fixed, 95% CI) | ‐3.09 [‐7.94, 1.76] |
| 7.10 SF‐36 at two years—Role Limitation (emotional) | 3 | 300 | Mean Difference (IV, Fixed, 95% CI) | 10.22 [5.48, 14.96] |
| 7.11 SF‐36 at two years—Social Functioning | 3 | 300 | Mean Difference (IV, Fixed, 95% CI) | ‐10.06 [‐13.55, ‐6.58] |
| 7.12 SF‐36 at two years—Mental Health | 4 | 509 | Mean Difference (IV, Fixed, 95% CI) | 2.39 [‐0.61, 5.40] |
| 7.13 SF‐36 at two years—Energy | 4 | 513 | Mean Difference (IV, Fixed, 95% CI) | ‐2.01 [‐5.41, 1.40] |
| 7.14 SF‐36 at two years—Pain | 4 | 513 | Mean Difference (IV, Fixed, 95% CI) | ‐9.50 [‐12.80, ‐6.21] |
| 7.15 SF‐36 at two years—General Health Perception | 4 | 509 | Mean Difference (IV, Fixed, 95% CI) | ‐7.42 [‐10.64, ‐4.20] |
| 7.16 SF‐36 at two years—Physical Functioning | 3 | 300 | Mean Difference (IV, Fixed, 95% CI) | ‐9.29 [‐12.80, ‐5.78] |
| 7.17 GR inventory scores at one year after surgery | 1 | 182 | Mean Difference (IV, Fixed, 95% CI) | 0.0 [‐1.75, 1.75] |
| 7.18 Euroqol score within one year after surgery | 2 | 347 | Mean Difference (IV, Fixed, 95% CI) | ‐3.24 [‐8.35, 1.88] |
| 7.19 Euroqol scores at two years after surgery | 2 | 368 | Mean Difference (IV, Fixed, 95% CI) | ‐1.96 [‐5.60, 1.67] |
| 7.20 SSR score at two years after surgery | 1 | 77 | Mean Difference (IV, Fixed, 95% CI) | ‐3.70 [‐11.17, 3.77] |
| 7.21 Total HAD scores at two years after surgery | 1 | 77 | Mean Difference (IV, Fixed, 95% CI) | ‐1.5 [‐4.32, 1.32] |
| 7.22 Anxiety HAD scores at two and four years after surgery | 2 | 259 | Mean Difference (IV, Fixed, 95% CI) | ‐0.67 [‐1.64, 0.30] |
| 7.23 Depression HAD scores at two and four years after surgery | 2 | 259 | Mean Difference (IV, Fixed, 95% CI) | ‐0.00 [‐0.10, 0.09] |
| 8 Quality of life (proportion with improvement) Show forest plot | 2 | Risk Ratio (M‐H, Fixed, 95% CI) | Subtotals only | |
| 8.1 Proportion with improvement in pain two years after surgery | 1 | 59 | Risk Ratio (M‐H, Fixed, 95% CI) | 1.60 [0.55, 4.63] |
| 8.2 Proportion with improvement in general health one year after surgery | 1 | 185 | Risk Ratio (M‐H, Fixed, 95% CI) | 4.17 [1.47, 11.85] |
| 8.3 Proportion with improvement in general health four years after surgery | 1 | 146 | Risk Ratio (M‐H, Fixed, 95% CI) | 2.76 [0.93, 8.17] |
| 9 Duration of surgery (minutes) Show forest plot | 7 | Mean Difference (IV, Random, 95% CI) | Totals not selected | |
| 10 Time to return to work (weeks) Show forest plot | 5 | Mean Difference (IV, Random, 95% CI) | Totals not selected | |
| 11 Time to return to normal activity (days) Show forest plot | 4 | Mean Difference (IV, Random, 95% CI) | Totals not selected | |
| 12 Duration of hospital stay (days) Show forest plot | 7 | Mean Difference (IV, Random, 95% CI) | Totals not selected | |
| 13 Total health service cost per woman Show forest plot | Other data | No numeric data | ||
| 14 Total individual cost per woman Show forest plot | Other data | No numeric data | ||