Scolaris Content Display Scolaris Content Display

Study screening and selection process (2008 to 2013).
Figuras y tablas -
Figure 1

Study screening and selection process (2008 to 2013).

Methodological quality graph: review authors' judgements about each methodological quality item presented as percentages across all included studies.
Figuras y tablas -
Figure 2

Methodological quality graph: review authors' judgements about each methodological quality item presented as percentages across all included studies.

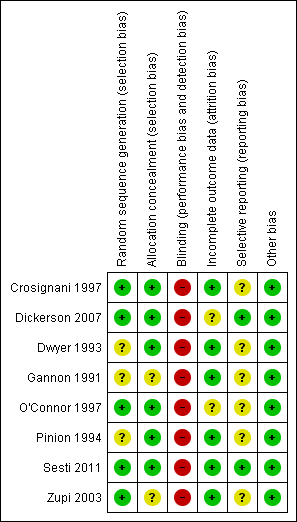
Methodological quality summary: review authors' judgements about each methodological quality item for each included study.
Figuras y tablas -
Figure 3

Methodological quality summary: review authors' judgements about each methodological quality item for each included study.

Forest plot of comparison: 1 Endometrial resection/ablation versus hysterectomy, outcome: 1.1 Woman's perception (proportion with improvement in bleeding symptoms).
Figuras y tablas -
Figure 4

Forest plot of comparison: 1 Endometrial resection/ablation versus hysterectomy, outcome: 1.1 Woman's perception (proportion with improvement in bleeding symptoms).

Forest plot of comparison: 1 Endometrial resection/ablation versus hysterectomy, outcome: 1.3 Proportion requiring further surgery for HMB.
Figuras y tablas -
Figure 5

Forest plot of comparison: 1 Endometrial resection/ablation versus hysterectomy, outcome: 1.3 Proportion requiring further surgery for HMB.

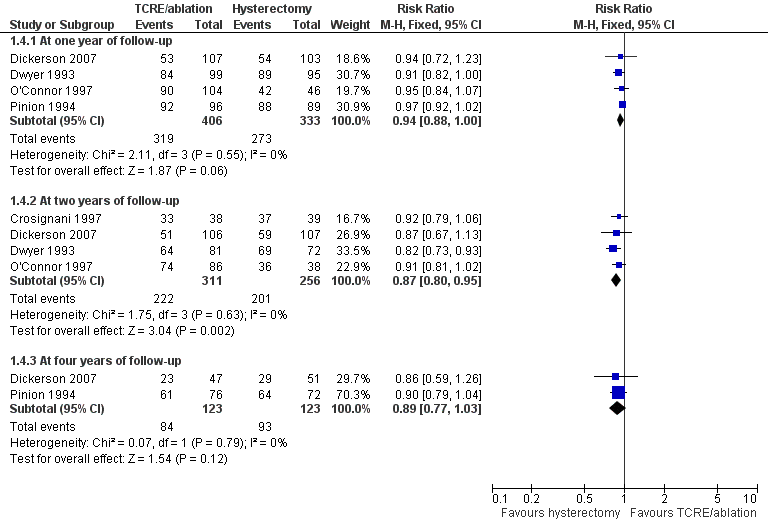
Forest plot of comparison: 1 Endometrial resection/ablation versus hysterectomy, outcome: 1.4 Proportion satisfied with treatment.
Figuras y tablas -
Figure 6

Forest plot of comparison: 1 Endometrial resection/ablation versus hysterectomy, outcome: 1.4 Proportion satisfied with treatment.

Forest plot of comparison: 1 Endometrial resection/ablation versus hysterectomy, outcome: 1.5 Adverse events—short term (intraoperative and immediate postoperative).
Figuras y tablas -
Figure 7

Forest plot of comparison: 1 Endometrial resection/ablation versus hysterectomy, outcome: 1.5 Adverse events—short term (intraoperative and immediate postoperative).

Forest plot of comparison: 1 Endometrial resection/ablation versus hysterectomy, outcome: 1.6 Adverse events—long term (after hospital discharge).
Figuras y tablas -
Figure 8

Forest plot of comparison: 1 Endometrial resection/ablation versus hysterectomy, outcome: 1.6 Adverse events—long term (after hospital discharge).

Forest plot of comparison: 1 Endometrial resection/ablation versus hysterectomy, outcome: 1.7 Quality of life scores (continuous data).
Figuras y tablas -
Figure 9

Forest plot of comparison: 1 Endometrial resection/ablation versus hysterectomy, outcome: 1.7 Quality of life scores (continuous data).

Comparison 1 Endometrial resection/ablation versus hysterectomy, Outcome 1 Woman's perception (proportion with improvement in bleeding symptoms).
Figuras y tablas -
Analysis 1.1

Comparison 1 Endometrial resection/ablation versus hysterectomy, Outcome 1 Woman's perception (proportion with improvement in bleeding symptoms).

Comparison 1 Endometrial resection/ablation versus hysterectomy, Outcome 2 PBAC score (continuous data).
Figuras y tablas -
Analysis 1.2

Comparison 1 Endometrial resection/ablation versus hysterectomy, Outcome 2 PBAC score (continuous data).

Comparison 1 Endometrial resection/ablation versus hysterectomy, Outcome 3 Proportion requiring further surgery for HMB.
Figuras y tablas -
Analysis 1.3

Comparison 1 Endometrial resection/ablation versus hysterectomy, Outcome 3 Proportion requiring further surgery for HMB.

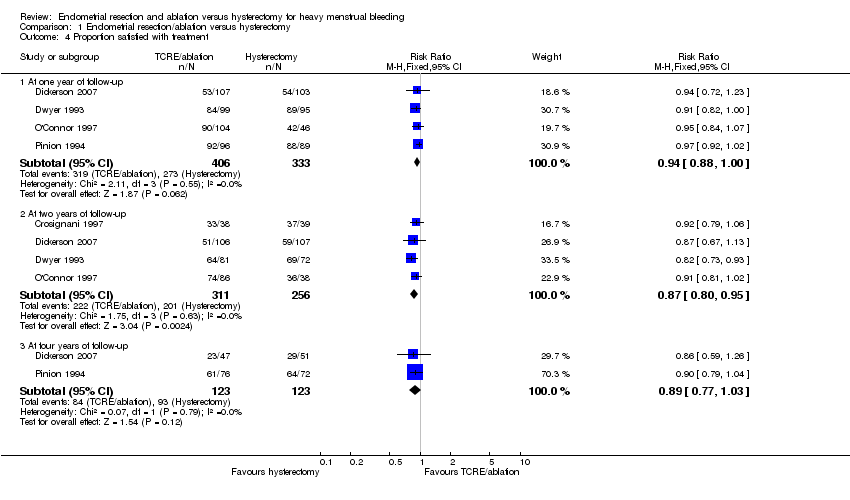
Comparison 1 Endometrial resection/ablation versus hysterectomy, Outcome 4 Proportion satisfied with treatment.
Figuras y tablas -
Analysis 1.4

Comparison 1 Endometrial resection/ablation versus hysterectomy, Outcome 4 Proportion satisfied with treatment.

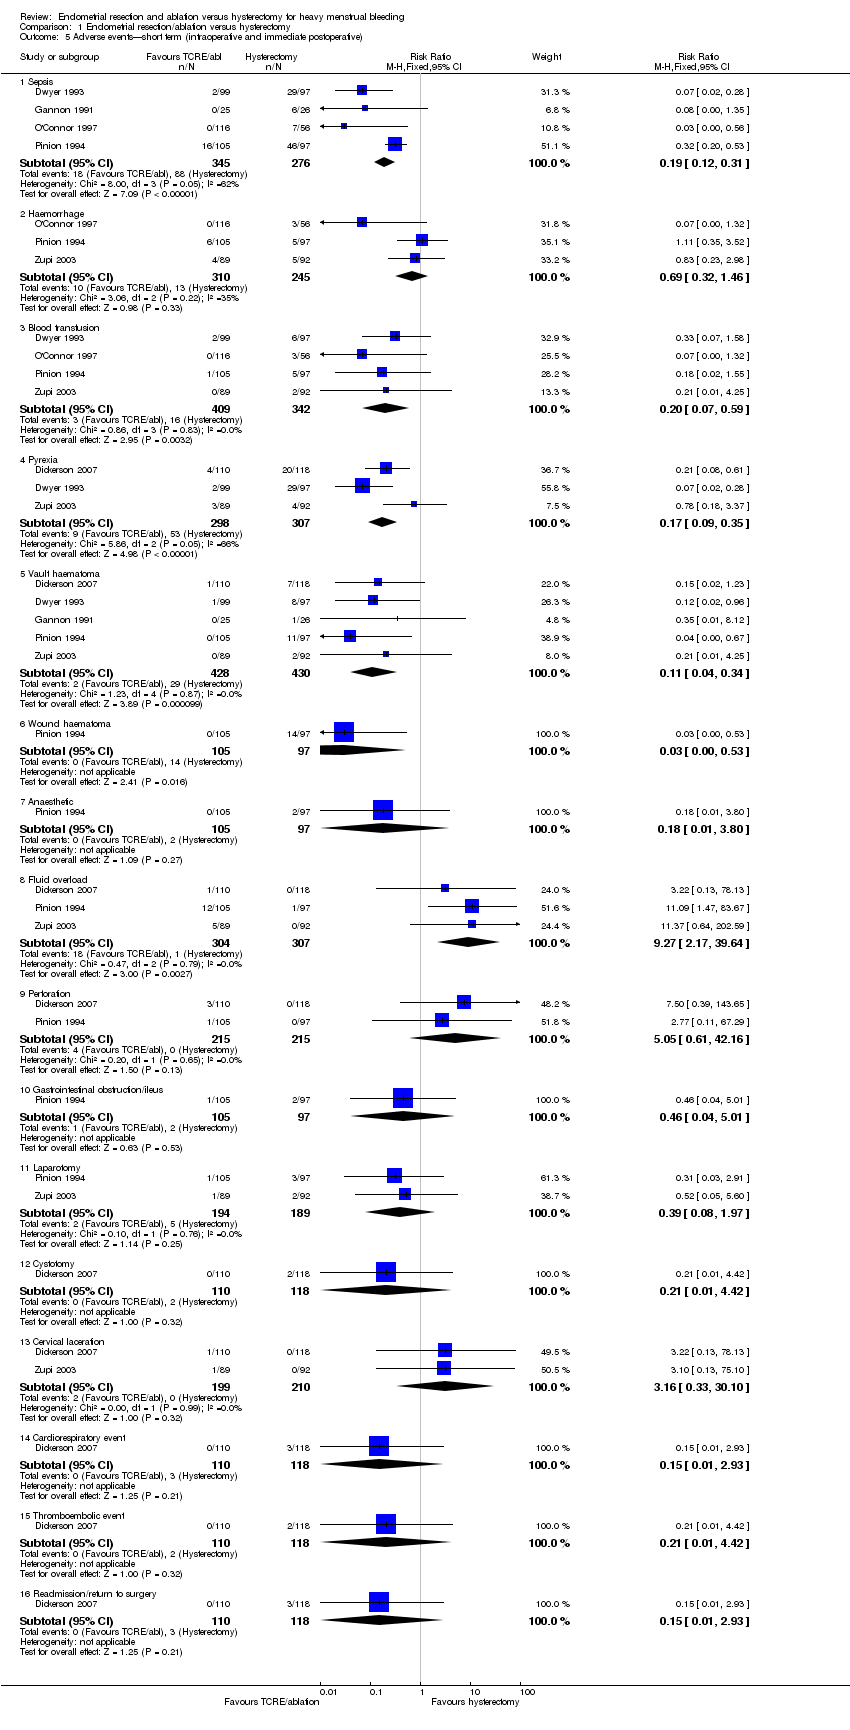
Comparison 1 Endometrial resection/ablation versus hysterectomy, Outcome 5 Adverse events—short term (intraoperative and immediate postoperative).
Figuras y tablas -
Analysis 1.5

Comparison 1 Endometrial resection/ablation versus hysterectomy, Outcome 5 Adverse events—short term (intraoperative and immediate postoperative).

Comparison 1 Endometrial resection/ablation versus hysterectomy, Outcome 6 Adverse events—long term (after hospital discharge).
Figuras y tablas -
Analysis 1.6

Comparison 1 Endometrial resection/ablation versus hysterectomy, Outcome 6 Adverse events—long term (after hospital discharge).

Comparison 1 Endometrial resection/ablation versus hysterectomy, Outcome 7 Quality of life scores (continuous data).
Figuras y tablas -
Analysis 1.7

Comparison 1 Endometrial resection/ablation versus hysterectomy, Outcome 7 Quality of life scores (continuous data).

Comparison 1 Endometrial resection/ablation versus hysterectomy, Outcome 8 Quality of life (proportion with improvement).
Figuras y tablas -
Analysis 1.8

Comparison 1 Endometrial resection/ablation versus hysterectomy, Outcome 8 Quality of life (proportion with improvement).

Comparison 1 Endometrial resection/ablation versus hysterectomy, Outcome 9 Duration of surgery (minutes).
Figuras y tablas -
Analysis 1.9

Comparison 1 Endometrial resection/ablation versus hysterectomy, Outcome 9 Duration of surgery (minutes).

Comparison 1 Endometrial resection/ablation versus hysterectomy, Outcome 10 Time to return to work (weeks).
Figuras y tablas -
Analysis 1.10

Comparison 1 Endometrial resection/ablation versus hysterectomy, Outcome 10 Time to return to work (weeks).

Comparison 1 Endometrial resection/ablation versus hysterectomy, Outcome 11 Time to return to normal activity (days).
Figuras y tablas -
Analysis 1.11

Comparison 1 Endometrial resection/ablation versus hysterectomy, Outcome 11 Time to return to normal activity (days).

Comparison 1 Endometrial resection/ablation versus hysterectomy, Outcome 12 Duration of hospital stay (days).
Figuras y tablas -
Analysis 1.12

Comparison 1 Endometrial resection/ablation versus hysterectomy, Outcome 12 Duration of hospital stay (days).

Study

Dwyer 1993

FOUR MONTHS FOLLOW UP
Mean resource cost per patient (UK pounds) in 1991/92 prices:
Endometrial resection: UK pounds 560.05 (SD 261.22)
Hysterectomy: UK pounds 1059.73 (SD 198.04)
These costs were made up of pre‐operative, operative and post‐operative costs, hotel costs, complications costs, re‐treatment and general practice costs.
Mean difference in cost between groups : UK pounds ‐499.68 (95% CI ‐567 to ‐432)
Statistical test not specifically stated.
Mean cost of resection at 4 months follow up 53% the cost of hysterectomy.

2.2 YEARS OF FOLLOW UP
Mean resource cost per patient (UK pounds) in 1994 prices:
Endometrial resection: UK pounds 790 (SD 493)
Hysterectomy: UK pounds 1110 (SD 168)
Costs made up of initial surgery, re‐treatment costs, other resource use after 4 months and HRT.
Wilcoxon Rank Sum test used to test the difference between groups with a 5% significance level, p=0.0001.
Mean cost of resection at 2.2 years of follow up 71% the cost of hysterectomy.

Gannon 1991

INITIAL COSTS (NHS)
Mean cost per operation (UK pounds) in 1991:
Endometrial resection: UK pounds 407 Abdominal hysterectomy: UK pounds 1270
This cost was made up of: (1) variable costs: average cost of theatre consumables, staffing and maintenance in the operating theatre, marginal cost of a bed on the gynaecological ward; and (2) fixed costs: capital depreciation, hospital staffing and energy.
The difference between groups in resource cost was not assessed in a statistical test.

Pinion 1994

ONE YEAR OF FOLLOW UP
Mean resource cost per patient in UK pounds in 1994:
Endometrial resection: UK pounds 1001.00
Laser ablation: UK pounds 1046.00
Hysterectomy: UK pounds 1315.00
No statistical test used to compare the difference between groups.
Mean cost of endometrial resection at 1 year of follow up 76% of cost of hysterectomy.
Mean cost of laser ablation at 1 year of follow up 80% of cost of hysterectomy.
Costs based on pre‐operative costs, nights in hospital, theatre and ward costs, GP and out‐patient costs, re‐treatment costs and technical equipment costs.

FOUR YEARS OF FOLLOW UP
Mean resource cost per patient in UK pounds in 1994:
Endometrial destruction techniques: UK pounds 1231
Hysterectomy: UK pounds 1332
Includes additional costs for re‐treatment or additional procedures arising between 1 and 4 years after surgery. Data reported as 1994 rates (discounted by 6%).
Sensitivity analysis performed with variations in the discount rate.
Cost of endometrial ablation techniques at 4 years reported as between 89% and 95% the costs of hysterectomy.

Figuras y tablas -
Analysis 1.13

Comparison 1 Endometrial resection/ablation versus hysterectomy, Outcome 13 Total health service cost per woman.

Study

Pinion 1994

ONE YEAR OF FOLLOW UP
Mean patient cost in UK pounds in 1994 prices:
Hysteroscopic surgery: UK pounds 21.00 (95% CI 13.3, 33.1)
Hysterectomy: UK pounds 73.40 (95% CI 42.1, 127)
Mean cost of hysteroscopic surgery 29% the cost of hysterectomy surgery.
Costs estimated included loss of pay, child care and travel expenses.
Student t test used to compare differences between surgery groups, p<0.05.

Mean annual savings from sanitary protection after treatment in UK pounds in 1994:
Hysteroscopic surgery: UK pounds 58.30 (95% CI 51.4, 66)
Hysterectomy: UK pounds 85.10 (95% CI 72.2, 100)
Student t test used to compare differences between surgery groups, p<0.05.

Figuras y tablas -
Analysis 1.14

Comparison 1 Endometrial resection/ablation versus hysterectomy, Outcome 14 Total individual cost per woman.

Summary of findings for the main comparison. Endometrial resection/ablation for heavy menstrual bleeding

Endometrial resection/ablation for heavy menstrual bleeding

Patient or population: women with heavy menstrual bleeding
Settings:
Intervention: endometrial resection/ablation

Outcomes

Illustrative comparative risks* (95% CI)

Relative effect
(95% CI)

No of participants
(studies)

Quality of the evidence
(GRADE)

Comments

Assumed risk

Corresponding risk

Control

Endometrial resection/ablation

Woman's perception (proportion with improvement in bleeding symptoms)—within one year of follow‐up

978 per 1,000

890 per 1,000
(783 to 949)

RR 0.91
(0.8 to 0.97)

650
(4 studies)

⊕⊕⊝⊝
low1,2

PBAC score (continuous data)—at one year of follow‐up

Mean PBAC score (continuous data) at one year of follow‐up in the intervention groups was
24.4 higher
(16.01 to 32.79 higher)

68
(1 study)

⊕⊕⊕⊝
moderate1

Adverse eventsshort term (intraoperative and immediate postoperative)sepsis

319 per 1,000

61 per 1,000
(38 to 99)

RR 0.19
(0.12 to 0.31)

621
(4 studies)

⊕⊕⊕⊝
moderate2

Proportion requiring further surgery for HMB—within one year after surgery

2 per 1,0003

36 per 1,000
(13 to 103)

RR 14.94
(5.24 to 42.57)

887
(6 studies)

⊕⊕⊝⊝
low1,4

Proportion satisfied with treatment—at one year of follow‐up

820 per 1,000

771 per 1,000
(721 to 820)

RR 0.94
(0.88 to 1)

739
(4 studies)

⊕⊕⊕⊝
moderate1

*The basis for the assumed risk (e.g. the median control group risk across studies) is provided in footnotes. The corresponding risk (and its 95% confidence interval) is based on the assumed risk in the comparison group and the relative effect of the intervention (and its 95% CI).
CI: Confidence interval; RR: Risk ratio.

GRADE Working Group grades of evidence.
High quality: Further research is very unlikely to change our confidence in the estimate of effect.
Moderate quality: Further research is likely to have an important impact on our confidence in the estimate of effect and may change the estimate.
Low quality: Further research is very likely to have an important impact on our confidence in the estimate of effect and is likely to change the estimate.
Very low quality: We are very uncertain about the estimate.

1Lack of blinding (although unfeasible) is likely to bias women's responses.
2Significant heterogeneity.

3Result suggests incomplete operation—rare.
4Wide confidence interval.

Figuras y tablas -
Summary of findings for the main comparison. Endometrial resection/ablation for heavy menstrual bleeding
Comparison 1. Endometrial resection/ablation versus hysterectomy

Outcome or subgroup title

No. of studies

No. of participants

Statistical method

Effect size

1 Woman's perception (proportion with improvement in bleeding symptoms) Show forest plot

5

Risk Ratio (M‐H, Fixed, 95% CI)

Subtotals only

1.1 Within one year of follow‐up

4

650

Risk Ratio (M‐H, Fixed, 95% CI)

0.89 [0.85, 0.93]

1.2 At two years of follow‐up

2

292

Risk Ratio (M‐H, Fixed, 95% CI)

0.92 [0.86, 0.99]

1.3 At four years of follow‐up

2

237

Risk Ratio (M‐H, Fixed, 95% CI)

0.93 [0.88, 0.99]

2 PBAC score (continuous data) Show forest plot

1

Mean Difference (IV, Fixed, 95% CI)

Subtotals only

2.1 At one year of follow‐up

1

68

Mean Difference (IV, Fixed, 95% CI)

24.4 [16.01, 32.79]

2.2 At two years of follow‐up

1

68

Mean Difference (IV, Fixed, 95% CI)

44.0 [36.09, 51.91]

3 Proportion requiring further surgery for HMB Show forest plot

8

Risk Ratio (M‐H, Fixed, 95% CI)

Subtotals only

3.1 Within one year after surgery

6

887

Risk Ratio (M‐H, Fixed, 95% CI)

14.94 [5.24, 42.57]

3.2 At two years after surgery

6

930

Risk Ratio (M‐H, Fixed, 95% CI)

23.36 [8.30, 65.75]

3.3 At three years after surgery

1

172

Risk Ratio (M‐H, Fixed, 95% CI)

11.10 [1.54, 80.14]

3.4 At four years after surgery

1

197

Risk Ratio (M‐H, Fixed, 95% CI)

36.32 [5.09, 259.21]

4 Proportion satisfied with treatment Show forest plot

5

Risk Ratio (M‐H, Fixed, 95% CI)

Subtotals only

4.1 At one year of follow‐up

4

739

Risk Ratio (M‐H, Fixed, 95% CI)

0.94 [0.88, 1.00]

4.2 At two years of follow‐up

4

567

Risk Ratio (M‐H, Fixed, 95% CI)

0.87 [0.80, 0.95]

4.3 At four years of follow‐up

2

246

Risk Ratio (M‐H, Fixed, 95% CI)

0.89 [0.77, 1.03]

5 Adverse events—short term (intraoperative and immediate postoperative) Show forest plot

6

Risk Ratio (M‐H, Fixed, 95% CI)

Subtotals only

5.1 Sepsis

4

621

Risk Ratio (M‐H, Fixed, 95% CI)

0.19 [0.12, 0.31]

5.2 Haemorrhage

3

555

Risk Ratio (M‐H, Fixed, 95% CI)

0.69 [0.32, 1.46]

5.3 Blood transfusion

4

751

Risk Ratio (M‐H, Fixed, 95% CI)

0.20 [0.07, 0.59]

5.4 Pyrexia

3

605

Risk Ratio (M‐H, Fixed, 95% CI)

0.17 [0.09, 0.35]

5.5 Vault haematoma

5

858

Risk Ratio (M‐H, Fixed, 95% CI)

0.11 [0.04, 0.34]

5.6 Wound haematoma

1

202

Risk Ratio (M‐H, Fixed, 95% CI)

0.03 [0.00, 0.53]

5.7 Anaesthetic

1

202

Risk Ratio (M‐H, Fixed, 95% CI)

0.18 [0.01, 3.80]

5.8 Fluid overload

3

611

Risk Ratio (M‐H, Fixed, 95% CI)

9.27 [2.17, 39.64]

5.9 Perforation

2

430

Risk Ratio (M‐H, Fixed, 95% CI)

5.05 [0.61, 42.16]

5.10 Gastrointestinal obstruction/ileus

1

202

Risk Ratio (M‐H, Fixed, 95% CI)

0.46 [0.04, 5.01]

5.11 Laparotomy

2

383

Risk Ratio (M‐H, Fixed, 95% CI)

0.39 [0.08, 1.97]

5.12 Cystotomy

1

228

Risk Ratio (M‐H, Fixed, 95% CI)

0.21 [0.01, 4.42]

5.13 Cervical laceration

2

409

Risk Ratio (M‐H, Fixed, 95% CI)

3.16 [0.33, 30.10]

5.14 Cardiorespiratory event

1

228

Risk Ratio (M‐H, Fixed, 95% CI)

0.15 [0.01, 2.93]

5.15 Thromboembolic event

1

228

Risk Ratio (M‐H, Fixed, 95% CI)

0.21 [0.01, 4.42]

5.16 Readmission/return to surgery

1

228

Risk Ratio (M‐H, Fixed, 95% CI)

0.15 [0.01, 2.93]

6 Adverse events—long term (after hospital discharge) Show forest plot

2

Risk Ratio (M‐H, Fixed, 95% CI)

Subtotals only

6.1 Sepsis

1

172

Risk Ratio (M‐H, Fixed, 95% CI)

0.27 [0.13, 0.58]

6.2 Haematoma

2

368

Risk Ratio (M‐H, Fixed, 95% CI)

0.59 [0.15, 2.37]

6.3 Haemorrhage

1

196

Risk Ratio (M‐H, Fixed, 95% CI)

2.94 [0.12, 71.30]

7 Quality of life scores (continuous data) Show forest plot

6

Mean Difference (IV, Fixed, 95% CI)

Subtotals only

7.1 SF‐36 at one year—Role Limitation (physical)

1

181

Mean Difference (IV, Fixed, 95% CI)

‐0.80 [‐4.99, 3.39]

7.2 SF‐36 at one year—Role Limitation (emotional)

1

181

Mean Difference (IV, Fixed, 95% CI)

‐3.90 [‐8.21, 0.41]

7.3 SF‐36 at one year—Social Functioning

1

181

Mean Difference (IV, Fixed, 95% CI)

‐21.20 [‐24.73, ‐17.67]

7.4 SF‐36 at one year—Mental Health

2

385

Mean Difference (IV, Fixed, 95% CI)

‐1.53 [‐5.06, 2.01]

7.5 SF‐36 at one year—Energy

2

211

Mean Difference (IV, Fixed, 95% CI)

‐10.99 [‐14.45, ‐7.53]

7.6 SF‐36 at one year—Pain

2

391

Mean Difference (IV, Fixed, 95% CI)

‐1.91 [‐5.67, 1.86]

7.7 SF‐36 at one year—General Health Perception

2

385

Mean Difference (IV, Fixed, 95% CI)

‐7.27 [‐10.72, ‐3.81]

7.8 SF‐36 at one year—Physical Functioning

1

181

Mean Difference (IV, Fixed, 95% CI)

‐1.20 [‐5.34, 2.94]

7.9 SF‐36 at two years—Role Limitation (physical)

3

300

Mean Difference (IV, Fixed, 95% CI)

‐3.09 [‐7.94, 1.76]

7.10 SF‐36 at two years—Role Limitation (emotional)

3

300

Mean Difference (IV, Fixed, 95% CI)

10.22 [5.48, 14.96]

7.11 SF‐36 at two years—Social Functioning

3

300

Mean Difference (IV, Fixed, 95% CI)

‐10.06 [‐13.55, ‐6.58]

7.12 SF‐36 at two years—Mental Health

4

509

Mean Difference (IV, Fixed, 95% CI)

2.39 [‐0.61, 5.40]

7.13 SF‐36 at two years—Energy

4

513

Mean Difference (IV, Fixed, 95% CI)

‐2.01 [‐5.41, 1.40]

7.14 SF‐36 at two years—Pain

4

513

Mean Difference (IV, Fixed, 95% CI)

‐9.50 [‐12.80, ‐6.21]

7.15 SF‐36 at two years—General Health Perception

4

509

Mean Difference (IV, Fixed, 95% CI)

‐7.42 [‐10.64, ‐4.20]

7.16 SF‐36 at two years—Physical Functioning

3

300

Mean Difference (IV, Fixed, 95% CI)

‐9.29 [‐12.80, ‐5.78]

7.17 GR inventory scores at one year after surgery

1

182

Mean Difference (IV, Fixed, 95% CI)

0.0 [‐1.75, 1.75]

7.18 Euroqol score within one year after surgery

2

347

Mean Difference (IV, Fixed, 95% CI)

‐3.24 [‐8.35, 1.88]

7.19 Euroqol scores at two years after surgery

2

368

Mean Difference (IV, Fixed, 95% CI)

‐1.96 [‐5.60, 1.67]

7.20 SSR score at two years after surgery

1

77

Mean Difference (IV, Fixed, 95% CI)

‐3.70 [‐11.17, 3.77]

7.21 Total HAD scores at two years after surgery

1

77

Mean Difference (IV, Fixed, 95% CI)

‐1.5 [‐4.32, 1.32]

7.22 Anxiety HAD scores at two and four years after surgery

2

259

Mean Difference (IV, Fixed, 95% CI)

‐0.67 [‐1.64, 0.30]

7.23 Depression HAD scores at two and four years after surgery

2

259

Mean Difference (IV, Fixed, 95% CI)

‐0.00 [‐0.10, 0.09]

8 Quality of life (proportion with improvement) Show forest plot

2

Risk Ratio (M‐H, Fixed, 95% CI)

Subtotals only

8.1 Proportion with improvement in pain two years after surgery

1

59

Risk Ratio (M‐H, Fixed, 95% CI)

1.60 [0.55, 4.63]

8.2 Proportion with improvement in general health one year after surgery

1

185

Risk Ratio (M‐H, Fixed, 95% CI)

4.17 [1.47, 11.85]

8.3 Proportion with improvement in general health four years after surgery

1

146

Risk Ratio (M‐H, Fixed, 95% CI)

2.76 [0.93, 8.17]

9 Duration of surgery (minutes) Show forest plot

7

Mean Difference (IV, Random, 95% CI)

Totals not selected

10 Time to return to work (weeks) Show forest plot

5

Mean Difference (IV, Random, 95% CI)

Totals not selected

11 Time to return to normal activity (days) Show forest plot

4

Mean Difference (IV, Random, 95% CI)

Totals not selected

12 Duration of hospital stay (days) Show forest plot

7

Mean Difference (IV, Random, 95% CI)

Totals not selected

13 Total health service cost per woman Show forest plot

Other data

No numeric data

14 Total individual cost per woman Show forest plot

Other data

No numeric data

Figuras y tablas -
Comparison 1. Endometrial resection/ablation versus hysterectomy