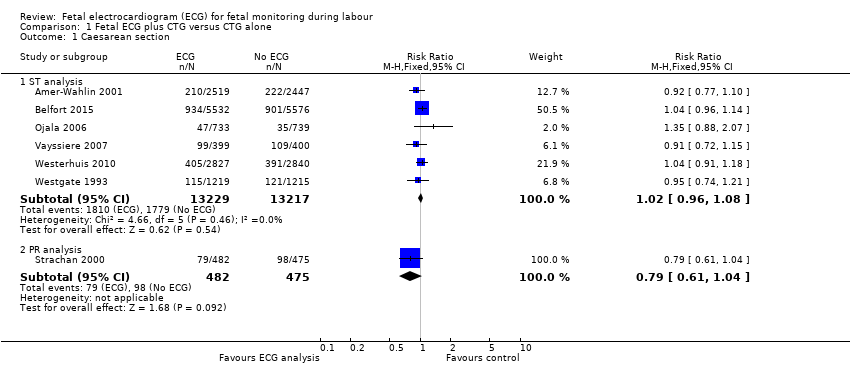
| 1 Caesarean section Show forest plot | 7 | | Risk Ratio (M‐H, Fixed, 95% CI) | Subtotals only |
|
| 1.1 ST analysis | 6 | 26446 | Risk Ratio (M‐H, Fixed, 95% CI) | 1.02 [0.96, 1.08] |
| 1.2 PR analysis | 1 | 957 | Risk Ratio (M‐H, Fixed, 95% CI) | 0.79 [0.61, 1.04] |
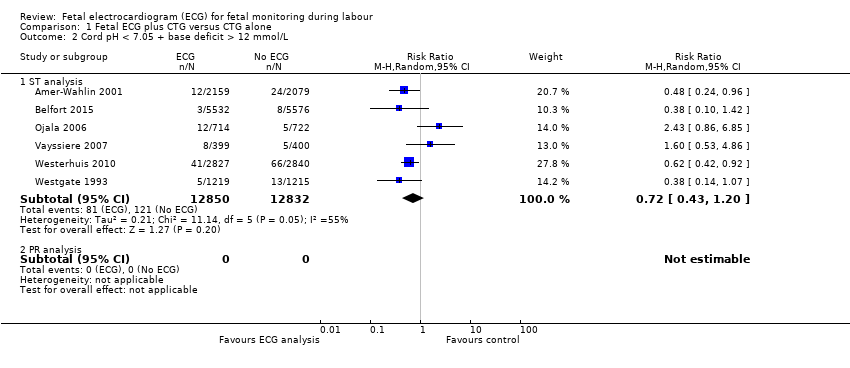
| 2 Cord pH < 7.05 + base deficit > 12 mmol/L Show forest plot | 6 | | Risk Ratio (M‐H, Random, 95% CI) | Subtotals only |
|
| 2.1 ST analysis | 6 | 25682 | Risk Ratio (M‐H, Random, 95% CI) | 0.72 [0.43, 1.20] |
| 2.2 PR analysis | 0 | 0 | Risk Ratio (M‐H, Random, 95% CI) | 0.0 [0.0, 0.0] |
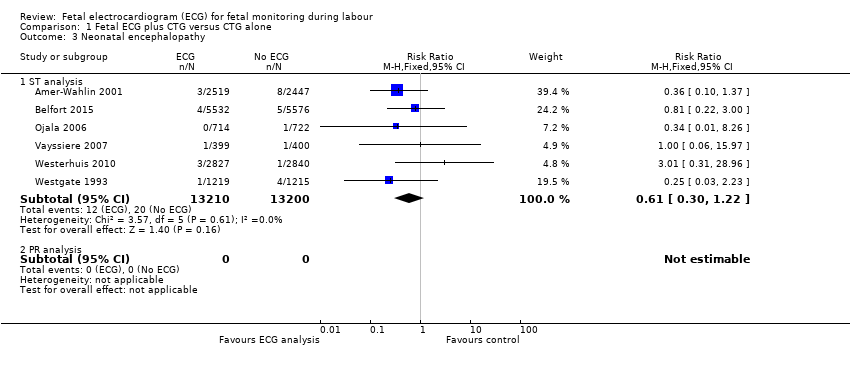
| 3 Neonatal encephalopathy Show forest plot | 6 | | Risk Ratio (M‐H, Fixed, 95% CI) | Subtotals only |
|
| 3.1 ST analysis | 6 | 26410 | Risk Ratio (M‐H, Fixed, 95% CI) | 0.61 [0.30, 1.22] |
| 3.2 PR analysis | 0 | 0 | Risk Ratio (M‐H, Fixed, 95% CI) | 0.0 [0.0, 0.0] |
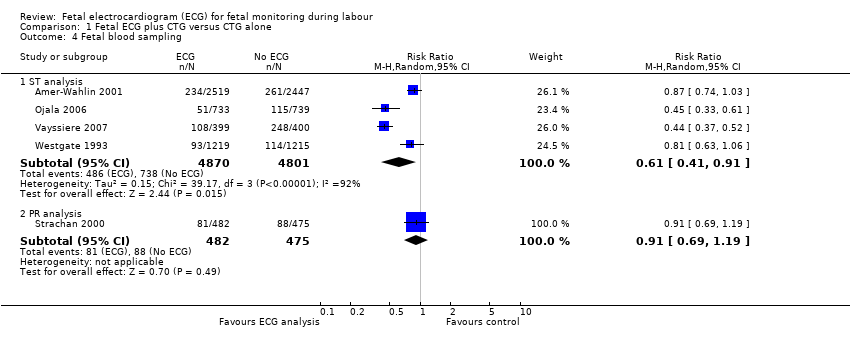
| 4 Fetal blood sampling Show forest plot | 5 | | Risk Ratio (M‐H, Random, 95% CI) | Subtotals only |
|
| 4.1 ST analysis | 4 | 9671 | Risk Ratio (M‐H, Random, 95% CI) | 0.61 [0.41, 0.91] |
| 4.2 PR analysis | 1 | 957 | Risk Ratio (M‐H, Random, 95% CI) | 0.91 [0.69, 1.19] |
| 5 Operative vaginal delivery Show forest plot | 7 | | Risk Ratio (M‐H, Fixed, 95% CI) | Subtotals only |
|
| 5.1 ST analysis | 6 | 26446 | Risk Ratio (M‐H, Fixed, 95% CI) | 0.92 [0.86, 0.99] |
| 5.2 PR analysis | 1 | 957 | Risk Ratio (M‐H, Fixed, 95% CI) | 0.94 [0.75, 1.17] |
| 6 Apgar score < 7 at 5 minutes Show forest plot | 6 | | Risk Ratio (M‐H, Fixed, 95% CI) | Subtotals only |
|
| 6.1 ST analysis | 5 | 15302 | Risk Ratio (M‐H, Fixed, 95% CI) | 0.95 [0.73, 1.24] |
| 6.2 PR analysis | 1 | 957 | Risk Ratio (M‐H, Fixed, 95% CI) | 0.42 [0.11, 1.62] |
| 7 Neonatal intubation Show forest plot | 3 | | Risk Ratio (M‐H, Fixed, 95% CI) | Subtotals only |
|
| 7.1 ST analysis | 2 | 12544 | Risk Ratio (M‐H, Fixed, 95% CI) | 1.37 [0.89, 2.11] |
| 7.2 PR analysis | 1 | 957 | Risk Ratio (M‐H, Fixed, 95% CI) | 0.74 [0.26, 2.11] |
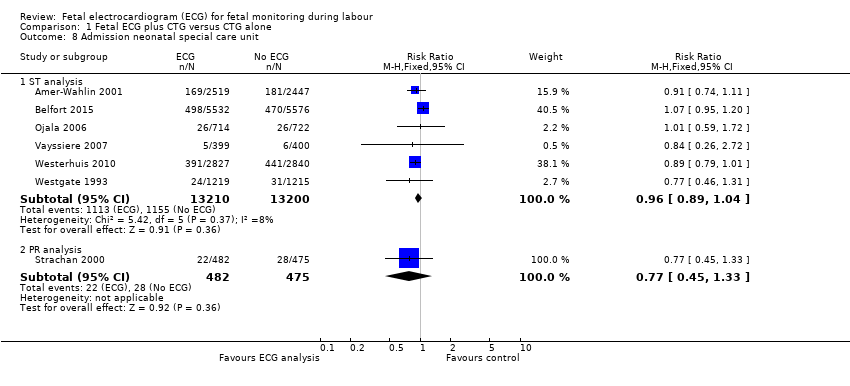
| 8 Admission neonatal special care unit Show forest plot | 7 | | Risk Ratio (M‐H, Fixed, 95% CI) | Subtotals only |
|
| 8.1 ST analysis | 6 | 26410 | Risk Ratio (M‐H, Fixed, 95% CI) | 0.96 [0.89, 1.04] |
| 8.2 PR analysis | 1 | 957 | Risk Ratio (M‐H, Fixed, 95% CI) | 0.77 [0.45, 1.33] |
| 9 Perinatal death Show forest plot | 7 | | Risk Ratio (M‐H, Fixed, 95% CI) | Subtotals only |
|
| 9.1 ST analysis | 6 | 26446 | Risk Ratio (M‐H, Fixed, 95% CI) | 1.71 [0.67, 4.33] |
| 9.2 PR analysis | 1 | 957 | Risk Ratio (M‐H, Fixed, 95% CI) | 2.96 [0.12, 72.39] |