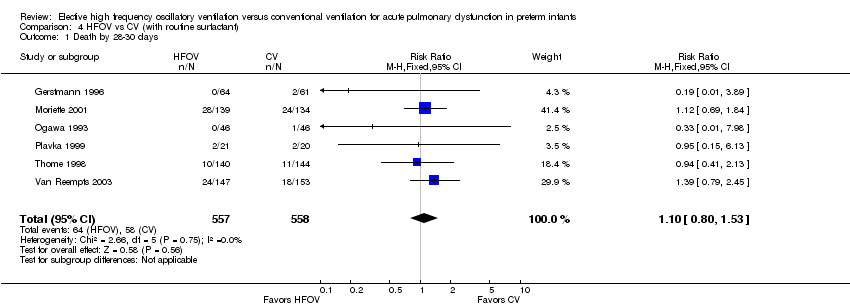
| 1 Death by 28‐30 days Show forest plot | 8 | 1853 | Risk Ratio (M‐H, Fixed, 95% CI) | 1.08 [0.86, 1.35] |
|
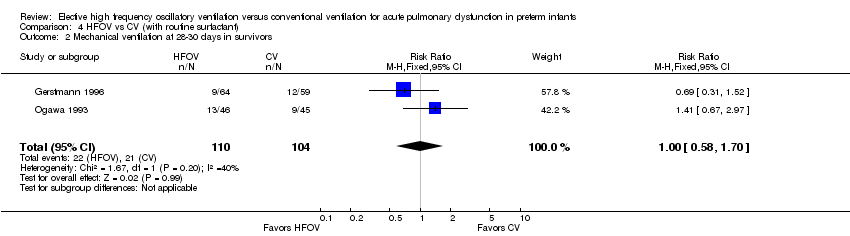
| 2 Mechanical ventilation at 28 ‐ 30 days in survivors Show forest plot | 3 | 767 | Risk Ratio (M‐H, Fixed, 95% CI) | 1.08 [0.86, 1.35] |
|
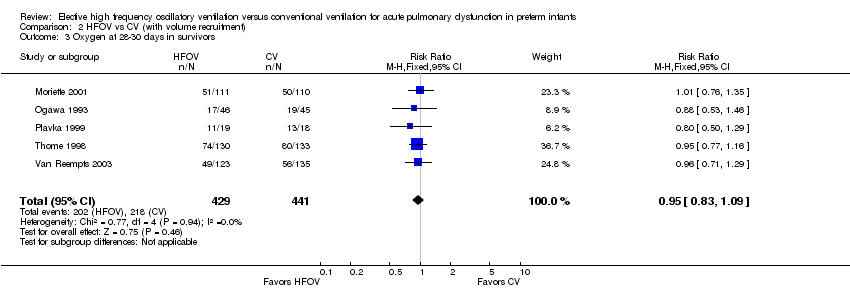
| 3 Oxygen at 28‐30 days in survivors Show forest plot | 5 | 870 | Risk Ratio (M‐H, Fixed, 95% CI) | 0.95 [0.83, 1.09] |
|
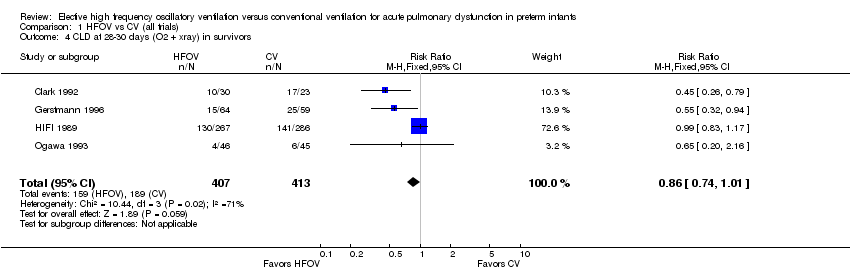
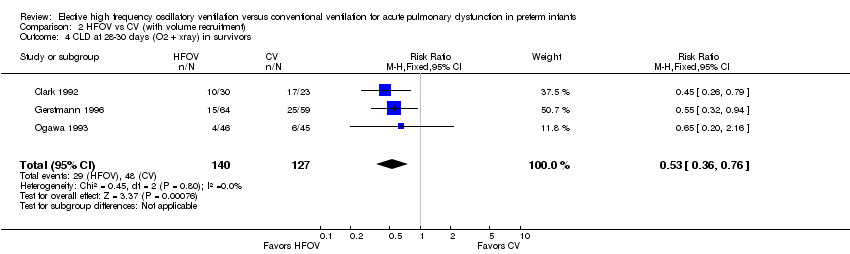
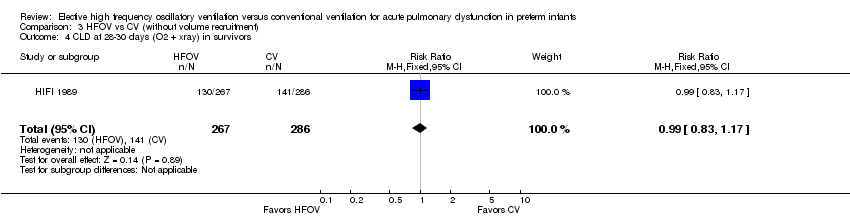
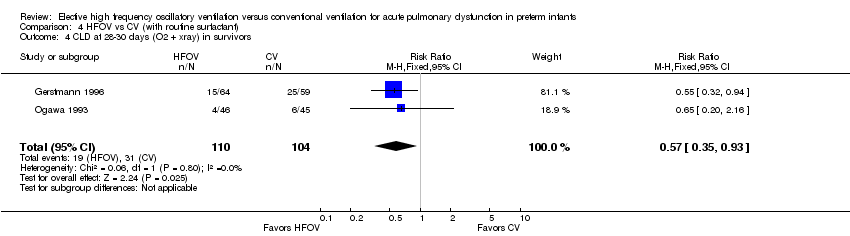
| 4 CLD at 28‐30 days (O2 + xray) in survivors Show forest plot | 4 | 820 | Risk Ratio (M‐H, Fixed, 95% CI) | 0.86 [0.74, 1.01] |
|
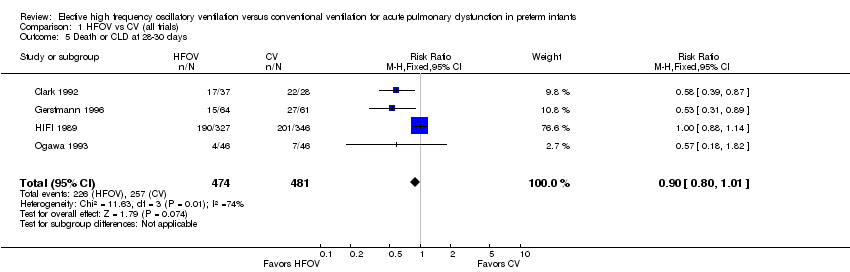
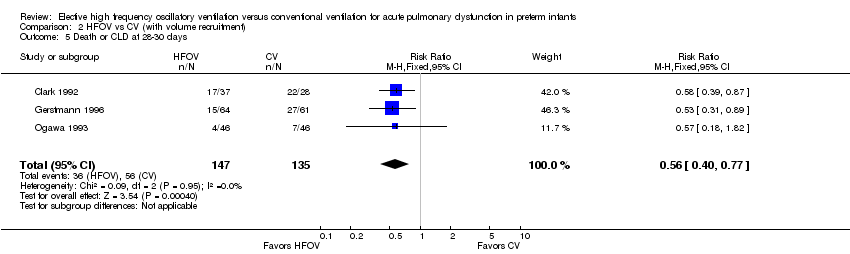
| 5 Death or CLD at 28‐30 days Show forest plot | 4 | 955 | Risk Ratio (M‐H, Fixed, 95% CI) | 0.90 [0.80, 1.01] |
|
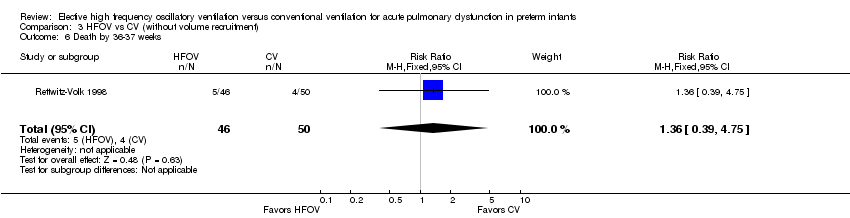
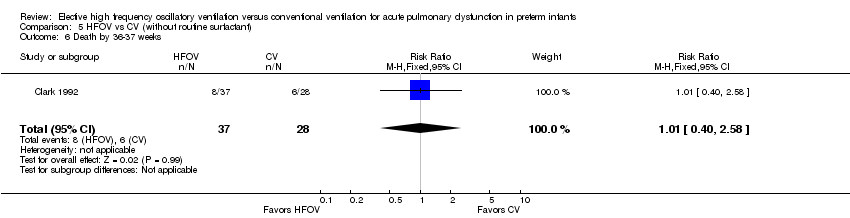
| 6 Death by 36‐37 weeks or discharge Show forest plot | 9 | 2479 | Risk Ratio (M‐H, Fixed, 95% CI) | 0.98 [0.83, 1.16] |
|
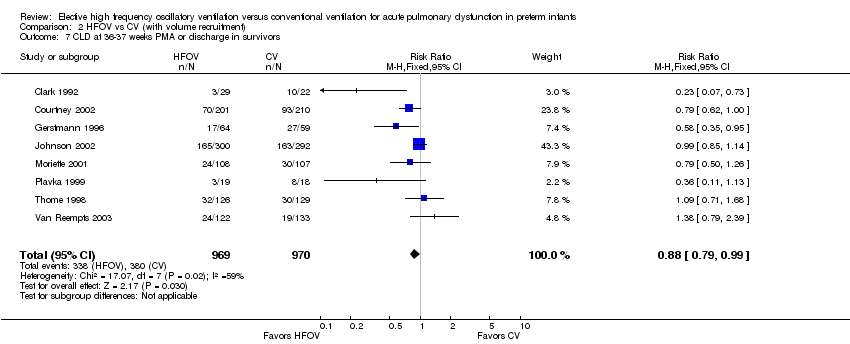
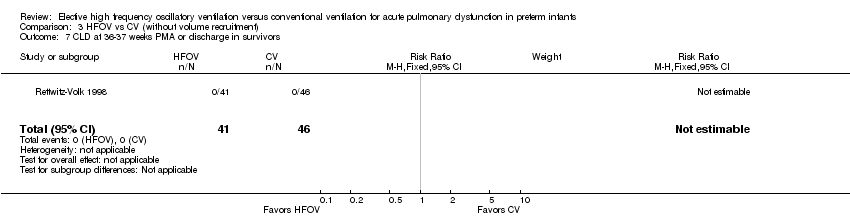
| 7 CLD at 36‐37 weeks PMA or discharge in survivors Show forest plot | 9 | 2026 | Risk Ratio (M‐H, Fixed, 95% CI) | 0.88 [0.79, 0.99] |
|
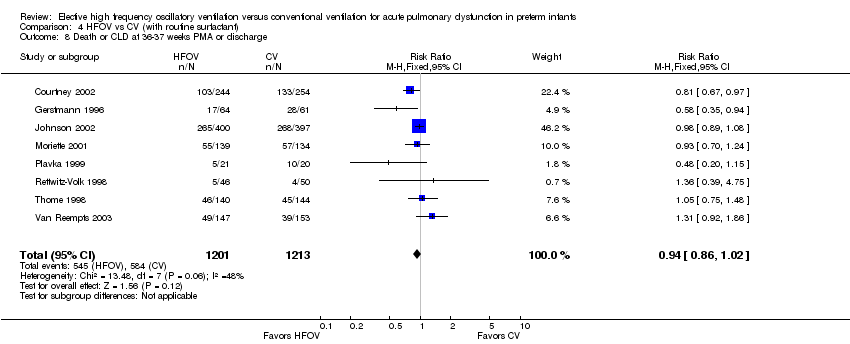
| 8 Death or CLD at 36‐37 weeks PMA or discharge Show forest plot | 9 | 2479 | Risk Ratio (M‐H, Fixed, 95% CI) | 0.92 [0.85, 1.00] |
|
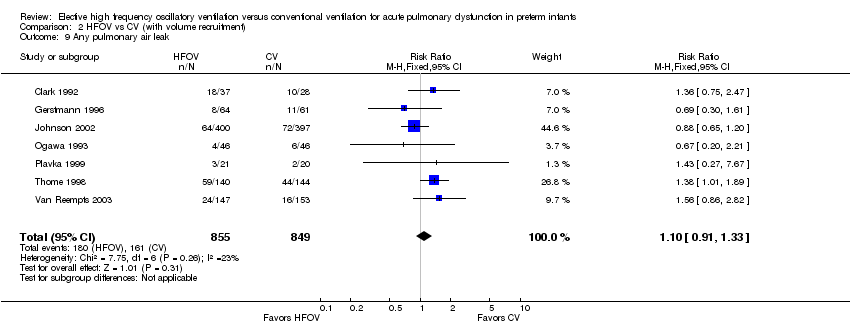
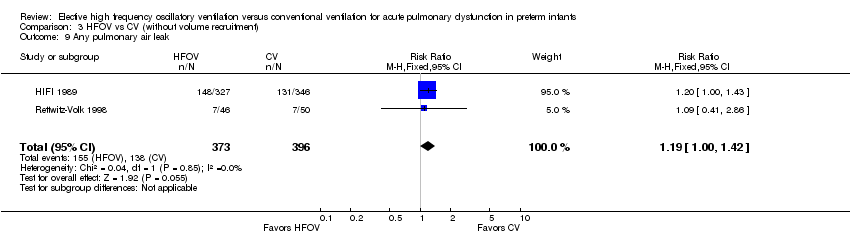
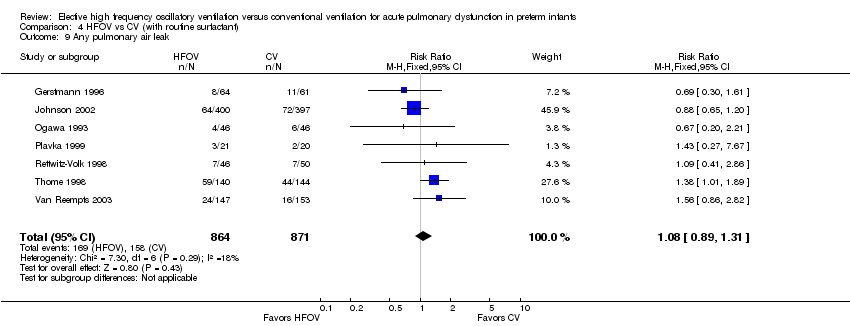
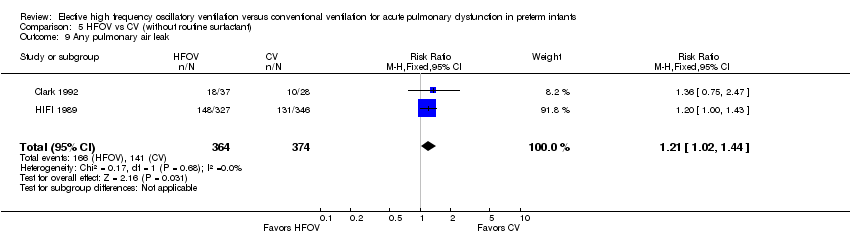
| 9 Any pulmonary air leak Show forest plot | 9 | 2473 | Risk Ratio (M‐H, Fixed, 95% CI) | 1.14 [1.00, 1.29] |
|
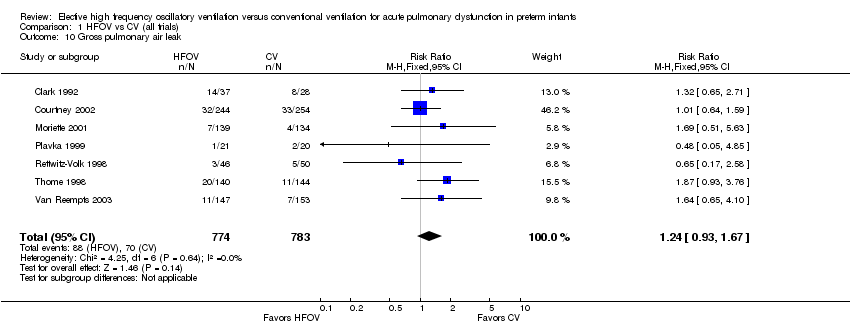
| 10 Gross pulmonary air leak Show forest plot | 7 | 1557 | Risk Ratio (M‐H, Fixed, 95% CI) | 1.24 [0.93, 1.67] |
|
| 11 Intraventricular hemorrhage ‐ all grades Show forest plot | 10 | 2971 | Risk Ratio (M‐H, Fixed, 95% CI) | 1.05 [0.96, 1.15] |
|
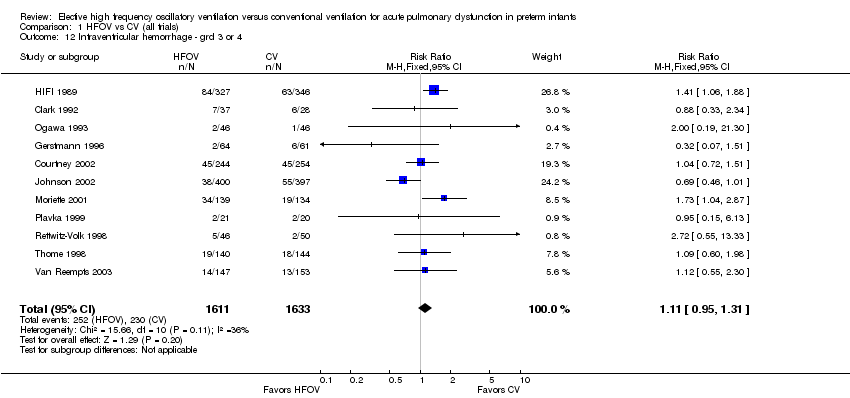
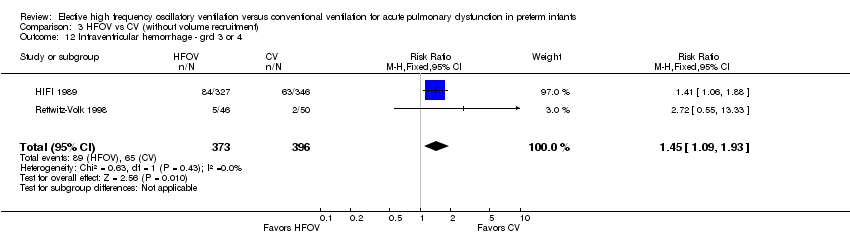
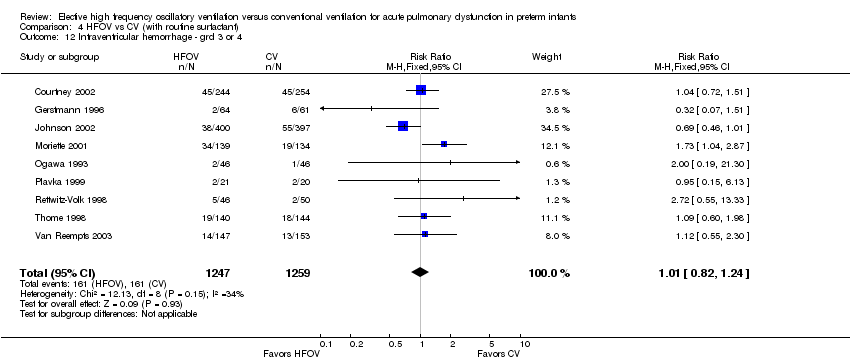
| 12 Intraventricular hemorrhage ‐ grd 3 or 4 Show forest plot | 11 | 3244 | Risk Ratio (M‐H, Fixed, 95% CI) | 1.11 [0.95, 1.31] |
|
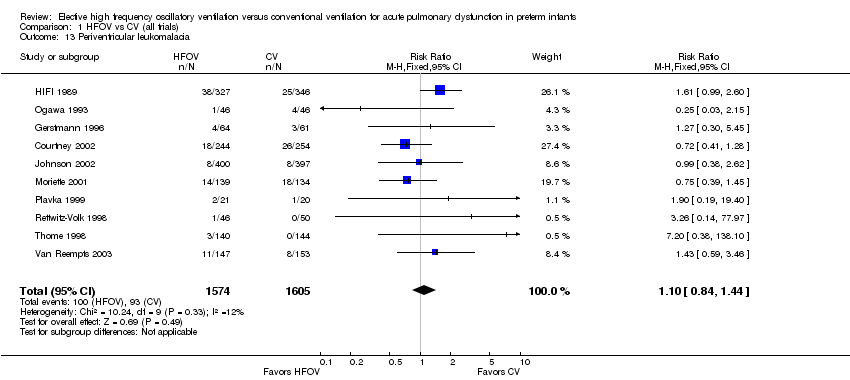
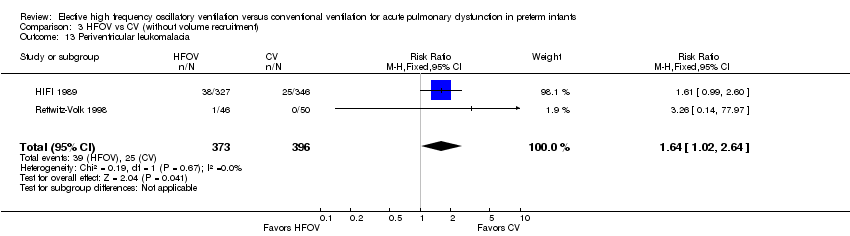
| 13 Periventricular leukomalacia Show forest plot | 10 | 3179 | Risk Ratio (M‐H, Fixed, 95% CI) | 1.10 [0.84, 1.44] |
|
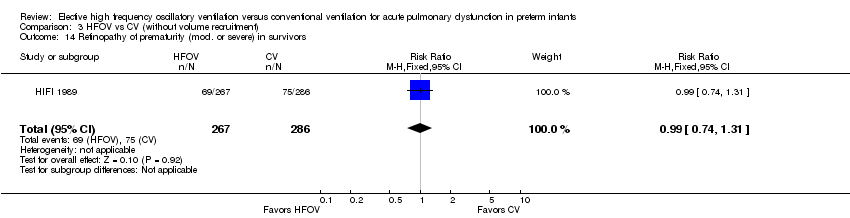
| 14 Retinopathy of prematurity (grd 2 or more) in survivors Show forest plot | 7 | 2240 | Risk Ratio (M‐H, Fixed, 95% CI) | 0.86 [0.74, 1.01] |
|
| 15 Neurodevelopmental abnormality at 1‐3 yrs in those examined Show forest plot | 2 | 477 | Risk Ratio (M‐H, Fixed, 95% CI) | 1.26 [1.01, 1.58] |
|