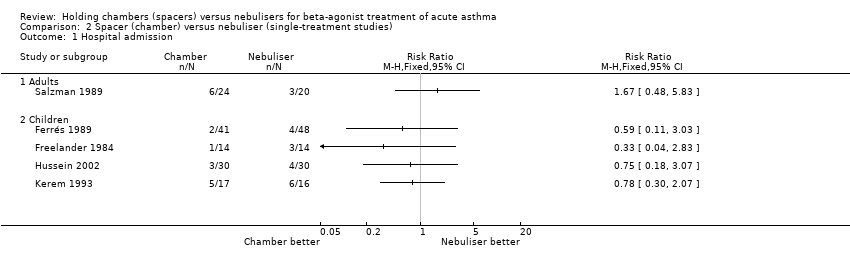
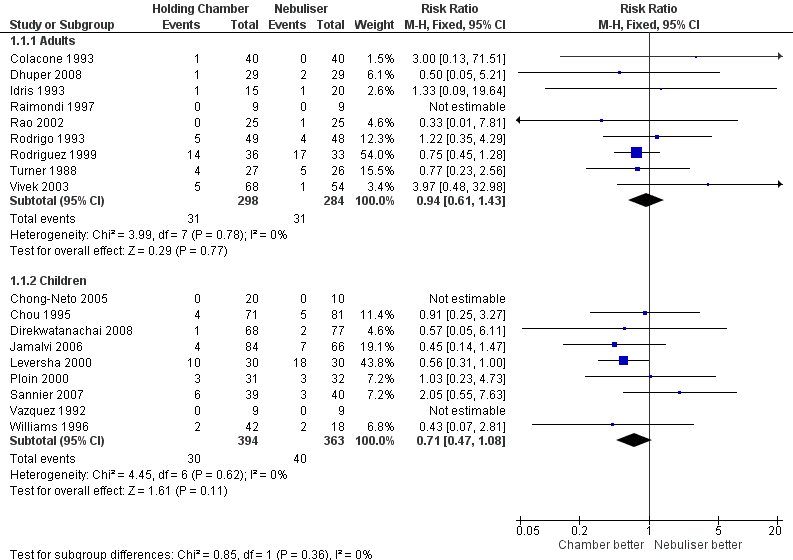
| 1 Hospital admission Show forest plot | 16 | | Risk Ratio (M‐H, Fixed, 95% CI) | Subtotals only |
|
| 1.1 Adults with other spacers | 6 | 366 | Risk Ratio (M‐H, Fixed, 95% CI) | 1.25 [0.55, 2.84] |
| 1.2 Adults with Volumatic | 2 | 166 | Risk Ratio (M‐H, Fixed, 95% CI) | 0.84 [0.51, 1.38] |
| 1.3 Children with other spacers | 6 | 515 | Risk Ratio (M‐H, Fixed, 95% CI) | 0.61 [0.39, 0.96] |
| 1.4 Children with Volumatic | 2 | 163 | Risk Ratio (M‐H, Fixed, 95% CI) | 0.57 [0.05, 6.11] |
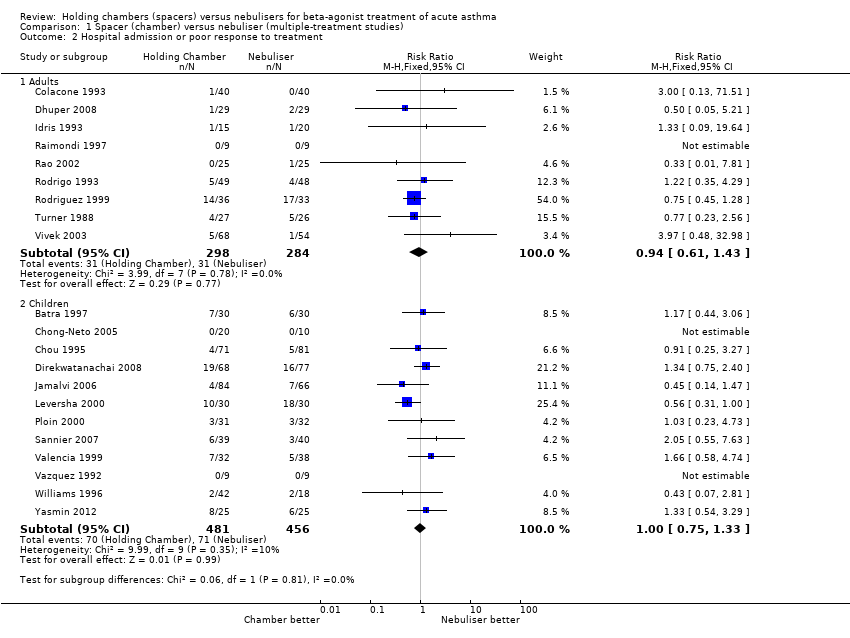
| 2 Hospital admission or poor response to treatment Show forest plot | 19 | | Risk Ratio (M‐H, Fixed, 95% CI) | Subtotals only |
|
| 2.1 Adults with other spacers | 6 | 366 | Risk Ratio (M‐H, Fixed, 95% CI) | 1.25 [0.55, 2.84] |
| 2.2 Adults with Volumatic | 2 | 166 | Risk Ratio (M‐H, Fixed, 95% CI) | 0.84 [0.51, 1.38] |
| 2.3 Children with other spacers | 8 | 635 | Risk Ratio (M‐H, Fixed, 95% CI) | 0.80 [0.55, 1.16] |
| 2.4 Children with Volumatic | 3 | 223 | Risk Ratio (M‐H, Fixed, 95% CI) | 1.29 [0.79, 2.13] |
| 3 Duration in emergency department (minutes). Show forest plot | 4 | | Mean Difference (IV, Random, 95% CI) | Subtotals only |
|
| 3.1 Adults with other spacers | 1 | 35 | Mean Difference (IV, Random, 95% CI) | ‐9.0 [‐42.91, 24.91] |
| 3.2 Adults with Volumatic | 1 | 97 | Mean Difference (IV, Random, 95% CI) | 15.00 [‐22.65, 52.65] |
| 3.3 Children with other spacers | 2 | 348 | Mean Difference (IV, Random, 95% CI) | ‐29.89 [‐40.47, ‐19.32] |
| 4 Final rise in FEV₁ (% predicted) Show forest plot | 7 | | Mean Difference (IV, Fixed, 95% CI) | Subtotals only |
|
| 4.1 Adults with other spacers | 3 | 168 | Mean Difference (IV, Fixed, 95% CI) | 0.30 [‐4.70, 5.30] |
| 4.2 Adults with Volumatic | 2 | 119 | Mean Difference (IV, Fixed, 95% CI) | 1.20 [‐4.13, 6.53] |
| 4.3 Children with other spacers | 1 | 30 | Mean Difference (IV, Fixed, 95% CI) | 0.0 [‐6.17, 6.17] |
| 4.4 Children with Volumatic | 1 | 18 | Mean Difference (IV, Fixed, 95% CI) | 9.8 [‐9.41, 29.01] |
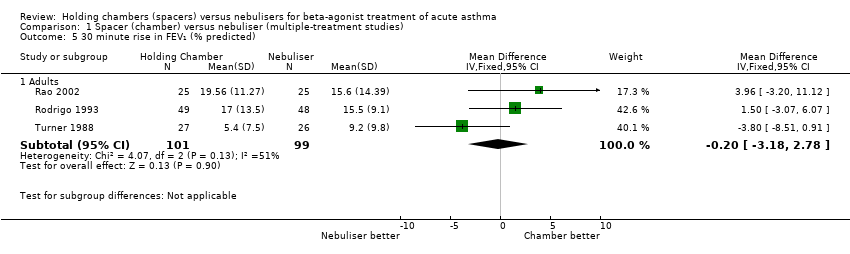
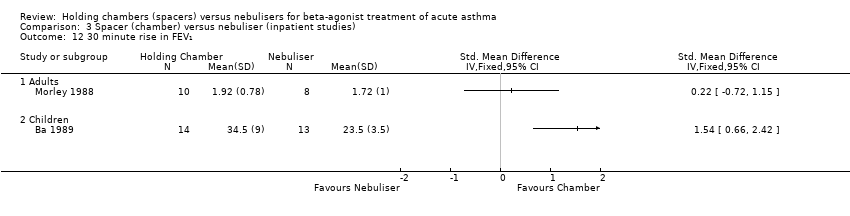
| 5 30 minute rise in FEV₁ (% predicted) Show forest plot | 2 | | Mean Difference (IV, Fixed, 95% CI) | Subtotals only |
|
| 5.1 Adults with other spacers | 1 | 53 | Mean Difference (IV, Fixed, 95% CI) | ‐3.80 [‐8.51, 0.91] |
| 5.2 Adults with Volumatic | 1 | 97 | Mean Difference (IV, Fixed, 95% CI) | 1.5 [‐3.07, 6.07] |
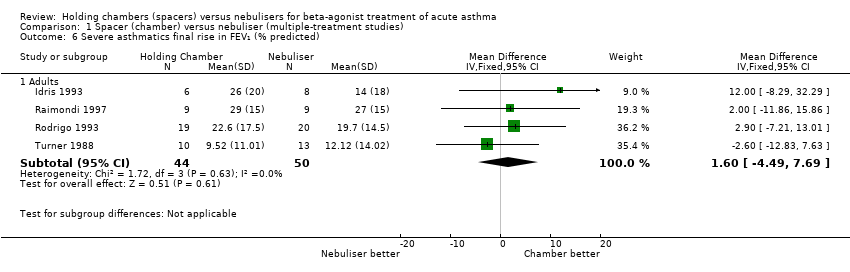
| 6 Severe asthmatics final rise in FEV₁ (% predicted) Show forest plot | 4 | | Mean Difference (IV, Fixed, 95% CI) | Subtotals only |
|
| 6.1 Adults with other spacers | 3 | 55 | Mean Difference (IV, Fixed, 95% CI) | 0.86 [‐6.77, 8.48] |
| 6.2 Adults with Volumatic | 1 | 39 | Mean Difference (IV, Fixed, 95% CI) | 2.90 [‐7.21, 13.01] |
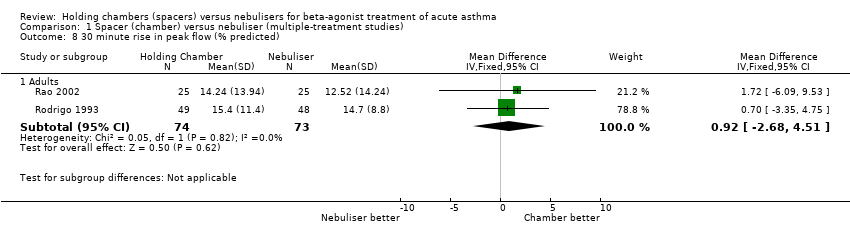
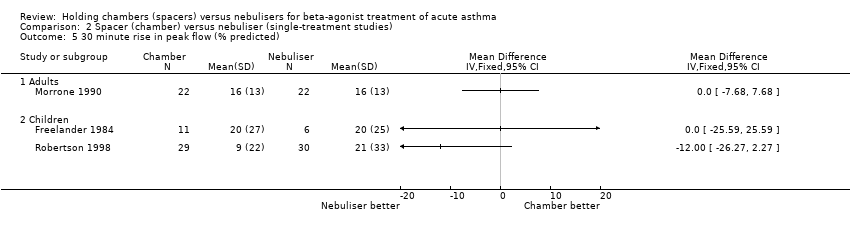
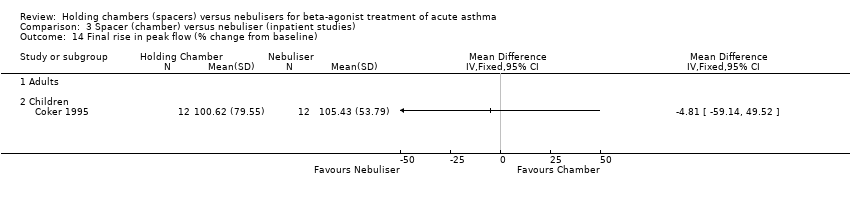
| 7 Final rise in peak flow (% predicted) Show forest plot | 5 | | Mean Difference (IV, Fixed, 95% CI) | Subtotals only |
|
| 7.1 Adults with Volumatic | 2 | 119 | Mean Difference (IV, Fixed, 95% CI) | ‐0.39 [‐4.77, 3.98] |
| 7.2 Children with other spacers | 2 | 148 | Mean Difference (IV, Fixed, 95% CI) | ‐3.75 [‐9.95, 2.45] |
| 7.3 Children with Volumatic | 1 | 18 | Mean Difference (IV, Fixed, 95% CI) | 4.10 [‐14.81, 23.01] |
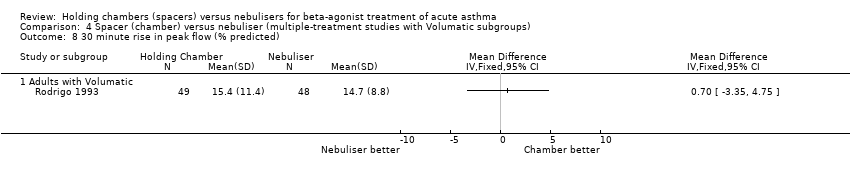
| 8 30 minute rise in peak flow (% predicted) Show forest plot | 1 | | Mean Difference (IV, Fixed, 95% CI) | Totals not selected |
|
| 8.1 Adults with Volumatic | 1 | | Mean Difference (IV, Fixed, 95% CI) | 0.0 [0.0, 0.0] |
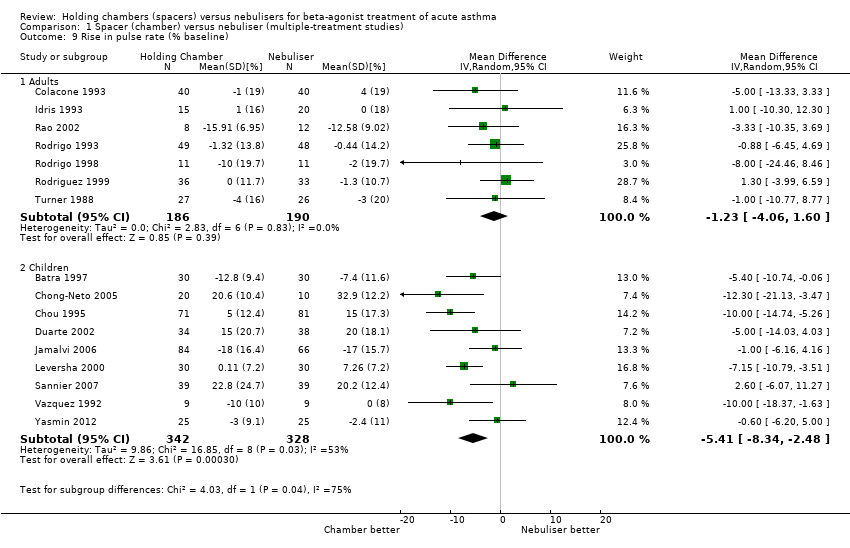
| 9 Rise in pulse rate (% baseline) Show forest plot | 13 | | Mean Difference (IV, Fixed, 95% CI) | Subtotals only |
|
| 9.1 Adults with other spacers | 3 | 168 | Mean Difference (IV, Fixed, 95% CI) | ‐2.28 [‐7.81, 3.24] |
| 9.2 Adults with Volumatic | 3 | 188 | Mean Difference (IV, Fixed, 95% CI) | ‐0.16 [‐3.89, 3.58] |
| 9.3 Children with other spacers | 5 | 464 | Mean Difference (IV, Fixed, 95% CI) | ‐6.80 [‐9.14, ‐4.45] |
| 9.4 Children with Volumatic | 2 | 78 | Mean Difference (IV, Fixed, 95% CI) | ‐6.73 [‐11.24, ‐2.23] |


![Forest plot of comparison: 1 Spacer (chamber) versus Nebuliser (Multiple treatment studies), outcome: 1.3 Duration in emergency department (minutes). [mins].](/es/cdsr/doi/10.1002/14651858.CD000052.pub3/media/CDSR/CD000052/image_n/nCD000052-AFig-FIG05.png)
![Forest plot of comparison: 1 Spacer (chamber) versus Nebuliser (Multiple treatment studies), outcome: 1.9 Rise in pulse rate (% baseline) [%].](/es/cdsr/doi/10.1002/14651858.CD000052.pub3/media/CDSR/CD000052/image_n/nCD000052-AFig-FIG06.png)