Interventions for preventing high altitude illness: Part 1. Commonly‐used classes of drugs
Abstract
Background
High altitude illness (HAI) is a term used to describe a group of cerebral and pulmonary syndromes that can occur during travel to elevations above 2500 metres ( ˜ 8200 feet ). Acute hypoxia, acute mountain sickness (AMS), high altitude cerebral oedema (HACE) and high altitude pulmonary oedema (HAPE) are reported as potential medical problems associated with high altitude. In this review, the first in a series of three about preventive strategies for HAI, we assess the effectiveness of six of the most recommended classes of pharmacological interventions.
Objectives
To assess the clinical effectiveness and adverse events of commonly‐used pharmacological interventions for preventing acute HAI.
Search methods
We searched the Cochrane Central Register of Controlled Trials (CENTRAL), MEDLINE (OVID), Embase (OVID), LILACS and trial registries in January 2017. We adapted the MEDLINE strategy for searching the other databases. We used a combination of thesaurus‐based and free‐text terms to search.
Selection criteria
We included randomized‐controlled and cross‐over trials conducted in any setting where commonly‐used classes of drugs were used to prevent acute HAI.
Data collection and analysis
We used standard methodological procedures as expected by Cochrane.
Main results
We included 64 studies (78 references) and 4547 participants in this review, and classified 12 additional studies as ongoing. A further 12 studies await classification, as we were unable to obtain the full texts. Most of the studies were conducted in high altitude mountain areas, while the rest used low pressure (hypobaric) chambers to simulate altitude exposure. Twenty‐four trials provided the intervention between three and five days prior to the ascent, and 23 trials, between one and two days beforehand. Most of the included studies reached a final altitude of between 4001 and 5000 metres above sea level. Risks of bias were unclear for several domains, and a considerable number of studies did not report adverse events of the evaluated interventions. We found 26 comparisons, 15 of them comparing commonly‐used drugs versus placebo. We report results for the three most important comparisons:
Acetazolamide versus placebo (28 parallel studies; 2345 participants)
The risk of AMS was reduced with acetazolamide (risk ratio (RR) 0.47, 95% confidence interval (CI) 0.39 to 0.56; I2 = 0%; 16 studies; 2301 participants; moderate quality of evidence). No events of HAPE were reported and only one event of HACE (RR 0.32, 95% CI 0.01 to 7.48; 6 parallel studies; 1126 participants; moderate quality of evidence). Few studies reported side effects for this comparison, and they showed an increase in the risk of paraesthesia with the intake of acetazolamide (RR 5.53, 95% CI 2.81 to 10.88, I2 = 60%; 5 studies, 789 participants; low quality of evidence).
Budenoside versus placebo (2 parallel studies; 132 participants)
Data on budenoside showed a reduction in the incidence of AMS compared with placebo (RR 0.37, 95% CI 0.23 to 0.61; I2 = 0%; 2 studies, 132 participants; low quality of evidence). Studies included did not report events of HAPE or HACE, and they did not find side effects (low quality of evidence).
Dexamethasone versus placebo (7 parallel studies; 205 participants)
For dexamethasone, the data did not show benefits at any dosage (RR 0.60, 95% CI 0.36 to 1.00; I2 = 39%; 4 trials, 176 participants; low quality of evidence). Included studies did not report events of HAPE or HACE, and we rated the evidence about adverse events as of very low quality.
Authors' conclusions
Our assessment of the most commonly‐used pharmacological interventions suggests that acetazolamide is an effective pharmacological agent to prevent acute HAI in dosages of 250 to 750 mg/day. This information is based on evidence of moderate quality. Acetazolamide is associated with an increased risk of paraesthesia, although there are few reports about other adverse events from the available evidence. The clinical benefits and harms of other pharmacological interventions such as ibuprofen, budenoside and dexamethasone are unclear. Large multicentre studies are needed for most of the pharmacological agents evaluated in this review, to evaluate their effectiveness and safety.
PICOs
Plain language summary
Drugs commonly‐used for preventing high altitude illness
Background
High altitude illness (HAI) is a term used to describe a group of brain and breathing conditions that can occur while travelling to altitudes above 2500 metres ( ˜ 8200 feet ). HAI is generally characterized by headache, nausea, vomiting and tiredness (often called acute mountain sickness), but may affect the brain or the lungs in different individuals. In this review, we assessed the most commonly‐used drugs to prevent the onset of this illness.
Study characteristics
The evidence is current to January 2017. We included 64 studies related to six different types of drugs recommended for HAI prevention. Most of the studies were conducted in high altitude mountain areas, while the rest used low pressure (hypobaric) chambers to simulate altitude exposure. The participants' ages ranged between 16 and 65 years. Eleven studies included people at a high risk of this condition due to their history of HAI or other illnesses such as asthma. Twenty‐four trials provided the intervention between three and five days prior to the ascent, and 23 trials, between one and two days beforehand. Most of the included studies reached a final altitude of between 4001 and 5000 metres above sea level. In 23 of the included studies, the source of funding was unclear. Only 18 studies declared their possible conflicts of interests. We classed 24 more studies as still ongoing or waiting for assessment.
Key results
Our findings suggest that acetazolamide is an effective treatment for the prevention of acute HAI in dosages of 250 to 750 mg/day, when this drug is compared to a placebo (i.e. a pill with no active agent). Most of the available information relates to the prevention of uncomplicated HAI (headache, nausea, vomiting and tiredness) rather than to more serious brain or lung problems. We also found that acetazolamide is associated with an increased risk of paraesthesia in the fingers (i.e. a sensation of tingling, tickling, pricking, or burning of the skin), although this outcome is not well reported in the available evidence. The benefits and harms of other drugs such as ibuprofen, budenoside and dexamethasone are unclear, due to the small number of studies.
Quality of the evidence
We rated the quality of the evidence as moderate to very low. Several studies had quality shortcomings, including their use of small numbers of participants and a lack of reporting of important outcomes such as side effects. For most of the drugs covered by the studies, additional research is required to clarify their effectiveness and safety.
Authors' conclusions
Summary of findings
| Acetazolamide compared with placebo for preventing high altitude illness | ||||||
| Patient or population: people at risk of high altitude illness Setting: High altitude; studies undertaken in India, South America and USA. | ||||||
| Outcomes | Illustrative comparative risks* (95% CI) | Relative effect | No of Participants | Quality of the evidence | Comments | |
| Assumed risk | Corresponding risk | |||||
| Placebo | Acetazolamide | |||||
| Incidence of acute mountain sickness (AMS)‐ Follow‐ up: From arrival to 24 hours later | 241 per 1000 | 113 per 1000 | RR 0.47 | 2301 | ⊕⊕⊕⊝ | |
| Incidence of high altitude pulmonary oedema (HAPE)‐ Follow‐ up: From arrival to 24 hours later | See comment | See comment | Not estimable | 1138 | ⊕⊕⊕⊝ | These trials reported no event |
| Incidence of high altitude cerebral oedema (HACE)‐ Follow‐ up: From arrival to 24 hours later | 2 per 1000 | 1 per 1000 | RR 0.32 | 1126 | ⊕⊕⊕⊝ | |
| Adverse events: Paresthesias‐ Follow‐ up: From arrival to 24 hours later | 91 per 1000 | 504 per 1000 | RR 5.53 (2.81 to 10.88) | 789 | ⊕⊕⊝⊝ Low3 | |
| Adverse events: side effects‐ Follow‐ up: From arrival to 24 hours later | 106 per 1000 | 232 per 1000 | RR 2.19 | 400 | ⊕⊕⊝⊝ | |
| The corresponding risk (and its 95% confidence interval) is based on the assumed risk in the comparison group and the relative effect of the intervention (and its 95% CI). | ||||||
| GRADE Working Group grades of evidence | ||||||
| 1Risk of bias downgraded (‐1) due to unclear selection, performance and detection bias in most of included studies. High risk of attrition bias in five studies. 3 Risk of bias downgraded (‐2) due to unclear selection, performance and detection bias, as well as considerable heterogeneity (60%) | ||||||
| Budesonide compared with placebo for preventing high altitude illness | ||||||
| Patient or population: people at risk of high altitude illness Setting: High altitude; studies undertaken in India, South America and USA. | ||||||
| Outcomes | Illustrative comparative risks* (95% CI) | Relative effect | No of Participants | Quality of the evidence | Comments | |
| Assumed risk | Corresponding risk | |||||
| placebo | Budesonide | |||||
| Incidence of acute mountain sickness (AMS)‐ Follow‐ up: From arrival to 24 hours later | 606 per 1000 | 224 per 1000 | RR 0.37 | 132 | ⊕⊕⊝⊝ | |
| Incidence of high altitude pulmonary oedema (HAPE)‐ not reported | See comment | See comment | Not estimable | ‐ | See comment | This outcome was not reported for selected trials. |
| Incidence of high altitude cerebral oedema (HACE)‐ not reported | See comment | See comment | Not estimable | ‐ | See comment | This outcome was not reported for selected trials. |
| Adverse events: Side effects‐ Follow‐ up: From arrival to 24 hours later | See comment | See comment | Not estimable | 40 | ⊕⊝⊝⊝ | This trial reported no events |
| The corresponding risk (and its 95% confidence interval) is based on the assumed risk in the comparison group and the relative effect of the intervention (and its 95% CI). | ||||||
| GRADE Working Group grades of evidence | ||||||
| 1Risk of bias downgraded (‐1) due to high risk of performance bias in one out of two studies included. | ||||||
| Dexamethasone compared with placebo for preventing high altitude illness | ||||||
| Patient or population: people at risk of high altitude illness Setting: High altitude; studies undertaken in India, South America and USA. | ||||||
| Outcomes | Illustrative comparative risks* (95% CI) | Relative effect | No of Participants | Quality of the evidence | Comments | |
| Assumed risk | Corresponding risk | |||||
| placebo | Dexamethasone | |||||
| Incidence of acute mountain sickness (AMS)‐ Follow‐ up: From arrival to 24 hours later | 449 per 1000 | 270 per 1000 | RR 0.6 | 176 | ⊕⊕⊝⊝ | |
| Incidence of high altitude pulmonary oedema (HAPE)‐ not reported | See comment | See comment | Not estimable | ‐ | See comment | This outcome was not reported for selected trials. |
| Incidence of high altitude cerebral oedema (HACE) ‐ not reported | See comment | See comment | Not estimable | ‐ | See comment | This outcome was not reported for selected trials. |
| Adverse events: General‐ Follow‐ up: From arrival to 24 hours later | See comment | See comment | Not estimable | 21 | ⊕⊝⊝⊝ | This trial reported no events |
| The corresponding risk (and its 95% confidence interval) is based on the assumed risk in the comparison group and the relative effect of the intervention (and its 95% CI). | ||||||
| GRADE Working Group grades of evidence | ||||||
| 1Risk of bias downgraded (‐1) due to unclear risk of selection, performance and detection bias in almost all studies included. | ||||||
Background
High altitude illness (HAI) is a term used to describe a group of cerebral and pulmonary syndromes that can occur during travel to elevations above 2500 metres ( ˜ 8200 feet). HAI is arbitrarily classified as high (1500 to 3500 metres ), very high (3500 to 5500 metres or ) and extreme (above 5500 metres ) (Paralikar 2010). Because of the large number of people who ascend rapidly to between 2500 and 3500 m , high altitude illness is common in this height range (Paralikar 2010). Although the proportion of oxygen remains unchanged at 20.93%, increases in altitude result in a lower partial pressure of oxygen in the inspired air (Anonymous 1892; Wilson 2009). This reduction in the driving pressure of oxygen, along the oxygen cascade from the lungs to the tissues, can compromise the supply of oxygen to the tissues (Wilson 2009), especially the cardiovascular and pulmonary systems (Leissner 2009). The physiological responses to hypoxia and acclimatization related to HAI include hyperventilation (increased depth and rate of breathing), elevation of systemic blood pressure and tachycardia (elevations of heart rate) (Leissner 2009; Naeije 2010). However, in many instances these physiologic changes may be inadequate, such that the sojourn to altitude and the concomitant hypoxia are complicated by altitude‐associated medical illness (Palmer 2010), which is also known as high altitude illness.
Description of the condition
High altitude illness (HAI)
There are two types of mountain sicknesses: acute mountain sickness (AMS) and chronic mountain sickness (CMS), also called Monge's disease (Monge 1942). Acute hypoxia, acute mountain sickness, high altitude cerebral oedema (HACE), high altitude pulmonary oedema (HAPE), cerebrovascular syndromes, peripheral oedema, retinopathy, thromboembolism, sleep disorders and periodic breathing, high altitude pharyngitis and bronchitis, ultraviolet exposure and keratitis (snow blindness), and exacerbation of pre‐existing illness are reported as medical problems potentially associated with high altitude ascent (CATMAT 2007; Palmer 2010; Schoene 2008). Factors such as the rate of ascent, the absolute change in altitude, and individual physiology are the primary determinants of whether HAI will develop or not (Leissner 2009; Palmer 2010). The risk categories for acute mountain sickness are shown in Appendix 1 (Luks 2010).
In the 19th century, Dr Daniel Vergara, a Mexican physiologist, pioneered the studies on high altitude physiology and the physiological and anatomical mechanisms of adaptation to high elevations. Forty years later, Dr Carlos Monge, a Peruvian physiologist, reported his ideas on this issue. The work of these pioneers was summarized early this century (Rodríguez de Romo 2002). Both the physiology and pathophysiology of high altitude have recently been widely reviewed (Bärtsch 2007; Leissner 2009; Palmer 2010; Paralikar 2010). In brief, these reviews confirm both the increase in respiratory rate and increase in haemoglobin concentration on exposure to a low oxygen pressure, and that such changes are often inadequate. They identify the rate of ascent, the absolute change in altitude and individual variation in physiology as the primary determinants of whether HAI will develop or not (Palmer 2010). HAI is considered an important cause of mountain mortality (Windsor 2009).
Acute mountain sickness (AMS) or high altitude cerebral oedema (HACE)
AMS is a multisystem disorder with prominent neurological features characterized by headache, anorexia, nausea and sometimes vomiting, light‐headedness, insomnia, and fatigue (Bailey 2009a; Leissner 2009; Palmer 2010). Headache is the most prevalent symptom of acute mountain sickness. In contrast, HACE is a potentially fatal neurologic disorder and it is characterized by altered consciousness or ataxia (Bailey 2009a; Hackett 2004; Imray 2010), or both, in an individual with AMS or high altitude pulmonary oedema (HAPE). If left untreated, HACE can result in death due to cerebral oedema (Bailey 2009a). HACE is widely viewed as the end stage of AMS and is normally preceded by symptoms of AMS (Basnyat 2003), which suggest a similar pathophysiologic process (Bailey 2009a; Imray 2010; Palmer 2010). Both syndromes share a common pathophysiology linked by intracranial hypertension (Bailey 2009a; Kallenberg 2007; Schoonman 2008; Wilson 2009). The severity of AMS can be scored using the Lake Louise Questionnaire, Environmental Symptoms Questionnaire, or by the use of a simple analogue scale (Imray 2010). Headache is a very common symptom at altitude and some authors have suggested it could be viewed as a distinct clinical entity.
The definition of AMS seems to be problematic, as it will vary greatly between studies. A Lake Louise Score higher than two (including headache) is not equivalent to a criterion score of 0.70 with AMS‐C (cerebral) from the Environmental Symptoms Questionnaire (Maggiorini 1998). It has been suggested that a previous review came to an erroneous conclusion because they included a study which used the AMS‐R (respiratory) score for diagnosis of AMS. The value of the AMS‐R score is questionable for diagnosing AMS (Dumont 2000). Pathophysiology with a focus on the molecular basis of AMS and HACE has been widely described by Bailey 2009a, and advances in the genetics, molecular mechanisms, and physiology that underpin them have been extensively described by Wilson 2009.
This review treats headache as a common and early symptom of AMS. Indeed, the exact definition of what constitutes AMS will vary when using different scoring systems and when interpreted by different authors. In this review we have taken care not to pool data inappropriately where the scoring systems used cannot be directly compared.
High altitude pulmonary oedema (HAPE)
HAPE is a non‐cardiogenic pulmonary oedema (Luks 2008a; Schoene 2004; Stream 2008). It is characterized by cough, progressive dyspnoea with exertion, and decreased exercise tolerance, generally developing within two to four days after arrival at high altitude (Palmer 2010; Stream 2008). It is rare after one week of acclimatization at a particular altitude (Maggiorini 2010; Palmer 2010). Hypoxia is the trigger that results in a complex cascade of events leading to HAPE (Stream 2008). Essentially, HAPE is due to a "persistent imbalance between the forces that drive water into the airspace and the biologic mechanisms for its removal" (Scherrer 2010), with the hallmark of this condition being hypoxic pulmonary hypertension. The hypertension may be mediated by at least four mechanisms: defective pulmonary nitric oxide synthesis, exaggerated endothelin‐1 synthesis, exaggerated sympathetic activation, and a defect in alveolar transepithelial sodium transport (Scherrer 2010). An extensive review of pulmonary hypertension induced by HAI is reported by Pasha 2010.
Epidemiology of acute HAI
It has been estimated that 84% of people who fly directly to 3860 m are affected by AMS (Basnyat 2003). The incidence of HACE and HAPE is much lower than for AMS, with estimates in the range of 0.1% to 4.0% (Basnyat 2003). The rate of ascent, altitude reached (especially the sleeping altitude), and individual susceptibility are the most important risk factors for the development of HAI (Basnyat 2003; Schneider 2002). Other risk factors are a history of HAI and permanent residence lower than 900 metres, exertion in children and adults (Basnyat 2003), obesity (Ri‐Li 2003), and coronary heart disease (Dehnert 2010). It is advisable that those with asthma be sure that their condition is well controlled before they undertake exertion at altitude (CATMAT 2007).
See Appendix 2 for other medical terms.
Description of the intervention
The risk of high altitude illness (HAI) begins with a non‐acclimatized person ascending to an altitude higher than 2500 metres (Paralikar 2010). However, a susceptible individual may develop AMS at an intermediate altitude such as 2000 metres (Montgomery 1989). Several interventions to prevent HAI have been described, compiled, and published in guidelines and consensus statements (CATMAT 2007; Luks 2010). Interventions for HAI prevention can be classified as pharmacological and non‐pharmacological (Bärtsch 1992; Luks 2010; Luks 2008b; Wright 2008). The Committee to Advise on Tropical Medicine and Travel proposed a consensus for HAI in 2007, describing prevention and treatment approaches among several topics regarding this medical condition (CATMAT 2007).
In 2014, the Wilderness Medical Society (WMS) published an update of their 2010 guidelines (Luks 2010), detailing prevention and treatment directives for HAI (AMS, HACE, HAPE). This guideline was developed by an expert panel that compiled and classified all available evidence on HAI prevention and treatment. Recommendations based on evidence, using American College of Chest Physicians strategies, were agreed upon. For AMS and HACE, the experts proposed a risk classification where low‐risk people are discarded for prevention interventions. For HAPE, pharmacological prophylaxis is recommended for those with a previous diagnosis of HAI (Luks 2014). However, the document does not include all of the most frequent and broadly‐described pharmacological interventions for prevention and treatment of HAI. The most commonly suggested interventions are summarized below.
-
Carbonic anhydrase inhibitors: acetazolamide and methazolamide (Bernhard 1998; Carlsten 2004; Hussain 2004; Swenson 2007; Van Patot 2008; Wright 1983; Wright 2008).
-
Steroids: budenoside, prednisolone and dexamethasone (Basu 2002a; Basu 2002b;Ellsworth 1991; Hackett 1988; Johnson 1984; Rock 1989a).
-
Bronchodilator drugs: Include salmeterol, theophyline and montelukast (Sartori 2002; Kleinsasser 2002; Wright 2008).
-
Selective inhibitor of phosphodiesterase type 5 (PDE5): taladafil (Maggiorini 2006) and sildenafil (Bates 2007; Kleinsasser 2002; Richalet 2005).
-
Calcium modulators: Include nifedipine and flunarizine (Bartsch 1991; Hohenhaus 1994).
-
Non‐steroidal anti‐inflammatory drugs (NSAIDs) and other analgesic: aspirin, carbasalate and ibuprofen (Burtscher 1998; Burtscher 2001).
How the intervention might work
Extensive reviews of the pharmacotherapy of HAI have recently been published (Maggiorini 2010; Wright 2008). Below is a list and brief description of the common agents that have so far been suggested. Appendix 3 provides more detail, and discusses the potential adverse effects of each agent.
-
Carbonic anhydrase (CA) inhibitors (acetazolamide and methazolamide) generate inhibition of CA in the kidneys, resulting in increased bicarbonate excretion in the urine and metabolic acidoses. The result is an offsetting of hyperventilation‐induced respiratory alkalosis, allowing chemoreceptors to respond more fully to hypoxic stimuli at altitude (Leaf 2007). Acetazolamide can also cause pulmonary vasodilation unrelated to carbonic anhydrase inhibition (Höhne 2007; Swenson 2006).
-
Steroids (dexamethasone, budesonide and prednisolone): Hypoxia‐induced vasogenic oedema has been suggested as one of the major mechanisms responsible for development of AMS (Hackett 1999). Glucocorticoids blocks hypoxia‐induced endothelial dysfunction (Murata 2004; Murata 2005).
-
Bronchodilators (salmeterol, theophylline or aminophylline, montelukast). The human beta‐2 adrenergic receptor (B2AR) has been found to play a very important role in the pathogenesis of HAPE, and salmeterol was found to have a high binding affinity with human B2AR (Chandramoorthi 2008). Furthermore, salmeterol enhances alveolar clearance by stimulating amiloride‐sensitive sodium (Na) channels (Maggiorini 2010). Non‐selective phosphodiesterase inhibitor (theophylline or aminophylline): anti‐hypoxia and antioxidation effects of aminophylline (Yang 2007) could be responsible for reducing periodic breathing, cerebral and pulmonary microvascular permeability, and pulmonary artery pressure (Wright 2008). Montelukast is a leukotriene receptor antagonist (LTRA) that reduces the bronchoconstriction (Tintinger 2010).
-
Selective inhibitors of phosphodiesterase type 5 (taladafil and sildenafil) induce overproduction of nitric oxide, which attenuates pulmonary vasoconstriction during acute hypoxia (Ozaki 2001; Zhao 2001). It causes a reduction in pulmonary hypertension.
-
Calcium channel blockers (CCBs): calcium channel antagonists or calcium antagonists (nifedipine, flunarizine) are a group of medications that disrupt the movement of calcium (Ca2+) through calcium channels and reduce pulmonary vascular resistance (Hackett 1992), leading to a reduction of the pulmonary hypertension.
-
Non‐steroidal anti‐inflammatory drugs (NSAIDs) and other analgesics (aspirin, ibuprofen, carbasalate): it is postulated that prostaglandin‐mediated increases in cerebral microvascular permeability may contribute to the pathophysiology of AMS, and treatment with prostaglandin synthesis inhibitors could reduce this response (CATMAT 2007).
See Appendix 3 for adverse events of the pharmacological interventions.
Why it is important to do this review
It is important to conduct this systematic review for many reasons. First, many people all over the world travel to recreational areas located at high altitudes, putting themselves at increased risk of developing acute HAI. HAI may be severe and life‐threatening, so effective prevention is likely to be of great value both to these visitors to high‐altitude areas, and to those responsible for their treatment and rescue when required. At the other end of the spectrum, reliable prevention of minor degrees of AMS would greatly enhance the experience of many travellers. Travel to high altitudes may also aggravate underlying illnesses, particularly cardiopulmonary diseases (CATMAT 2007). Second, the true role of the many approaches for preventing acute HAI is uncertain (Adams 2004; Bärtsch 2004; CATMAT 2007; Elphick 2004), meaning that their clinical effectiveness and safety must be assessed. Third, it is necessary to answer questions such as: Are all of these interventions equally useful regardless of the type of HAI? and Is there a reason to believe that some forms are more appropriate for some persons at risk than others?. Four, an updated meta‐analysis on AMS prevention needs to be produced (Dumont 2000).
A systematic review, including a rigorous assessment of the risks of bias, of the most up‐to‐date evidence, will help clinicians make informed decisions about the use of non‐pharmacological and pharmacological interventions for preventing acute HAI. The protocol for this review included all agents to prevent high altitude illness (Martí‐Carvajal 2012), but we have decided to split the review into a series of three publications about the prevention of this condition (Part 1: Commonly‐used drugs. Part 2: Less commonly‐used drugs. Part 3: Miscellaneous and non‐pharmacological interventions). This review includes six groups of the most highly recommended agents to prevent acute HAI.
Objectives
To assess the clinical effectiveness and adverse events of commonly‐used interventions for preventing acute HAI.
Methods
Criteria for considering studies for this review
Types of studies
We include randomized controlled trials (RCTs) irrespective of publication status (trials may be unpublished or published as articles, abstracts, or letters), language (no language limitation) or country. We applied no restrictions by length of follow‐up. We also included cross‐over trials (See Differences between protocol and review and section).
We excluded quasi‐randomized studies and prospective observational studies for evaluating clinical effectiveness.
Types of participants
We include trials involving participants who are at risk of developing high altitude illness (AMS or HACE, HAPE). We include participants with and without a history of high altitude illness. We applied no age or gender restrictions.
Types of interventions
The published protocol for this review included all agents to prevent high altitude illness (Martí‐Carvajal 2012). However we decided to split the topic into a series of three publications about the prevention of this condition (See Differences between protocol and review section). This is the first of the three and includes the following six groups of the most widely recommended agents to prevent acute HAI:
-
Carbonic anhydrase inhibitors: Including acetazolamide and methazolamide.
-
Steroids: Including budenoside, prednisolone and dexamethasone.
-
Bronchodilator drugs: Including salmeterol, theophyline and montelukast.
-
Selective inhibitor of phosphodiesterase type 5 (PDE5): Including taladafil and sildenafil.
-
Calcium channel modulators: Including nifedipine and flunarizine.
-
Non‐steroidal anti‐inflammatory drugs (NSAIDs) and other analgesics: Including aspirin, carbasalate and ibuprofen.
We include trials where the relevant medication was administered before beginning the ascent. We exclude trials using these drugs during or after the ascent.
Types of outcome measures
We modified the following outcome measures from the published protocol (Martí‐Carvajal 2012). This is a departure from the protocol and it is explained in the Differences between protocol and review section.
Primary outcomes
-
Incidence of acute mountain sickness (AMS ‐ as defined by each study) at any time.
Secondary outcomes
-
Incidence of high altitude pulmonary oedema (HAPE ‐ as defined by each study) at any time.
-
Incidence of high altitude cerebral oedema (HACE ‐ as defined by each study), at any time.
-
Incidence of adverse events in general, including paraesthesia, at any time.
-
Differences in HAI/AMS scores at high altitude. We analysed the differences between groups by any measure of AMS severity and between 0 and 48 hours at high altitude.
Search methods for identification of studies
We used the same search methods for the identification of studies, which are common to the three reviews included in this series.
Electronic searches
We searched the Cochrane Central Register of Controlled Trials (CENTRAL) (the Cochrane Library, January 2017); MEDLINE (OVID, 1966 to January 2017); Embase (OVID, 1980 to January 2017); LILACS (1982 to January 2017). We used the specific search terms listed below in combination with the Cochrane highly sensitive search strategy for identifying randomized controlled trials (RCTs) in the Cochrane Handbook for Systematic Reviews of Interventions (Higgins 2011). Appendix 4 to Appendix 7 show the search strategies used in this set of reviews. We undertook the most recent search in January 2017.
Searching other resources
We also searched trials registries through the World Health Organization International Clinical Trials Registry Platform Search Portal (ICTRP) (see Appendix 8). We looked through the reference lists of the retrieved publications and review articles. We undertook the most recent search in January 2017.
Data collection and analysis
Data collection and analysis methods were common to the three reviews included in this series.
Selection of studies
Two review authors independently assessed each reference identified by the search against the inclusion criteria. We resolved any disagreements by discussion, and by consultation with a third review author as an arbiter if we could not reach agreement. We retrieved in full those references which appeared to meet the inclusion criteria for further independent assessment by the same three review authors.
Data extraction and management
We used a predefined form to extract the following data: eligibility criteria, demographics (age, gender, country), rate of ascent (metres/hour), final altitude reached (metres), AMS scale, design study, history of HAI, type of HAI, proposed intervention, and main outcomes, among others. See Appendix 9 for details of the data extraction form. For eligible studies, two review authors extracted the data using the selected form. We resolved discrepancies through discussion or, if required, we involved a third review author. We entered data into Review Manager 5 software and checked them for accuracy.
Assessment of risk of bias in included studies
Three review authors independently assessed risks of bias for each study, using the criteria outlined in the Cochrane Handbook for Systematic Reviews of Interventions (Higgins 2011). We resolved any disagreement by discussion. We judged the methodological quality of each study using Cochrane’s process for assessing risk of bias, a two‐part tool that addresses the six specific domains: random sequence generation; allocation concealment; blinding of participants, personnel, and outcome assessors; incomplete outcome data; selective reporting; and other potential biases (Higgins 2011). The first part describes the risk of bias; the second part provides criteria for making judgements about the risk of bias from each of the six domains (Appendix 9). Based on this process we implemented a 'Risk of bias' worksheet to be filled out for each study. Two review authors independently assessed the risks of bias, resolving any disagreement through consultation with an additional review author. We display the results by creating a 'Risk of bias' graph and a 'Risk of bias' summary figure using RevMan 5.3 software, if appropriate. We present the risks of bias in the Results section. We also provided summary assessments of the risks of bias for each outcome within and across studies.
Measures of treatment effect
For dichotomous outcomes (such as incidence of AMS or HAPE), we show results as summary risk ratios (RRs) with 95% confidence intervals (CIs). For continuous outcomes (such as differences in AMS scores), we present the results as summary mean differences (MDs) or standardized mean differences (SMDs) as appropriate, with a 95% CI. Because we identified a considerable number of cross‐over trials, we have included these studies separately and analysed this information using the criteria outlined in the Cochrane Handbook for Systematic Reviews of Interventions‐ Chapter 16.4 (Elbourne 2002; Higgins 2011; Stedman 2011), specifically related to estimation of the Mantel‐Haenzel odds ratio (OR) for paired outcomes.
Unit of analysis issues
The published protocol did not include consideration of any unit of analysis issues. However, our searches identified 12 cross‐over studies and we included them in the analyses, but separately from the parallel studies. In brief, we used the methods recommended by Elbourne (Elbourne 2002; Stedman 2011). This is a departure from the protocol (Martí‐Carvajal 2012) and is explained in the Differences between protocol and review section.
Dealing with missing data
For all outcomes, we carried out analyses, as far as possible, on an intention‐to‐treat (ITT) basis (i.e. we attempted to include all randomized participants in the denominator of the assessed groups in the analyses). Due to the fact that we included studies with missing information (especially standard deviations) or data not suitable for planned analyses, we followed the methods recommended by the Cochrane Handbook for Systematic Reviews of Interventions‐ Chapter 16.1.3. (Higgins 2011). In brief, we transformed median values and their interquartile ranges or range extracted from included studies to means and standard deviations according to Wan and colleagues (Hozo 2005; Wan 2014). This is a departure from the protocol (Martí‐Carvajal 2012) and it is explained in the Differences between protocol and review section.
Assessment of heterogeneity
We used the I2 statistic to measure statistical heterogeneity among the trials in each analysis. When we identified substantial heterogeneity, we explored it by prespecified subgroup analysis. The I2 statistic describes the percentage of total variation across trials due to heterogeneity rather than sampling error (Higgins 2003). We considered a value for I2 greater than 50% (Higgins 2011) to be statistically significant. We assessed the clinical and methodological diversity of the included studies in a comparison for sufficient homogeneity before choosing to estimate summary effect sizes.
Assessment of reporting biases
We assessed whether the review was subject to publication bias by using a funnel plot to graphically illustrate variability between trials. If we detected asymmetry, we planned to explore causes other than publication bias. We produced a funnel plot if we could include 10 or more RCTs in a comparison.
Data synthesis
We summarized the findings using the random‐effects model (DerSimonian 1986). We carried out statistical analyses using Review Manager 5 (RevMan 5.3). We interpreted differences as important where the 95% confidence interval did not cross the value of no difference between groups. We also applied trial sequential analysis, as cumulative meta‐analyses are at risk of producing random errors due to sparse data and repetitive testing of the accumulating data (Brok 2009; Wetterslev 2008). To minimize random errors, we calculated the required information size (i.e. the number of participants needed in a meta‐analysis to detect or reject a certain intervention effect) (Wetterslev 2008). The required information size calculation also accounted for the heterogeneity or diversity present in the meta‐analysis (Wetterslev 2008). In our meta‐analysis, we based the diversity‐adjusted required information size on the event proportion in the control group; assumption of a plausible risk ratio reduction (RRR) of 20% on the RR reduction observed in the included trials with low risk of bias; a risk of type I error of 5%; a risk of type II error of 20%; and the assumed diversity of the meta‐analysis. We added the trials according to the year of publication, and if more than one trial had been published in a year, we added trials alphabetically according to the last name of the first trial author. On the basis of the required information size, we constructed trial sequential monitoring boundaries (Lan 1983; Thorlund 2009; Wetterslev 2008). These boundaries determine the statistical inference one may draw regarding the cumulative meta‐analysis that has not reached the required information size; if the trial sequential monitoring boundary is crossed before the required information size is reached, firm evidence may perhaps be established and further trials may turn out to be superfluous. On the other hand, if the boundary is not crossed, it is most probably necessary to continue doing trials in order to detect or reject a certain intervention effect. This can be determined by assessing if the cumulative Z‐curve crosses the trial sequential boundaries. Furthermore, trial sequential analysis can test the futility before the required information size has been reached, i.e. trial sequential analysis provides an area of futility. If futility boundaries are crossed, then further trials may be unnecessary (CTU 2011). We conducted TSA using software from the Copenhagen Trial Unit (CTU 2011). This is a departure from the published protocol (Martí‐Carvajal 2012). See the details in the Differences between protocol and review section.
Subgroup analysis and investigation of heterogeneity
We investigated heterogeneity by an informed clinical evaluation of each outcome, combining data only when clinically appropriate. We also investigated statistical heterogeneity using the I2 statistic, as described above. For the primary outcomes, we considered subgroup analysis for the following factors, as appropriate:
-
Extreme altitude exposure versus high or very high exposure (high: 1500 to 3500 metres; very high: 3500 to 5500 metres ; and extreme: above 5500 metres ) (Paralikar 2010).
-
Presence or absence of people at high risk of HAI.
-
The presence or absence of significant pre‐existing disease: cardiovascular diseases, chronic obstructive pulmonary disease (COPD), diabetes mellitus.
Sensitivity analysis
We performed a sensitivity analysis comparing the general results versus RCTs of high methodological quality (studies classified as having a 'low risk of bias' (Higgins 2011)). We chose only three core domains: generation of allocation sequence, incomplete outcome data, and selective reporting bias.
Summary of findings tables
We used the GRADE system (Guyatt 2008) to assess the quality of the body of evidence associated with primary outcomes (incidence of AMS, HAPE, HACE and adverse events), and we constructed three 'Summary of findings' tables using the GRADE profiler software for the three major comparisons in this review (acetazolamide versus placebo, budenoside versus placebo and dexamethasone versus placebo). The outcomes covered in these tables are the incidence of AMS, the incidence of HAPE, the incidence of HACE and adverse events (summary of findings Table for the main comparison; summary of findings Table 2; summary of findings Table 3). The GRADE approach appraises the quality of a body of evidence based on the extent to which one can be confident that an estimate of effect or association reflects the item being assessed. Evaluation of the quality of a body of evidence considers within‐study risk of bias, directness of the evidence, heterogeneity of the data, precision of effect estimates and risk of publication bias (Balshem 2011; Guyatt 2011a; Guyatt 2011b; Guyatt 2011c; Guyatt 2011d; Guyatt 2011e; Guyatt 2011f; Guyatt 2011g; Guyatt 2011h).
Results
Description of studies
See Characteristics of included studies and Characteristics of excluded studies.
Results of the search
We carried out the latest search strategies in January 2017 and identified 1280 references. After reviewing the references by title and abstract, we selected 173 of the citations to review as full texts (see Figure 1). After reading the articles, we included 64 studies and 4547 participants (distributed across 78 references), excluded 38 studies (distributed in 40 references), classified 12 as ongoing studies, and 12 as studies awaiting assessment (most of them due to full text not yet available). We also identified 31 additional studies focusing on other interventions not covered by this review. We will incorporate these in subsequent reviews in this series.

Study flow diagram.
Included studies
Twelve of 64 included studies are cross‐over trials (18.7%) that we analysed separately (Fischer 2000a; Fischer 2004; Fulco 2006; Greene 1981; Johnson 1984; Larson 1982b; Luks 2007; Muza 2004; Rock 1989a; Rock 1989b; Rock 1989c; Subudhi 2011). Fifty‐four trials were developed at high altitude (84%), and the remaining 11 were performed in hypobaric chambers (17.1%; Table 1; Baumgartner 2003; Fischer 2000a; Fischer 2004; Fulco 2006; Johnson 1984; Luks 2007; Muza 2004; Subudhi 2011; Rock 1989a; Rock 1989b; Rock 1989c).
| Study | High mountain | Men (%) | Increased risk of AMS, HAPE or HACE | Country | Administration timing | Trekking | Final altitude (mts) | Difference between the endpoint and the baseline altitude (mts) | Duration of ascent | Definicion de AMS | Conflict of interest |
| Yes | 100 | No | Ecuador | 3 days | No (Car) | 5000 | 2225 | 5 days | No definition was provided | No | |
| Yes | 72.4 | No | Nepal | unclear | Yes | 4928 | 648 | Unclear | Lake Louise AMS score≥3 with headache | No | |
| Yes | 54.2 | No | USA | 2 days | No (Car) | 4300 | 4100 | 5 hours | No definition was provided | No | |
| Yes | 95.2 | Previous episodes of HAPE | Italy | 4 days | No (Car) | 4559 | 3429 | 1 day | No definition was provided | No | |
| Yes | 67.1 | No | Nepal | 2‐3 days | Yes | 4937 | 2937 | 2‐3 days | Lake Louise AMS score= headache + 1 symptom | Yes | |
| Yes | 626 | No | Nepal | max 4 dias | Yes | 5000 | 750 | 36‐96 hours | Lake Louise AMS score≥3 with headache | Yes | |
| Yes | 100 | No | India | 2 days | Yes | 3450 | 3230 | 3 days | No definition was provided | No | |
| Yes | 100 | No | Nepal | 2 days | No (Flight) | 3450 | 3230 | Unclear | Lake Louise AMS score | No | |
| Yes | 58 | No | Chile | 4‐5 days | 5200 | Unclear | Lake Louise AMS score≥3 | No | |||
| No | 100 | No | Switzerland | 7 days | No applicable | 4559 | 4069 | 13 minutes | ESQ=AMS‐C SCORE>0,70 | No | |
| Yes | 65.2 | 40% subjects with previous AMS mild or moderate | Bolivia | 4 days | No (Car) | 5334 | 1645 | 2 hours | Modified ESQ= 3 cerebral symptoms, one with intensity ≥2 | Yes | |
| Yes | 69.2 | 50% of the subjects had previously visited high altitudes and had experienced mild to moderate AMS | Bolivia | 4 days | No (Car) | 5334 | 1645 | 2 hours | Modified ESQ= 3 cerebral symptoms, one with intensity ≥2 | No | |
| Yes | 90.4 | No | Nepal | 3 days | Yes | 4846 | 3546 | 10 days | No definition was provided | No | |
| Yes | Unclear | No | Pakistan | 2 days | No (Car) | 4450 | 3932 | 8 hours | No definition was provided | No | |
| Yes | 64 | History of headache | Unclear | 2 hours | No (combination) | 3480 | 2880 | Unclear | Headache scoring | No | |
| Yes | Unclear | History of AMS | Italy | 10 hours | No (combination) | 3800 | 3200 | Less than a day by car up to 3480, and 2.8 to 3 hours climbing from there to 3800m | Lake Louise AMS score≥3 | Yes | |
| Yes | 58.6 | History of headache | Unclear | 1 hour | Unclear | 3480 | 2880 | Unclear | Headache scoring | Yes | |
| Yes | 62.6 | No | Nepal | 2 hours | No (Flight) | 3630 | 3630 | 7‐8 hours | Lake Louise AMS score≥4 | Yes | |
| Yes | Unclear | No | China | 3 days | No (Flight) | 3700 | 3200 | 2.5 hour | Lake Louise AMS score≥3 | No | |
| Yes | 57.8 | No | USA | 5 days | No (Car) | 3800 | 2570 | 2 hours | Lake Louise AMS score≥5 | No | |
| Yes | 61.1 | No | USA | 1 day | No (combination) | 4392 | 3262 | 1 day | Modified ESQ= AMS‐C>0,7 + AMS‐R>0,6 | No | |
| Yes | 70 | Unclear | Italy | 3 days | No (Cable‐cars or train) | 3459 | 3309 | Unclear | No definition was provided | No | |
| No | 100 | No | Germany | 3 days | No applicable | 4500 | 4500 | 30 min | No definition was provided | No | |
| Yes | 100 | No | Switzerland | 3 days | No (Cable‐cars or train) | 3454 | 3454 | 3 hours | No definition was provided | No | |
| No | 100 | No | Germany | 3 days | No applicable | 4500 | 4500 | 15 minutes | ESQ‐C score >0,5 or Lake Louise AMS score>3 | No | |
| No | 83.3 | No | USA | 1 days | No applicable | 4300 | 4300 | Unclear | Modified ESQ= AMS‐C>0,7 + AMS‐R>0,6 | No | |
| Yes | 91.6 | No | Nepal | 2 days | Yes | 5895 | 3895 | 5 days | No definition was provided | No | |
| Yes | 71 | No | Nepal | 4 days | Yes | 4243 | 803 | 3‐4 days | Questionnaire clinical>2 | No | |
| Yes | 100 | No | USA | 1 hour | No (Flight) | 4400 | 4400 | 1 hour | AMS Score>2 or Modified ESQ= AMS‐C>0,7 + AMS‐R>0,6 | No | |
| Yes | 70.5 | No | Nepal | 1 day | Yes | 4928 | 648 | Unclear | No definition was provided | Yes | |
| Yes | 100 | Unclear | Nepal | Unclear | Yes | 4930 | 1490 | 7 days | Lake Louise AMS score≥3 with headache | Yes | |
| Yes | 61,00 | No | India | 5 days | Yes | 5500 | 2100 | 9 days | No definition was provided | No | |
| Yes | 86,00 | susceptibility to AMS | Italy | 3 days | No (combination) | 4559 | 4069 | 22 hours | Score clinical proposed at the International Hypoxia symposium+ Do you feel ill?=Yes | Yes | |
| Yes | 100 | No | Pakistan | 1 day | No (combination) | 4578 | 4063 | 1 day | ESQ score > = 6 | No | |
| Yes | 100 | No | USA | 1 day | Unclear | 3500 | 3300 | Unclear | No definition was provided | No | |
| No | 100 | No | USA | 1 day | No applicable | 4570 | 4570 | Unclear | Modified ESQ= AMS‐C>0,7 + AMS‐R>0,6 | No | |
| Yes | unclear | No | 1 day | No (combination) | 5896 | 5896 | 7 days | Lake Louise AMS score≥3 with headache | No | ||
| Yes | 100 | No | China | 3 days | No (Flight) | 3658 | Unclear | 3 hours | Presence of of headache and at least one of the symptoms of nausea or vomiting, fatigue, dizziness, or difficulty sleeping, and a total score of at least 3, | Yes | |
| Yes | 100 | No | Italia | 5 days | Yes | 4559 | 4559 | 2 days | Lake Louise AMS score≥4 | No | |
| Yes | unclear | No | USA | 1 day | Yes | 4394 | 3094 | 2 days | GHAQ = Headache moderate or more and/or nausea moderate or more | No | |
| Yes | 84.3 | No | USA | 1 day | Yes | 4394 | 3094 | 2 days | GHAQ = Headache moderate or more and/or nausea moderate or more | No | |
| Yes | 67.4 | No | USA | 6 hours | No (combination) | 3810 | 2570 | 12 hours | Lake Louise AMS score≥3 with headache | Yes | |
| No | unclear | No | USA | 4 days | No applicable | 3900 | 2490 | Unclear | No definition was provided | Yes | |
| Yes | 86.2 | History of HAPE | Italia | 1 day | No (combination) | 4559 | 4069 | 2 days | Lake Louise AMS score≥4 | Yes | |
| Yes | Unclear | Patients with asthma | Kirguistán | 2 days | No (Car) | 3200 | 2440 | 4 hours | No definition was provided | No | |
| Yes | 74 | No | USA | 1,5 days | Unclear | 2700 | 2700 | Unclear | AMS score clinical= 3 or more symptoms with a grade 2 or greater | No | |
| Yes | 100 | No | Chile | 3 days | No (Cable‐cars or train) | 3696 | 3696 | 8,5 hours | AMS score clinical≥3 or 1 symptom=3 | No | |
| Muza 2004 Def1 | No | unclear | No | USA | 1 hour | No applicable | 4300 | 4300 | Unclear | Lake Louise AMS score≥3 | Yes |
| Yes | 60 to 69 | No | Nepal | 6 days | Yes | 4928 | 1488 | Unclear | Lake Louise AMS score≥3 | No | |
| Yes | 95 | No | Italy | 3 days | No (combination) | 4559 | 4437 | <28 hours | Lake Louise AMS score≥3 | Yes | |
| Yes | 70 to 74 | No | Nepal | 2 days | Yes | 4928 | 648 | Unclear | Lake Louise AMS score≥3 with headache | Yes | |
| Yes | 44 | No | USA | 2 days | No (Flight) | 4300 | 4300 | 6 hours | Modified ESQ= AMS‐C>0,7 + AMS‐R>0,6 | No | |
| No | 100 | No | USA | 12 hours | No applicable | 4570 | 4570 | Unclear | Johnson Score≥1 | No | |
| No | 100 | No | USA | 12 hours | No applicable | 4570 | 4570 | Unclear | Johnson Score≥1 | No | |
| No | 100 | No | USA | 12 hours | No applicable | 4570 | 4570 | Unclear | Johnson Score≥1 | No | |
| Yes | unclear | susceptible to HAPE | Italy | <6 hours | No (combination) | 4559 | 3429 | 22 hours | No definition was provided | No | |
| Yes | 62 to 72 | No | Nepal | Unclear | Yes | 5000 | 700 | 30 hours‐4 days | Lake Louise AMS score= headache + 1 symptom | No | |
| No | 80 | No | USA | 1 day | No applicable | 4875 | 3225 | 1 day | Lake Louise AMS score≥3 | Yes | |
| Yes | 43 to 52 | No | USA | 3 days | No (Car) | 4300 | 2700 | Unclear | ESQ AMS‐C Score≥0,7 + Lake Louise AMS score≥3 with headache | Yes | |
| Yes | 44 to 62 | No | Bolivia | 3 days | No (Flight) | 3561 | 3159 | 3 hours | No definition was provided | Yes | |
| Yes | 95 | Previous severe AMS= 6 | Kenia | 8 days | No (combination) | 4790 | 3527 | 3 days | No definition was provided | No | |
| Yes | 92 | No | Nepal | Unclear | No (Car) | 4680 | 4680 | 3 days | Lake Louise AMS score≥3 | No | |
| Yes | 62 to 72 | No | Nepal | 2 days | No (combination) | 4050 | 2710 | 3 days | No definition was provided | No | |
| Yes | 100 | No | China | 1 day | No (Car) | 3900 | 3500 | 5 days | LLS includes 5 self‐reporting symptoms:headache, gastrointestinal symptoms, fatigue/weakness, dizziness/lightheadedness and difficulty in sleeping. Each symptom is scores 0‐3 | No |
Participants
The participants' ages ranged between 16 and 65 years. Nineteen of the studies included only men (29.6%; Table 1. Anonymous 1981; Basu 2002a; Basu 2002b; Baumgartner 2003; Fischer 2000a; Fischer 2000b; Fischer 2004; Hackett 1988; Hillenbrand 2006; Hussain 2001; Jain 1986; Johnson 1984; Ke 2013; Küpper 2008; Moraga 2007; Rock 1989a; Rock 1989b; Rock 1989c; Zheng 2014).
Eleven out of 64 studies included people at high risk of AMS, HAPE or HACE, due to a history of these conditions or comorbidities such as asthma (17.1%; Bartsch 1991; Bernhard 1994; Bernhard 1998; Burtscher 1998; Burtscher 2001; Burtscher 2014; Hohenhaus 1994; Maggiorini 2006; Mirrakhlmov 1993; Sartori 2002; Wright 1983).
Setting
Nineteen of the studies were undertaken in the USA (29.6%);17 were carried out in India (26.1%); and six out of 65 studies were carried out in South America (9.2%; Anonymous 1981; Bates 2011; Bernhard 1994; Bernhard 1998; Moraga 2007; Wang 2013). The remaining studies were carried out in other countries (Table 1)).
Administration of intervention to prevent AMS
Twenty‐four out of 64 studies provided the intervention between three and five days prior to the ascent (37.5%; Table 1), and 22 between one and two days prior (34.3%; Table 1). The remaining studies provided the intervention in other time intervals. Four trials did not provide information about this issue (ASCENT 2012; Hillenbrand 2006; SPACE 2011; Wright 2004). In 25% of the trials, the participants hiked to endpoint altitude (trekking), and 12 studies used a combination of means of transportation, including cars, trains, and cable‐cars (18.7%; Table 1).
Altitude
Most of the included studies reached a final altitude of between 4001 and 5000 metres above sea level (59.3%; Table 1). The most frequent difference between the endpoint and the baseline altitude was 3001 to 4000 metres (35.9%; Table 1), followed by a difference of more than 4000 metres (28.1%). The most frequent durations for ascent were of less than five hours (14 studies, 21.8%; Table 1) and three days or more (14 studies, 21.8%; Table 1). Eighteen studies did not provide information about these issues (28.1%; ASCENT 2012; Burtscher 1998; Burtscher 2001; Basu 2002a; Faull 2015; Fulco 2006; HEAT 2010; Jain 1986; Johnson 1984; Luks 2007; Montgomery 1989; Muza 2004; PACE 2006; PHAIT 2004; Rock 1989a; Rock 1989b; Rock 1989c; Van Patot 2008).
Scale used to assess AMS
The most commonly‐used scale used was the Lake Louise Score (23 trials, 35.9%), and the criterion to define AMS onset was a score three or more points in eight trials (12.5%; Table 1. Bates 2011; Burtscher 2014; Chen 2015; Muza 2004; PACE 2006; Parati 2013; Subudhi 2011; Wright 2004). In 19 studies,the criteria used to define the onset of AMS were unclear (29.6%; Anonymous 1981; Banderet 1977; Bartsch 1991; Basu 2002a; Bradwell 1986; Burki 1992; Faull 2015; Fischer 2000a; Fischer 2000b; Greene 1981; HEAT 2010; Hochapfel 1986; Jain 1986; Luks 2007; Mirrakhlmov 1993; Sartori 2002; Wright 1983; Wang 2013; Zell 1988).
Funding
In 23 of the included studies, the source of funding was unclear (35.9%; Table 1), and only 19 of 64 studies declared their possible conflicts of interests (29.6%; Basnyat 2003; Basnyat 2008; Burtscher 1998; Burtscher 2014; Carlsten 2004; HEAT 2010; Hillenbrand 2006; Hohenhaus 1994; Ke 2013; Lipman 2012; Luks 2007; Maggiorini 2006; Muza 2004; Bernhard 1994; Parati 2013; PHAIT 2004; Subudhi 2011; Van Patot 2008; Wang 2013).
Excluded studies
We excluded 38 studies (40 references) from the review. Twenty‐eight out of 38 were excluded for not focusing on HAI or AMS prevention (73.6%), but reported instead physiological or laboratory results related to altitude ascent. In eight studies, authors reported results for the treatment of HAI or AMS (21%). We excluded the remaining references for other reasons. Readers can find more information about this aspect in the Characteristics of excluded studies.
Studies awaiting classification
We classified 12 studies (Dugas 1995; Ellsworth 1987; Furian 2016; Hefti 2014; Kasic 1991; Lee 2011; Pun 2014; Roncin 1996; Swenson 1997; Utz 1970; Wang 1998; Xiangjun 2014) as awaiting assessment. We were unable to obtain the full texts from the authors, the Anaesthesia, Critical and Emergency Care Cochrane Group (ACE) or the Iberoamerican Cochrane Centre. See Characteristics of studies awaiting classification.
Ongoing studies
We considered 12 additional studies to be ongoing (ChiCTR‐TRC‐13003319; ChiCTR‐TRC‐13003590; NCT00886912; NCT01606527; NCT01682551; NCT01794078; NCT01993667; NCT02244437; NCT02450968; NCT02604173; NCT02811016; NCT02941510), given that we were only able to find them on trial registers, but we considered that they could be published shortly. See Characteristics of ongoing studies.
Risk of bias in included studies
We assessed the risks of bias for the studies across six domains. We provide a summary of our assessment of the methodological quality of included studies in Figure 2 and Figure 3.

Risk of bias graph: review authors' judgements about each risk of bias item presented as percentages across all included studies.

Risk of bias summary: review authors' judgements about each risk of bias item for each included study.
Allocation
The authors reported a valid method of randomization in 19 studies, (ASCENT 2012; Basnyat 2008; Bates 2011; Bernhard 1998; Chen 2015; Chow 2005; Ellsworth 1991; Faull 2015; HEAT 2010; Hillenbrand 2006; Jain 1986; Ke 2013; Larson 1982a; Lipman 2012; Maggiorini 2006; Moraga 2007; PHAIT 2004; Van Patot 2008; Zheng 2014), whereas this information was not clearly reported in the remaining studies (70.3%). Similarly, 14 studies undertook and reported random allocation concealment (Basnyat 2003; Basnyat 2008; Chen 2015; Chow 2005; Hillenbrand 2006; Lipman 2012; Maggiorini 2006; PACE 2006; PHAIT 2004; Rock 1989a; Rock 1989b; Rock 1989c; Wright 2004; Zheng 2014), and the information was absent from the remaining included studies (78.1%).
Blinding
Twenty‐two studies reported blinding of participants and personnel (Basnyat 2003; Basnyat 2008; Bates 2011; Bernhard 1998; Bradwell 1986; Burtscher 2014; Chow 2005; Ellsworth 1991; Fulco 2006; Hackett 1976; Hillenbrand 2006; Hochapfel 1986; Ke 2013; Larson 1982a; Larson 1982b; Luks 2007; PACE 2006; Rock 1989a; Rock 1989b; Rock 1989c; Wang 2013; Zheng 2014). In two studies, we classified this domain as high risk (Banderet 1977; Chen 2015).
We considered the risk of detection bias to be low in 12 studies (Bartsch 1991; Chow 2005; Fulco 2006; Hackett 1976; Hillenbrand 2006; Maggiorini 2006; Rock 1987; Rock 1989a; Rock 1989b; Rock 1989c; Wright 1983; Zheng 2014), and unclear in the remaining studies (81.2%). In eight studies, we rated the risk of bias as low for both performance and detection bias (Chow 2005; Fulco 2006; Hackett 1976; Hillenbrand 2006; Rock 1989a; Rock 1989b; Rock 1989c; Zheng 2014).
Incomplete outcome data
Significant numbers of participants were lost or excluded from the final analysis of eight studies (Bartsch 1991; Basnyat 2003; HEAT 2010; Hillenbrand 2006; Johnson 1984; Luks 2007; PHAIT 2004; Subudhi 2011). Nine further studies presented unclear data (ASCENT 2012; Basu 2002a; Basu 2002b; Bradwell 1986; Faull 2015; Fischer 2000a; Hackett 1976; Hochapfel 1986; Jain 1986). In the studies with minimal attrition bias, we often found that the data analyses were undertaken on a per protocol basis, and we took this into account for data collection, including all the randomized participants in the denominators of the assessed groups.
Selective reporting
Reporting adverse events associated with the different types of interventions is fundamental to a complete assessment of their usefulness in clinical practice. We found that the majority of the studies did not report on adverse events associated with the classes of drugs commonly‐used for prevention of AMS (such as paraesthesia) (73.4%; Banderet 1977; Bartsch 1991; Basnyat 2008; Basu 2002a; Basu 2002b; Bates 2011; Baumgartner 2003; Bernhard 1994; Bernhard 1998; Burki 1992; Burtscher 1998; Burtscher 2014; Carlsten 2004; Chen 2015; Ellsworth 1991; Faull 2015; Fischer 2000b; Fischer 2004; Fulco 2006; Hackett 1976; Hackett 1988; Hochapfel 1986; Hohenhaus 1994; Jain 1986; Kayser 2008; Küpper 2008; Larson 1982a; Larson 1982b; Lipman 2012; Luks 2007; Maggiorini 2006; Mirrakhlmov 1993; Montgomery 1989; Moraga 2007; Muza 2004; Parati 2013; Rock 1987; Rock 1989a; Rock 1989b; Rock 1989c; Sartori 2002; SPACE 2011; Subudhi 2011; Van Patot 2008; Wang 2013; Wright 1983; Wright 2004).
The remaining studies reported at least one adverse event related to the assessed intervention.
Other potential sources of bias
We found a possibility of industry bias in 29 studies, mainly related to the unclear role of the sponsors in the development of the study and the unknown effect of the first phase on cross‐over trials in final results (Anonymous 1981; Basu 2002b; Bernhard 1994; Bradwell 1986; Burtscher 1998; Burtscher 2001; Fischer 2000a; Fischer 2000b; Fischer 2004; Fulco 2006; Greene 1981; HEAT 2010; Johnson 1984; Küpper 2008; Larson 1982a; Larson 1982b; Luks 2007; Mirrakhlmov 1993; Montgomery 1989; Muza 2004; PACE 2006; PHAIT 2004; Rock 1987; Rock 1989a; Rock 1989b; Rock 1989c; Subudhi 2011; Wright 1983; Wright 2004). We identified no other potential sources of risk in the remaining studies.
Effects of interventions
See: Summary of findings for the main comparison Acetazolamide compared with placebo for preventing high altitude illness; Summary of findings 2 Budesonide compared with placebo for preventing high altitude illness; Summary of findings 3 Dexamethasone compared with placebo for preventing high altitude illness
See summary of findings Table for the main comparison; summary of findings Table 2; summary of findings Table 3.
GROUP 1: Carbonic anhydrase inhibitors
Comparison 1: carbonic anhydrase inhibitors: acetazolamide versus placebo
For this comparison, we included information from 28 parallel studies (2345 participants) (Anonymous 1981; Banderet 1977; Basnyat 2003; Basnyat 2008; Bradwell 1986; Burki 1992; Burtscher 2014; Carlsten 2004; Chow 2005; Ellsworth 1991; Faull 2015; Hackett 1976; HEAT 2010; Hillenbrand 2006; Hochapfel 1986; Hussain 2001; Jain 1986; Ke 2013; Larson 1982a; Mirrakhlmov 1993; Moraga 2007; Parati 2013; PACE 2006; PHAIT 2004; SPACE 2011; Van Patot 2008; Wang 2013; Wright 2004).
All trials were performed in high mountain areas. Many of the studies administered acetazolamide or placebo between three and five days prior to ascent (13 out of 28; 46.4%) with doses of 500 mg/day (13 out of 28 studies, 46.4%; Anonymous 1981; Basnyat 2008; Bradwell 1986; Burki 1992; Chow 2005; Faull 2015; Hackett 1976; Hussain 2001; Moraga 2007; Parati 2013; PHAIT 2004; SPACE 2011; Wright 2004). For the assessment of AMS, the most widely‐used scale was the Lake Louise Score (12 out of 28 studies, 42.8%) with scores of three or more with headache as a definition of AMS (4 out of 28 trials, 14.2%; Basnyat 2008; Carlsten 2004; Hillenbrand 2006; PHAIT 2004). Two studies involved people with a history of AMS, HAPE or HACE (Burtscher 2014; Mirrakhlmov 1993).
Most of the studies reached altitudes of between 3001 to 4000 metres (Bradwell 1986; Burki 1992; Burtscher 2014; Carlsten 2004; Ellsworth 1991; Faull 2015; Jain 1986; Ke 2013; Larson 1982a; Moraga 2007; Wang 2013; Wright 2004). All but four studies included very high altitude exposure (i.e. 3500 to 5500 metres; Hochapfel 1986; Jain 1986; Mirrakhlmov 1993; Wright 2004).
Seven studies did not provide any information about any of the outcomes assessed in this review (Banderet 1977; Burki 1992; Burtscher 2014; Faull 2015; Hochapfel 1986; Jain 1986; Wang 2013). Because Carlsten 2004 and PACE 2006 evaluated two different groups that had been administered doses of acetazolamide, we included this information for the following analyses. Finally, in Carlsten 2004 two different definitions of HAI were provided and we chose information according to the second definition (Lake Louise AMS score of three or more with headache).
In addition, we analysed information from five cross‐over trials (Fischer 2004; Fulco 2006; Greene 1981; Larson 1982b; Subudhi 2011) with a total of 54 participants. Fischer 2004 only reported medians for scores of AMS, precluding the inclusion of this information in the following analysis.
Primary outcome 1: incidence of acute mountain sickness (AMS)
Sixteen parallel studies provided information about this outcome (Basnyat 2003; Basnyat 2008; Carlsten 2004; Chow 2005; Hackett 1976; HEAT 2010; Hillenbrand 2006; Larson 1982a; Mirrakhlmov 1993; Moraga 2007; Parati 2013; PACE 2006; PHAIT 2004; SPACE 2011; Van Patot 2008; Wright 2004), registering a total of 391 events of acute mountain sickness (Incidence of AMS: 16.9%). The risk ratio (RR) for acute mountain sickness, comparing acetazolamide to placebo, was 0.47 (95% confidence interval (CI) 0.39 to 0.56; I2 = 0%; 16 trials, 2301 participants; Analysis 1.1; Figure 4).

Forest plot of comparison: 1 Carbonic anhydrase inhibitors: acetazolamide versus placebo, outcome: 1.1 Incidence of acute mountain sickness.
We downgraded the quality of evidence from high to moderate, due to unclear risks of selection, detection, and performance bias in most of the included studies (See summary of findings Table for the main comparison). In addition, when we considered the dosage of acetazolamide, we found a non‐statistically significant reduction in the risk of HAI in all groups (test for subgroup differences: Chi2 = 4.55, df = 3; P = 0.21; I2 = 34.0%. The RR for 250 to 255 mg is 0.60 (95% CI 0.39 to 0.94; I2 = 14%; 4 trials, 855 participants). The RR for 500 mg is 0.48 (95% CI 0.38 to 0.61; I2= 0%; 8 trials, 1111 participants). The RR for 750 mg is 0.33 (95% CI 0.18 to 0.62; I2 = 0%; 2 trials, 80 participants).The funnel plot did not show data asymmetry related to sample size (Figure 5).

Funnel plot of comparison: 1 Carbonic anhydrase inhibitors: acetazolamide versus placebo, outcome: 1.1 Incidence of acute mountain sickness.
Regarding sensitivity analyses, only one study was at low risk of bias in the three core domains selected in the Methods section (Chow 2005). For our subgroup analyses, only one study includes an extreme altitude exposure (Wright 2004), and another includes people at high risk of HAI (Mirrakhlmov 1993). In addition, two cross‐over studies (Fulco 2006; Larson 1982b) found four events of acute mountain sickness (total incidence of AMS = 16.6%). The odds ratios ranged from 1 to 4.3. The pooled odds ratio for AMS, comparing acetazolamide to placebo, was 2.26 (95% CI 0.54 to 9.40; I2 = 56%), showing no effect of acetazolamide in the onset of HAI, but with considerable heterogeneity.
Secondary outcome 1: incidence of high altitude pulmonary oedema (HAPE)
Seven parallel studies (1138 participants) evaluated the incidence of altitude pulmonary oedema (Basnyat 2003; Basnyat 2008; Burki 1992; Chow 2005; Ke 2013; PHAIT 2004; SPACE 2011), but they did not find any events to report (Analysis 1.2). We downgraded the quality of evidence from high to moderate due to unclear risks of selection, detection, and performance bias (See summary of findings Table for the main comparison).
Secondary outcome 2: incidence of high altitude cerebral oedema (HACE)
Six parallel studies evaluated the incidence of altitude pulmonary oedema (Basnyat 2003; Basnyat 2008; Chow 2005; Ke 2013; PHAIT 2004; SPACE 2011), but only one event was reported (incidence of HACE = 0.08%). The RR for HACE, comparing acetazolamide to placebo, was 0.32 (95% CI 0.01 to 7.48; 6 trials, 1126 participants; Analysis 1.3). We downgraded the quality of evidence from high to moderate due to unclear risks of selection, detection, and performance bias (See summary of findings Table for the main comparison).
Secondary outcome 3: incidence of adverse events
Five parallel studies provide information about paraesthesias (Anonymous 1981; Basnyat 2003; Chow 2005; PACE 2006; PHAIT 2004), for 279 events (incidence of paraesthesia = 35.3%). The RR for paraesthesia, comparing acetazolamide to placebo, was 5.53 (95% CI 2.81 to 10.88; I2 = 60%; 789 participants; Analysis 1.4). This heterogeneity is reduced to 0% when the dosage of acetazolamide is taken into account (RR from 3.09 to 12.63 by dose; Analysis 1.4). We downgraded the quality of evidence from high to low due to unclear risks of selection, performance, and detection bias, as well as inconsistency (See summary of findings Table for the main comparison).
One study (Hillenbrand 2006) evaluated the incidence of side effects in general, including paraesthesia and numbness. Sixty‐eight side effects were reported (incidence of side effects 17%). The risk of side effects, comparing acetazolamide to placebo, was 2.19 (95% CI 1.36 to 3.53) under intention‐to‐treat analysis. However, under per‐protocol analysis, the risk was 2.20 (95% CI 1.55 to 3.12). When the missing subjects were considered as cases of adverse events in both arms, the estimated risk was 1.15 (95% CI 1.08 to 1.23). We downgraded the quality of evidence from high to low due to these high levels of attrition bias (See summary of findings Table for the main comparison). Another study (HEAT 2010) evaluated the incidence of major events, including drug reactions and gastrointestinal bleeding. However, authors found no major events to report. Finally, in Zell 1988 the authors reported the incidence of numbness in fingers, with six events in 32 participants.
One cross‐over study reported the incidence of tingling (Greene 1981; 24 participants). The estimated OR for this adverse event, comparing acetazolamide to placebo, was 1.44 (95% CI 0.78 to 2.68).
Secondary outcome 4: differences in HAI/AMS scores
Six parallel studies provide information about scores for AMS (Carlsten 2004; Chow 2005; Hussain 2001; Hillenbrand 2006; Moraga 2007; Wright 2004). Carlsten 2004 reported the scores for two doses of acetazolamide (250 mg and 500 mg) and compared them to a single common placebo group. To avoid double counting, we have presented the results as dosing subgroups only (Analysis 1.5). Pooling the data for all sets produced a heterogeneous effect estimate (I2 = 80.4%). The standardized mean difference between acetazolamide and placebo was 0.19 for doses of 250 mg/day (95% CI 0.01 to 0.37; I2 = 0%; 434 participants; Analysis 1.5). In contrast, the standardized mean difference between acetazolamide and placebo was ‐0.57 for doses of 500 mg/day, but with considerable heterogeneity (95% CI ‐1.20 to 0.07; I2 = 72%; 92 participants; Analysis 1.5).
In addition, two cross‐over studies reported differences in AMS scores, ranging from 1 to ‐2.7 (Fulco 2006; Subudhi 2011; 52 participants). The mean difference for these scores, comparing acetazolamide to placebo, was ‐1.25 (95% CI ‐4.79 to 2.29), but with considerable heterogeneity (I2 = 78%).
Trial sequential analysis for acetazolamide versus placebo
Trial sequential analysis of oral acetazolamide at any dose versus placebo for prevention of acute mountain sickness is based on the diversity‐adjusted required information size (DARIS) of 2396 participants. We calculated this DARIS based upon a proportion of participants with acute mountain sickness of 23.3% in the control group; a RRR of 20% in the experimental intervention group; an alpha of 5%; a beta of 20%; and a diversity of 0%. The cumulative Z‐curve (blue line) crossed the upper conventional alpha of 5% and the upper trial sequential alpha‐spending monitoring boundaries, showing that we have robust data for significant efficacy (Figure 6). Likewise, trial sequential analysis of oral acetazolamide at 500 mg dose versus placebo for prevention of acute mountain sickness is based on a DARIS of 1759 participants. We calculated this DARIS based upon a proportion of participants with acute mountain sickness of 29.5% in the control group; a RRR of 20% in the experimental intervention group; an alpha of 5%; a beta of 20%; and a diversity of 0%. The cumulative Z‐curve (blue line) crossed the upper conventional alpha of 5% and the upper trial sequential alpha‐spending monitoring boundaries, showing that we have robust data for significant efficacy. Finally, TSA of oral acetazolamide at 250 mg dose versus placebo for prevention of acute mountain sickness is based on a DARIS of 1777 participants. We calculated this DARIS based upon a proportion of participants with acute mountain sickness of 13.1% in the control group; a RRR of 35% in the experimental intervention group; an alpha of 5%; a beta of 20%; and a diversity of 19%. The cumulative Z‐curve (blue line) twice crossed twice the upper conventional alpha of 5%, but it did not cross the upper trial sequential alpha‐spending monitoring boundaries, indicating that new randomized controlled trials are needed. Accordingly, after only 48.1% (855/1777) of the DARIS had been attained, we were able to reject an intervention effect of 35% or larger.

Trial sequential analysis on prevention of acute mountain illness in 16 oral acetazolamide at any dose vs placebo trials
Comparison 2: carbonic anhydrase inhibitors: acetazolamide 250 mg versus acetazolamide 500 mg
For this comparison, we analysed information from one study (Carlsten 2004) with 22 participants. This trial was carried out in the high mountain areas of Nepal, reaching a maximum altitude of 3630 metres.
Primary outcome 1: incidence of acute mountain sickness (AMS)
Carlsten 2004 did not identify any events of acute mountain sickness.
Secondary outcome 1: incidence of high altitude pulmonary oedema (HAPE)
We found no information about this outcome in the included study.
Secondary outcome 2: incidence of high altitude cerebral oedema (HACE)
We found no information about this outcome in the included study.
Secondary outcome 3: incidence of adverse events
We found no information about this outcome in the included study.
Secondary outcome 4: differences in HAI or AMS scores
Carlsten 2004 provided information about differences in AMS scores. The mean difference for these scores, comparing 250 mg/day of acetazolamide versus 500 mg/day of acetazolamide, was 0.76 (95% CI ‐0.16 to 1.68).
Comparison 3: carbonic anhydrase inhibitors: acetazolamide 750 mg versus acetazolamide 250mg
For this comparison, we analysed information from one study (PACE 2006) with 156 participants. This study was carried out in high mountain areas of Nepal, reaching a maximum altitude of 4928 meters.
Primary outcome 1: incidence of acute mountain sickness (AMS)
The authors of PACE 2006 found 15 events of acute mountain sickness (incidence of AMS: 9.61%).The RR for acute mountain sickness, comparing 750 mg/day versus 250 mg/day of acetazolamide, was 0.60 (95% CI 0.22 to 1.61).
Secondary outcome 1: incidence of high altitude pulmonary oedema (HAPE)
We found no information about this outcome in the included study.
Secondary outcome 2: incidence of high altitude cerebral oedema (HACE)
We found no information about this outcome in the included study.
Secondary outcome 3: incidence of adverse events
Authors of PACE 2006 reported information about paraesthesia, finding 117 events (incidence of paraesthesia: 75%). The RR for paraesthesias, comparing 750 mg/day versus 250 mg/day of acetazolamide, was 1.34 (95% CI 1.11 to 1.63).
Secondary outcome 4: differences in HAI/AMS scores
We found no information about this outcome in the included study.
Group 2: Steroids
Comparison 1: steroids: budenoside versus placebo
For this comparison, we analysed the information from two studies (Chen 2015; Zheng 2014) with 132 participants. Researchers administered 200 μg of inhaled budenoside twice daily in both studies. Both studies were carried out in China, reaching a maximum altitude of between 3700 to 3900 metres.
Primary outcome 1: incidence of acute mountain sickness (AMS)
Both studies provide information about the incidence of acute mountain sickness and found 45 events (incidence of AMS = 34%). The RR for AMS, comparing budenoside to placebo, was 0.37 (95% CI 0.23 to 0.61; I2 = 0%; Analysis 2.1). We downgraded the quality of evidence from high to low, due to a high risk of performance bias, as well as imprecision issues (See summary of findings Table 2).
Secondary outcome 1: incidence of high altitude pulmonary oedema (HAPE)
We found no information about this outcome in the included studies.
Secondary outcome 2: incidence of high altitude cerebral oedema (HACE)
We found no information about this outcome in the included studies.
Secondary outcome 3: incidence of adverse events
Chen 2015 assessed the incidence of side effects in general in all participants and did not find any events. We downgraded the quality of evidence from high to very low, due to a high risk of performance bias, as well as imprecision issues (See summary of findings Table 2). Likewise, Zheng 2014 evaluated the onset of persistent belching but did not find any affected participants. We downgraded the quality of evidence from high to low, due to imprecision issues (See summary of findings Table 2).
Secondary outcome 4: differences in HAI/AMS scores
We found no information about this outcome in the included studies.
Comparison 2: steroids: dexamethasone versus placebo
For this comparison, we analysed the information from six studies in high mountain areas (Bernhard 1994; Hackett 1988; Hussain 2001; Montgomery 1989; Rock 1987; Zell 1988), with a total of 205 participants. Two studies were carried out in the USA (Hackett 1988; Montgomery 1989), two in Nepal (Rock 1987; Zell 1988), and one each in Pakistan (Hussain 2001) and Bolivia (Bernhard 1994). Hussain 2001 and Montgomery 1989 included only men. All studies used scales other than the Lake Louise Score. Bernhard 1994 included 40% of participants with previous AMS, and the altitude reached was classified as extreme (more than 5000 metres). Two studies administered 16 mg of dexamethasone (Montgomery 1989; Rock 1987), and most studies administered it during one to two days (Montgomery 1989; Rock 1987; Zell 1988).
Montgomery 1989 included the use of dexamethasone versus placebo at two different altitudes in two separate participant groups and the data for each has been presented separately (Montgomery 1989 (2,700m) and Montgomery 1989 (2,050m)).Bernhard 1994 provided two definitions for AMS, but only one (modified Environmental Symptoms Questionnaire (ESQ) = 3 cerebral symptoms, one with intensity ≥ 2) provided information for further analyses. Data from Bernhard 1994, Hackett 1988 and Hussain 2001 about AMS scores were provided as medians and standard errors, which needed transformation for the corresponding analyses (See Appendix 10).
We also analysed information from five cross‐over studies (Johnson 1984; Rock 1989a; Rock 1989b; Rock 1989c; Subudhi 2011) with a total of 53 participants. The Rock 1989 study provided information for three different doses of dexamethasone, and we extracted and analysed the data separately (Rock 1989a; Rock 1989b; Rock 1989c).
Primary outcome 1: incidence of acute mountain sickness (AMS)
Four parallel studies provided information about the incidence of acute mountain sickness (Bernhard 1994; Hackett 1988; Montgomery 1989; Rock 1987), and found a total of 60 events (incidence of AMS = 34.09%). The RR for AMS, comparing dexamethasone versus placebo, was 0.60 (95% CI 0.36 to 1.00; I2 = 39%; 176 participants; Analysis 3.1). We downgraded the quality of evidence from high to low, due to unclear risks of selection, performance, and detection bias, as well as imprecision issues (See summary of findings Table 3). We found no numerical information about this outcome in the included cross‐over studies. In Subudhi 2011 the authors reported six instances of AMS, but with no information on the number in each group.
Regarding sensitivity analyses, none of the studies included in this comparison present low risk of bias in all the three domains previously selected. Bernhard 1994 was the only study carried out at extreme altitude, and including a high‐risk population. Excluding this study from these analyses modified the pooled RR from 0.60 to 0.58, but increased the heterogeneity from 39% to 56%.
Secondary outcome 1: incidence of high altitude pulmonary oedema (HAPE)
We found no information about this outcome in the included studies.
Secondary outcome 2: incidence of high altitude cerebral oedema (HACE)
We found no information about this outcome in the included studies.
Secondary outcome 3: incidence of adverse events
Bernhard 1994 assessed the incidence of adverse events in general, but found no events to report. Likewise, Zell 1988 evaluated the onset of numbness in participants, but they too found no cases to report. We downgraded the quality of evidence from high to very low, due to unclear risks of selection, performance and detection bias, as well as imprecision issues (See summary of findings Table 3). From the cross‐over studies, Johnson 1984 found one event of dyspepsia for this comparison (total incidence of dyspepsia = 6.25%). The RR for dyspepsia, comparing dexamethasone to placebo was 1.36 (95% CI 0.40 to 4.60).
Secondary outcome 4: differences in HAI/AMS scores
Three parallel studies provide information about AMS scores (Bernhard 1994; Hackett 1988; Hussain 2001). The standardized mean difference for these scores, comparing dexamethasone to placebo, was ‐0.46 (95% CI ‐1.21 to 0.29; I2 = 38%; 50 participants; Analysis 3.2). We downgraded the quality of evidence from high to very low, due to unclear risks of selection, performance and detection bias, as well as imprecision issues (See summary of findings Table 3). Five cross‐over studies reported information about this outcome (Johnson 1984; Rock 1989a; Rock 1989b; Rock 1989c; Subudhi 2011). Mean differences ranged from ‐2.7 to 0.82 units. The MD for AMS scores, comparing dexamethasone to placebo, was ‐0.63 (95% CI ‐1.7 to 0.44), but with extreme heterogeneity (I2 = 99%).
Trial sequential analysis for dexamethasone versus placebo
Trial sequential analysis of dexamethazone versus placebo for prevention of acute mountain sickness is based on the diversity‐adjusted required information size (DARIS) of 517 participants. We calculated this DARIS based upon a proportion of participants with acute mountain illness of 44.9% in the control group; a RRR of 35% in the experimental intervention group; an alpha of 5%; a beta of 20%; and a diversity of 43%. After the fifth trial, the cumulative Z‐curve (blue line) crossed the upper conventional alpha of 5%, but it did not cross the upper trial sequential alpha‐spending monitoring boundaries. Accordingly, after only 34% (176/517) of the DARIS had been attained, we were able to reject an intervention effect of 35% or larger, indicating that new randomized controlled trials are needed.
Comparison 3: steroids: prednisolone versus placebo
For this comparison, we analysed the information from one study (Basu 2002b) with 40 participants. However, this study did not provide information about any of the outcomes selected for this review.
Group 3: Brochodilators
Comparison 1: bronchodilator drugs: salmeterol versus placebo
For this comparison, we analysed the information from one study (Sartori 2002) with 37 participants. Researchers administered 125 mg of inhaled salmeterol twice daily. This study was carried out in Nepal, reaching a maximum altitude of 4559 metres; all participants were susceptible to HAPE.
Primary outcome 1: incidence of acute mountain sickness (AMS)
We found no information about this outcome in the included study.
Secondary outcome 1: incidence of high altitude pulmonary oedema (HAPE)
Sartori 2002 provided information about the incidence of high‐altitude pulmonary oedema, with 20 events (incidence of HAPE = 54.05%). The RR for HAPE, comparing salmeterol to placebo, was 0.45 (95% CI 0.22 to 0.92; 37 participants).
Secondary outcome 2: incidence of high altitude cerebral oedema (HACE)
We found no information about this outcome in the included study.
Secondary outcome 3: incidence of adverse events
We found no information about this outcome in the included study.
Secondary outcome 4: differences in HAI/AMS scores
Sartori 2002 provided information about AMS scores. The mean difference for these scores, comparing salmeterol to placebo, was ‐5.70 (95% CI ‐8.50 to ‐2.90; 37 participants).
Comparison 2: bronchodilators drugs: theophyline versus placebo
For this comparison, we identified two parallel studies with at least 20 participants (Fischer 2000a; Küpper 2008). The number of participants in Fischer 2000a was unclear, and this precludes the use of this study in further analyses. In addition, we analysed information from two cross‐over studies (Fischer 2000b; Fischer 2004) with a total of 24 participants. However, in Fischer 2004 the authors only provided information for AMS scores as medians, precluding the inclusion of this information in further analyses.
Primary outcome 1: incidence of acute mountain sickness (AMS)
Only Küpper 2008 provided information about the incidence of acute mountain sickness, with 12 events (incidence of AMS = 60%). The RR for AMS, comparing theophyline to placebo, was 0.71 (95% CI 0.34 to 1.50; 20 male participants).
Secondary outcome 1: incidence of high altitude pulmonary oedema (HAPE)
We found no information about this outcome in the included studies.
Secondary outcome 2: incidence of high altitude cerebral oedema (HACE)
We found no information about this outcome in the included studies.
Secondary outcome 3: incidence of adverse events
We found no information about this outcome in the included studies.
Secondary outcome 4: differences in HAI/AMS scores
Only Küpper 2008 provided information about AMS scores for the parallel studies. The standardized mean difference for these scores, comparing theophyline to placebo, was ‐0.18 (95% CI ‐1.38 to 1.02; 20 participants). Of the cross‐over studies, only Fischer 2000b reported information about scores for AMS.The mean difference between theophyline and placebo was ‐1.50 (95% CI ‐2.25 to ‐0.75).
Comparison 3: bronchodilator drugs: montelukast versus placebo
For this comparison, we analysed information from two cross‐over studies (Luks 2007; Muza 2004) with a total of 22 participants. Muza 2004 provided two definitions of AMS (Lake Louise Scale ≥ 3 and ESQ AMS‐C Score ≥ 0.7) and we selected the first one to include in analyses.
Primary outcome 1: incidence of acute mountain sickness (AMS)
Muza 2004 found 14 events of acute mountain sickness (incidence of AMS = 58.3%). The odds ratio for AMS, comparing acetazolamide to placebo, was 1.47 (95% CI 0.61 to 3.55; 22 participants).
Secondary outcome 1: incidence of high altitude pulmonary oedema (HAPE)
We found no information about this outcome in the included studies.
Secondary outcome 2: incidence of high altitude cerebral oedema (HACE)
We found no information about this outcome in the included studies.
Secondary outcome 3: incidence of adverse events
We found no information about this outcome in the included studies.
Secondary outcome 4: differences in HAI/AMS scores
Both studies reported information about scores for AMS. Mean differences between montelukast and placebo ranged between 1.1 and ‐1.4. The mean difference between montelukast and placebo was ‐0.08 (95% CI ‐2.53 to 2.36; I2 = 81%) but with considerable heterogeneity.
Group 4: Selective inhibitors of phosphodiesterase‐5
Comparison 1: selective inhibitors of phosphodiesterase‐5: tadalafil versus placebo
For this comparison, we analysed the information from one study (Maggiorini 2006) with 19 participants. The dosage of tadalafil used was 20 mg/day. This study was carried out in Kenya, reaching a maximum altitude of 4559 metres. All participants had a history of HAPE.
Primary outcome 1: incidence of acute mountain sickness (AMS)
Maggiorini 2006 provided information about the incidence of acute mountain sickness, with 16 events (incidence of AMS = 84.2%). The RR for AMS, comparing tadalafil to placebo, was 0.90 (95% CI 0.61 to 1.32; 29 participants).
Secondary outcome 1: incidence of high altitude pulmonary oedema (HAPE)
Maggiorini 2006 provided information about the incidence of altitude pulmonary oedema, with eight events (incidence of HAPE = 42.1%). The RR for HAPE, comparing tadalafil to placebo, was 0.13 (95% CI 0.02 to 0.85; 29 participants).
Secondary outcome 2: incidence of high altitude cerebral oedema (HACE)
We found no information about this outcome in the included study.
Secondary outcome 3: incidence of adverse events
We found no information about this outcome in the included study.
Secondary outcome 4: differences in HAI/AMS scores
We found no information about this outcome in the included study.
Comparison 2: selective inhibitors of phosphodiesterase‐5: sildenafil citrate versus placebo
For this comparison, we analysed the information from one study (Bates 2011) with 62 participants. The dosage of sildenafil citrate used was 150 mg/day. This study was carried out in Chile, reaching a maximum altitude of 5200 metres. Data about AMS scores were provided as medians and interquartile ranges, and we transformed them for further analyses (See Appendix 10).
Primary outcome 1: incidence of acute mountain sickness (AMS)
Bates 2011 provided information about the incidence of acute mountain sickness, with 39 events (incidence of AMS = 62.9%). The RR for AMS, comparing sildenafil citrate to placebo, was 1.31 (95% CI 0.91 to 1.89; 62 participants).
Secondary outcome 1 risk of altitude pulmonary oedema
We found no information about this outcome in the included study.
Secondary outcome 2: incidence of high altitude cerebral oedema (HACE)
We found no information about this outcome in the included study.
Secondary outcome 3: incidence of adverse events
We found no information about this outcome in the included study.
Secondary outcome 4: differences in HAI/AMS scores
Bates 2011 provided information about AMS scores. The standardized mean difference for these scores, comparing sildenafil to placebo, was ‐2.41 (95% CI ‐3.95 to ‐0.87; 62 participants).
Group 5: Calcium channel modulators
Comparison 1: calcium channel modulators: nifedipine versus placebo
For this comparison, we analysed the information from two studies (Bartsch 1991; Hohenhaus 1994) with a total of 48 participants. Both studies used 60 mg/day of nifedipine. Bartsch 1991 was carried out in Nepal, reaching a maximum altitude of 4559 metres, while Hohenhaus 1994 was carried out in Italy and reached the same maximum altitude. All of the participants in Bartsch 1991 had a history of HAPE, and most of the participants in Hohenhaus 1994 had susceptibility to AMS.
Primary outcome 1: incidence of acute mountain sickness (AMS)
Hohenhaus 1994 provided information about the incidence of acute mountain sickness, with 17 events (incidence of AMS = 62.9%). The RR for AMS, comparing nifedipine to placebo, was 1.04 (95% CI 0.58 to 1.87; 27 participants).
Secondary outcome 1: incidence of high altitude pulmonary oedema (HAPE)
Bartsch 1991 provided information about the incidence of high altitude pulmonary oedema, with eight events (incidence of HAPE = 38.09%). The RR for HAPE, comparing nifedipine to placebo, was 0.16 (95% CI 0.02 to 1.06; 21 participants).
Secondary outcome 2: incidence of high altitude cerebral oedema (HACE)
We found no information about this outcome in the included studies.
Secondary outcome 3: incidence of adverse events
We found no information about this outcome in the included studies.
Secondary outcome 4: differences in HAI/AMS scores
Both included studies provided information about AMS scores (Bartsch 1991; Hohenhaus 1994). Mean differences ranged from ‐1.25 to 0.07. The standardized mean difference for these scores, comparing nifedipine to placebo, was ‐0.56, (95% CI ‐1.85 to 0.74; I2 = 78%; 48 participants; Analysis 4.1), but with considerable heterogeneity.
Comparison 2: calcium channel modulators: flunarizine versus placebo
For this comparison, we analysed the information from one study (Baumgartner 2003) with 20 participants. Baumgartner 2003 used a hypobaric chamber to assess the effectiveness of 10 mg of flunarizine at 4559 metres.
Primary outcome 1: incidence of acute mountain sickness (AMS)
Baumgartner 2003 provided information about the incidence of acute mountain sickness and found 14 events (incidence of AMS = 70%). The RR for AMS, comparing flunarizine to placebo, was 1.00 (95% CI 0.56 to 1.78; 20 participants).
Secondary outcome 1: incidence of high altitude pulmonary oedema (HAPE)
We found no information about this outcome in the included study.
Secondary outcome 2: incidence of high altitude cerebral oedema (HACE)
We found no information about this outcome in the included study.
Secondary outcome 3: incidence of adverse events
We found no information about this outcome in the included study.
Secondary outcome 4: differences in HAI/AMS scores
We found no information about this outcome in the included study.
Group 6: non‐steroidal anti‐inflammatory drugs (NSAIDs)
Comparison 1: non‐steroidal anti‐inflammatory drugs (NSAIDs) and other analgesics: aspirin versus placebo
For this comparison, we analysed the information from two studies (Burtscher 1998; Burtscher 2001) with a total of 60 participants. Both studies focused on headache at altitude, using a headache score to evaluate its onset. Aspirin 320 mg was used as a prophylaxis, given from one to two hours beforehand; both studies reached a maximum altitude of 2880 metres.
Primary outcome 1: incidence of acute mountain sickness (AMS)
Both studies provided information about the incidence of acute mountain sickness (Burtscher 1998; Burtscher 2001), and found a total of 31 events (incidence of AMS = 51.6%). RRs ranged from 0.13 to 0.60. The RR for AMS, comparing aspirin to placebo, was 0.35 (95% CI 0.06 to 1.95; I2 = 68%; 60 participants; Analysis 5.1), but with considerable heterogeneity.
Secondary outcome 1: incidence of high altitude pulmonary oedema (HAPE)
We found no information about this outcome in the included studies.
Secondary outcome 2: incidence of high altitude cerebral oedema (HACE)
We found no information about this outcome in the included studies.
Secondary outcome 3: incidence of adverse events
Burtscher 2001 assessed the incidence of major adverse events in general, but did not find any events to report.
Secondary outcome 4: differences in HAI/AMS scores
We found no information about this outcome in the included studies.
Comparison 2: non‐steroidal anti‐inflammatory drugs (NSAIDs) and other analgesics: ibuprofen versus placebo
For this comparison, we analysed the information from three studies (ASCENT 2012; HEAT 2010; Lipman 2012), with a total of 598 participants. Only ASCENT 2012 and Lipman 2012 provided a clear definition to determine the onset of AMS (Lake Louise AMS score ≥ 3 with headache). Ibuprofen dosage ranged from 600 to 1800 mg. ASCENT 2012 and HEAT 2010 were developed in Nepal, reaching a maximum altitude of 4928 metres, while Lipman 2012 was developed in the USA, reaching a maximum altitude of 3810 metres. None of these studies included high‐risk populations.
Primary outcome 1: incidence of acute mountain sickness (AMS)
Three studies provided information about the incidence of acute mountain sickness (ASCENT 2012; HEAT 2010; Lipman 2012), and found a total of 154 events (incidence of AMS = 25.7%). The RR for AMS, comparing ibuprofen to placebo, was 0.64 (95% CI 0.49 to 0.82; I2 = 0%; 598 participants; Analysis 6.1). Regarding sensitivity analyses, none of the included studies in this comparison were at low risk of bias in the three previously selected domains. Likewise, all three studies were developed at very high altitude and none of them included a population at high risk of developing HAI/AMS.
Secondary outcome 1: incidence of high altitude pulmonary oedema (HAPE)
ASCENT 2012 evaluated the incidence of altitude pulmonary oedema, but did not find any events to report.
Secondary outcome 2: incidence of high altitude cerebral oedema (HACE)
ASCENT 2012 evaluated the incidence of altitude cerebral oedema, but did not find any events to report.
Secondary outcome 3: incidence of adverse events
HEAT 2010 assessed the incidence of major adverse events in general, but did not find any events to report. The authors of ASCENT 2012 reported one event of black stools in the ibuprofen group.
Secondary outcome 4: differences in HAI/AMS scores
We found no information about this outcome in the included studies.
Trial sequential analysis for ibuprofen versus placebo
Trial sequential analysis of oral ibuprofen at any dose versus placebo for prevention of acute mountain sickness is based on a DARIS of 1532 participants. We calculated this DARIS based on a proportion of participants with acute mountain sickness of 32.6% in the control group; a RRR of 20% in the experimental intervention group; an alpha of 5%; a beta of 20%; and a diversity of 0%. After the second trial, the cumulative Z‐curve (blue line) crossed the upper conventional alpha of 5%, but it did not cross the upper trial sequential alpha‐spending monitoring boundaries, which were reached rather than crossed by the third trial. After only 39% (598/1532) of the DARIS had been reached, we were able to reject an intervention effect of 20% or larger, indicating that new randomized controlled trials are needed.
Comparison 3: non‐steroidal anti‐inflammatory drugs (NSAIDs) and other analgesics: carbasalate versus placebo
For this comparison, we analysed the information from one study (Kayser 2008) with 31 participants. Kayser 2008 defined AMS in three different ways (Lake Louise AMS score ≥ 3 with headache; Lake Louise AMS score with headache and self‐score + functional score ≥ 4; and Lake Louise AMS score with headache and self‐score + functional score + clinical score ≥ 4). We chose the first definition for the following analyses.
Primary outcome 1: incidence of acute mountain sickness (AMS)
Kayser 2008 provided information about the incidence of acute mountain sickness and found a total of 26 events (incidence of AMS = 83.8%). The RR for AMS, comparing carbasalate to placebo, was 0.91 (95% CI 0.67 to 1.25; 31 participants).
Secondary outcome 1: incidence of high altitude pulmonary oedema (HAPE)
We found no information about this outcome in the included study.
Secondary outcome 2: incidence of high altitude cerebral oedema (HACE)
We found no information about this outcome in the included study.
Secondary outcome 3: incidence of adverse events
We found no information about this outcome in the included study.
Secondary outcome 4: differences in HAI/AMS scores
We found no information about this outcome in the included study.
Group 7: Other comparisons
Comparison 1: other comparisons: acetazolamide versus dexamethasone
For this comparison, we included information from three studies (Ellsworth 1991; Hussain 2001; Zell 1988), with a total of 46 participants. In Ellsworth 1991, investigators administered 750 mg/day of acetazolamide. The study was carried out in the USA, reaching a maximum altitude of 4392 metres. Zell 1988 and Hussain 2001 used 500 mg/day of acetazolamide. Zell 1988 was carried out in Nepal, reaching a maximum altitude of 4050 metres. We also included information from a cross‐over study (Subudhi 2011), which compared acetazolamide 750 mg/day to 12 mg dexamethasone using a hypobaric chamber.
Primary outcome 1: incidence of acute mountain sickness (AMS)
We found no information about this outcome in the included studies.
Secondary outcome 1: incidence of high altitude pulmonary oedema (HAPE)
We found no information about this outcome in the included studies.
Secondary outcome 2: incidence of high altitude cerebral oedema (HACE)
We found no information about this outcome in the included studies.
Secondary outcome 3: incidence of adverse events
Zell 1988 reported information about numbness in the fingers, finding six events (Incidence of numbness: 37.5%). The RR for numbness, comparing acetazolamide to dexamethasone, was 16.25 (95% CI 1.07 to 247.19; 16 participants).
Secondary outcome 4: differences in HAI/AMS scores
Hussain 2001 provided information about differences in AMS scores at high altitude. The standardized mean difference for AMS scores, comparing acetazolamide to dexamethasone, was 0.292 (95% CI 0.06 to 0.52; 12 participants). We also found information about this outcome in Subudhi 2011. The standardized mean difference for AMS scores, comparing acetazolamide to dexamethasone, was 0.00 (95% CI ‐0.23 to 0.23; 40 participants).
Comparison 2: other comparisons: acetazolamide plus dexamethasone versus acetazolamide
For this comparison, we analysed information from three studies (Bernhard 1998; Hussain 2001; Zell 1988), with a total of 40 participants. Bernhard 1998 used 500 mg of acetazolamide/day plus 8 mg of dexamethasone/day. Forty per cent of the participants in this study had a history of previous mild or moderate AMS. This study was carried out in Italy, reaching a maximum altitude of 5334 metres. Hussain 2001 and Zell 1988 used 500 mg of acetazolamide/day plus 8 mg and 16 mg of dexamethasone/day respectively; there were no groups at risk of AMS, HAPE or HACE. Zell 1988 was carried out in Nepal, reaching a maximum altitude of 4050 metres.
Primary outcome 1: incidence of acute mountain sickness (AMS)
Bernhard 1998 found eight events of acute mountain sickness (incidence of AMS: 61.5%).The RR for acute mountain sickness, comparing acetazolamide plus dexamethasone to acetazolamide plus placebo, was 0.70 (95% CI 0.28 to 1.77; 13 participants).
Secondary outcome 1: incidence of high altitude pulmonary oedema (HAPE)
We found no information about this outcome in the included studies.
Secondary outcome 2: incidence of high altitude cerebral oedema (HACE)
We found no information about this outcome in the included studies.
Secondary outcome 3: incidence of adverse events
Zell 1988 reported information about numbness in the fingers, finding 11 events (incidence of numbness: 73.3%). The RR for numbness, comparing acetazolamide plus dexamethasone to acetazolamide, was 0.73 (95% CI 0.39 to 1.35; 15 participants).
Secondary outcome 4: differences in HAI/AMS scores
Hussain 2001 provided information about differences in AMS scores at high altitude. The mean difference for AMS scores, comparing acetazolamide to dexamethasone was ‐11.47 (95% CI ‐17.63 to ‐5.31; 12 participants).
Comparison 3: other comparisons: acetazolamide plus dexamethasone versus dexamethasone
For this comparison, we included information from two studies (Hussain 2001; Zell 1988), with a total of 29 participants. In Zell 1988 500 mg of acetazolamide/day plus 16 mg of dexamethasone/day were used. This study was carried out in Nepal, reaching a maximum altitude of 4050 metres.
Primary outcome 1: incidence of acute mountain sickness (AMS)
We found no information about this outcome in the included studies.
Secondary outcome 1: incidence of high altitude pulmonary oedema (HAPE)
We found no information about this outcome in the included studies.
Secondary outcome 2: incidence of high altitude cerebral oedema (HACE)
We found no information about this outcome in the included studies.
Secondary outcome 3: Incidence of adverse events
Zell 1988 reported information about numbness in fingers, finding five events (Incidence of numbness: 29.4%). The RR for numbness, comparing acetazolamide plus dexamethasone to dexamethasone was 12.22 (95% CI 0.78 to 191.46; 17 participants).
Secondary outcome 4: differences in HAI/AMS scores
Hussain 2001 provided information about differences in AMS scores at high altitude. The mean difference for AMS scores, comparing acetazolamide plus dexamethasone to dexamethasone was ‐9.17 (95% CI ‐15.62 to ‐2.72; 12 participants).
Comparison 4: other comparisons: acetazolamide versus ibuprofen
For this comparison, we analysed information from one study (HEAT 2010) with 254 participants. HEAT 2010 administered 225 mg of acetazolamide/day or 600 mg of ibuprofen/day.
Primary outcome 1: risk of acute mountain sickness
HEAT 2010 found 32 events of acute mountain sickness (incidence of AMS: 12.59%). The RR for AMS, comparing acetazolamide to ibuprofen, was 1.33 (95% CI 0.69 to 2.55; 163 participants).
Secondary outcome 1: risk of altitude pulmonary oedema.
We found no information about this outcome in the included study.
Secondary outcome 2: risk of high altitude cerebral oedema
We found no information about this outcome in the included study.
Secondary outcome 3: adverse events
HEAT 2010 did not identify any major adverse events.
Secondary outcome 4: differences in HAI/AMS scores
We found no information about this outcome in the included study.
Comparison 5: other comparisons: acetazolamide versus methazolamide
For this comparison, we analysed information from one study (Wright 1983) with 20 participants. Wright 1983 used 500 mg of acetazolamide/day and 100/150 mg of methazolamide/day. This study was carried out in high mountain areas of Nepal, reaching a maximum altitude of 4790 metres. Some participants in this study had a previous history of severe AMS.
Primary outcome 1: incidence of acute mountain sickness (AMS)
We found no information about this outcome in the included study.
Secondary outcome 1: incidence of high altitude pulmonary oedema (HAPE)
We found no information about this outcome in the included study.
Secondary outcome 2: incidence of high altitude cerebral oedema (HACE)
We found no information about this outcome in the included study.
Secondary outcome 3: incidence of adverse events
We found no information about this outcome in the included study.
Secondary outcome 4: differences in HAI/AMS scores
Wright 1983 reported information about AMS scores.The standardized mean difference between acetazolamide and methazolamide, was ‐3.00 (95% CI ‐21.07 to 15.07; 20 participants).
Comparison 6:other comparisons: budenoside plus formoterol versus placebo
For this comparison, we analysed the information from one study (Chen 2015) with 40 participants in the relevant arms. This study was carried out in China, reaching a maximum altitude of 3700 metres.
Primary outcome 1: incidence of acute mountain sickness (AMS)
Chen 2015 provide information about the incidence of acute mountain sickness and found 24 events (incidence of AMS = 60%). The RR for AMS, comparing budenoside plus formoterol to placebo, was 0.71 (95% CI 0.42 to 1.21; 40 participants).
Secondary outcome 1: incidence of high altitude pulmonary oedema (HAPE)
We found no information about this outcome in the included study.
Secondary outcome 2: incidence of high altitude cerebral oedema (HACE)
We found no information about this outcome in the included study.
Secondary outcome 3: incidence of adverse events
Chen 2015 assessed the incidence of side effects but found no events.
Secondary outcome 4: differences in HAI/AMS scores
We found no information about this outcome in the included study.
Comparison 7: other comparisons: budenoside versus dexamethasone
For this comparison, we analysed information from one study (Zheng 2014) with 92 participants. Zheng 2014 used 400 mg of budenoside/day and 4 mg of dexamethasone/day. This study was carried out in China, reaching a maximum altitude of 4050 metres.
Primary outcome 1: incidence of acute mountain sickness (AMS)
Zheng 2014 found 22 events of acute mountain sickness for this comparison (incidence of AMS = 23.9%). The RR for AMS, comparing budenoside to dexamethasone, was 0.83 (95% CI 0.40 to 1.73; 92 participants).
Secondary outcome 1: incidence of high altitude pulmonary oedema (HAPE)
We found no information about this outcome in the included study
Secondary outcome 2: incidence of high altitude cerebral oedema (HACE)
We found no information about this outcome in the included study.
Secondary outcome 3: incidence of adverse events
Zheng 2014 found four events of persistent belching for this comparison (incidence of persistent blenching = 4.34%). The RR for persistent blenching, comparing budenoside to dexamethasone, was 0.11 (95% CI 0.01 to 2.01; 92 participants).
Secondary outcome 4: differences in HAI/AMS scores
We found no information about this outcome in the included study
Comparison 8: other comparisons: budenoside versus budenoside plus formoterol
For this comparison, we analysed information from one study (Chen 2015) with 40 participants in the relevant arms. This study used 400 mg of budenoside/day and 9 mg of formoterol/day. It was carried out in China, reaching a maximum altitude of 3700 metres.
Primary outcome 1: incidence of acute mountain sickness (AMS)
Chen 2015 found 15 events of acute mountain sickness for this comparison (total incidence of AMS = 37.5%). The RR for AMS, comparing budenoside to budenoside plus formoterol, was 0.50 (95% CI 0.21 to 1.20; 40 participants).
Secondary outcome 1: incidence of high altitude pulmonary oedema (HAPE)
We found no information about this outcome in the included study.
Secondary outcome 2: incidence of high altitude cerebral oedema (HACE)
We found no information about this outcome in the included study.
Secondary outcome 3: incidence of adverse events
Chen 2015 did not find any side effects for this comparison.
Secondary outcome 4: differences in HAI/AMS scores
We found no information about this outcome in the included study.
Comparison 9: other comparisons: dexamethasone versus prednisolone
For this comparison, we analysed the information from one study (Basu 2002a) with 40 participants. However, this study did not provide information about any of outcomes selected for this review.
Comparison 10: other comparisons: tadalafil versus dexamethasone
For this comparison, we analysed information from one study (Maggiorini 2006) with 20 participants. Maggiorini 2006 used 20 mg of tadalafil/day and 16 mg of dexamethasone/day. This study was carried out in Kenya, reaching a maximum altitude of 4559 metres. All participants had a history of HAPE.
Primary outcome 1: incidence of Acute mountain sickness (AMS)
Maggiorini 2006 found 11 events of acute mountain sickness for this comparison (incidence of AMS = 55%). The RR for AMS, comparing tadalafil to dexamethasone, was 2.67 (95% CI 0.98 to 7.22; 20 participants).
Secondary outcome 1: incidence of high altitude pulmonary oedema (HAPE)
Maggiorini 2006 found one event of altitude pulmonary oedema for this comparison (incidence of AMS = 5%). The RR for HAPE, comparing tadalafil to dexamethasone, was 3.0 (95% CI 0.14 to 65.9; 20 participants).
Secondary outcome 2: incidence of high altitude cerebral oedema (HACE)
We found no information about this outcome in the included study.
Secondary outcome 3: incidence of adverse events
We found no information about this outcome in the included study
Secondary outcome 4: differences in HAI/AMS scores
We found no information about this outcome in the included study
Discussion
Summary of main results
Evidence from 65 studies showed important findings for interventions included in this review (commonly‐used pharmacological interventions). We report results for the three more important comparisons:
Acetazolamide versus placebo (28 parallel studies; 2345 participants)
Our systematic review included data from 28 parallel clinical studies (n = 2345 participants) and five cross‐over studies (n= 54 participants) that assessed the effectiveness of acetazolamide compared with a placebo for the prevention of high altitude illness. The risk of AMS was reduced with acetazolamide (RR 0.47; 95% CI 0.39 to 0.56; I2 = 0%; 16 trials; 2301 participants; moderate quality of evidence). No events of HAPE were reported and only one event of HACE (RR 0.32; 95% CI 0.01 to 7.48; 6 parallel trials; 1126 participants; moderate quality of evidence). Few studies reported side effects for this comparison, and they showed an increase in the risk of paraesthesia with the intake of acetazolamide (5 studies, 789 participants; RR from 3.09 to 12.63 by acetazolamide dosage).
Budenoside versus placebo (2 parallel studies; 132 participants)
Data on budenoside showed a reduction in the incidence of AMS compared with placebo (2 studies, 132 participants; RR 0.37; 95% CI 0.23 to 0.61; I2 = 0%; low quality of evidence). The included studies did not report any events of HAPE or HACE, and they did not find side effects (low quality of the evidence).
Dexamethasone versus placebo (7 parallel studies; 205 participants)
For dexamethasone, data did not show benefits of dexamethasone at any dosage (four studies, 176 participants; RR 0.60; 95% CI 0.36 to 1.00; I2 = 39%; low quality of evidence). The studies did not report any events of HAPE or HACE, and we rated the evidence about adverse events as of very low quality.
We did not find any studies comparing methazolamide with a placebo. We also did not find evidence of benefits of theophyline, montelukast, selective inhibitors of phosphodiesterase‐5 (such as tadalafil and sildenafil), nifedipine, flunarizine, aspirin or carbasalate in reducing the incidence of AMS. Finally, we found little information on other comparisons between different agents included in this review (i.e. ibuprofen versus placebo, acetazolamide versus dexamethasone). Combinations of these drugs did not deliver any benefits.
Overall completeness and applicability of evidence
We carried out a thorough search and identified an important number of studies addressing effectiveness and safety in the most commonly‐used pharmacological interventions for the prevention of HAI or AMS. We included 65 studies in our review, with more than 2000 participants. Those studies addressed around 15 comparisons with placebos, and 11 comparisons between different drugs. The data included participants of different age groups and both genders, as well as different high‐altitude settings, different final altitudes reached, transportation, and prophylaxis times. Our systematic search for studies and our data extraction procedures should have minimized the likelihood of missing relevant studies. The funnel plot for acetazolamide versus placebo was highly symmetrical, suggesting that the chance of having missed relevant studies was minimal, with no evidence of publication bias. Despite all this, we found a lack of reports of the duration of prophylaxis, duration of ascent, criteria to diagnose AMS, HAPE or HACE, or statistical data (such as standard deviations) in several of the included studies. The sparsity of reports of adverse events was the most frequent limitation of the included studies, as well as the wide range of criteria and scales used to determine the onset of acute mountain sickness. The identification of only one study for several of the comparisons was a common factor limiting the scope and strength of this review.
The trial sequence analyses performed with on acetazolamide for the prevention of AMS suggest we have robust data for significant efficacy, which can be applied with some confidence in the field.
Quality of the evidence
We conducted GRADE assessments on outcomes of meta‐analyses and single trials. We were unable to rate the evidence from either pooled or non‐pooled estimates as high, due to either or both of the following reasons:
-
small sample sizes
-
the risk of bias from multiple sources, including the lack of adequate randomization methods, lack of blinding, high attrition, unclear reporting of outcomes, and bias in the presentation of data, among others.
We also downgraded the evidence because of uncertainty in clinically relevant outcomes, reflected in wide confidence intervals, i.e. imprecision. See summary of findings Table for the main comparison, summary of findings Table 2 and summary of findings Table 3 for detailed assessments and the rationale for ratings.
Potential biases in the review process
In all cases, we followed the methodology for systematic reviews outlined in the Cochrane Handbook for Systematic Reviews of Interventions (Higgins 2011). However, we had to made extensive modifications to the published protocol (Martí‐Carvajal 2012), due to the need to update the methods under the current methodological guidelines for Cochrane Reviews. Readers should be aware of the potential biases related to these modifications (detailed in Differences between protocol and review), as well as the decision to split the review into three parts, considering the numerous interventions assessed for HAI prevention.
In this review we undertook a comprehensive search to identify clinical trials addressing the issue of effectiveness and safety of commonly‐used classes of drugs for preventing acute HAI. Twelve studies did not provide enough information to classify them as included or excluded, because they were published only as conference proceedings, or because we did not have access to the full texts when we were completing this review. We have also considered 12 additional studies as ongoing because they are published only as protocols and we may be able to decide whether or not to include them once they have been published. A potential source of bias in the review process is that most of the studies (more than 75%), did not report adverse events associated with the classes of drugs commonly‐used for the prevention of AMS. This constitutes a lack of information about the safety profile of the drugs in question. Likewise, we did not expect to encounter any unit of analysis issues, as we did not expect to find cross‐over studies. However, we identified 12 cross‐over studies (20%). In order to avoid bias in the development of our review, we have analysed those studies separately.
Agreements and disagreements with other studies or reviews
There are several examples of published reviews evaluating different interventions to prevent high altitude illness. We found that our results are similar to other non‐Cochrane reviews (Low 2012; Kayser 2012; Ritchie 2012; Seupaul 2012; Zafren 2014), regarding HAI/AMS prevention (CATMAT 2007; Luks 2010; Luks 2014). Most of these reviews recommend acetazolamide (at doses of 500 mg/day) as the first choice for the prevention of this condition. A systematic review developed by Dumont 2000 concludes that doses of 750 mg/day are more effective than 500 mg/day; however, our findings showed that effectiveness is similar for these two options, but there is no clear information on whether the incidence of adverse events is greater, due to the lack of information in the studies for this outcome.
In 2014, Tang 2014 published evidence in favour of the use of oral dexamethasone for the prevention of AMS. The authors of this review reported that dexamethasone could reduce the incidence of AMS, with an odds ratio of 6.03 (95% CI 2.23 to 21.00), compared with placebo. While they only identified eight studies comparing dexamethasone to placebo, we found six parallel trials and five cross‐over studies. Our analysis did not produce definitive evidence about the effectiveness of dexamethasone, but we rated this evidence as being of low quality. In addition, our trial sequential analyses suggest that new randomized controlled trials are needed for this intervention. We note that current guidelines about AMS prevention include recommendations about the use of dexamethasone to prevent HAI/AMS, in 2 mg doses every six hours or 4 mg every 12 hours (Luks 2010; Luks 2014). For the use of non‐steroidal anti‐inflammatory drugs (NSAIDs), our results are similar to those published by Pandit 2014, and support the use of ibuprofen as an alternative for acetazolamide, despite the fact that they provide analyses for all pooled NSAIDs (OR 0.43; 95% CI 0.27 to 0.69, I2 = 0%). We did not find any reviews about other options such as tadalafil, sildenafil, nifedipine, flunarizine or theophylline, and these are not recommended in current clinical practice guidelines for the prevention of this condition.
Risk of bias graph: review authors' judgements about each risk of bias item presented as percentages across all included studies.
Risk of bias summary: review authors' judgements about each risk of bias item for each included study.
Forest plot of comparison: 1 Carbonic anhydrase inhibitors: acetazolamide versus placebo, outcome: 1.1 Incidence of acute mountain sickness.
Funnel plot of comparison: 1 Carbonic anhydrase inhibitors: acetazolamide versus placebo, outcome: 1.1 Incidence of acute mountain sickness.
Trial sequential analysis on prevention of acute mountain illness in 16 oral acetazolamide at any dose vs placebo trials
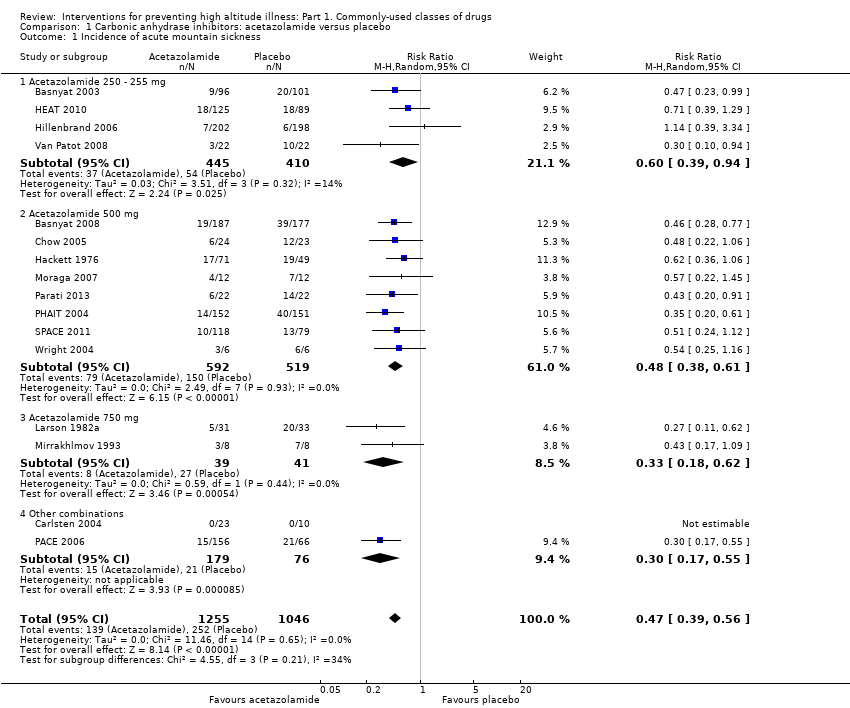
Comparison 1 Carbonic anhydrase inhibitors: acetazolamide versus placebo, Outcome 1 Incidence of acute mountain sickness.

Comparison 1 Carbonic anhydrase inhibitors: acetazolamide versus placebo, Outcome 2 Incidence of high altitude pulmonary oedema.
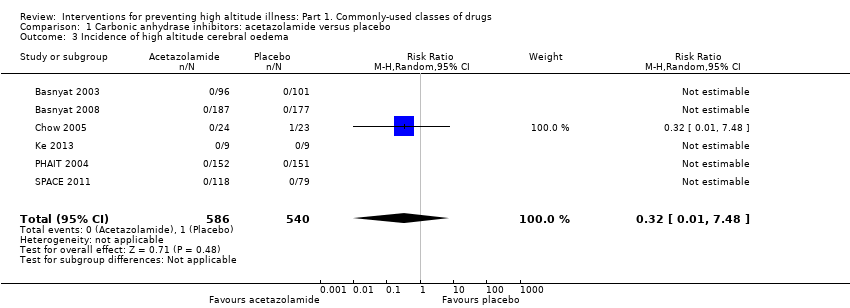
Comparison 1 Carbonic anhydrase inhibitors: acetazolamide versus placebo, Outcome 3 Incidence of high altitude cerebral oedema.

Comparison 1 Carbonic anhydrase inhibitors: acetazolamide versus placebo, Outcome 4 Incidence of adverse events: Paraesthesia.

Comparison 1 Carbonic anhydrase inhibitors: acetazolamide versus placebo, Outcome 5 Differences in HAI/AMS scores.

Comparison 2 Steroids: budesonide vs. placebo, Outcome 1 Incidence of acute mountain sickness.
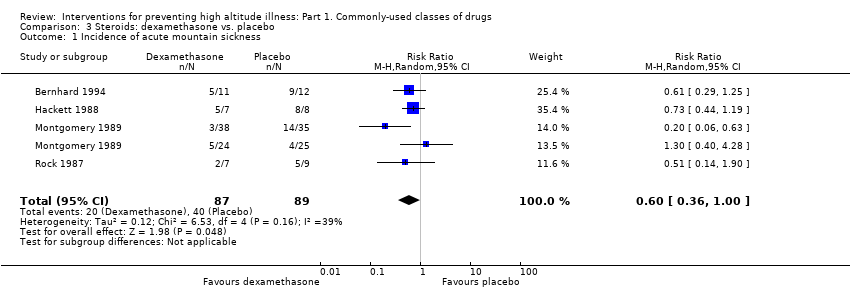
Comparison 3 Steroids: dexamethasone vs. placebo, Outcome 1 Incidence of acute mountain sickness.

Comparison 3 Steroids: dexamethasone vs. placebo, Outcome 2 Differences in HAI/AMS scores.

Comparison 4 Calcium modulators: nifedipine vs. placebo, Outcome 1 Differences in HAI/AMS scores.

Comparison 5 NSAIDs and other analgesic: aspirin vs. placebo, Outcome 1 Incidence of AMS.

Comparison 6 NSAIDs and other analgesic: ibuprofen vs. placebo, Outcome 1 Incidence of acute mountain sickness.
| Acetazolamide compared with placebo for preventing high altitude illness | ||||||
| Patient or population: people at risk of high altitude illness Setting: High altitude; studies undertaken in India, South America and USA. | ||||||
| Outcomes | Illustrative comparative risks* (95% CI) | Relative effect | No of Participants | Quality of the evidence | Comments | |
| Assumed risk | Corresponding risk | |||||
| Placebo | Acetazolamide | |||||
| Incidence of acute mountain sickness (AMS)‐ Follow‐ up: From arrival to 24 hours later | 241 per 1000 | 113 per 1000 | RR 0.47 | 2301 | ⊕⊕⊕⊝ | |
| Incidence of high altitude pulmonary oedema (HAPE)‐ Follow‐ up: From arrival to 24 hours later | See comment | See comment | Not estimable | 1138 | ⊕⊕⊕⊝ | These trials reported no event |
| Incidence of high altitude cerebral oedema (HACE)‐ Follow‐ up: From arrival to 24 hours later | 2 per 1000 | 1 per 1000 | RR 0.32 | 1126 | ⊕⊕⊕⊝ | |
| Adverse events: Paresthesias‐ Follow‐ up: From arrival to 24 hours later | 91 per 1000 | 504 per 1000 | RR 5.53 (2.81 to 10.88) | 789 | ⊕⊕⊝⊝ Low3 | |
| Adverse events: side effects‐ Follow‐ up: From arrival to 24 hours later | 106 per 1000 | 232 per 1000 | RR 2.19 | 400 | ⊕⊕⊝⊝ | |
| The corresponding risk (and its 95% confidence interval) is based on the assumed risk in the comparison group and the relative effect of the intervention (and its 95% CI). | ||||||
| GRADE Working Group grades of evidence | ||||||
| 1Risk of bias downgraded (‐1) due to unclear selection, performance and detection bias in most of included studies. High risk of attrition bias in five studies. 3 Risk of bias downgraded (‐2) due to unclear selection, performance and detection bias, as well as considerable heterogeneity (60%) | ||||||
| Budesonide compared with placebo for preventing high altitude illness | ||||||
| Patient or population: people at risk of high altitude illness Setting: High altitude; studies undertaken in India, South America and USA. | ||||||
| Outcomes | Illustrative comparative risks* (95% CI) | Relative effect | No of Participants | Quality of the evidence | Comments | |
| Assumed risk | Corresponding risk | |||||
| placebo | Budesonide | |||||
| Incidence of acute mountain sickness (AMS)‐ Follow‐ up: From arrival to 24 hours later | 606 per 1000 | 224 per 1000 | RR 0.37 | 132 | ⊕⊕⊝⊝ | |
| Incidence of high altitude pulmonary oedema (HAPE)‐ not reported | See comment | See comment | Not estimable | ‐ | See comment | This outcome was not reported for selected trials. |
| Incidence of high altitude cerebral oedema (HACE)‐ not reported | See comment | See comment | Not estimable | ‐ | See comment | This outcome was not reported for selected trials. |
| Adverse events: Side effects‐ Follow‐ up: From arrival to 24 hours later | See comment | See comment | Not estimable | 40 | ⊕⊝⊝⊝ | This trial reported no events |
| The corresponding risk (and its 95% confidence interval) is based on the assumed risk in the comparison group and the relative effect of the intervention (and its 95% CI). | ||||||
| GRADE Working Group grades of evidence | ||||||
| 1Risk of bias downgraded (‐1) due to high risk of performance bias in one out of two studies included. | ||||||
| Dexamethasone compared with placebo for preventing high altitude illness | ||||||
| Patient or population: people at risk of high altitude illness Setting: High altitude; studies undertaken in India, South America and USA. | ||||||
| Outcomes | Illustrative comparative risks* (95% CI) | Relative effect | No of Participants | Quality of the evidence | Comments | |
| Assumed risk | Corresponding risk | |||||
| placebo | Dexamethasone | |||||
| Incidence of acute mountain sickness (AMS)‐ Follow‐ up: From arrival to 24 hours later | 449 per 1000 | 270 per 1000 | RR 0.6 | 176 | ⊕⊕⊝⊝ | |
| Incidence of high altitude pulmonary oedema (HAPE)‐ not reported | See comment | See comment | Not estimable | ‐ | See comment | This outcome was not reported for selected trials. |
| Incidence of high altitude cerebral oedema (HACE) ‐ not reported | See comment | See comment | Not estimable | ‐ | See comment | This outcome was not reported for selected trials. |
| Adverse events: General‐ Follow‐ up: From arrival to 24 hours later | See comment | See comment | Not estimable | 21 | ⊕⊝⊝⊝ | This trial reported no events |
| The corresponding risk (and its 95% confidence interval) is based on the assumed risk in the comparison group and the relative effect of the intervention (and its 95% CI). | ||||||
| GRADE Working Group grades of evidence | ||||||
| 1Risk of bias downgraded (‐1) due to unclear risk of selection, performance and detection bias in almost all studies included. | ||||||
| Study | High mountain | Men (%) | Increased risk of AMS, HAPE or HACE | Country | Administration timing | Trekking | Final altitude (mts) | Difference between the endpoint and the baseline altitude (mts) | Duration of ascent | Definicion de AMS | Conflict of interest |
| Yes | 100 | No | Ecuador | 3 days | No (Car) | 5000 | 2225 | 5 days | No definition was provided | No | |
| Yes | 72.4 | No | Nepal | unclear | Yes | 4928 | 648 | Unclear | Lake Louise AMS score≥3 with headache | No | |
| Yes | 54.2 | No | USA | 2 days | No (Car) | 4300 | 4100 | 5 hours | No definition was provided | No | |
| Yes | 95.2 | Previous episodes of HAPE | Italy | 4 days | No (Car) | 4559 | 3429 | 1 day | No definition was provided | No | |
| Yes | 67.1 | No | Nepal | 2‐3 days | Yes | 4937 | 2937 | 2‐3 days | Lake Louise AMS score= headache + 1 symptom | Yes | |
| Yes | 626 | No | Nepal | max 4 dias | Yes | 5000 | 750 | 36‐96 hours | Lake Louise AMS score≥3 with headache | Yes | |
| Yes | 100 | No | India | 2 days | Yes | 3450 | 3230 | 3 days | No definition was provided | No | |
| Yes | 100 | No | Nepal | 2 days | No (Flight) | 3450 | 3230 | Unclear | Lake Louise AMS score | No | |
| Yes | 58 | No | Chile | 4‐5 days | 5200 | Unclear | Lake Louise AMS score≥3 | No | |||
| No | 100 | No | Switzerland | 7 days | No applicable | 4559 | 4069 | 13 minutes | ESQ=AMS‐C SCORE>0,70 | No | |
| Yes | 65.2 | 40% subjects with previous AMS mild or moderate | Bolivia | 4 days | No (Car) | 5334 | 1645 | 2 hours | Modified ESQ= 3 cerebral symptoms, one with intensity ≥2 | Yes | |
| Yes | 69.2 | 50% of the subjects had previously visited high altitudes and had experienced mild to moderate AMS | Bolivia | 4 days | No (Car) | 5334 | 1645 | 2 hours | Modified ESQ= 3 cerebral symptoms, one with intensity ≥2 | No | |
| Yes | 90.4 | No | Nepal | 3 days | Yes | 4846 | 3546 | 10 days | No definition was provided | No | |
| Yes | Unclear | No | Pakistan | 2 days | No (Car) | 4450 | 3932 | 8 hours | No definition was provided | No | |
| Yes | 64 | History of headache | Unclear | 2 hours | No (combination) | 3480 | 2880 | Unclear | Headache scoring | No | |
| Yes | Unclear | History of AMS | Italy | 10 hours | No (combination) | 3800 | 3200 | Less than a day by car up to 3480, and 2.8 to 3 hours climbing from there to 3800m | Lake Louise AMS score≥3 | Yes | |
| Yes | 58.6 | History of headache | Unclear | 1 hour | Unclear | 3480 | 2880 | Unclear | Headache scoring | Yes | |
| Yes | 62.6 | No | Nepal | 2 hours | No (Flight) | 3630 | 3630 | 7‐8 hours | Lake Louise AMS score≥4 | Yes | |
| Yes | Unclear | No | China | 3 days | No (Flight) | 3700 | 3200 | 2.5 hour | Lake Louise AMS score≥3 | No | |
| Yes | 57.8 | No | USA | 5 days | No (Car) | 3800 | 2570 | 2 hours | Lake Louise AMS score≥5 | No | |
| Yes | 61.1 | No | USA | 1 day | No (combination) | 4392 | 3262 | 1 day | Modified ESQ= AMS‐C>0,7 + AMS‐R>0,6 | No | |
| Yes | 70 | Unclear | Italy | 3 days | No (Cable‐cars or train) | 3459 | 3309 | Unclear | No definition was provided | No | |
| No | 100 | No | Germany | 3 days | No applicable | 4500 | 4500 | 30 min | No definition was provided | No | |
| Yes | 100 | No | Switzerland | 3 days | No (Cable‐cars or train) | 3454 | 3454 | 3 hours | No definition was provided | No | |
| No | 100 | No | Germany | 3 days | No applicable | 4500 | 4500 | 15 minutes | ESQ‐C score >0,5 or Lake Louise AMS score>3 | No | |
| No | 83.3 | No | USA | 1 days | No applicable | 4300 | 4300 | Unclear | Modified ESQ= AMS‐C>0,7 + AMS‐R>0,6 | No | |
| Yes | 91.6 | No | Nepal | 2 days | Yes | 5895 | 3895 | 5 days | No definition was provided | No | |
| Yes | 71 | No | Nepal | 4 days | Yes | 4243 | 803 | 3‐4 days | Questionnaire clinical>2 | No | |
| Yes | 100 | No | USA | 1 hour | No (Flight) | 4400 | 4400 | 1 hour | AMS Score>2 or Modified ESQ= AMS‐C>0,7 + AMS‐R>0,6 | No | |
| Yes | 70.5 | No | Nepal | 1 day | Yes | 4928 | 648 | Unclear | No definition was provided | Yes | |
| Yes | 100 | Unclear | Nepal | Unclear | Yes | 4930 | 1490 | 7 days | Lake Louise AMS score≥3 with headache | Yes | |
| Yes | 61,00 | No | India | 5 days | Yes | 5500 | 2100 | 9 days | No definition was provided | No | |
| Yes | 86,00 | susceptibility to AMS | Italy | 3 days | No (combination) | 4559 | 4069 | 22 hours | Score clinical proposed at the International Hypoxia symposium+ Do you feel ill?=Yes | Yes | |
| Yes | 100 | No | Pakistan | 1 day | No (combination) | 4578 | 4063 | 1 day | ESQ score > = 6 | No | |
| Yes | 100 | No | USA | 1 day | Unclear | 3500 | 3300 | Unclear | No definition was provided | No | |
| No | 100 | No | USA | 1 day | No applicable | 4570 | 4570 | Unclear | Modified ESQ= AMS‐C>0,7 + AMS‐R>0,6 | No | |
| Yes | unclear | No | 1 day | No (combination) | 5896 | 5896 | 7 days | Lake Louise AMS score≥3 with headache | No | ||
| Yes | 100 | No | China | 3 days | No (Flight) | 3658 | Unclear | 3 hours | Presence of of headache and at least one of the symptoms of nausea or vomiting, fatigue, dizziness, or difficulty sleeping, and a total score of at least 3, | Yes | |
| Yes | 100 | No | Italia | 5 days | Yes | 4559 | 4559 | 2 days | Lake Louise AMS score≥4 | No | |
| Yes | unclear | No | USA | 1 day | Yes | 4394 | 3094 | 2 days | GHAQ = Headache moderate or more and/or nausea moderate or more | No | |
| Yes | 84.3 | No | USA | 1 day | Yes | 4394 | 3094 | 2 days | GHAQ = Headache moderate or more and/or nausea moderate or more | No | |
| Yes | 67.4 | No | USA | 6 hours | No (combination) | 3810 | 2570 | 12 hours | Lake Louise AMS score≥3 with headache | Yes | |
| No | unclear | No | USA | 4 days | No applicable | 3900 | 2490 | Unclear | No definition was provided | Yes | |
| Yes | 86.2 | History of HAPE | Italia | 1 day | No (combination) | 4559 | 4069 | 2 days | Lake Louise AMS score≥4 | Yes | |
| Yes | Unclear | Patients with asthma | Kirguistán | 2 days | No (Car) | 3200 | 2440 | 4 hours | No definition was provided | No | |
| Yes | 74 | No | USA | 1,5 days | Unclear | 2700 | 2700 | Unclear | AMS score clinical= 3 or more symptoms with a grade 2 or greater | No | |
| Yes | 100 | No | Chile | 3 days | No (Cable‐cars or train) | 3696 | 3696 | 8,5 hours | AMS score clinical≥3 or 1 symptom=3 | No | |
| Muza 2004 Def1 | No | unclear | No | USA | 1 hour | No applicable | 4300 | 4300 | Unclear | Lake Louise AMS score≥3 | Yes |
| Yes | 60 to 69 | No | Nepal | 6 days | Yes | 4928 | 1488 | Unclear | Lake Louise AMS score≥3 | No | |
| Yes | 95 | No | Italy | 3 days | No (combination) | 4559 | 4437 | <28 hours | Lake Louise AMS score≥3 | Yes | |
| Yes | 70 to 74 | No | Nepal | 2 days | Yes | 4928 | 648 | Unclear | Lake Louise AMS score≥3 with headache | Yes | |
| Yes | 44 | No | USA | 2 days | No (Flight) | 4300 | 4300 | 6 hours | Modified ESQ= AMS‐C>0,7 + AMS‐R>0,6 | No | |
| No | 100 | No | USA | 12 hours | No applicable | 4570 | 4570 | Unclear | Johnson Score≥1 | No | |
| No | 100 | No | USA | 12 hours | No applicable | 4570 | 4570 | Unclear | Johnson Score≥1 | No | |
| No | 100 | No | USA | 12 hours | No applicable | 4570 | 4570 | Unclear | Johnson Score≥1 | No | |
| Yes | unclear | susceptible to HAPE | Italy | <6 hours | No (combination) | 4559 | 3429 | 22 hours | No definition was provided | No | |
| Yes | 62 to 72 | No | Nepal | Unclear | Yes | 5000 | 700 | 30 hours‐4 days | Lake Louise AMS score= headache + 1 symptom | No | |
| No | 80 | No | USA | 1 day | No applicable | 4875 | 3225 | 1 day | Lake Louise AMS score≥3 | Yes | |
| Yes | 43 to 52 | No | USA | 3 days | No (Car) | 4300 | 2700 | Unclear | ESQ AMS‐C Score≥0,7 + Lake Louise AMS score≥3 with headache | Yes | |
| Yes | 44 to 62 | No | Bolivia | 3 days | No (Flight) | 3561 | 3159 | 3 hours | No definition was provided | Yes | |
| Yes | 95 | Previous severe AMS= 6 | Kenia | 8 days | No (combination) | 4790 | 3527 | 3 days | No definition was provided | No | |
| Yes | 92 | No | Nepal | Unclear | No (Car) | 4680 | 4680 | 3 days | Lake Louise AMS score≥3 | No | |
| Yes | 62 to 72 | No | Nepal | 2 days | No (combination) | 4050 | 2710 | 3 days | No definition was provided | No | |
| Yes | 100 | No | China | 1 day | No (Car) | 3900 | 3500 | 5 days | LLS includes 5 self‐reporting symptoms:headache, gastrointestinal symptoms, fatigue/weakness, dizziness/lightheadedness and difficulty in sleeping. Each symptom is scores 0‐3 | No |
| Outcome or subgroup title | No. of studies | No. of participants | Statistical method | Effect size |
| 1 Incidence of acute mountain sickness Show forest plot | 16 | 2301 | Risk Ratio (M‐H, Random, 95% CI) | 0.47 [0.39, 0.56] |
| 1.1 Acetazolamide 250 ‐ 255 mg | 4 | 855 | Risk Ratio (M‐H, Random, 95% CI) | 0.60 [0.39, 0.94] |
| 1.2 Acetazolamide 500 mg | 8 | 1111 | Risk Ratio (M‐H, Random, 95% CI) | 0.48 [0.38, 0.61] |
| 1.3 Acetazolamide 750 mg | 2 | 80 | Risk Ratio (M‐H, Random, 95% CI) | 0.33 [0.18, 0.62] |
| 1.4 Other combinations | 2 | 255 | Risk Ratio (M‐H, Random, 95% CI) | 0.30 [0.17, 0.55] |
| 2 Incidence of high altitude pulmonary oedema Show forest plot | 7 | 1138 | Risk Ratio (M‐H, Random, 95% CI) | 0.0 [0.0, 0.0] |
| 3 Incidence of high altitude cerebral oedema Show forest plot | 6 | 1126 | Risk Ratio (M‐H, Random, 95% CI) | 0.32 [0.01, 7.48] |
| 4 Incidence of adverse events: Paraesthesia Show forest plot | 5 | 789 | Risk Ratio (M‐H, Random, 95% CI) | 5.53 [2.81, 10.88] |
| 4.1 Acetazolamide 250 mg | 1 | 197 | Risk Ratio (M‐H, Random, 95% CI) | 12.63 [4.02, 39.64] |
| 4.2 Acetazolamide 500 mg | 3 | 370 | Risk Ratio (M‐H, Random, 95% CI) | 6.72 [3.94, 11.46] |
| 4.3 Acetazolamide 750 mg | 1 | 222 | Risk Ratio (M‐H, Random, 95% CI) | 3.09 [2.00, 4.78] |
| 5 Differences in HAI/AMS scores Show forest plot | 6 | Std. Mean Difference (Random, 95% CI) | Subtotals only | |
| 5.1 acetazolamide 250 mg | 3 | Std. Mean Difference (Random, 95% CI) | 0.19 [0.01, 0.37] | |
| 5.2 acetazolamide 500 mg | 4 | Std. Mean Difference (Random, 95% CI) | ‐0.57 [‐1.20, 0.07] | |
| Outcome or subgroup title | No. of studies | No. of participants | Statistical method | Effect size |
| 1 Incidence of acute mountain sickness Show forest plot | 2 | 132 | Risk Ratio (M‐H, Random, 95% CI) | 0.37 [0.23, 0.61] |
| Outcome or subgroup title | No. of studies | No. of participants | Statistical method | Effect size |
| 1 Incidence of acute mountain sickness Show forest plot | 4 | 176 | Risk Ratio (M‐H, Random, 95% CI) | 0.60 [0.36, 1.00] |
| 2 Differences in HAI/AMS scores Show forest plot | 3 | 50 | Std. Mean Difference (IV, Random, 95% CI) | ‐0.46 [‐1.21, 0.29] |
| Outcome or subgroup title | No. of studies | No. of participants | Statistical method | Effect size |
| 1 Differences in HAI/AMS scores Show forest plot | 2 | 48 | Std. Mean Difference (IV, Random, 95% CI) | ‐0.56 [‐1.85, 0.74] |
| Outcome or subgroup title | No. of studies | No. of participants | Statistical method | Effect size |
| 1 Incidence of AMS Show forest plot | 2 | 60 | Risk Ratio (M‐H, Random, 95% CI) | 0.35 [0.06, 1.95] |
| Outcome or subgroup title | No. of studies | No. of participants | Statistical method | Effect size |
| 1 Incidence of acute mountain sickness Show forest plot | 3 | 598 | Risk Ratio (M‐H, Random, 95% CI) | 0.64 [0.49, 0.82] |