Interventions for preventing high altitude illness: Part 1. Commonly‐used classes of drugs
Information
- DOI:
- https://doi.org/10.1002/14651858.CD009761.pub2Copy DOI

- Database:
-
- Cochrane Database of Systematic Reviews
- Version published:
-
- 27 June 2017see what's new
- Type:
-
- Intervention
- Stage:
-
- Review
- Cochrane Editorial Group:
-
Cochrane Emergency and Critical Care Group
- Copyright:
-
- Copyright © 2018 The Cochrane Collaboration. Published by John Wiley & Sons, Ltd.
Article metrics
Altmetric:
Cited by:
Authors
Contributions of authors
Conceiving the review: AMC
Co‐ordinating the review: VNE, AMC and IAR
Undertaking manual searches: VNE, DMF, RDM, and IAR
Screening search results: VNE, DMF, RDM and IAR
Organizing retrieval of papers: VNE, DMF, RDM and IAR
Screening retrieved papers against inclusion criteria: VNE, DMF, RDM and IAR
Appraising quality of papers: VNE, DMF, RDM, AGG and IAR
Abstracting data from papers: VNE, DMF, RDM, AGG and IAR
Writing to authors of papers for additional information: Not performed
Providing additional data about papers: VNE, DMF, RDM, AGG and IAR
Obtaining and screening data on unpublished studies: VNE, DMF, RDM, AGG and IAR
Data management for the review: IAR and RDM
Entering data into Review Manager 5 (RevMan 5.3): IAR and RDM
RevMan statistical data: IAR and RDM
Other statistical analysis not using RevMan: AMC and IAR
Interpretation of data: VNE, DMF, RDM, AGG, AMC and IAR
Statistical inferences: VNE, DMF, RDM, AGG, AMC and IAR
Writing the review: VNE, DMF, RDM, AGG, AMC and IAR
Securing funding for the review: VNE, DMF, RDM, AGG, AMC and IAR
Performing previous work that was the foundation of the present study: Not performed
Guarantor for the review (one author): VNE
Person responsible for reading and checking review before submission: IAR
Sources of support
Internal sources
-
Fundacion Universitaria de Ciencias de la Salud, Colombia.
-
Methodology Research Unit/Neonatology, Instituto Nacional de Pediatria, Mexico.
Academic.
-
Instituto de Evaluación Tecnológica en Salud ‐ IETS, Colombia.
External sources
-
Iberoamerican Cochrane Center, Spain.
Academic.
Declarations of interest
Victor H Nieto Estrada: nothing to declare.
Daniel Molano Franco: nothing to declare.
Roger David Medina: nothing to declare.
Alejandro Gonzalez Garay: nothing to declare.
Arturo Marti Carvajal: nothing to declare.
Ingrid Arevalo‐Rodriguez: nothing to declare.
Acknowledgements
We would like to thank Mike Bennett (content editor), Vibeke E Horstmann (statistical editor), Janne Vendt (Information Scientist), Jeffrey H Gertsch, Martin Burtscher (peer reviewers), Matiram Pun (consumer referee) and Jane Cracknell (Managing Editor) for their help and editorial advice during the preparation of this systematic review.
Version history
| Published | Title | Stage | Authors | Version |
| 2017 Jun 27 | Interventions for preventing high altitude illness: Part 1. Commonly‐used classes of drugs | Review | Víctor H Nieto Estrada, Daniel Molano Franco, Roger David Medina, Alejandro G Gonzalez Garay, Arturo J Martí‐Carvajal, Ingrid Arevalo‐Rodriguez | |
| 2012 Apr 18 | Interventions for preventing high altitude illness | Protocol | Arturo J Martí‐Carvajal, Ricardo Hidalgo, Daniel Simancas‐Racines | |
Differences between protocol and review
1. Given that the original protocol was published in 2012, several sections needed updating to fulfil the current methodological guidelines for Cochrane Reviews. We made the following changes to the published protocol (Martí‐Carvajal 2012):
2. On the recommendation of the editors of the Cochrane Anaesthesia, Critical and Emergency Group, we split the review into three parts, considering the numerous interventions assessed for HAI prevention. This review is the first part and it focuses on commonly‐used agents to prevent this condition. Subsequent reviews will address less commonly‐used agents to prevent HAI, and non‐pharmacological interventions. This change has implications for the title and scope of this review and for later reviews in this series.
3. We updated the Background with new references to reflect current evidence about the target condition, as well as the scope of common interventions to prevent HAI.
4. The primary and secondary outcomes presented in the protocol — Martí‐Carvajal 2012) — were modified to follow the MECIR guidelines (Higgins 2016), and improve their understanding. In particular, we made the following changes.
-
We removed 'All‐cause mortality (by all causes or specific)' as a primary outcome of this review. This is because the risk of mortality is low in the general population, and it is not the primary goal for prevention.
-
We removed the outcome ' Combined incidence of AMS, HAPE or HACE (any of these alone or in combination)'. This is because this outcome is not often reported in studies, and this information can be easily calculated by the separate reporting of AMS, HAPE and HACE.
-
Previously the 'Risk of AMS' was a secondary outcome. It is a primary event to assess in prevention trials of HAI. We therefore moved this outcome from the list of secondary outcomes to the primary outcomes in this series of reviews. The risk of HAPE, HACE and adverse events are also important outcomes and they were included as secondary outcomes.
-
We included a new secondary outcome 'Difference in HAI/AMS scores at high altitude'. This is because it is frequently reported in studies, reflecting the severity of the disease
5. For this review, we selected six commonly‐used types of intervention to prevent HAI. We will address other interventions in the next two reviews belonging to this series.
6. Despite the fact that the protocol did not include any consideration of unit of analysis issues, we have identified 12 cross‐over studies in our searches. We have included them in our review to enhance the full reporting of all available evidence, and we have analysed them separately from the parallel studies.
7. We stated in the protocol that we would contact trial authors in case of missing data or selective reporting. However we were unable to conduct this task, usually due to the year of publication of the trial (most of the publications were performed too long ago and it was not possible to obtain a valid contact address or other means to contact trialists).
8. We have introduced several modifications in the Dealing with missing data section, in order to clarify the intention‐to‐treat analysis performed and to present the methods for imputing missing information (mostly related to standard deviations).
9. Under Data synthesis we added the trial sequential analysis procedure, in order to test the boundary before the required information size was reached.
10. We also made extensive modifications to the Subgroup analysis and investigation of heterogeneity section, and have selected only three variables to analyse. However, we were unable to find information about the third factor (significant pre‐existing disease) in the included trials.
Keywords
MeSH
Medical Subject Headings (MeSH) Keywords
- Acetazolamide [adverse effects, *therapeutic use];
- Altitude Sickness [complications, epidemiology, *prevention & control];
- Brain Edema [epidemiology, etiology, *prevention & control];
- Budesonide [*therapeutic use];
- Carbonic Anhydrase Inhibitors [adverse effects, *therapeutic use];
- Dexamethasone [adverse effects, *therapeutic use];
- Glucocorticoids [*therapeutic use];
- Hypertension, Pulmonary [epidemiology, *prevention & control];
- Paresthesia [chemically induced];
- Publication Bias;
- Randomized Controlled Trials as Topic;
Medical Subject Headings Check Words
Adolescent; Adult; Aged; Humans; Middle Aged;
PICOs


Risk of bias graph: review authors' judgements about each risk of bias item presented as percentages across all included studies.

Risk of bias summary: review authors' judgements about each risk of bias item for each included study.

Forest plot of comparison: 1 Carbonic anhydrase inhibitors: acetazolamide versus placebo, outcome: 1.1 Incidence of acute mountain sickness.

Funnel plot of comparison: 1 Carbonic anhydrase inhibitors: acetazolamide versus placebo, outcome: 1.1 Incidence of acute mountain sickness.

Trial sequential analysis on prevention of acute mountain illness in 16 oral acetazolamide at any dose vs placebo trials
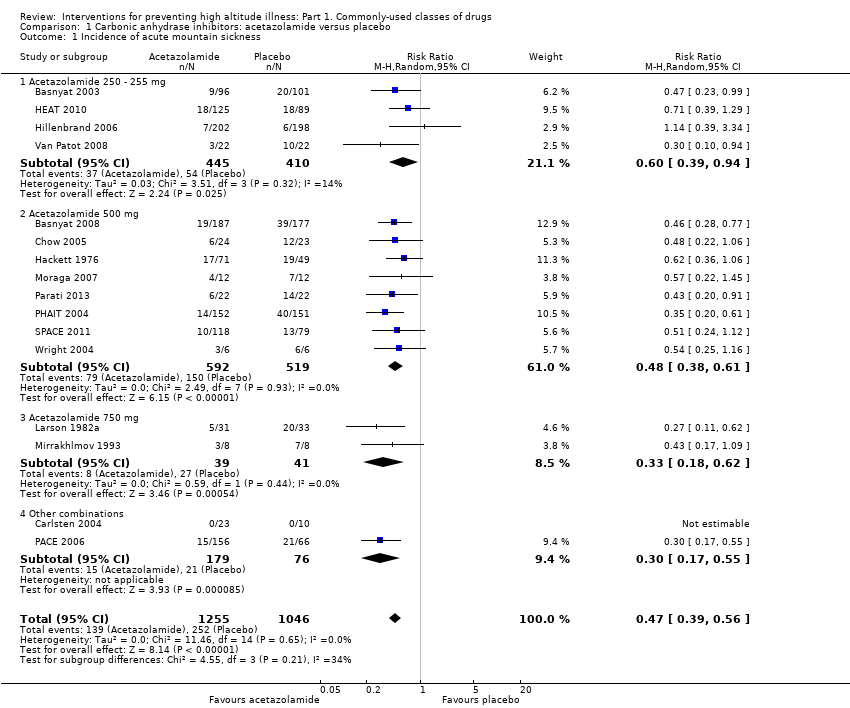
Comparison 1 Carbonic anhydrase inhibitors: acetazolamide versus placebo, Outcome 1 Incidence of acute mountain sickness.

Comparison 1 Carbonic anhydrase inhibitors: acetazolamide versus placebo, Outcome 2 Incidence of high altitude pulmonary oedema.
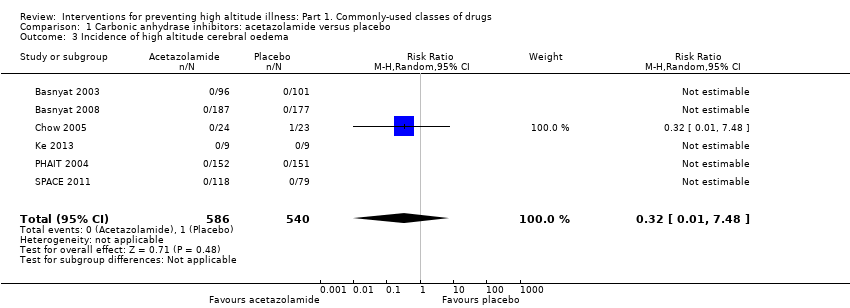
Comparison 1 Carbonic anhydrase inhibitors: acetazolamide versus placebo, Outcome 3 Incidence of high altitude cerebral oedema.

Comparison 1 Carbonic anhydrase inhibitors: acetazolamide versus placebo, Outcome 4 Incidence of adverse events: Paraesthesia.

Comparison 1 Carbonic anhydrase inhibitors: acetazolamide versus placebo, Outcome 5 Differences in HAI/AMS scores.

Comparison 2 Steroids: budesonide vs. placebo, Outcome 1 Incidence of acute mountain sickness.
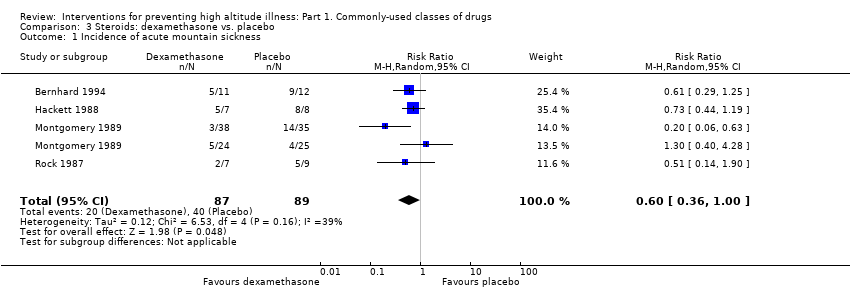
Comparison 3 Steroids: dexamethasone vs. placebo, Outcome 1 Incidence of acute mountain sickness.

Comparison 3 Steroids: dexamethasone vs. placebo, Outcome 2 Differences in HAI/AMS scores.

Comparison 4 Calcium modulators: nifedipine vs. placebo, Outcome 1 Differences in HAI/AMS scores.

Comparison 5 NSAIDs and other analgesic: aspirin vs. placebo, Outcome 1 Incidence of AMS.

Comparison 6 NSAIDs and other analgesic: ibuprofen vs. placebo, Outcome 1 Incidence of acute mountain sickness.
| Acetazolamide compared with placebo for preventing high altitude illness | ||||||
| Patient or population: people at risk of high altitude illness Setting: High altitude; studies undertaken in India, South America and USA. | ||||||
| Outcomes | Illustrative comparative risks* (95% CI) | Relative effect | No of Participants | Quality of the evidence | Comments | |
| Assumed risk | Corresponding risk | |||||
| Placebo | Acetazolamide | |||||
| Incidence of acute mountain sickness (AMS)‐ Follow‐ up: From arrival to 24 hours later | 241 per 1000 | 113 per 1000 | RR 0.47 | 2301 | ⊕⊕⊕⊝ | |
| Incidence of high altitude pulmonary oedema (HAPE)‐ Follow‐ up: From arrival to 24 hours later | See comment | See comment | Not estimable | 1138 | ⊕⊕⊕⊝ | These trials reported no event |
| Incidence of high altitude cerebral oedema (HACE)‐ Follow‐ up: From arrival to 24 hours later | 2 per 1000 | 1 per 1000 | RR 0.32 | 1126 | ⊕⊕⊕⊝ | |
| Adverse events: Paresthesias‐ Follow‐ up: From arrival to 24 hours later | 91 per 1000 | 504 per 1000 | RR 5.53 (2.81 to 10.88) | 789 | ⊕⊕⊝⊝ Low3 | |
| Adverse events: side effects‐ Follow‐ up: From arrival to 24 hours later | 106 per 1000 | 232 per 1000 | RR 2.19 | 400 | ⊕⊕⊝⊝ | |
| The corresponding risk (and its 95% confidence interval) is based on the assumed risk in the comparison group and the relative effect of the intervention (and its 95% CI). | ||||||
| GRADE Working Group grades of evidence | ||||||
| 1Risk of bias downgraded (‐1) due to unclear selection, performance and detection bias in most of included studies. High risk of attrition bias in five studies. 3 Risk of bias downgraded (‐2) due to unclear selection, performance and detection bias, as well as considerable heterogeneity (60%) | ||||||
| Budesonide compared with placebo for preventing high altitude illness | ||||||
| Patient or population: people at risk of high altitude illness Setting: High altitude; studies undertaken in India, South America and USA. | ||||||
| Outcomes | Illustrative comparative risks* (95% CI) | Relative effect | No of Participants | Quality of the evidence | Comments | |
| Assumed risk | Corresponding risk | |||||
| placebo | Budesonide | |||||
| Incidence of acute mountain sickness (AMS)‐ Follow‐ up: From arrival to 24 hours later | 606 per 1000 | 224 per 1000 | RR 0.37 | 132 | ⊕⊕⊝⊝ | |
| Incidence of high altitude pulmonary oedema (HAPE)‐ not reported | See comment | See comment | Not estimable | ‐ | See comment | This outcome was not reported for selected trials. |
| Incidence of high altitude cerebral oedema (HACE)‐ not reported | See comment | See comment | Not estimable | ‐ | See comment | This outcome was not reported for selected trials. |
| Adverse events: Side effects‐ Follow‐ up: From arrival to 24 hours later | See comment | See comment | Not estimable | 40 | ⊕⊝⊝⊝ | This trial reported no events |
| The corresponding risk (and its 95% confidence interval) is based on the assumed risk in the comparison group and the relative effect of the intervention (and its 95% CI). | ||||||
| GRADE Working Group grades of evidence | ||||||
| 1Risk of bias downgraded (‐1) due to high risk of performance bias in one out of two studies included. | ||||||
| Dexamethasone compared with placebo for preventing high altitude illness | ||||||
| Patient or population: people at risk of high altitude illness Setting: High altitude; studies undertaken in India, South America and USA. | ||||||
| Outcomes | Illustrative comparative risks* (95% CI) | Relative effect | No of Participants | Quality of the evidence | Comments | |
| Assumed risk | Corresponding risk | |||||
| placebo | Dexamethasone | |||||
| Incidence of acute mountain sickness (AMS)‐ Follow‐ up: From arrival to 24 hours later | 449 per 1000 | 270 per 1000 | RR 0.6 | 176 | ⊕⊕⊝⊝ | |
| Incidence of high altitude pulmonary oedema (HAPE)‐ not reported | See comment | See comment | Not estimable | ‐ | See comment | This outcome was not reported for selected trials. |
| Incidence of high altitude cerebral oedema (HACE) ‐ not reported | See comment | See comment | Not estimable | ‐ | See comment | This outcome was not reported for selected trials. |
| Adverse events: General‐ Follow‐ up: From arrival to 24 hours later | See comment | See comment | Not estimable | 21 | ⊕⊝⊝⊝ | This trial reported no events |
| The corresponding risk (and its 95% confidence interval) is based on the assumed risk in the comparison group and the relative effect of the intervention (and its 95% CI). | ||||||
| GRADE Working Group grades of evidence | ||||||
| 1Risk of bias downgraded (‐1) due to unclear risk of selection, performance and detection bias in almost all studies included. | ||||||
| Study | High mountain | Men (%) | Increased risk of AMS, HAPE or HACE | Country | Administration timing | Trekking | Final altitude (mts) | Difference between the endpoint and the baseline altitude (mts) | Duration of ascent | Definicion de AMS | Conflict of interest |
| Yes | 100 | No | Ecuador | 3 days | No (Car) | 5000 | 2225 | 5 days | No definition was provided | No | |
| Yes | 72.4 | No | Nepal | unclear | Yes | 4928 | 648 | Unclear | Lake Louise AMS score≥3 with headache | No | |
| Yes | 54.2 | No | USA | 2 days | No (Car) | 4300 | 4100 | 5 hours | No definition was provided | No | |
| Yes | 95.2 | Previous episodes of HAPE | Italy | 4 days | No (Car) | 4559 | 3429 | 1 day | No definition was provided | No | |
| Yes | 67.1 | No | Nepal | 2‐3 days | Yes | 4937 | 2937 | 2‐3 days | Lake Louise AMS score= headache + 1 symptom | Yes | |
| Yes | 626 | No | Nepal | max 4 dias | Yes | 5000 | 750 | 36‐96 hours | Lake Louise AMS score≥3 with headache | Yes | |
| Yes | 100 | No | India | 2 days | Yes | 3450 | 3230 | 3 days | No definition was provided | No | |
| Yes | 100 | No | Nepal | 2 days | No (Flight) | 3450 | 3230 | Unclear | Lake Louise AMS score | No | |
| Yes | 58 | No | Chile | 4‐5 days | 5200 | Unclear | Lake Louise AMS score≥3 | No | |||
| No | 100 | No | Switzerland | 7 days | No applicable | 4559 | 4069 | 13 minutes | ESQ=AMS‐C SCORE>0,70 | No | |
| Yes | 65.2 | 40% subjects with previous AMS mild or moderate | Bolivia | 4 days | No (Car) | 5334 | 1645 | 2 hours | Modified ESQ= 3 cerebral symptoms, one with intensity ≥2 | Yes | |
| Yes | 69.2 | 50% of the subjects had previously visited high altitudes and had experienced mild to moderate AMS | Bolivia | 4 days | No (Car) | 5334 | 1645 | 2 hours | Modified ESQ= 3 cerebral symptoms, one with intensity ≥2 | No | |
| Yes | 90.4 | No | Nepal | 3 days | Yes | 4846 | 3546 | 10 days | No definition was provided | No | |
| Yes | Unclear | No | Pakistan | 2 days | No (Car) | 4450 | 3932 | 8 hours | No definition was provided | No | |
| Yes | 64 | History of headache | Unclear | 2 hours | No (combination) | 3480 | 2880 | Unclear | Headache scoring | No | |
| Yes | Unclear | History of AMS | Italy | 10 hours | No (combination) | 3800 | 3200 | Less than a day by car up to 3480, and 2.8 to 3 hours climbing from there to 3800m | Lake Louise AMS score≥3 | Yes | |
| Yes | 58.6 | History of headache | Unclear | 1 hour | Unclear | 3480 | 2880 | Unclear | Headache scoring | Yes | |
| Yes | 62.6 | No | Nepal | 2 hours | No (Flight) | 3630 | 3630 | 7‐8 hours | Lake Louise AMS score≥4 | Yes | |
| Yes | Unclear | No | China | 3 days | No (Flight) | 3700 | 3200 | 2.5 hour | Lake Louise AMS score≥3 | No | |
| Yes | 57.8 | No | USA | 5 days | No (Car) | 3800 | 2570 | 2 hours | Lake Louise AMS score≥5 | No | |
| Yes | 61.1 | No | USA | 1 day | No (combination) | 4392 | 3262 | 1 day | Modified ESQ= AMS‐C>0,7 + AMS‐R>0,6 | No | |
| Yes | 70 | Unclear | Italy | 3 days | No (Cable‐cars or train) | 3459 | 3309 | Unclear | No definition was provided | No | |
| No | 100 | No | Germany | 3 days | No applicable | 4500 | 4500 | 30 min | No definition was provided | No | |
| Yes | 100 | No | Switzerland | 3 days | No (Cable‐cars or train) | 3454 | 3454 | 3 hours | No definition was provided | No | |
| No | 100 | No | Germany | 3 days | No applicable | 4500 | 4500 | 15 minutes | ESQ‐C score >0,5 or Lake Louise AMS score>3 | No | |
| No | 83.3 | No | USA | 1 days | No applicable | 4300 | 4300 | Unclear | Modified ESQ= AMS‐C>0,7 + AMS‐R>0,6 | No | |
| Yes | 91.6 | No | Nepal | 2 days | Yes | 5895 | 3895 | 5 days | No definition was provided | No | |
| Yes | 71 | No | Nepal | 4 days | Yes | 4243 | 803 | 3‐4 days | Questionnaire clinical>2 | No | |
| Yes | 100 | No | USA | 1 hour | No (Flight) | 4400 | 4400 | 1 hour | AMS Score>2 or Modified ESQ= AMS‐C>0,7 + AMS‐R>0,6 | No | |
| Yes | 70.5 | No | Nepal | 1 day | Yes | 4928 | 648 | Unclear | No definition was provided | Yes | |
| Yes | 100 | Unclear | Nepal | Unclear | Yes | 4930 | 1490 | 7 days | Lake Louise AMS score≥3 with headache | Yes | |
| Yes | 61,00 | No | India | 5 days | Yes | 5500 | 2100 | 9 days | No definition was provided | No | |
| Yes | 86,00 | susceptibility to AMS | Italy | 3 days | No (combination) | 4559 | 4069 | 22 hours | Score clinical proposed at the International Hypoxia symposium+ Do you feel ill?=Yes | Yes | |
| Yes | 100 | No | Pakistan | 1 day | No (combination) | 4578 | 4063 | 1 day | ESQ score > = 6 | No | |
| Yes | 100 | No | USA | 1 day | Unclear | 3500 | 3300 | Unclear | No definition was provided | No | |
| No | 100 | No | USA | 1 day | No applicable | 4570 | 4570 | Unclear | Modified ESQ= AMS‐C>0,7 + AMS‐R>0,6 | No | |
| Yes | unclear | No | 1 day | No (combination) | 5896 | 5896 | 7 days | Lake Louise AMS score≥3 with headache | No | ||
| Yes | 100 | No | China | 3 days | No (Flight) | 3658 | Unclear | 3 hours | Presence of of headache and at least one of the symptoms of nausea or vomiting, fatigue, dizziness, or difficulty sleeping, and a total score of at least 3, | Yes | |
| Yes | 100 | No | Italia | 5 days | Yes | 4559 | 4559 | 2 days | Lake Louise AMS score≥4 | No | |
| Yes | unclear | No | USA | 1 day | Yes | 4394 | 3094 | 2 days | GHAQ = Headache moderate or more and/or nausea moderate or more | No | |
| Yes | 84.3 | No | USA | 1 day | Yes | 4394 | 3094 | 2 days | GHAQ = Headache moderate or more and/or nausea moderate or more | No | |
| Yes | 67.4 | No | USA | 6 hours | No (combination) | 3810 | 2570 | 12 hours | Lake Louise AMS score≥3 with headache | Yes | |
| No | unclear | No | USA | 4 days | No applicable | 3900 | 2490 | Unclear | No definition was provided | Yes | |
| Yes | 86.2 | History of HAPE | Italia | 1 day | No (combination) | 4559 | 4069 | 2 days | Lake Louise AMS score≥4 | Yes | |
| Yes | Unclear | Patients with asthma | Kirguistán | 2 days | No (Car) | 3200 | 2440 | 4 hours | No definition was provided | No | |
| Yes | 74 | No | USA | 1,5 days | Unclear | 2700 | 2700 | Unclear | AMS score clinical= 3 or more symptoms with a grade 2 or greater | No | |
| Yes | 100 | No | Chile | 3 days | No (Cable‐cars or train) | 3696 | 3696 | 8,5 hours | AMS score clinical≥3 or 1 symptom=3 | No | |
| Muza 2004 Def1 | No | unclear | No | USA | 1 hour | No applicable | 4300 | 4300 | Unclear | Lake Louise AMS score≥3 | Yes |
| Yes | 60 to 69 | No | Nepal | 6 days | Yes | 4928 | 1488 | Unclear | Lake Louise AMS score≥3 | No | |
| Yes | 95 | No | Italy | 3 days | No (combination) | 4559 | 4437 | <28 hours | Lake Louise AMS score≥3 | Yes | |
| Yes | 70 to 74 | No | Nepal | 2 days | Yes | 4928 | 648 | Unclear | Lake Louise AMS score≥3 with headache | Yes | |
| Yes | 44 | No | USA | 2 days | No (Flight) | 4300 | 4300 | 6 hours | Modified ESQ= AMS‐C>0,7 + AMS‐R>0,6 | No | |
| No | 100 | No | USA | 12 hours | No applicable | 4570 | 4570 | Unclear | Johnson Score≥1 | No | |
| No | 100 | No | USA | 12 hours | No applicable | 4570 | 4570 | Unclear | Johnson Score≥1 | No | |
| No | 100 | No | USA | 12 hours | No applicable | 4570 | 4570 | Unclear | Johnson Score≥1 | No | |
| Yes | unclear | susceptible to HAPE | Italy | <6 hours | No (combination) | 4559 | 3429 | 22 hours | No definition was provided | No | |
| Yes | 62 to 72 | No | Nepal | Unclear | Yes | 5000 | 700 | 30 hours‐4 days | Lake Louise AMS score= headache + 1 symptom | No | |
| No | 80 | No | USA | 1 day | No applicable | 4875 | 3225 | 1 day | Lake Louise AMS score≥3 | Yes | |
| Yes | 43 to 52 | No | USA | 3 days | No (Car) | 4300 | 2700 | Unclear | ESQ AMS‐C Score≥0,7 + Lake Louise AMS score≥3 with headache | Yes | |
| Yes | 44 to 62 | No | Bolivia | 3 days | No (Flight) | 3561 | 3159 | 3 hours | No definition was provided | Yes | |
| Yes | 95 | Previous severe AMS= 6 | Kenia | 8 days | No (combination) | 4790 | 3527 | 3 days | No definition was provided | No | |
| Yes | 92 | No | Nepal | Unclear | No (Car) | 4680 | 4680 | 3 days | Lake Louise AMS score≥3 | No | |
| Yes | 62 to 72 | No | Nepal | 2 days | No (combination) | 4050 | 2710 | 3 days | No definition was provided | No | |
| Yes | 100 | No | China | 1 day | No (Car) | 3900 | 3500 | 5 days | LLS includes 5 self‐reporting symptoms:headache, gastrointestinal symptoms, fatigue/weakness, dizziness/lightheadedness and difficulty in sleeping. Each symptom is scores 0‐3 | No |
| Outcome or subgroup title | No. of studies | No. of participants | Statistical method | Effect size |
| 1 Incidence of acute mountain sickness Show forest plot | 16 | 2301 | Risk Ratio (M‐H, Random, 95% CI) | 0.47 [0.39, 0.56] |
| 1.1 Acetazolamide 250 ‐ 255 mg | 4 | 855 | Risk Ratio (M‐H, Random, 95% CI) | 0.60 [0.39, 0.94] |
| 1.2 Acetazolamide 500 mg | 8 | 1111 | Risk Ratio (M‐H, Random, 95% CI) | 0.48 [0.38, 0.61] |
| 1.3 Acetazolamide 750 mg | 2 | 80 | Risk Ratio (M‐H, Random, 95% CI) | 0.33 [0.18, 0.62] |
| 1.4 Other combinations | 2 | 255 | Risk Ratio (M‐H, Random, 95% CI) | 0.30 [0.17, 0.55] |
| 2 Incidence of high altitude pulmonary oedema Show forest plot | 7 | 1138 | Risk Ratio (M‐H, Random, 95% CI) | 0.0 [0.0, 0.0] |
| 3 Incidence of high altitude cerebral oedema Show forest plot | 6 | 1126 | Risk Ratio (M‐H, Random, 95% CI) | 0.32 [0.01, 7.48] |
| 4 Incidence of adverse events: Paraesthesia Show forest plot | 5 | 789 | Risk Ratio (M‐H, Random, 95% CI) | 5.53 [2.81, 10.88] |
| 4.1 Acetazolamide 250 mg | 1 | 197 | Risk Ratio (M‐H, Random, 95% CI) | 12.63 [4.02, 39.64] |
| 4.2 Acetazolamide 500 mg | 3 | 370 | Risk Ratio (M‐H, Random, 95% CI) | 6.72 [3.94, 11.46] |
| 4.3 Acetazolamide 750 mg | 1 | 222 | Risk Ratio (M‐H, Random, 95% CI) | 3.09 [2.00, 4.78] |
| 5 Differences in HAI/AMS scores Show forest plot | 6 | Std. Mean Difference (Random, 95% CI) | Subtotals only | |
| 5.1 acetazolamide 250 mg | 3 | Std. Mean Difference (Random, 95% CI) | 0.19 [0.01, 0.37] | |
| 5.2 acetazolamide 500 mg | 4 | Std. Mean Difference (Random, 95% CI) | ‐0.57 [‐1.20, 0.07] | |
| Outcome or subgroup title | No. of studies | No. of participants | Statistical method | Effect size |
| 1 Incidence of acute mountain sickness Show forest plot | 2 | 132 | Risk Ratio (M‐H, Random, 95% CI) | 0.37 [0.23, 0.61] |
| Outcome or subgroup title | No. of studies | No. of participants | Statistical method | Effect size |
| 1 Incidence of acute mountain sickness Show forest plot | 4 | 176 | Risk Ratio (M‐H, Random, 95% CI) | 0.60 [0.36, 1.00] |
| 2 Differences in HAI/AMS scores Show forest plot | 3 | 50 | Std. Mean Difference (IV, Random, 95% CI) | ‐0.46 [‐1.21, 0.29] |
| Outcome or subgroup title | No. of studies | No. of participants | Statistical method | Effect size |
| 1 Differences in HAI/AMS scores Show forest plot | 2 | 48 | Std. Mean Difference (IV, Random, 95% CI) | ‐0.56 [‐1.85, 0.74] |
| Outcome or subgroup title | No. of studies | No. of participants | Statistical method | Effect size |
| 1 Incidence of AMS Show forest plot | 2 | 60 | Risk Ratio (M‐H, Random, 95% CI) | 0.35 [0.06, 1.95] |
| Outcome or subgroup title | No. of studies | No. of participants | Statistical method | Effect size |
| 1 Incidence of acute mountain sickness Show forest plot | 3 | 598 | Risk Ratio (M‐H, Random, 95% CI) | 0.64 [0.49, 0.82] |