Ecografía para la confirmación de la colocación de la sonda gástrica
Information
- DOI:
- https://doi.org/10.1002/14651858.CD012083.pub2Copy DOI

- Database:
-
- Cochrane Database of Systematic Reviews
- Version published:
-
- 17 April 2017see what's new
- Type:
-
- Diagnostic
- Stage:
-
- Review
- Cochrane Editorial Group:
-
Cochrane Gut Group
- Copyright:
-
- Copyright © 2017 The Cochrane Collaboration. Published by John Wiley & Sons, Ltd.
Article metrics
Altmetric:
Cited by:
Authors
Contributions of authors
HT drafted the protocol and review with contributions from YK and Emma Barber (from the National Center for Child Health and Development).
HT and YK devised the study selection criteria.
HT, YK, YT, MA and Yuhong (Cathy) Yuan (Trials Search Co‐ordinator) undertook the search strategy.
HT, YK and YT developed the study design and research question.
HT, YK and YN developed the statistical analysis/synthesis of data plan.
HT and Yuhong (Cathy) Yuan ran the search strategy.
HT, YK and MA screened the search results.
HT and YK extracted the data and assessed the methodological quality.
All review authors contributed to revising the manuscript, reviewed all drafts and agreed on the final version.
Sources of support
Internal sources
-
Hyogo Prefectural Amagasaki General Medical Center, Japan.
-
Kyoto University, Japan.
-
University of Tokyo, Japan.
-
Shiga University of Medical Science Hospital, Japan.
External sources
-
No sources of support supplied
Declarations of interest
HT: none known.
YT: none known.
YN: none known.
MA: none known.
YK: none known.
Acknowledgements
We would like to thank the editorial team of the Cochrane Upper Gastrointestinal and Pancreatic Diseases Group for their excellent advice and support. We wished to thank Emma Barber of the National Center for Child Health and Development, Tokyo, Japan, for her editorial support of the protocol and Yuhong (Cathy) Yuan, Trials Search Co‐ordinator of the Cochrane Upper Gastrointestinal and Pancreatic Diseases Review Group for designing our search strategy. The methods section of this manuscript was based on the Cochrane protocol, Holland 2013, as a template. We would like to thank Dr Laurie Dontigny‐Duplain of the Department of General Surgery, Université Laval, Quebec City, Canada, for translation, data extraction and QUADAS‐2 assessment of the French article through the Cochrane TaskExchange (taskexchange.cochrane.org). We are grateful to Dr Mbah Okwen Patrick of the Centre for the Development of Best Practices in Health (CDBPH) Yaoundé Central Hospital Yaoundé Cameroon and Alexis Turgeon MD MSc (Épid) FRCPC of the Département d'Anesthésiologie et de Soins Intensifs, Division de Soins Intensifs Adultes Faculté de Médecine, Université Laval, Quebec City, Canada, for data extraction of the French article (for cross‐checking) through the Cochrane TaskExchange. We are also grateful to Dr Eric Maury and Dr Funda Gok for kindly providing additional information about their studies. We wish to thank Mrs Katharina Kunzweiler of Cochrane Germany for translation and data extraction of the German article. We would like to thank Dr Matthias Rinderknecht for data extraction (for cross‐checking) of the German article through the Cochrane TaskExchange.
Version history
| Published | Title | Stage | Authors | Version |
| 2017 Apr 17 | Ultrasonography for confirmation of gastric tube placement | Review | Hiraku Tsujimoto, Yasushi Tsujimoto, Yukihiko Nakata, Mai Akazawa, Yuki Kataoka | |
| 2016 Feb 09 | Ultrasonography for confirmation of gastric tube placement | Protocol | Hiraku Tsujimoto, Yasushi Tsujimoto, Yukihiko Nakata, Mai Akazawa, Yuki Kataoka | |
Differences between protocol and review
We planned to present the sensitivity, specificity, positive and negative likelihood ratios, and diagnostic odds ratio for the detection of appropriate gastric tube placement (Glas 2003); however, we did not calculate the positive predictive value or negative predictive value because these values of individual studies were profoundly affected by the incidence of their studies and might cause confusion for readers when they apply the findings to their own setting. We did not calculate the diagnostic odds ratio because of the sparse data. We did not synthesize the diagnostic accuracy estimates of included studies because of the heterogeneity of the index test (the difference of echo window, combined with other confirmation methods and ultrasound during insertion of the tube). Alternatively, we presented true positive = correct gastric tube placement and correct visualization by ultrasound; false positive = incorrect gastric tube placement but failure to visualize by ultrasound; false negative = correct gastric tube placement but failure to visualize by ultrasound; true negative = incorrect gastric tube placement and correct visualization by ultrasound in summary of findings Table 1. We tailored the QUADAS‐2 tool before application to all included studies in our published protocol for the review because the agreement had been poor and we considered further refinement of the tool was needed (e.g. omitted unimportant signalling questions) (Whiting 2011).
Keywords
MeSH
Medical Subject Headings (MeSH) Keywords
Medical Subject Headings Check Words
Adolescent; Adult; Child; Humans; Middle Aged;

Risk of bias and applicability concerns graph: review authors' judgements about each domain presented as percentages across included studies.
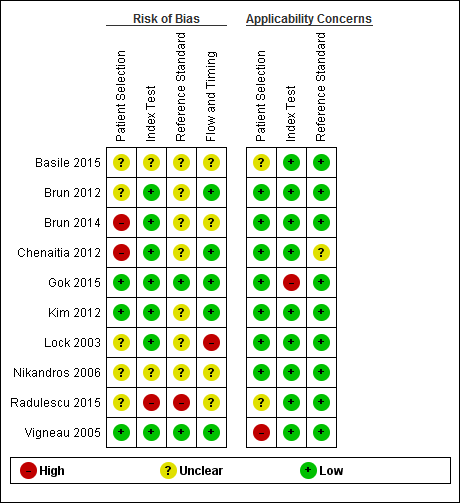
Risk of bias and applicability concerns summary: review authors' judgements about each domain for each included study.

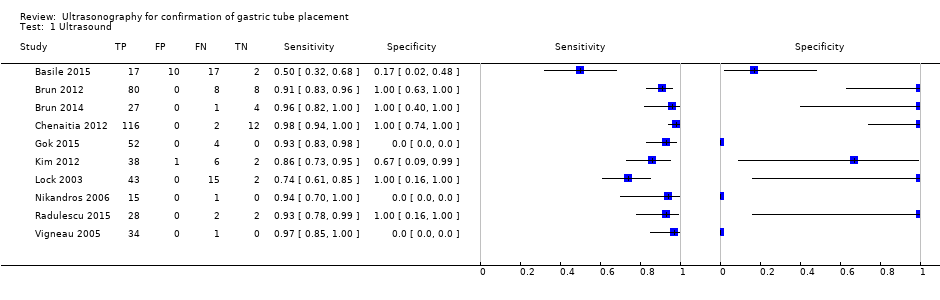
Forest plot of diagnostic accuracy of ultrasound in different ways. Four studies reported the diagnostic accuracy of ultrasound (Brun 2012; Chenaitia 2012; Gok 2015; Radulescu 2015), while the others reported the diagnostic accuracy of ultrasound combined with other methods. Gok 2015 reported the diagnostic accuracy of ultrasound during tube insertion (ultrasound‐guide insertion). We found three visualization methods (echo window) of ultrasound: neck (Gok 2015), epigastric (Brun 2012; Chenaitia 2012; Kim 2012; Lock 2003; Vigneau 2005), and a combination (Brun 2014; Radulescu 2015). Studies used air injection during ultrasound (Basile 2015; Brun 2014), saline injection (Vigneau 2005), both air and saline injection (Kim 2012), and dextrose and air injection (Nikandros 2006). Two studies did not report the echo window (Basile 2015; Nikandros 2006).
| Accuracy of ultrasound for confirmation of gastric tube placement | |||||||||
| Population | Adults in any settings (prehospital, ICU, EMS or unclear) | ||||||||
| Index test | Ultrasound (any methods) | ||||||||
| Reference standard | X‐ray | ||||||||
| Studies | Cross‐sectional study or unclear study designa | ||||||||
| Study ID | TPb | FPb | FNb | TNb | Participants | Sensitivity | Specificity | Methodc | Echo windowc |
| 17 | 10 | 17 | 2 | 46 | 0.50 (0.32 to 0.68) | 0.17 (0.02 to 0.48) | Ultrasound + air injection after insertion | NR | |
| Brun 2012a,d | 80 | 0 | 8 | 8 | 96 | 0.91 (0.83 to 0.96) | 1.00 (0.63 to 1.00) | Ultrasound after insertion | Epigastric |
| 27 | 0 | 1 | 4 | 32 | 0.96 (0.82 to 1.00) | 1.00 (0.40 to 1.00) | Ultrasound + air injection after insertion | Neck + epigastric | |
| 116 | 0 | 2 | 12 | 130 | 0.98 (0.94 to 1.00) | 1.00 (0.74 to 1.00) | Ultrasound after insertion | Epigastric | |
| 52 | 0 | 4 | 0 | 56 | 0.93 (0.83 to 0.98) | Not estimable | Ultrasound during insertion | Neck | |
| 38 | 1 | 6 | 2 | 47 | 0.86 (0.73 to 0.95) | 0.67 (0.09 to 0.99) | Ultrasound + saline and air injection | Neck + epigastric | |
| 43 | 0 | 15 | 2 | 55 (60 measurements)e | 0.74 (0.61 to 0.85) | 1.00 (0.16 to 1.00) | Ultrasound + air injection after insertion | Epigastric | |
| 15 | 0 | 1 | 0 | 16 | 0.94 (0.70 to 1.00) | Not estimable | Ultrasound + dextrose and air injection after insertion | NR | |
| 28 | 0 | 2 | 2 | 32 | 0.93 (0.78 to 0.99) | 1.00 (0.16 to 1.00) | Ultrasound after insertion | Neck + epigastric | |
| 34 | 0 | 1 | 0 | 35 | 0.97 (0.85 to 1.00) | Not estimable | Ultrasound + saline injection after insertion | Epigastric | |
| CI: confidence interval; EMS: emergency medical service; ICU: intensive care unit: FN: false negative; FP: false positive; NR: not reported; TN: true negative; TP: true positive. | |||||||||
| Accuracy of ultrasound for confirmation of gastric tube placement for drainage in settings where X‐ray facilities are not readily available | |||||||||
| Population | Adults underwent gastric tube insertion for drainage in settings where X‐ray facilities are not readily available (prehospital or EMS) | ||||||||
| Index test | Ultrasound (any methods) | ||||||||
| Reference standard | X‐ray | ||||||||
| Studies | Cross‐sectional study or unclear study designa | ||||||||
| Study ID | TPb | FPb | FNb | TNb | Participants | Sensitivity | Specificity | Methodc | Echo windowc |
| Brun 2012c,d | 80 | 0 | 8 | 8 | 96 | 0.91 (0.83 to 0.96) | 1.00 (0.63 to 1.00) | Ultrasound after insertion | Epigastric |
| 27 | 0 | 1 | 4 | 32 | 0.96 (0.82 to 1.00) | 1.00 (0.40 to 1.00) | Ultrasound+ air injection after insertion | Neck + epigastric | |
| 116 | 0 | 2 | 12 | 130 | 0.98 (0.94 to 1.00) | 1.00 (0.74 to 1.00) | Ultrasound after insertion | Epigastric | |
| 38 | 1 | 6 | 2 | 47 | 0.86 (0.73 to 0.95) | 0.67 (0.09 to 0.99) | Ultrasound + saline and air injection | Neck + epigastric | |
| CI: confidence interval; EMS: emergency medical service; FN: false negative; FP: false positive; TN: true negative; TP: true positive. | |||||||||
| Study ID | Male:female | Age | BMI | Children | Non‐sedated | Sedated | Intubated | Diameter | Setting |
| NR | NR | NR | NR | NR | NR | NR | NR | NR | |
| 56:24 | 52 ± 23 | NR | 0 | 0 | 96 | 96 | 14 or 16 | Prehospital | |
| 18:14 | 57 ± 17 | NR | 0 | 22 | 10 | 32 | 14 or 16 | Prehospital | |
| 77:53 | 55.7 ± 19.8 | NR | 0 | 0 | 130 | 130 | 14‐18 | Prehospital | |
| 32:24 | 48.4 ± 28.9 | 27.1 ± 6.4 | 0 | 0 | 56 | 56 | 10‐14 | ICU | |
| 28:19 | 57.6 ± 17.2 | NR | 0 | 0 | 47 | 27 | 16 | EMS | |
| NR | 59.2 ± 16.2 | NR | NR | NR | NR | 50 | 14 or 16 | ICU | |
| 9:7 | 66.3 ± 7.1 | NR | NR | 0 | 16 | 16 | NR | ICU | |
| NR | N/R | NR | NR | NR | NR | NR | NR | NR | |
| 18:16 | 62.2 ± 19.8 | 24.8 ± 5.8 | 0 | 14 | 19 | 26 | 12 | ICU | |
| BMI: body mass index; EMS: emergency medical service; ICU: intensive care unit; NR: not reported; SD: standard deviation. a Reports from the same research group. | |||||||||
| Test | No. of studies | No. of participants |
| 1 Ultrasound Show forest plot | 10 | 550 |