Scolaris Content Display Scolaris Content Display

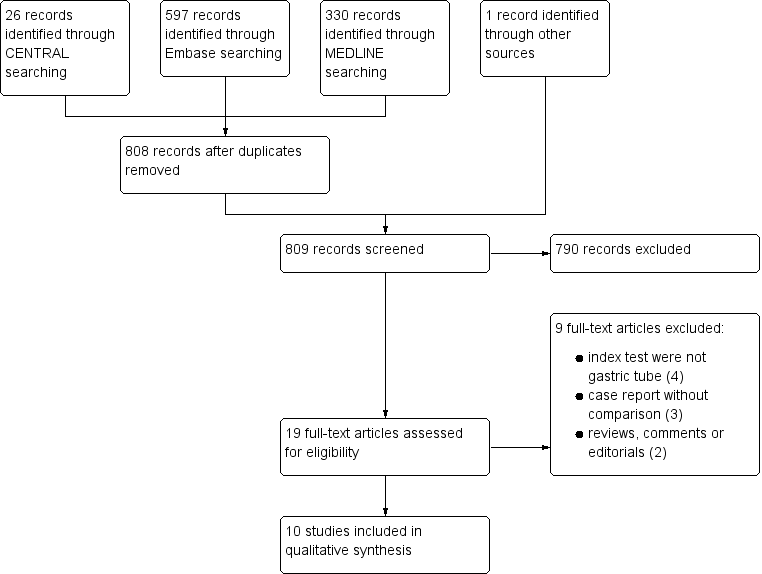
Study flow diagram.
Figures and Tables -
Figure 1

Study flow diagram.

Risk of bias and applicability concerns graph: review authors' judgements about each domain presented as percentages across included studies.
Figures and Tables -
Figure 2

Risk of bias and applicability concerns graph: review authors' judgements about each domain presented as percentages across included studies.

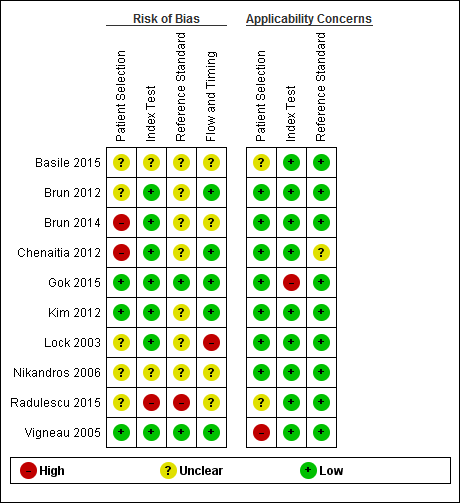
Risk of bias and applicability concerns summary: review authors' judgements about each domain for each included study.
Figures and Tables -
Figure 3

Risk of bias and applicability concerns summary: review authors' judgements about each domain for each included study.

Forest plot of diagnostic accuracy of ultrasound in different ways. Four studies reported the diagnostic accuracy of ultrasound (Brun 2012; Chenaitia 2012; Gok 2015; Radulescu 2015), while the others reported the diagnostic accuracy of ultrasound combined with other methods. Gok 2015 reported the diagnostic accuracy of ultrasound during tube insertion (ultrasound‐guide insertion). We found three visualization methods (echo window) of ultrasound: neck (Gok 2015), epigastric (Brun 2012; Chenaitia 2012; Kim 2012; Lock 2003; Vigneau 2005), and a combination (Brun 2014; Radulescu 2015). Studies used air injection during ultrasound (Basile 2015; Brun 2014), saline injection (Vigneau 2005), both air and saline injection (Kim 2012), and dextrose and air injection (Nikandros 2006). Two studies did not report the echo window (Basile 2015; Nikandros 2006).
Figures and Tables -
Figure 4

Forest plot of diagnostic accuracy of ultrasound in different ways. Four studies reported the diagnostic accuracy of ultrasound (Brun 2012; Chenaitia 2012; Gok 2015; Radulescu 2015), while the others reported the diagnostic accuracy of ultrasound combined with other methods. Gok 2015 reported the diagnostic accuracy of ultrasound during tube insertion (ultrasound‐guide insertion). We found three visualization methods (echo window) of ultrasound: neck (Gok 2015), epigastric (Brun 2012; Chenaitia 2012; Kim 2012; Lock 2003; Vigneau 2005), and a combination (Brun 2014; Radulescu 2015). Studies used air injection during ultrasound (Basile 2015; Brun 2014), saline injection (Vigneau 2005), both air and saline injection (Kim 2012), and dextrose and air injection (Nikandros 2006). Two studies did not report the echo window (Basile 2015; Nikandros 2006).

Ultrasound.
Figures and Tables -
Test 1

Ultrasound.

Summary of findings 1. Accuracy of ultrasound for confirmation of gastric tube placement

Accuracy of ultrasound for confirmation of gastric tube placement

Population

Adults in any settings (prehospital, ICU, EMS or unclear)

Index test

Ultrasound (any methods)

Reference standard

X‐ray

Studies

Cross‐sectional study or unclear study designa

Study ID

TPb

FPb

FNb

TNb

Participants

Sensitivity
(95% CI)

Specificity
(95% CI)

Methodc

Echo windowc

Basile 2015

17

10

17

2

46

0.50 (0.32 to 0.68)

0.17 (0.02 to 0.48)

Ultrasound + air injection after insertion

NR

Brun 2012a,d

80

0

8

8

96

0.91 (0.83 to 0.96)

1.00 (0.63 to 1.00)

Ultrasound after insertion

Epigastric

Brun 2014d

27

0

1

4

32

0.96 (0.82 to 1.00)

1.00 (0.40 to 1.00)

Ultrasound + air injection after insertion

Neck + epigastric

Chenaitia 2012d

116

0

2

12

130

0.98 (0.94 to 1.00)

1.00 (0.74 to 1.00)

Ultrasound after insertion

Epigastric

Gok 2015

52

0

4

0

56

0.93 (0.83 to 0.98)

Not estimable

Ultrasound during insertion

Neck

Kim 2012

38

1

6

2

47

0.86 (0.73 to 0.95)

0.67 (0.09 to 0.99)

Ultrasound + saline and air injection

Neck + epigastric

Lock 2003a

43

0

15

2

55 (60 measurements)e

0.74 (0.61 to 0.85)

1.00 (0.16 to 1.00)

Ultrasound + air injection after insertion

Epigastric

Nikandros 2006a

15

0

1

0

16

0.94 (0.70 to 1.00)

Not estimable

Ultrasound + dextrose and air injection after insertion

NR

Radulescu 2015a

28

0

2

2

32

0.93 (0.78 to 0.99)

1.00 (0.16 to 1.00)

Ultrasound after insertion

Neck + epigastric

Vigneau 2005

34

0

1

0

35

0.97 (0.85 to 1.00)

Not estimable

Ultrasound + saline injection after insertion

Epigastric

CI: confidence interval; EMS: emergency medical service; ICU: intensive care unit: FN: false negative; FP: false positive; NR: not reported; TN: true negative; TP: true positive.
a Unclear study design (either case‐control or cross‐sectional study).
b TP: correct gastric tube placement and correct visualization by ultrasound; FP: incorrect gastric tube placement but not visualized by ultrasound; FN: correct gastric tube placement but not visualized by ultrasound; TN: incorrect gastric tube placement and correct visualization by ultrasound.
c We found several methods of ultrasound to confirm gastric tubes using ultrasound.
d Reports from the same research group.
e 60 tube insertions to 55 participants.

Figures and Tables -
Summary of findings 1. Accuracy of ultrasound for confirmation of gastric tube placement
Summary of findings 2. Accuracy of ultrasound for confirmation of gastric tube placement for drainage in settings where X‐ray facilities are not readily available

Accuracy of ultrasound for confirmation of gastric tube placement for drainage in settings where X‐ray facilities are not readily available

Population

Adults underwent gastric tube insertion for drainage in settings where X‐ray facilities are not readily available (prehospital or EMS)

Index test

Ultrasound (any methods)

Reference standard

X‐ray

Studies

Cross‐sectional study or unclear study designa

Study ID

TPb

FPb

FNb

TNb

Participants

Sensitivity
(95% CI)

Specificity
(95% CI)

Methodc

Echo windowc

Brun 2012c,d

80

0

8

8

96

0.91 (0.83 to 0.96)

1.00 (0.63 to 1.00)

Ultrasound after insertion

Epigastric

Brun 2014d

27

0

1

4

32

0.96 (0.82 to 1.00)

1.00 (0.40 to 1.00)

Ultrasound+ air injection after insertion

Neck + epigastric

Chenaitia 2012d

116

0

2

12

130

0.98 (0.94 to 1.00)

1.00 (0.74 to 1.00)

Ultrasound after insertion

Epigastric

Kim 2012

38

1

6

2

47

0.86 (0.73 to 0.95)

0.67 (0.09 to 0.99)

Ultrasound + saline and air injection

Neck + epigastric

CI: confidence interval; EMS: emergency medical service; FN: false negative; FP: false positive; TN: true negative; TP: true positive.
a Unclear study design (either case‐control or cross‐sectional study).
b TP: correct gastric tube placement and correct visualization by ultrasound; FP: incorrect gastric tube placement but not visualized by ultrasound; FN: correct gastric tube placement but not visualized by ultrasound; TN: incorrect gastric tube placement and correct visualization by ultrasound.
c We found several methods of ultrasound to confirm gastric tubes using ultrasound.
d Reports from the same research group.

Figures and Tables -
Summary of findings 2. Accuracy of ultrasound for confirmation of gastric tube placement for drainage in settings where X‐ray facilities are not readily available
Table 1. Baseline characteristics of included studies

Study ID

Male:female

Age
(mean ± SD)

BMI
(mean ± SD)

Children

Non‐sedated

Sedated

Intubated

Diameter
of tube (Fr)

Setting

Basile 2015

NR

NR

NR

NR

NR

NR

NR

NR

NR

Brun 2012a

56:24

52 ± 23

NR

0

0

96

96

14 or 16

Prehospital

Brun 2014a

18:14

57 ± 17

NR

0

22

10

32

14 or 16

Prehospital

Chenaitia 2012a

77:53

55.7 ± 19.8

NR

0

0

130

130

14‐18

Prehospital

Gok 2015

32:24

48.4 ± 28.9

27.1 ± 6.4

0

0

56

56

10‐14

ICU

Kim 2012

28:19

57.6 ± 17.2

NR

0

0

47

27

16

EMS

Lock 2003

NR

59.2 ± 16.2

NR

NR

NR

NR

50

14 or 16

ICU

Nikandros 2006

9:7

66.3 ± 7.1

NR

NR

0

16

16

NR

ICU

Radulescu 2015

NR

N/R

NR

NR

NR

NR

NR

NR

NR

Vigneau 2005

18:16

62.2 ± 19.8

24.8 ± 5.8

0

14

19

26

12

ICU

BMI: body mass index; EMS: emergency medical service; ICU: intensive care unit; NR: not reported; SD: standard deviation.

a Reports from the same research group.

Figures and Tables -
Table 1. Baseline characteristics of included studies
Table Tests. Data tables by test

Test

No. of studies

No. of participants

1 Ultrasound Show forest plot

10

550

Figures and Tables -
Table Tests. Data tables by test