Milnacipran for neuropathic pain and fibromyalgia in adults
References
References to studies included in this review
References to studies excluded from this review
References to ongoing studies
Additional references
Characteristics of studies
Characteristics of included studies [ordered by study ID]
Jump to:
| Methods | Prospective, multicentre, randomised, double‐blinded, placebo‐controlled trial with parallel groups. Participants recruited from outpatient clinical/research centres in US and Canada. 1 to 4‐week screening and washout (all FM therapy stopped), 4 to 6‐week flexible dose titration, 12‐week stable dose of 100 mg/day milnacipran (50 mg twice daily). Participants unable to tolerate 100 mg daily were discontinued from study Data collected using electronic patient experience diary (PED); pain improvement based on time weighted average of mean weekly 24 h recall pain scores | |
| Participants | Inclusion: age 18 to 70 years, ACR criteria for FM; physical function (FIQ) ≥ 4, and BDI > 25 at screening, mean PI ≥ 40 and ≤ 90/100 mm over 14‐day baseline period Excluded patients with various medical and psychiatric conditions/risk factors, and previous exposure to milnacipran; female participants not using adequate contraception N = 1025: mean age ˜49 years, M:F 48:977, 91% white, mean duration of symptoms ˜10.8 years, baseline pain > 60/100 mm | |
| Interventions | Milnacipran 100 mg/day, n = 516 Placebo, n = 509 Permitted analgesics: paracetamol, aspirin, NSAIDs Short‐term rescue medication up to week 4: tramadol, hydrocodone | |
| Outcomes | Pain intensity using 100 mm VAS: 30% and 50% improvement from baseline PGIC using 7‐point scale: much or very much improved Composite pain scores: 2‐measure BOCF composite responder criteria: 24 h and weekly recall pain scores using 100 mm VAS ≥ 30% and PGIC score 'much' or 'very much' improved on 7‐point scale 3‐measure BOCF composite responder criteria: 24 h and weekly recall pain scores using 100 mm VAS ≥ 30%, PGIC score 'much' or 'very much' improved on 7‐point scale, and SF‐36 PCS ≥ 6‐point improvement Adverse events Withdrawals | |
| Notes | Oxford Quality Score: R = 1, DB = 2, W = 1. Total = 4 | |
| Risk of bias | ||
| Bias | Authors' judgement | Support for judgement |
| Random sequence generation (selection bias) | Unclear risk | "Randomization assignments generated in blocks of four" |
| Allocation concealment (selection bias) | Low risk | "Assignments to treatment groups was conducted centrally (i.e. at the study level) using an interactive voice response system" |
| Blinding of participants and personnel (performance bias) | Low risk | "identical‐appearing capsules were used by all patients during all phases of the study" |
| Blinding of outcome assessment (detection bias) | Low risk | "Clinical staff, investigators, patients, and the study sponsor were blinded to treatment allocation" |
| Incomplete outcome data (attrition bias) | High risk | Last observation carried forward in analysis of individual outcomes, but baseline observation carried forward in analysis of composite outcomes |
| Selective reporting (reporting bias) | Low risk | All relevant outcomes in methods were reported in some way, although not necessarily as our preferred outcome |
| Size | Low risk | Both groups > 200 participants |
| Methods | Prospective, multicentre, randomised, double‐blinded, placebo‐controlled trial with parallel groups. Participants recruited from outpatient centres in Europe. 1 to 4‐week screening and washout (all FM therapy stopped), 4‐week dose escalation, 12‐week stable dose with target 200 mg/day milnacipran (100 mg twice daily), 9‐day down‐titration, 2‐week follow‐up Data collected using electronic patient experience diary (PED): daily pain intensity averaged for 2 weeks immediately preceding visit day Adverse event data collected by spontaneous reporting, non‐leading questions and clinical evaluation | |
| Participants | Inclusion: age 18 to 70 years, met ACR criteria for FM; physical function (FIQ) ≥ 3, BDI > 25 at screening; mean PI ≥ 40 and ≥ 90 over 14‐day baseline period Exclusion: patients with various medical and psychiatric conditions/risk factors, considered unlikely to comply with treatment; female participants not using adequate contraception or pregnant N = 884: mean age ˜49 years, M:F 58:826, mean duration of symptoms ˜9.5 years | |
| Interventions | Milnacipran 200 mg/day, n = 435 Placebo, n = 449 | |
| Outcomes | Pain intensity using 100 mm VAS: 30% improvement from baseline PGIC using 7‐point scale: much or very much improved Composite pain score: 2‐measure BOCF composite responder criteria: 24 h morning recall pain scores ≥ 30% using 100 mm VAS, PGIC score of 'very much' or 'much' improved Adverse events Withdrawals | |
| Notes | Oxford Quality Score: R = 1, DB = 2, W = 1. Total = 4 | |
| Risk of bias | ||
| Bias | Authors' judgement | Support for judgement |
| Random sequence generation (selection bias) | Unclear risk | Not described |
| Allocation concealment (selection bias) | Unclear risk | Not described |
| Blinding of participants and personnel (performance bias) | Low risk | "In patients receiving placebo, twice‐daily sham dosing was used to maintain blinding" |
| Blinding of outcome assessment (detection bias) | Unclear risk | Not described |
| Incomplete outcome data (attrition bias) | High risk | Last observation carried forward in analysis of individual outcomes, but baseline observation carried forward in analysis of composite outcomes |
| Selective reporting (reporting bias) | Low risk | All relevant outcomes in methods were reported in some way, although not necessarily as our preferred outcome |
| Size | Low risk | Both groups > 200 participants |
| Methods | Prospective, multicentre, randomised, double‐blinded, placebo‐controlled trial with parallel groups. Participants recruited from outpatient centres in United States. 1 to 4‐week washout (all FM therapy stopped), 3‐week dose escalation, 12‐week stable dose with 100 mg/day (50 mg twice daily) or 200 mg/day (100 mg twice daily) milnacipran Data collected using electronic patient experience diary (PED): daily pain intensity averaged for 2 weeks immediately preceding visit day Adverse event data collected by spontaneous reporting and clinical evaluation | |
| Participants | Inclusion: age 18 to 70 years, met ACR criteria for FM, physical function (FIQ) ≥ 4 and BDI > 25 at screening, baseline PI ≥ 40/100 Excluded: various medical and psychiatric conditions/risk factors, interfering medication over the last 30 days, female participants not using adequate contraception or pregnant N = 1151: mean age ˜50 years, M:F 45:1151, ˜93% white, mean duration of symptoms ˜10 years, baseline pain > 60/100 mm | |
| Interventions | Milnacipran 100 mg/day, n = 401 (396 for analysis) Milnacipran 200 mg/day, n = 410 (399 for analyses) Placebo, n = 405 (401 for analysis) | |
| Outcomes | Pain intensity using 100 mm VAS: 30% improvement from baseline PGIC using 7‐point scale: much or very much improved Composite pain scores: 2‐measure BOCF composite responder criteria: 24 h and weekly recall pain scores using 100 mm VAS ≥ 30% and PGIC score 'much' or 'very much' improved on 7‐point scale 3‐measure BOCF composite responder criteria: 24 h and weekly recall pain scores using 100 mm VAS ≥ 30%, PGIC score 'much' or 'very much' improved on 7‐point scale, and SF‐36 PCS ≥ 6‐point improvement Adverse events Withdrawals | |
| Notes | Oxford Quality Score: R = 2, DB = 2, W = 1, Total = 5/5 | |
| Risk of bias | ||
| Bias | Authors' judgement | Support for judgement |
| Random sequence generation (selection bias) | Low risk | "Randomization lists for each site were generated by a computer program" |
| Allocation concealment (selection bias) | Low risk | "randomization assignments were made via an interactive voice response system" |
| Blinding of participants and personnel (performance bias) | Low risk | "Milnacipran and placebo capsules were visually identical." |
| Blinding of outcome assessment (detection bias) | Low risk | "Clinical staff, investigators, patients, and the study sponsor were blinded to treatment allocation." |
| Incomplete outcome data (attrition bias) | High risk | Last observation carried forward in analysis of individual outcomes, but baseline observation carried forward in analysis of composite outcomes |
| Selective reporting (reporting bias) | Low risk | All relevant outcomes in methods were reported in some way, although not necessarily as our preferred outcome |
| Size | Low risk | All groups > 200 participants |
| Methods | Prospective, multicentre, randomised, double‐blinded, placebo‐controlled trial with parallel groups. Participants recruited from 59 outpatient clinical/research centres in the United States Electronic patient experience diary (PED) used to collect data; 1 to 4‐week screening and washout (all FM therapy stopped), 3‐week baseline measurement and PED training, 24‐week stable dose with placebo or 100 mg/day milnacipran (50 mg twice daily) or 200 mg/day (100 mg twice daily) milnacipran (ratio 1:1:2 respectively) Adverse events collected from spontaneous reports, clinical observation and clinical evaluation | |
| Participants | Inclusion: age 18 to 70 years, met ACR criteria for FM, physical function (FIQ) ≥ 4, BDI > 25, and PI > 50/100 mm Exclusion: patients with various medical and psychiatric conditions/risk factors; female participants not using adequate contraception N = 888: mean age ˜49 years, M:F 39:849, ˜93% white, mean duration of symptoms ˜5.5 years, baseline PI > 60/100 at screening Analgesics prohibited, except for acetaminophen, aspirin, stable doses of NSAIDs, and hydrocortisone | |
| Interventions | Milnacipran 100 mg/day, n = 224 Milnacipran 200 mg/day, n = 441 Placebo, n = 223 | |
| Outcomes | Composite pain scores: 2‐measure BOCF composite responder criteria: 24 h and 2‐week average recall pain scores using 100 mm VAS ≥ 30% and PGIC score 'much' or 'very much' improved on 7‐point scale 3‐measure BOCF composite responder criteria: 24 h and weekly recall pain scores using 100 mm VAS ≥ 30%, PGIC score 'much' or 'very much' improved on 7‐point scale, and SF‐36 PCS ≥ 6‐point improvement Adverse events Withdrawals | |
| Notes | Oxford Quality Score: R = 1, DB = 1, W = 1. Total = 3/5 | |
| Risk of bias | ||
| Bias | Authors' judgement | Support for judgement |
| Random sequence generation (selection bias) | Unclear risk | No described |
| Allocation concealment (selection bias) | Unclear risk | Not described |
| Blinding of participants and personnel (performance bias) | Unclear risk | Not described |
| Blinding of outcome assessment (detection bias) | Unclear risk | Not described |
| Incomplete outcome data (attrition bias) | High risk | Last observation carried forward in individual outcome analysis |
| Selective reporting (reporting bias) | Low risk | All relevant outcomes in methods were reported in some way, although not necessarily as our preferred outcome |
| Size | Low risk | All groups > 200 participants |
| Methods | Prospective, multicentre, randomised, double‐blinded, placebo‐controlled trial with parallel groups. Participants recruited from outpatient centres in US with experience in treating fibromyalgia. Electronic patient experience diary (PED) used to collect data; 1 to 4‐week screening and washout (all FM therapy stopped), 2 week baseline measurement and PED training, 4‐week dose titration, 8‐week stable dose with 200 mg/day milnacipran (once daily), 200 mg/day milnacipran (100 mg twice daily), or placebo (ratio 3:3:2 respectively) Adverse events collected from spontaneous reports, clinical observation and clinical evaluation | |
| Participants | Inclusion: age 18 to 70 years, met ACR criteria for FM; baseline PI ≥ 10/20 (Gracely log‐scale) Exclusion: patients with various medical and psychiatric conditions/risk factors, female participants not using adequate contraception N = 125 participants; mean age 46 to 48 years, 96% to 98% female, 79% to 89% Caucasian, mean duration of symptoms 3.8 to 4.3 years Analgesics prohibited, except for stable doses of acetaminophen, aspirin, and NSAIDs | |
| Interventions | Milnacipran 200 mg/day (once daily), n = 46 Milnacipran 200 mg/day (twice daily), n = 51 Placebo comparator, n = 28 | |
| Outcomes | Pain (Short‐form McGill Pain Questionnaire, visual analogue scale, Gracely and Kwilosz anchored logarithmic scale) PGIC at end of study (completers analysis only) Adverse events Withdrawals | |
| Notes | Oxford Quality Score: R = 2 (from Gendreau 2005), DB = 2 (from Gendreau 2005), W = 1. Total = 5/5 | |
| Risk of bias | ||
| Bias | Authors' judgement | Support for judgement |
| Random sequence generation (selection bias) | Low risk | "Randomization was performed by an independent contract research organization that generated randomisation assignments" (from Gendreau 2005) |
| Allocation concealment (selection bias) | Unclear risk | Not described |
| Blinding of participants and personnel (performance bias) | Low risk | "Blinding was rigorously maintained, as all patients took capsules morning and evening that were visually identical" (from Gendreau 2005) |
| Blinding of outcome assessment (detection bias) | Low risk | "Patients and investigators remained blinded to patients' treatment allocation" (from Gendreau 2005) |
| Incomplete outcome data (attrition bias) | High risk | Last observation carried forward for all analyses |
| Selective reporting (reporting bias) | Low risk | All relevant outcomes in methods were reported in some way, although not necessarily as our preferred outcome |
| Size | High risk | All groups ≤ 51 |
ACR: American College of Rheumatology; BDI: Beck Depression Inventory, BOCF: baseline observation carried forward; DB: double‐blinding; FIQ: fibromyalgia impact questionnaire; FM: fibromyalgia; h: hour; NSAIDS: non‐steroidal anti‐inflammatory drugs; PCS: physical component summary; PED: patient experience diary; PGIC: patient global impression of change; PI: pain intensity; R: randomisation; VAS: visual analogue scale; W: withdrawals
Characteristics of excluded studies [ordered by study ID]
Jump to:
| Study | Reason for exclusion |
| Participants from Branco 2010 re‐randomised for extension study | |
| No placebo control (trial followed a 6‐month lead‐in study, where placebo controls were re‐randomised to treatment with milnacipran) | |
| Open‐label study |
Characteristics of ongoing studies [ordered by study ID]
Jump to:
| Trial name or title | An exploratory randomized placebo controlled trial of milnacipran in patients with chronic neuropathic low back pain |
| Methods | Randomised, double blind, placebo‐controlled, parallel‐group, 6 weeks |
| Participants | History of low back pain for a minimum of 6 months with radiation to leg or buttocks VAS pain > 50/100 Age 18 to 70 years |
| Interventions | Titration to 2 x 50 mg milnacipran daily, or placebo Option to increase to 2 x 100 mg daily after 2 weeks |
| Outcomes | Effect size of pain outcome measures (several pain outcome measures in the form of surveys will be used) Visual analogue pain scale, Brief Pain Index, McGill Pain Questionnaire, physical activity measurement, adverse events |
| Starting date | October 2010 |
| Contact information | Danielle Barkema (d‐[email protected]) |
| Notes | Recruiting (March 2011) |
| Trial name or title | A placebo controlled, randomized, double blind trial of milnacipran for the treatment of idiopathic neuropathy pain |
| Methods | Randomised, double‐blind, placebo‐controlled, parallel‐group, 11 weeks |
| Participants | Patients with signs and symptoms of a peripheral neuropathy, with either abnormal nerve conductions or abnormal epidermal nerve fibre density with neuropathic pain Age 18 to 80 years Pain ≥ 6 months |
| Interventions | Titration to 2 x 50 mg milnacipran daily, or placebo |
| Outcomes | Change in average 11‐point Likert pain scale (0 to 10) Change in Rand‐36 Item Quality of Life Scale |
| Starting date | November 2010 |
| Contact information | Thomas H Brannagan, MD |
| Notes | Recruiting (August 2011) |
VAS: visual analogue scale
Data and analyses
| Outcome or subgroup title | No. of studies | No. of participants | Statistical method | Effect size |
| 1 At least 30% pain relief Show forest plot | 2 | 1825 | Risk Ratio (M‐H, Fixed, 95% CI) | 1.39 [1.23, 1.58] |
| Analysis 1.1 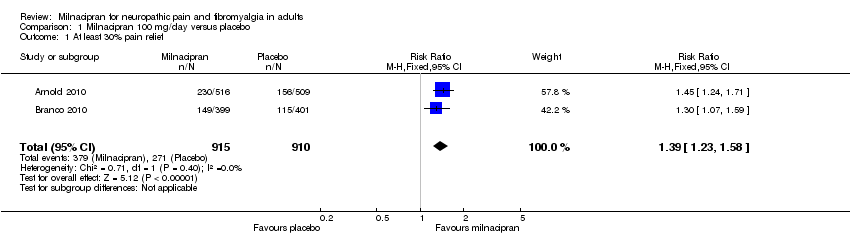 Comparison 1 Milnacipran 100 mg/day versus placebo, Outcome 1 At least 30% pain relief. | ||||
| 2 PGIC 'much improved' or 'very much improved' Show forest plot | 2 | 1825 | Risk Ratio (M‐H, Fixed, 95% CI) | 1.52 [1.32, 1.74] |
| Analysis 1.2  Comparison 1 Milnacipran 100 mg/day versus placebo, Outcome 2 PGIC 'much improved' or 'very much improved'. | ||||
| 3 Composite 1 Show forest plot | 3 | 2272 | Risk Ratio (M‐H, Fixed, 95% CI) | 1.46 [1.25, 1.71] |
| Analysis 1.3  Comparison 1 Milnacipran 100 mg/day versus placebo, Outcome 3 Composite 1. | ||||
| 4 Composite 2 Show forest plot | 3 | 2272 | Risk Ratio (M‐H, Fixed, 95% CI) | 1.73 [1.41, 2.14] |
| Analysis 1.4 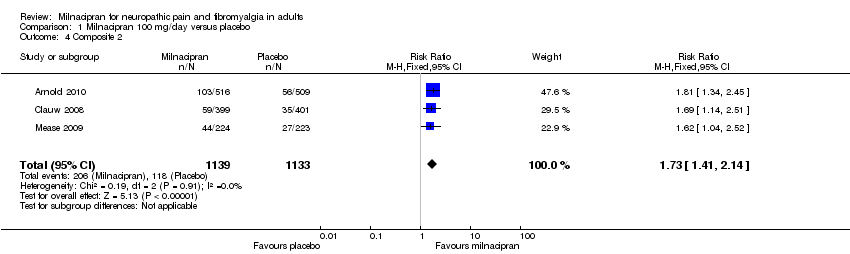 Comparison 1 Milnacipran 100 mg/day versus placebo, Outcome 4 Composite 2. | ||||
| 5 At least one adverse event Show forest plot | 3 | 2272 | Risk Ratio (M‐H, Fixed, 95% CI) | 1.10 [1.06, 1.14] |
| Analysis 1.5  Comparison 1 Milnacipran 100 mg/day versus placebo, Outcome 5 At least one adverse event. | ||||
| 6 Serious adverse events Show forest plot | 3 | 2272 | Risk Ratio (M‐H, Fixed, 95% CI) | 0.88 [0.45, 1.73] |
| Analysis 1.6  Comparison 1 Milnacipran 100 mg/day versus placebo, Outcome 6 Serious adverse events. | ||||
| 7 Individual adverse events Show forest plot | 3 | Risk Ratio (M‐H, Fixed, 95% CI) | Subtotals only | |
| Analysis 1.7  Comparison 1 Milnacipran 100 mg/day versus placebo, Outcome 7 Individual adverse events. | ||||
| 7.1 Nausea | 3 | 2272 | Risk Ratio (M‐H, Fixed, 95% CI) | 1.73 [1.50, 1.98] |
| 7.2 Headache | 3 | 2272 | Risk Ratio (M‐H, Fixed, 95% CI) | 1.21 [1.00, 1.46] |
| 7.3 Constipation | 3 | 2272 | Risk Ratio (M‐H, Fixed, 95% CI) | 4.12 [2.97, 5.71] |
| 7.4 Hot flush | 3 | 2272 | Risk Ratio (M‐H, Fixed, 95% CI) | 4.25 [2.86, 6.31] |
| 7.5 Dizziness | 3 | 2272 | Risk Ratio (M‐H, Fixed, 95% CI) | 2.02 [1.49, 2.74] |
| 7.6 Palpitations | 3 | 2272 | Risk Ratio (M‐H, Fixed, 95% CI) | 3.02 [1.97, 4.63] |
| 7.7 Insomnia | 3 | 2272 | Risk Ratio (M‐H, Fixed, 95% CI) | 1.19 [0.92, 1.53] |
| 7.8 Increased heart rate/tachycardia | 3 | 2272 | Risk Ratio (M‐H, Fixed, 95% CI) | 5.42 [2.87, 10.25] |
| 7.9 Hyperhidrosis | 3 | 2272 | Risk Ratio (M‐H, Fixed, 95% CI) | 5.09 [3.05, 8.50] |
| 7.10 Diarrhoea | 3 | 2272 | Risk Ratio (M‐H, Fixed, 95% CI) | 0.83 [0.59, 1.18] |
| 7.11 Vomiting | 2 | 1247 | Risk Ratio (M‐H, Fixed, 95% CI) | 2.70 [1.44, 5.05] |
| 7.12 Sinusitis | 2 | 1247 | Risk Ratio (M‐H, Fixed, 95% CI) | 0.92 [0.58, 1.45] |
| 7.13 Hypertension | 2 | 1825 | Risk Ratio (M‐H, Fixed, 95% CI) | 4.71 [2.47, 8.96] |
| 7.14 Fatigue | 2 | 1825 | Risk Ratio (M‐H, Fixed, 95% CI) | 1.27 [0.86, 1.86] |
| 7.15 URTI | 2 | 1472 | Risk Ratio (M‐H, Fixed, 95% CI) | 0.90 [0.59, 1.37] |
| 8 All‐cause withdrawals Show forest plot | 3 | 2272 | Risk Ratio (M‐H, Fixed, 95% CI) | 1.14 [1.02, 1.29] |
| Analysis 1.8  Comparison 1 Milnacipran 100 mg/day versus placebo, Outcome 8 All‐cause withdrawals. | ||||
| 9 Lack of efficacy withdrawals Show forest plot | 3 | 2272 | Risk Ratio (M‐H, Fixed, 95% CI) | 0.75 [0.57, 1.00] |
| Analysis 1.9  Comparison 1 Milnacipran 100 mg/day versus placebo, Outcome 9 Lack of efficacy withdrawals. | ||||
| 10 Adverse event withdrawals Show forest plot | 3 | 2272 | Risk Ratio (M‐H, Fixed, 95% CI) | 1.61 [1.32, 1.97] |
| Analysis 1.10  Comparison 1 Milnacipran 100 mg/day versus placebo, Outcome 10 Adverse event withdrawals. | ||||
| Outcome or subgroup title | No. of studies | No. of participants | Statistical method | Effect size |
| 1 At least 30% pain relief Show forest plot | 3 | 1798 | Risk Ratio (M‐H, Fixed, 95% CI) | 1.35 [1.18, 1.54] |
| Analysis 2.1  Comparison 2 Milnacipran 200 mg/day versus placebo, Outcome 1 At least 30% pain relief. | ||||
| 2 PGIC 'much improved' or 'very much improved' Show forest plot | 2 | 1673 | Risk Ratio (M‐H, Fixed, 95% CI) | 1.57 [1.34, 1.83] |
| Analysis 2.2  Comparison 2 Milnacipran 200 mg/day versus placebo, Outcome 2 PGIC 'much improved' or 'very much improved'. | ||||
| 3 Composite 1 Show forest plot | 3 | 2337 | Risk Ratio (M‐H, Fixed, 95% CI) | 1.91 [1.59, 2.29] |
| Analysis 2.3  Comparison 2 Milnacipran 200 mg/day versus placebo, Outcome 3 Composite 1. | ||||
| 4 Composite 2 Show forest plot | 2 | 1461 | Risk Ratio (M‐H, Fixed, 95% CI) | 1.61 [1.21, 2.13] |
| Analysis 2.4  Comparison 2 Milnacipran 200 mg/day versus placebo, Outcome 4 Composite 2. | ||||
| 5 At least one adverse event Show forest plot | 3 | 2338 | Risk Ratio (M‐H, Fixed, 95% CI) | 1.10 [1.06, 1.15] |
| Analysis 2.5  Comparison 2 Milnacipran 200 mg/day versus placebo, Outcome 5 At least one adverse event. | ||||
| 6 Serious adverse events Show forest plot | 4 | 2463 | Risk Ratio (M‐H, Fixed, 95% CI) | 0.91 [0.52, 1.60] |
| Analysis 2.6 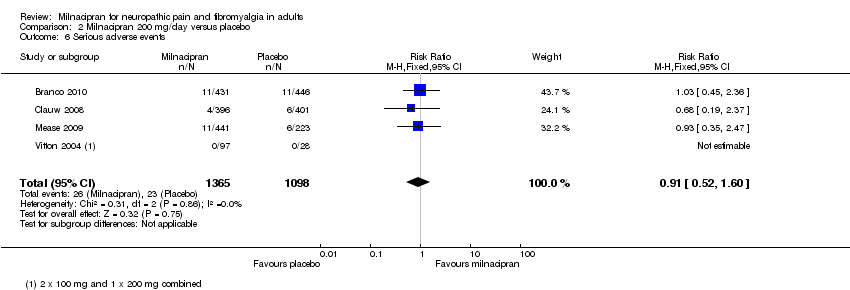 Comparison 2 Milnacipran 200 mg/day versus placebo, Outcome 6 Serious adverse events. | ||||
| 7 Individual adverse events Show forest plot | 3 | Risk Ratio (M‐H, Fixed, 95% CI) | Subtotals only | |
| Analysis 2.7  Comparison 2 Milnacipran 200 mg/day versus placebo, Outcome 7 Individual adverse events. | ||||
| 7.1 Nausea | 3 | 2338 | Risk Ratio (M‐H, Fixed, 95% CI) | 2.37 [2.00, 2.80] |
| 7.2 Headache | 3 | 2338 | Risk Ratio (M‐H, Fixed, 95% CI) | 1.35 [1.10, 1.64] |
| 7.3 Constipation | 3 | 2338 | Risk Ratio (M‐H, Fixed, 95% CI) | 5.01 [3.46, 7.24] |
| 7.4 Hot flush | 3 | 2338 | Risk Ratio (M‐H, Fixed, 95% CI) | 6.71 [4.06, 11.09] |
| 7.5 Dizziness | 3 | 2338 | Risk Ratio (M‐H, Fixed, 95% CI) | 1.63 [1.22, 2.18] |
| 7.6 Palpitations | 3 | 2288 | Risk Ratio (M‐H, Fixed, 95% CI) | 3.38 [2.17, 5.29] |
| 7.7 Insomnia | 3 | 2338 | Risk Ratio (M‐H, Fixed, 95% CI) | 1.45 [1.11, 1.89] |
| 7.8 Increased heart rate/tachycardia | 3 | 2338 | Risk Ratio (M‐H, Fixed, 95% CI) | 6.81 [3.54, 13.13] |
| 7.9 Hyperhidrosis | 2 | 1461 | Risk Ratio (M‐H, Fixed, 95% CI) | 5.18 [2.67, 10.02] |
| 7.10 Diarrhoea | 2 | 1461 | Risk Ratio (M‐H, Fixed, 95% CI) | 0.63 [0.40, 0.99] |
| 7.11 Vomiting | 3 | 2338 | Risk Ratio (M‐H, Fixed, 95% CI) | 2.30 [1.48, 3.58] |
| 7.12 Sinusitis | 2 | 1461 | Risk Ratio (M‐H, Fixed, 95% CI) | 1.14 [0.76, 1.70] |
| 8 All‐cause withdrawals Show forest plot | 4 | 2416 | Risk Ratio (M‐H, Fixed, 95% CI) | 1.38 [1.22, 1.57] |
| Analysis 2.8  Comparison 2 Milnacipran 200 mg/day versus placebo, Outcome 8 All‐cause withdrawals. | ||||
| 9 Lack of efficacy withdrawals Show forest plot | 4 | 2462 | Risk Ratio (M‐H, Fixed, 95% CI) | 0.66 [0.51, 0.87] |
| Analysis 2.9 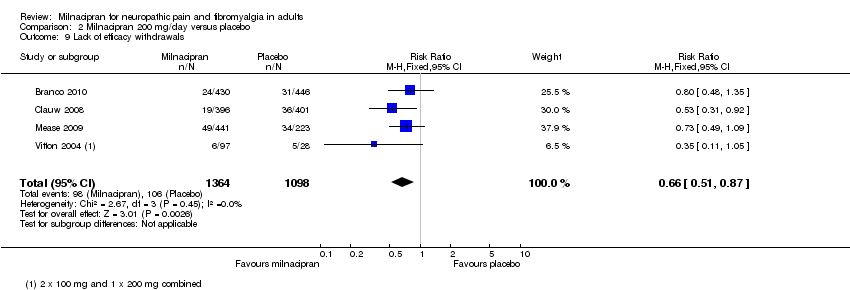 Comparison 2 Milnacipran 200 mg/day versus placebo, Outcome 9 Lack of efficacy withdrawals. | ||||
| 10 Adverse event withdrawals Show forest plot | 4 | 2470 | Risk Ratio (M‐H, Fixed, 95% CI) | 2.51 [2.03, 3.09] |
| Analysis 2.10  Comparison 2 Milnacipran 200 mg/day versus placebo, Outcome 10 Adverse event withdrawals. | ||||

'Risk of bias' graph: review authors' judgements about each risk of bias item presented as percentages across all included studies.
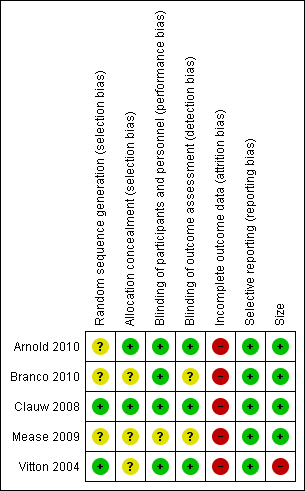
'Risk of bias' summary: review authors' judgements about each risk of bias item for each included study.

Forest plot of comparison: 1 Milnacipran 100 mg/day versus placebo, outcome: 1.1 At least 30% pain relief.

Forest plot of comparison: 1 Milnacipran 100 mg/day versus placebo, outcome: 1.7 Individual adverse events.
Comparison 1 Milnacipran 100 mg/day versus placebo, Outcome 1 At least 30% pain relief.
Comparison 1 Milnacipran 100 mg/day versus placebo, Outcome 2 PGIC 'much improved' or 'very much improved'.
Comparison 1 Milnacipran 100 mg/day versus placebo, Outcome 3 Composite 1.
Comparison 1 Milnacipran 100 mg/day versus placebo, Outcome 4 Composite 2.
Comparison 1 Milnacipran 100 mg/day versus placebo, Outcome 5 At least one adverse event.
Comparison 1 Milnacipran 100 mg/day versus placebo, Outcome 6 Serious adverse events.
Comparison 1 Milnacipran 100 mg/day versus placebo, Outcome 7 Individual adverse events.
Comparison 1 Milnacipran 100 mg/day versus placebo, Outcome 8 All‐cause withdrawals.
Comparison 1 Milnacipran 100 mg/day versus placebo, Outcome 9 Lack of efficacy withdrawals.
Comparison 1 Milnacipran 100 mg/day versus placebo, Outcome 10 Adverse event withdrawals.
Comparison 2 Milnacipran 200 mg/day versus placebo, Outcome 1 At least 30% pain relief.
Comparison 2 Milnacipran 200 mg/day versus placebo, Outcome 2 PGIC 'much improved' or 'very much improved'.
Comparison 2 Milnacipran 200 mg/day versus placebo, Outcome 3 Composite 1.
Comparison 2 Milnacipran 200 mg/day versus placebo, Outcome 4 Composite 2.
Comparison 2 Milnacipran 200 mg/day versus placebo, Outcome 5 At least one adverse event.
Comparison 2 Milnacipran 200 mg/day versus placebo, Outcome 6 Serious adverse events.
Comparison 2 Milnacipran 200 mg/day versus placebo, Outcome 7 Individual adverse events.
Comparison 2 Milnacipran 200 mg/day versus placebo, Outcome 8 All‐cause withdrawals.
Comparison 2 Milnacipran 200 mg/day versus placebo, Outcome 9 Lack of efficacy withdrawals.
Comparison 2 Milnacipran 200 mg/day versus placebo, Outcome 10 Adverse event withdrawals.
| Outcome or subgroup title | No. of studies | No. of participants | Statistical method | Effect size |
| 1 At least 30% pain relief Show forest plot | 2 | 1825 | Risk Ratio (M‐H, Fixed, 95% CI) | 1.39 [1.23, 1.58] |
| 2 PGIC 'much improved' or 'very much improved' Show forest plot | 2 | 1825 | Risk Ratio (M‐H, Fixed, 95% CI) | 1.52 [1.32, 1.74] |
| 3 Composite 1 Show forest plot | 3 | 2272 | Risk Ratio (M‐H, Fixed, 95% CI) | 1.46 [1.25, 1.71] |
| 4 Composite 2 Show forest plot | 3 | 2272 | Risk Ratio (M‐H, Fixed, 95% CI) | 1.73 [1.41, 2.14] |
| 5 At least one adverse event Show forest plot | 3 | 2272 | Risk Ratio (M‐H, Fixed, 95% CI) | 1.10 [1.06, 1.14] |
| 6 Serious adverse events Show forest plot | 3 | 2272 | Risk Ratio (M‐H, Fixed, 95% CI) | 0.88 [0.45, 1.73] |
| 7 Individual adverse events Show forest plot | 3 | Risk Ratio (M‐H, Fixed, 95% CI) | Subtotals only | |
| 7.1 Nausea | 3 | 2272 | Risk Ratio (M‐H, Fixed, 95% CI) | 1.73 [1.50, 1.98] |
| 7.2 Headache | 3 | 2272 | Risk Ratio (M‐H, Fixed, 95% CI) | 1.21 [1.00, 1.46] |
| 7.3 Constipation | 3 | 2272 | Risk Ratio (M‐H, Fixed, 95% CI) | 4.12 [2.97, 5.71] |
| 7.4 Hot flush | 3 | 2272 | Risk Ratio (M‐H, Fixed, 95% CI) | 4.25 [2.86, 6.31] |
| 7.5 Dizziness | 3 | 2272 | Risk Ratio (M‐H, Fixed, 95% CI) | 2.02 [1.49, 2.74] |
| 7.6 Palpitations | 3 | 2272 | Risk Ratio (M‐H, Fixed, 95% CI) | 3.02 [1.97, 4.63] |
| 7.7 Insomnia | 3 | 2272 | Risk Ratio (M‐H, Fixed, 95% CI) | 1.19 [0.92, 1.53] |
| 7.8 Increased heart rate/tachycardia | 3 | 2272 | Risk Ratio (M‐H, Fixed, 95% CI) | 5.42 [2.87, 10.25] |
| 7.9 Hyperhidrosis | 3 | 2272 | Risk Ratio (M‐H, Fixed, 95% CI) | 5.09 [3.05, 8.50] |
| 7.10 Diarrhoea | 3 | 2272 | Risk Ratio (M‐H, Fixed, 95% CI) | 0.83 [0.59, 1.18] |
| 7.11 Vomiting | 2 | 1247 | Risk Ratio (M‐H, Fixed, 95% CI) | 2.70 [1.44, 5.05] |
| 7.12 Sinusitis | 2 | 1247 | Risk Ratio (M‐H, Fixed, 95% CI) | 0.92 [0.58, 1.45] |
| 7.13 Hypertension | 2 | 1825 | Risk Ratio (M‐H, Fixed, 95% CI) | 4.71 [2.47, 8.96] |
| 7.14 Fatigue | 2 | 1825 | Risk Ratio (M‐H, Fixed, 95% CI) | 1.27 [0.86, 1.86] |
| 7.15 URTI | 2 | 1472 | Risk Ratio (M‐H, Fixed, 95% CI) | 0.90 [0.59, 1.37] |
| 8 All‐cause withdrawals Show forest plot | 3 | 2272 | Risk Ratio (M‐H, Fixed, 95% CI) | 1.14 [1.02, 1.29] |
| 9 Lack of efficacy withdrawals Show forest plot | 3 | 2272 | Risk Ratio (M‐H, Fixed, 95% CI) | 0.75 [0.57, 1.00] |
| 10 Adverse event withdrawals Show forest plot | 3 | 2272 | Risk Ratio (M‐H, Fixed, 95% CI) | 1.61 [1.32, 1.97] |
| Outcome or subgroup title | No. of studies | No. of participants | Statistical method | Effect size |
| 1 At least 30% pain relief Show forest plot | 3 | 1798 | Risk Ratio (M‐H, Fixed, 95% CI) | 1.35 [1.18, 1.54] |
| 2 PGIC 'much improved' or 'very much improved' Show forest plot | 2 | 1673 | Risk Ratio (M‐H, Fixed, 95% CI) | 1.57 [1.34, 1.83] |
| 3 Composite 1 Show forest plot | 3 | 2337 | Risk Ratio (M‐H, Fixed, 95% CI) | 1.91 [1.59, 2.29] |
| 4 Composite 2 Show forest plot | 2 | 1461 | Risk Ratio (M‐H, Fixed, 95% CI) | 1.61 [1.21, 2.13] |
| 5 At least one adverse event Show forest plot | 3 | 2338 | Risk Ratio (M‐H, Fixed, 95% CI) | 1.10 [1.06, 1.15] |
| 6 Serious adverse events Show forest plot | 4 | 2463 | Risk Ratio (M‐H, Fixed, 95% CI) | 0.91 [0.52, 1.60] |
| 7 Individual adverse events Show forest plot | 3 | Risk Ratio (M‐H, Fixed, 95% CI) | Subtotals only | |
| 7.1 Nausea | 3 | 2338 | Risk Ratio (M‐H, Fixed, 95% CI) | 2.37 [2.00, 2.80] |
| 7.2 Headache | 3 | 2338 | Risk Ratio (M‐H, Fixed, 95% CI) | 1.35 [1.10, 1.64] |
| 7.3 Constipation | 3 | 2338 | Risk Ratio (M‐H, Fixed, 95% CI) | 5.01 [3.46, 7.24] |
| 7.4 Hot flush | 3 | 2338 | Risk Ratio (M‐H, Fixed, 95% CI) | 6.71 [4.06, 11.09] |
| 7.5 Dizziness | 3 | 2338 | Risk Ratio (M‐H, Fixed, 95% CI) | 1.63 [1.22, 2.18] |
| 7.6 Palpitations | 3 | 2288 | Risk Ratio (M‐H, Fixed, 95% CI) | 3.38 [2.17, 5.29] |
| 7.7 Insomnia | 3 | 2338 | Risk Ratio (M‐H, Fixed, 95% CI) | 1.45 [1.11, 1.89] |
| 7.8 Increased heart rate/tachycardia | 3 | 2338 | Risk Ratio (M‐H, Fixed, 95% CI) | 6.81 [3.54, 13.13] |
| 7.9 Hyperhidrosis | 2 | 1461 | Risk Ratio (M‐H, Fixed, 95% CI) | 5.18 [2.67, 10.02] |
| 7.10 Diarrhoea | 2 | 1461 | Risk Ratio (M‐H, Fixed, 95% CI) | 0.63 [0.40, 0.99] |
| 7.11 Vomiting | 3 | 2338 | Risk Ratio (M‐H, Fixed, 95% CI) | 2.30 [1.48, 3.58] |
| 7.12 Sinusitis | 2 | 1461 | Risk Ratio (M‐H, Fixed, 95% CI) | 1.14 [0.76, 1.70] |
| 8 All‐cause withdrawals Show forest plot | 4 | 2416 | Risk Ratio (M‐H, Fixed, 95% CI) | 1.38 [1.22, 1.57] |
| 9 Lack of efficacy withdrawals Show forest plot | 4 | 2462 | Risk Ratio (M‐H, Fixed, 95% CI) | 0.66 [0.51, 0.87] |
| 10 Adverse event withdrawals Show forest plot | 4 | 2470 | Risk Ratio (M‐H, Fixed, 95% CI) | 2.51 [2.03, 3.09] |