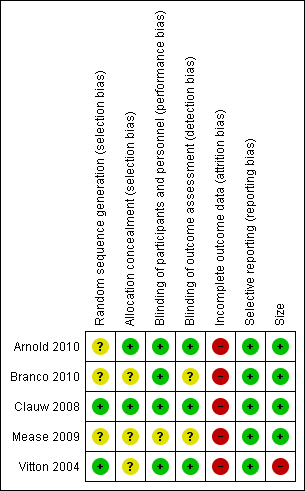
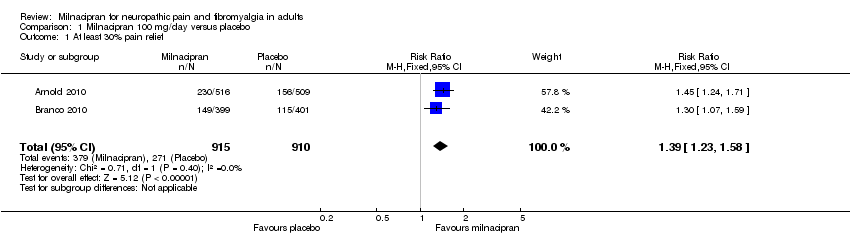
| 1 At least 30% pain relief Show forest plot | 2 | 1825 | Risk Ratio (M‐H, Fixed, 95% CI) | 1.39 [1.23, 1.58] |
|
| 2 PGIC 'much improved' or 'very much improved' Show forest plot | 2 | 1825 | Risk Ratio (M‐H, Fixed, 95% CI) | 1.52 [1.32, 1.74] |
|
| 3 Composite 1 Show forest plot | 3 | 2272 | Risk Ratio (M‐H, Fixed, 95% CI) | 1.46 [1.25, 1.71] |
|
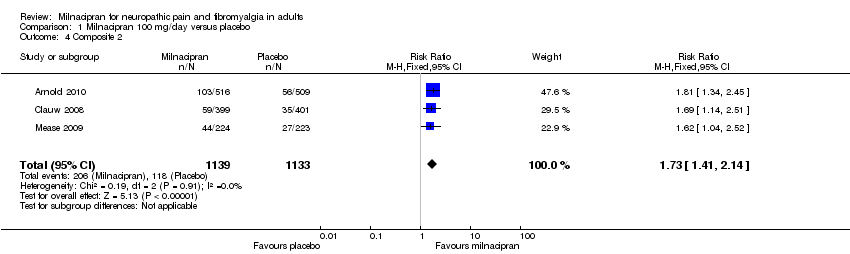
| 4 Composite 2 Show forest plot | 3 | 2272 | Risk Ratio (M‐H, Fixed, 95% CI) | 1.73 [1.41, 2.14] |
|
| 5 At least one adverse event Show forest plot | 3 | 2272 | Risk Ratio (M‐H, Fixed, 95% CI) | 1.10 [1.06, 1.14] |
|
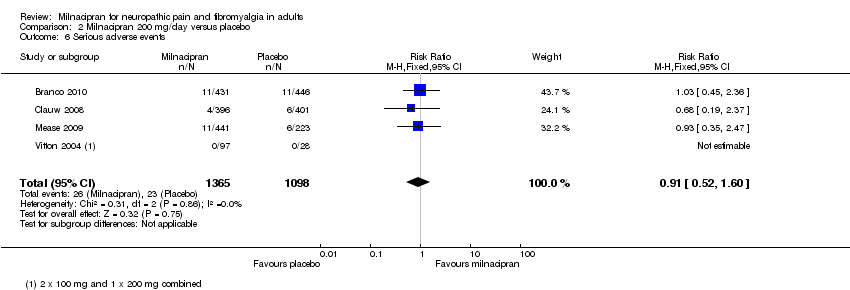
| 6 Serious adverse events Show forest plot | 3 | 2272 | Risk Ratio (M‐H, Fixed, 95% CI) | 0.88 [0.45, 1.73] |
|
| 7 Individual adverse events Show forest plot | 3 | | Risk Ratio (M‐H, Fixed, 95% CI) | Subtotals only |
|
| 7.1 Nausea | 3 | 2272 | Risk Ratio (M‐H, Fixed, 95% CI) | 1.73 [1.50, 1.98] |
| 7.2 Headache | 3 | 2272 | Risk Ratio (M‐H, Fixed, 95% CI) | 1.21 [1.00, 1.46] |
| 7.3 Constipation | 3 | 2272 | Risk Ratio (M‐H, Fixed, 95% CI) | 4.12 [2.97, 5.71] |
| 7.4 Hot flush | 3 | 2272 | Risk Ratio (M‐H, Fixed, 95% CI) | 4.25 [2.86, 6.31] |
| 7.5 Dizziness | 3 | 2272 | Risk Ratio (M‐H, Fixed, 95% CI) | 2.02 [1.49, 2.74] |
| 7.6 Palpitations | 3 | 2272 | Risk Ratio (M‐H, Fixed, 95% CI) | 3.02 [1.97, 4.63] |
| 7.7 Insomnia | 3 | 2272 | Risk Ratio (M‐H, Fixed, 95% CI) | 1.19 [0.92, 1.53] |
| 7.8 Increased heart rate/tachycardia | 3 | 2272 | Risk Ratio (M‐H, Fixed, 95% CI) | 5.42 [2.87, 10.25] |
| 7.9 Hyperhidrosis | 3 | 2272 | Risk Ratio (M‐H, Fixed, 95% CI) | 5.09 [3.05, 8.50] |
| 7.10 Diarrhoea | 3 | 2272 | Risk Ratio (M‐H, Fixed, 95% CI) | 0.83 [0.59, 1.18] |
| 7.11 Vomiting | 2 | 1247 | Risk Ratio (M‐H, Fixed, 95% CI) | 2.70 [1.44, 5.05] |
| 7.12 Sinusitis | 2 | 1247 | Risk Ratio (M‐H, Fixed, 95% CI) | 0.92 [0.58, 1.45] |
| 7.13 Hypertension | 2 | 1825 | Risk Ratio (M‐H, Fixed, 95% CI) | 4.71 [2.47, 8.96] |
| 7.14 Fatigue | 2 | 1825 | Risk Ratio (M‐H, Fixed, 95% CI) | 1.27 [0.86, 1.86] |
| 7.15 URTI | 2 | 1472 | Risk Ratio (M‐H, Fixed, 95% CI) | 0.90 [0.59, 1.37] |
| 8 All‐cause withdrawals Show forest plot | 3 | 2272 | Risk Ratio (M‐H, Fixed, 95% CI) | 1.14 [1.02, 1.29] |
|
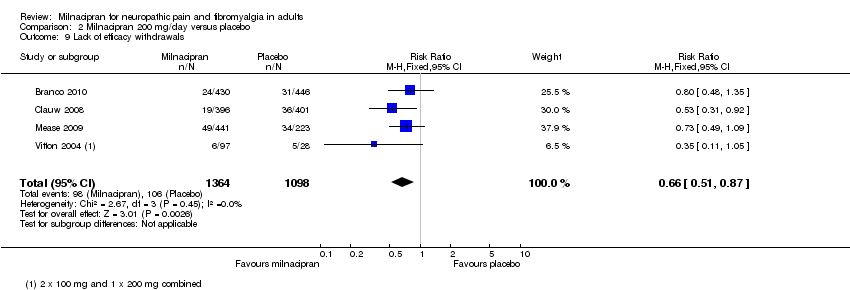
| 9 Lack of efficacy withdrawals Show forest plot | 3 | 2272 | Risk Ratio (M‐H, Fixed, 95% CI) | 0.75 [0.57, 1.00] |
|
| 10 Adverse event withdrawals Show forest plot | 3 | 2272 | Risk Ratio (M‐H, Fixed, 95% CI) | 1.61 [1.32, 1.97] |
|