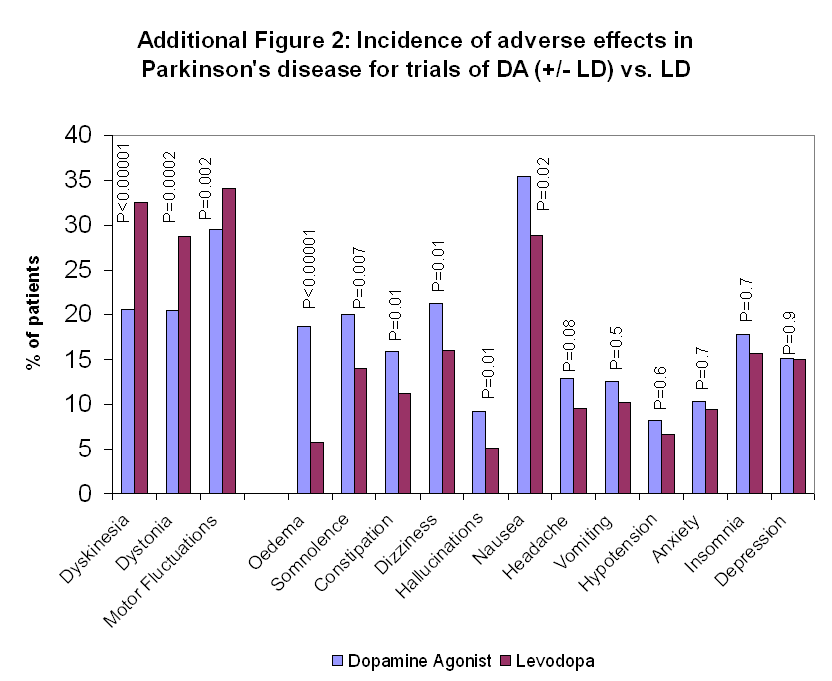
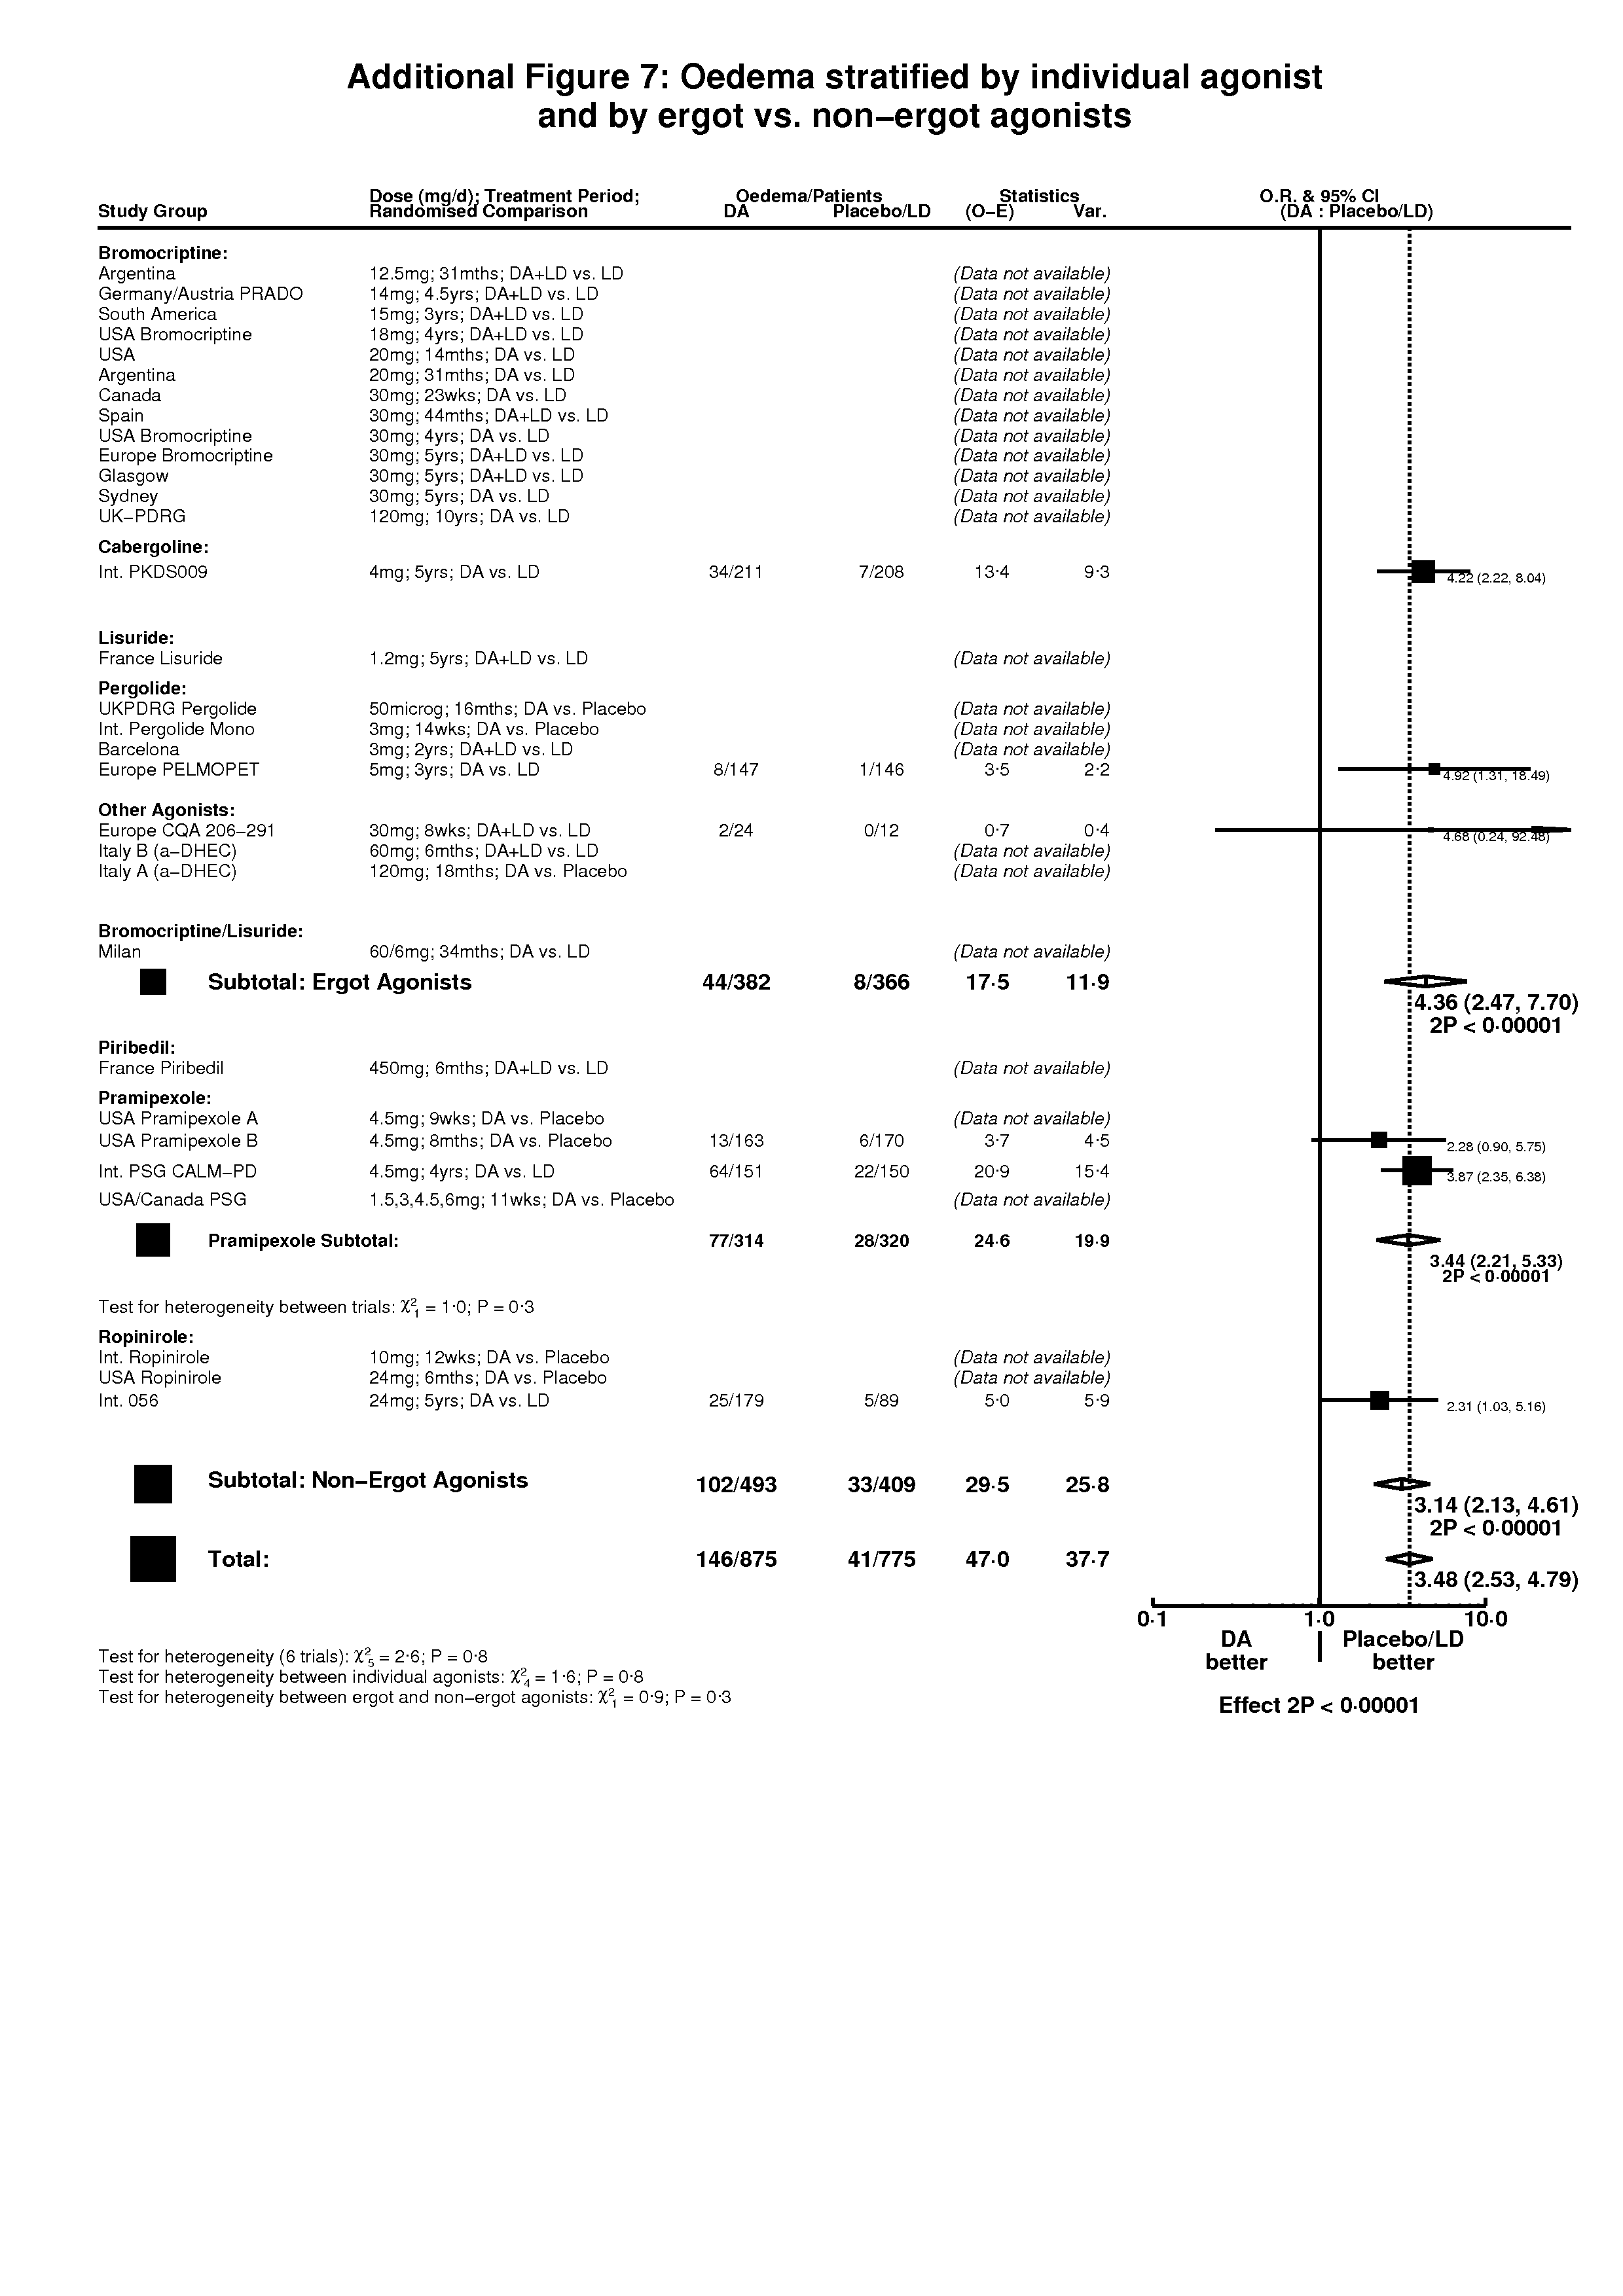
| 1 Oedema Show forest plot | 6 | 1650 | Peto Odds Ratio (Peto, Fixed, 95% CI) | 3.48 [2.53, 4.79] |
|
| 1.1 DA versus Placebo | 1 | 333 | Peto Odds Ratio (Peto, Fixed, 95% CI) | 2.28 [0.90, 5.75] |
| 1.2 DA (+/‐LD) versus LD | 5 | 1317 | Peto Odds Ratio (Peto, Fixed, 95% CI) | 3.68 [2.62, 5.18] |
| 2 Somnolence Show forest plot | 11 | 2423 | Peto Odds Ratio (Peto, Fixed, 95% CI) | 2.18 [1.75, 2.72] |
|
| 2.1 DA versus Placebo | 5 | 1006 | Peto Odds Ratio (Peto, Fixed, 95% CI) | 3.68 [2.62, 5.18] |
| 2.2 DA (+/‐LD) versus LD | 6 | 1417 | Peto Odds Ratio (Peto, Fixed, 95% CI) | 1.49 [1.12, 2.00] |
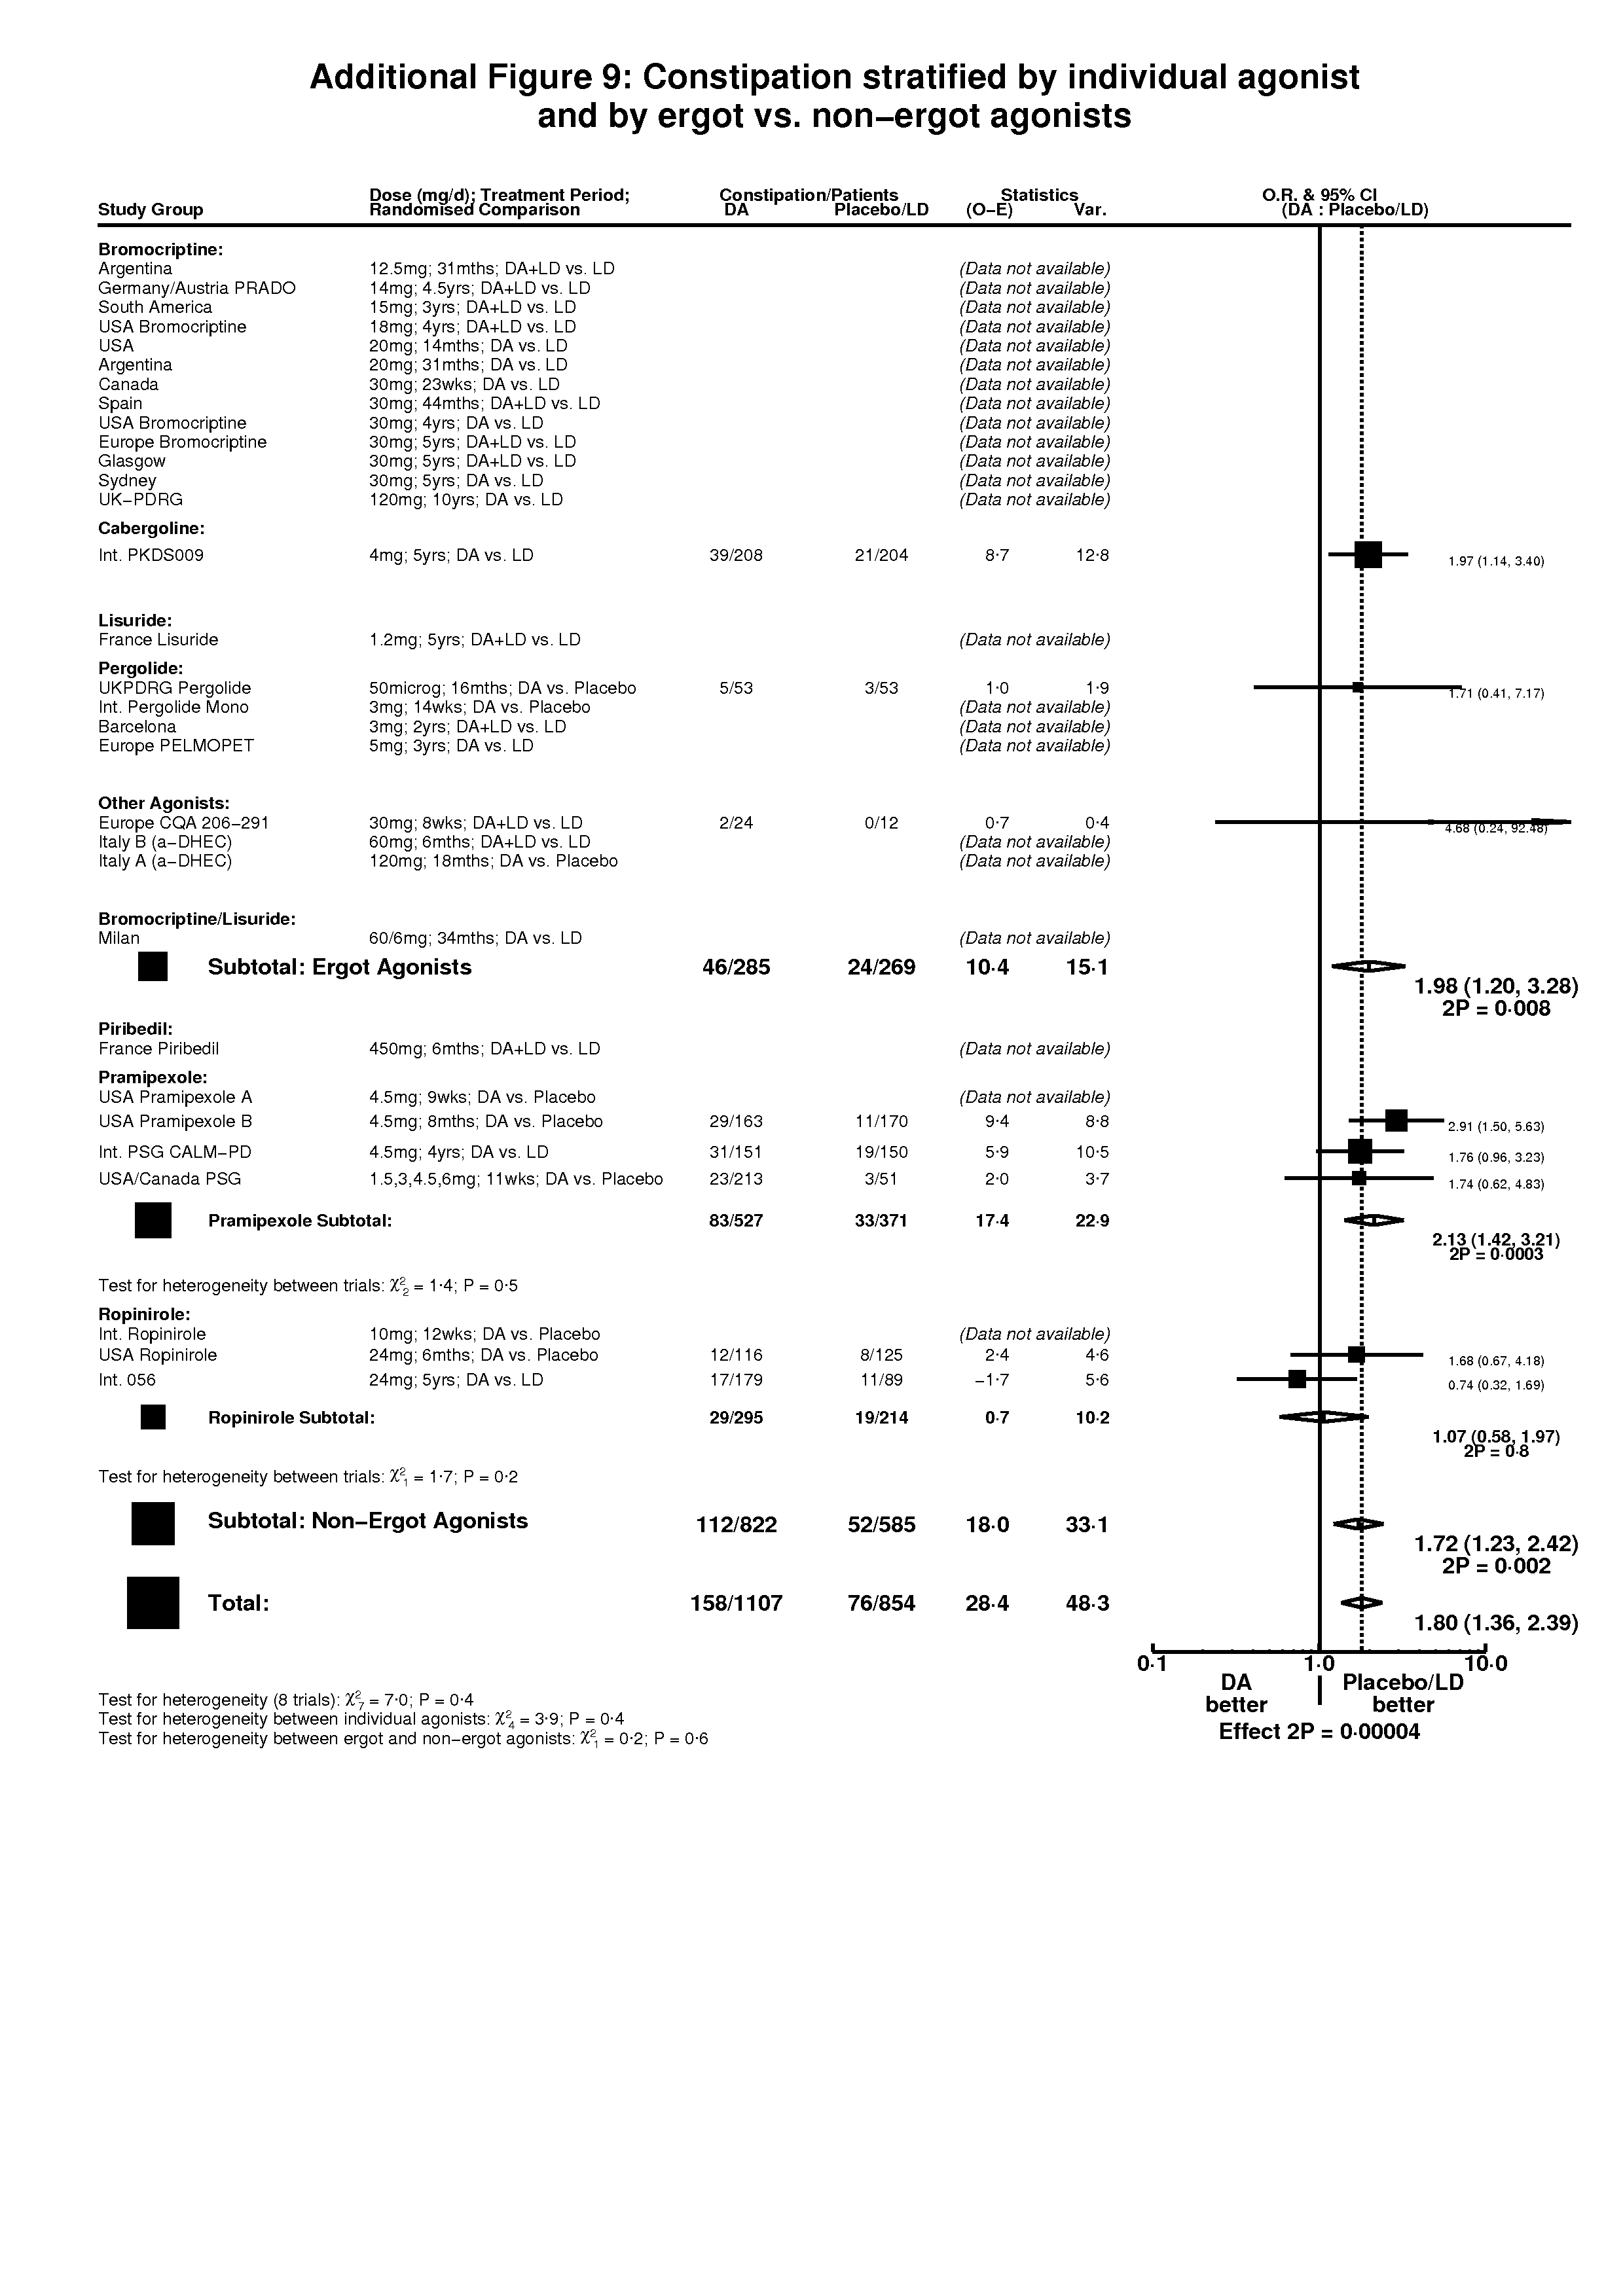
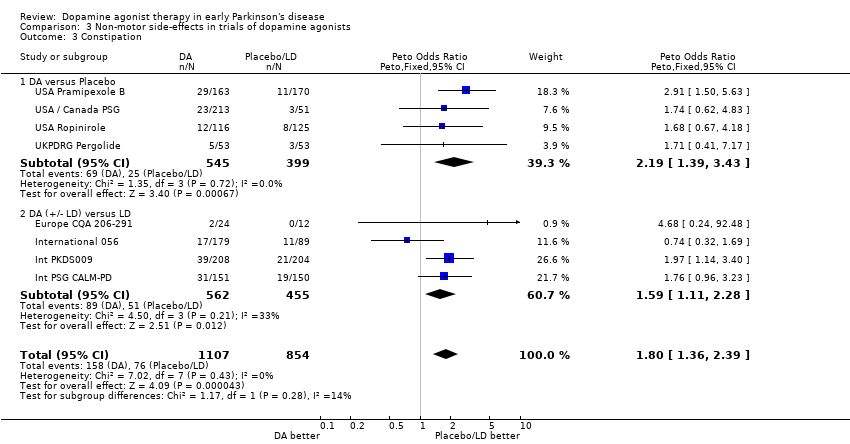
| 3 Constipation Show forest plot | 8 | 1961 | Peto Odds Ratio (Peto, Fixed, 95% CI) | 1.80 [1.36, 2.39] |
|
| 3.1 DA versus Placebo | 4 | 944 | Peto Odds Ratio (Peto, Fixed, 95% CI) | 2.19 [1.39, 3.43] |
| 3.2 DA (+/‐ LD) versus LD | 4 | 1017 | Peto Odds Ratio (Peto, Fixed, 95% CI) | 1.59 [1.11, 2.28] |
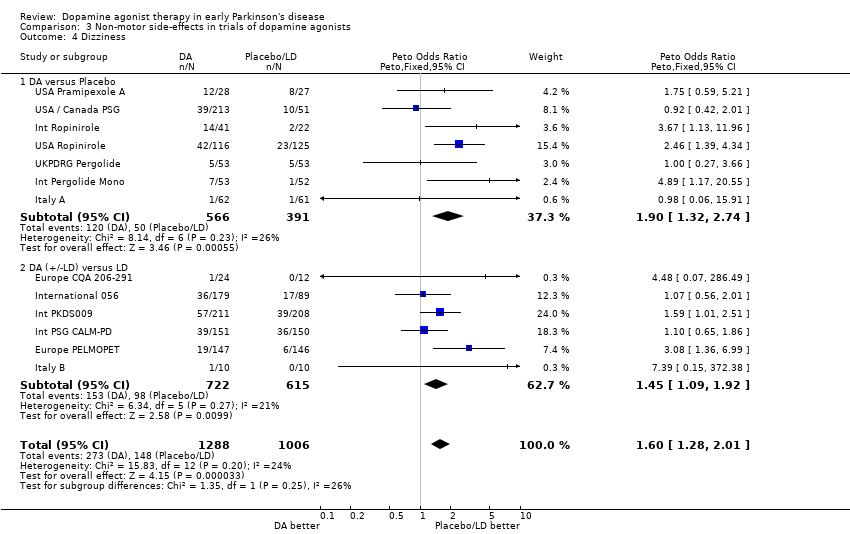
| 4 Dizziness Show forest plot | 13 | 2294 | Peto Odds Ratio (Peto, Fixed, 95% CI) | 1.60 [1.28, 2.01] |
|
| 4.1 DA versus Placebo | 7 | 957 | Peto Odds Ratio (Peto, Fixed, 95% CI) | 1.90 [1.32, 2.74] |
| 4.2 DA (+/‐LD) versus LD | 6 | 1337 | Peto Odds Ratio (Peto, Fixed, 95% CI) | 1.45 [1.09, 1.92] |
| 5 Hallucinations Show forest plot | 14 | 2479 | Peto Odds Ratio (Peto, Fixed, 95% CI) | 2.22 [1.58, 3.12] |
|
| 5.1 DA versus Placebo | 5 | 956 | Peto Odds Ratio (Peto, Fixed, 95% CI) | 4.55 [2.38, 8.71] |
| 5.2 DA (+/‐LD) versus LD | 9 | 1523 | Peto Odds Ratio (Peto, Fixed, 95% CI) | 1.69 [1.13, 2.52] |
| 6 Nausea Show forest plot | 15 | 2631 | Peto Odds Ratio (Peto, Fixed, 95% CI) | 1.86 [1.56, 2.23] |
|
| 6.1 DA versus Placebo | 7 | 1184 | Peto Odds Ratio (Peto, Fixed, 95% CI) | 3.11 [2.35, 4.11] |
| 6.2 DA (+/‐ LD) versus LD | 8 | 1447 | Peto Odds Ratio (Peto, Fixed, 95% CI) | 1.32 [1.05, 1.66] |
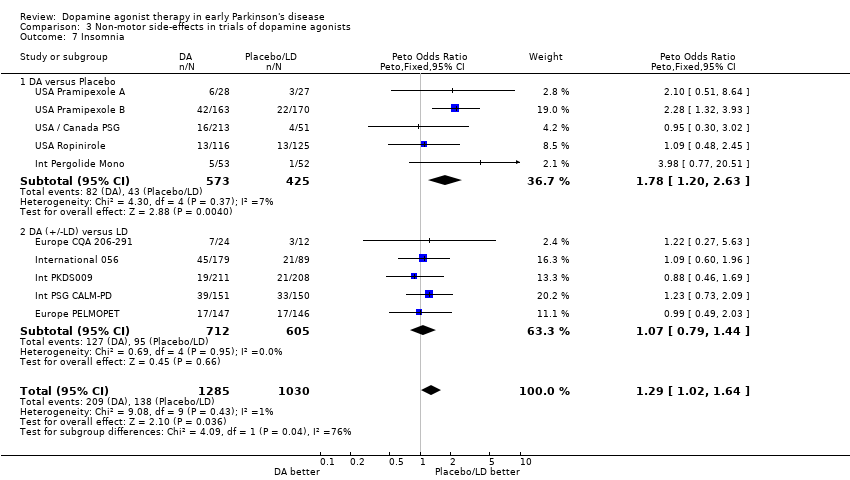
| 7 Insomnia Show forest plot | 10 | 2315 | Peto Odds Ratio (Peto, Fixed, 95% CI) | 1.29 [1.02, 1.64] |
|
| 7.1 DA versus Placebo | 5 | 998 | Peto Odds Ratio (Peto, Fixed, 95% CI) | 1.78 [1.20, 2.63] |
| 7.2 DA (+/‐LD) versus LD | 5 | 1317 | Peto Odds Ratio (Peto, Fixed, 95% CI) | 1.07 [0.79, 1.44] |
| 8 Headache Show forest plot | 11 | 2168 | Peto Odds Ratio (Peto, Fixed, 95% CI) | 1.26 [0.96, 1.67] |
|
| 8.1 DA versus Placebo | 5 | 789 | Peto Odds Ratio (Peto, Fixed, 95% CI) | 1.11 [0.68, 1.79] |
| 8.2 DA (+/‐LD) versus LD | 6 | 1379 | Peto Odds Ratio (Peto, Fixed, 95% CI) | 1.35 [0.96, 1.90] |
| 9 Vomiting Show forest plot | 7 | 998 | Peto Odds Ratio (Peto, Fixed, 95% CI) | 1.30 [0.78, 2.18] |
|
| 9.1 DA versus Placebo | 4 | 624 | Peto Odds Ratio (Peto, Fixed, 95% CI) | 1.37 [0.61, 3.05] |
| 9.2 DA (+/‐LD) versus LD | 3 | 374 | Peto Odds Ratio (Peto, Fixed, 95% CI) | 1.26 [0.64, 2.46] |
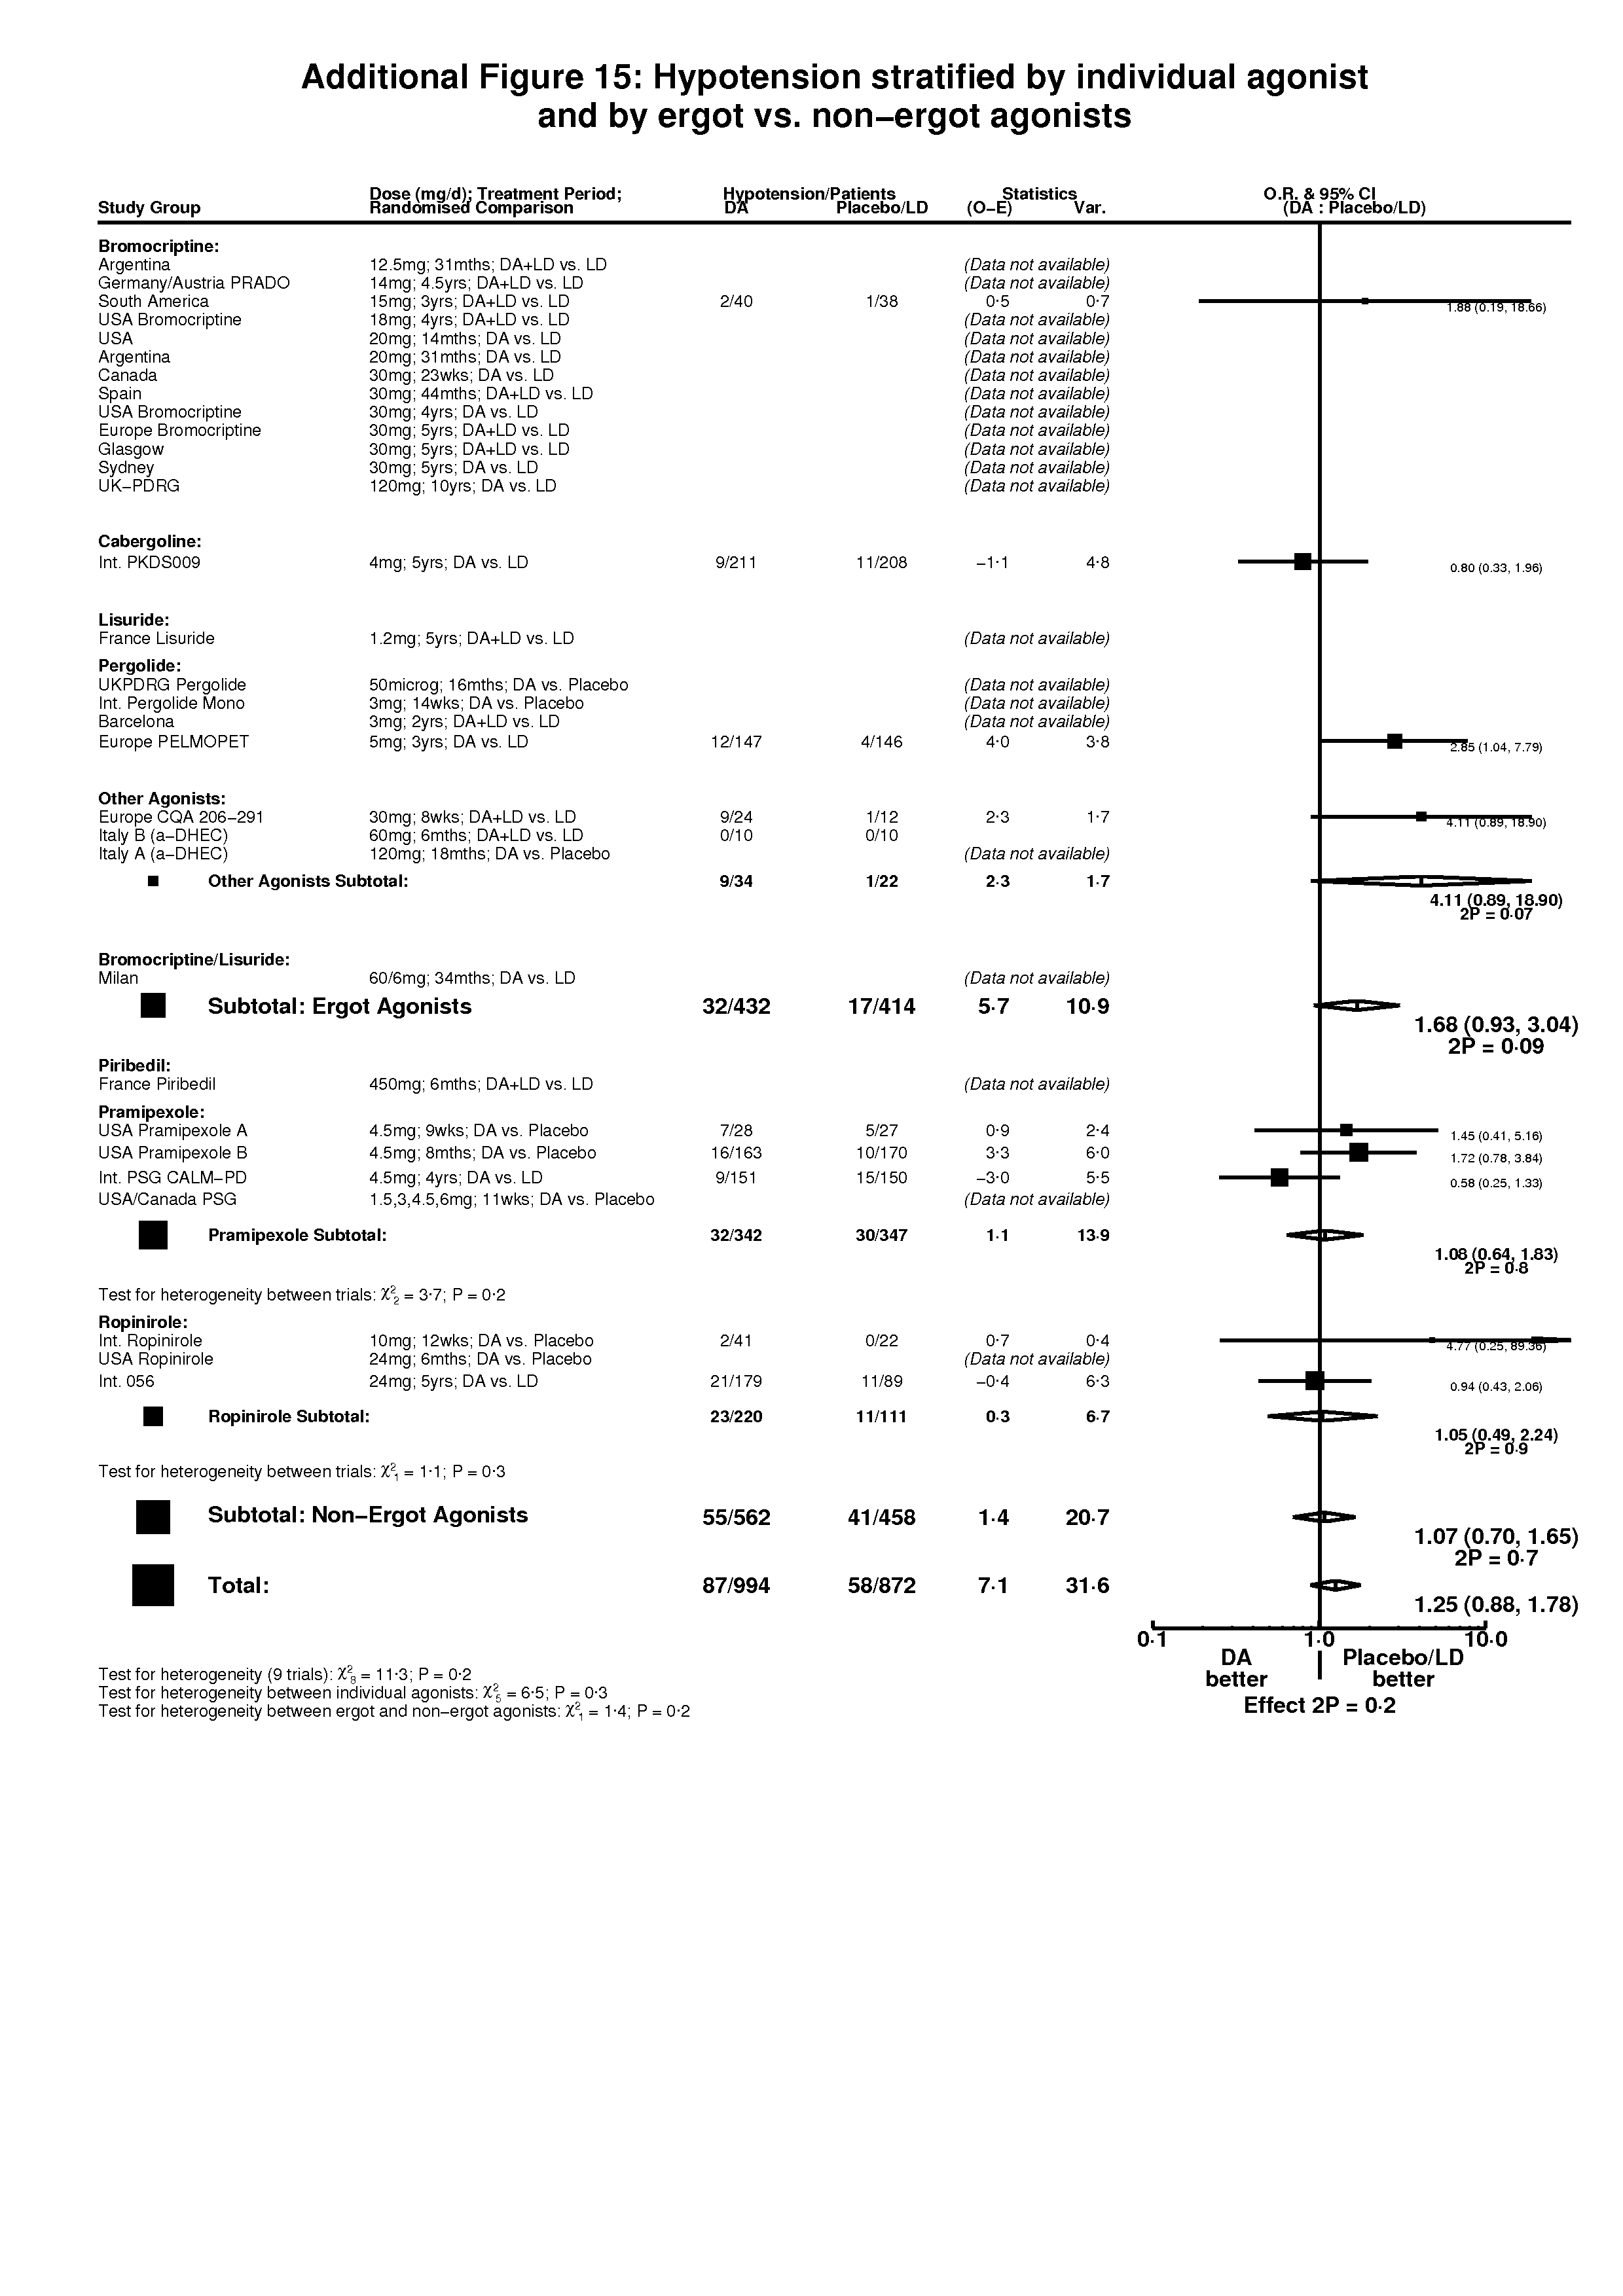
| 10 Hypotension Show forest plot | 10 | 1866 | Peto Odds Ratio (Peto, Fixed, 95% CI) | 1.25 [0.88, 1.78] |
|
| 10.1 DA versus Placebo | 3 | 451 | Peto Odds Ratio (Peto, Fixed, 95% CI) | 1.73 [0.90, 3.35] |
| 10.2 DA (+/‐LD) versus LD | 7 | 1415 | Peto Odds Ratio (Peto, Fixed, 95% CI) | 1.11 [0.73, 1.67] |
| 11 Anxiety Show forest plot | 5 | 1113 | Peto Odds Ratio (Peto, Fixed, 95% CI) | 1.14 [0.75, 1.73] |
|
| 11.1 DA versus Placebo | 1 | 105 | Peto Odds Ratio (Peto, Fixed, 95% CI) | 7.39 [0.46, 119.79] |
| 11.2 DA (+/‐LD) versus LD | 4 | 1008 | Peto Odds Ratio (Peto, Fixed, 95% CI) | 1.09 [0.72, 1.66] |
| 12 Depression Show forest plot | 6 | 1628 | Peto Odds Ratio (Peto, Fixed, 95% CI) | 0.91 [0.68, 1.22] |
|
| 12.1 DA versus Placebo | 2 | 347 | Peto Odds Ratio (Peto, Fixed, 95% CI) | 0.48 [0.20, 1.14] |
| 12.2 DA (+/‐LD) versus LD | 4 | 1281 | Peto Odds Ratio (Peto, Fixed, 95% CI) | 0.99 [0.72, 1.34] |