Emergency ultrasound‐based algorithms for diagnosing blunt abdominal trauma
References
References to studies included in this review
Jump to:
References to studies excluded from this review
Jump to:
Additional references
Jump to:
Characteristics of studies
Characteristics of included studies [ordered by study ID]
Jump to:
| Methods | Quasi‐RCT (algorithm used was based on the daytime and weekday availability of ultrasound). Location: Community Hospital, Level‐I‐Trauma Center, South Carolina, USA. Recruitment period: 9 months Risk of bias assessment: | |
| Participants | Inclusion criteria: consecutive patients with suspected blunt abdominal trauma. 331 enrolled (US 105, no US 226). US group: mean age 38.1 (SD 22.7) years, mean ISS 13.0 (SD 11.6), 62% males. No US group: mean age 33.6 (SD 18.6) years, mean ISS 13.4 (SD 9.7), 69% males | |
| Interventions | a. Clinical examination, focused ultrasound for free fluid, further management depended on sonograms and hemodynamic stability | |
| Outcomes | 1. Number of diagnostic tests (CT, DPL) | |
| Notes | ||
| Risk of bias | ||
| Bias | Authors' judgement | Support for judgement |
| Random sequence generation (selection bias) | High risk | Allocation according to admission date and time |
| Allocation concealment (selection bias) | High risk | Allocation according to admission date and time |
| Blinding (performance bias and detection bias) | High risk | No blinding attempted |
| Blinding of participants and personnel (performance bias) | High risk | No blinding attempted |
| Blinding of outcome assessment (detection bias) | High risk | No blinding attempted |
| Incomplete outcome data (attrition bias) | Unclear risk | Unclear |
| Selective reporting (reporting bias) | Unclear risk | Unclear |
| Other bias | Unclear risk | Unclear |
| Methods | Quasi‐RCT (algorithm used was determined by date of admission). Location: University Hospital, Kentucky, USA. Recruitment period: October 1995 to August 1997 Risk of bias assessment: A. Adequacy of concealment: 0 | |
| Participants | Inclusion criteria: victims of blunt trauma, older than 16 years of age, resuscitated by trauma service, no clinical indication for laparotomy, unreliable or equivocal abdominal examination. 706 enrolled (US 460, no US 246) | |
| Interventions | a. Clinical examination, focused ultrasound for free fluid, further management depended on sonograms and hemodynamical stability | |
| Outcomes | 1. Time from arrival to the completion of diagnostic algorithm | |
| Notes | ||
| Risk of bias | ||
| Bias | Authors' judgement | Support for judgement |
| Random sequence generation (selection bias) | High risk | Allocation according to admission date |
| Allocation concealment (selection bias) | High risk | Allocation according to admission date |
| Blinding (performance bias and detection bias) | High risk | No blinding attempted |
| Blinding of participants and personnel (performance bias) | High risk | No blinding attempted |
| Blinding of outcome assessment (detection bias) | High risk | No blinding attempted |
| Incomplete outcome data (attrition bias) | Unclear risk | Unclear |
| Selective reporting (reporting bias) | Unclear risk | Unclear |
| Other bias | Unclear risk | Unclear |
| Methods | RCT. Location ‐ three level‐1 trauma centres, New York Methodist Hospital, Maricopa Hospital, Phoenix, Jackson Memorial Hospital, Miami, USA | |
| Participants | Inclusion criteria: patients presenting with any one of a mechanism of injury (energy reportedly delivered to the torso), symptomatology (complaint of chest, abdominal, or pelvic pain), or physical findings (chest, abdominal, or pelvic tenderness) suspicious of torso trauma | |
| Interventions | a. Diagnostic interventions that the initial evaluating physician, under ordinary circumstances, would use to evaluate torso trauma patients plus 4‐view FAST assessment | |
| Outcomes | 1. Time from ED arrival to direct transfer to operative care in minutes (sample size calculations: 40% reduction, 90% power, alpha 5%) | |
| Notes | Of 525 patients screened, 81 went directly to OR, 136 lacked consent, 262 were randomised, and 217 were analysed | |
| Risk of bias | ||
| Bias | Authors' judgement | Support for judgement |
| Random sequence generation (selection bias) | Low risk | Randomisation in blocks of 50, stratified by centre |
| Allocation concealment (selection bias) | Low risk | Sealed, opaque envelopes |
| Blinding (performance bias and detection bias) | High risk | No blinding attempted |
| Blinding of participants and personnel (performance bias) | High risk | No blinding attempted |
| Blinding of outcome assessment (detection bias) | High risk | No blinding attempted |
| Incomplete outcome data (attrition bias) | Low risk | According to the CONSORT flow chart, 111/135 (82%) PLUS and 106/127 (83%) control patients were included in the final analysis |
| Selective reporting (reporting bias) | Unclear risk | Unclear |
| Other bias | Unclear risk | Unclear |
| Methods | RCT. Location: University Hospital, California, USA. Recruitment period: November 1997 to November 1998 Risk of bias assessment: | |
| Participants | Inclusion criteria: patients 18 to 75 years old meeting critical trauma triage criteria after blunt injury, defined by the American College of Surgeons Subcommittee of trauma. 212 randomised (US 105, no US 107), 208 analysed (4 dropped because of incomplete data). US group: mean age 40.0 (SD 19.5) years, mean ISS 9.9 (SD 12.4), 61% males. No US group: mean age 39.0 (SD 16.8) years, mean ISS 9.8 (SD 8.8), 63% males | |
| Interventions | a. Standard trauma management plus focused ultrasound for free fluid (none, small, moderate, large) with 15 minutes of arrival by experienced doctors | |
| Outcomes | 1. Difference in abdominal CT scan use (sample size calculations: 20% difference, 80% power, two‐tailed alpha 5%) | |
| Notes | Trial was stopped at 215 participants because US was recognised as standard practice and did not allow for further patient recruitment | |
| Risk of bias | ||
| Bias | Authors' judgement | Support for judgement |
| Random sequence generation (selection bias) | Low risk | Randomisation in blocks of 30 |
| Allocation concealment (selection bias) | Unclear risk | Computer‐generated method, but unclear concealment |
| Blinding (performance bias and detection bias) | High risk | No blinding attempted |
| Blinding of participants and personnel (performance bias) | High risk | No blinding attempted |
| Blinding of outcome assessment (detection bias) | High risk | No blinding attempted |
| Incomplete outcome data (attrition bias) | Unclear risk | Unclear |
| Selective reporting (reporting bias) | Unclear risk | Unclear |
| Other bias | Unclear risk | Unclear |
Characteristics of excluded studies [ordered by study ID]
Jump to:
| Study | Reason for exclusion |
| Comparison of prospectively collected ultrasound data (August 1995 to October 1995) with a historical cohort admitted before instituting ultrasound‐based clinical pathways (August 1994 to October 1994) | |
| Comparison of prospectively collected ultrasound data (May 1994 to August 1995) with a historical cohort admitted before instituting ultrasound‐based clinical pathways | |
| Comparison of prospectively collected ultrasound data (1990 to 1994) with a historical cohort admitted before instituting ultrasound‐based clinical pathways (1986 to 1990) | |
| The study included people with blunt or penetrating injuries, and there is no mention of concealment of the randomisation sequence. Correspondence with the author confirms the study was not registered | |
| Comparison of ultrasound accuracy and the request of CT scans among physicians with minor, moderate and high skills in performing FAST | |
| Comparison of prospectively collected ultrasound data (January 1995 to June 1995) with a historical cohort admitted before instituting ultrasound‐based clinical pathways (January 1993 to June 1993) | |
| Trial intended to prove the superiority of computed tomography over multiple diagnostic interventions including ultrasound |
Data and analyses
| Outcome or subgroup title | No. of studies | No. of participants | Statistical method | Effect size |
| 1 Relative risk of mortality Show forest plot | 3 | 1254 | Risk Ratio (M‐H, Random, 95% CI) | 1.00 [0.50, 2.00] |
| Analysis 1.1  Comparison 1 Mortality, Outcome 1 Relative risk of mortality. | ||||
| Outcome or subgroup title | No. of studies | No. of participants | Statistical method | Effect size |
| 1 Difference in CT frequency Show forest plot | 4 | 1462 | Risk Difference (M‐H, Random, 95% CI) | ‐0.52 [‐0.83, ‐0.21] |
| Analysis 2.1 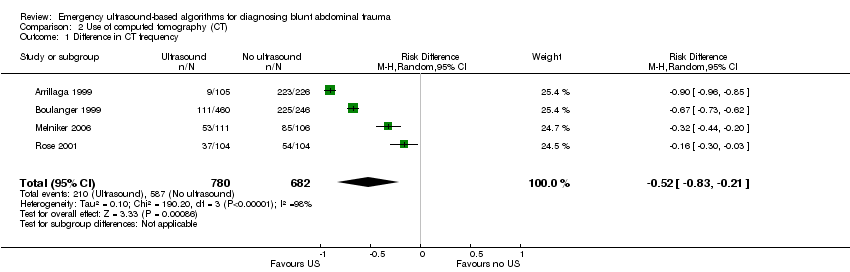 Comparison 2 Use of computed tomography (CT), Outcome 1 Difference in CT frequency. | ||||
| Outcome or subgroup title | No. of studies | No. of participants | Statistical method | Effect size |
| 1 Difference in DPL frequency Show forest plot | 2 | 1037 | Risk Difference (M‐H, Random, 95% CI) | ‐0.06 [‐0.09, ‐0.02] |
| Analysis 3.1 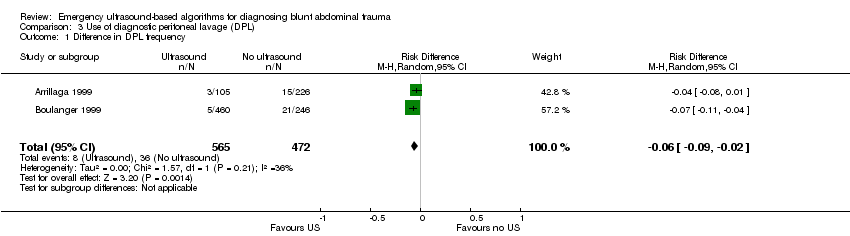 Comparison 3 Use of diagnostic peritoneal lavage (DPL), Outcome 1 Difference in DPL frequency. | ||||
| Outcome or subgroup title | No. of studies | No. of participants | Statistical method | Effect size |
| 1 Direct costs per patient (US$) Show forest plot | 1 | Mean Difference (IV, Random, 95% CI) | Subtotals only | |
| Analysis 4.1 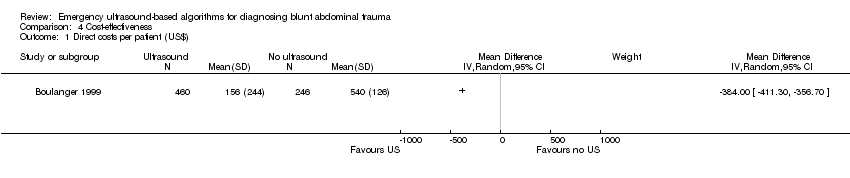 Comparison 4 Cost‐effectiveness, Outcome 1 Direct costs per patient (US$). | ||||
| Outcome or subgroup title | No. of studies | No. of participants | Statistical method | Effect size |
| 1 Laparotomy rate Show forest plot | 3 | 1131 | Risk Difference (M‐H, Fixed, 95% CI) | ‐0.00 [‐0.04, 0.04] |
| Analysis 5.1  Comparison 5 Laparotomy, Outcome 1 Laparotomy rate. | ||||
| Outcome or subgroup title | No. of studies | No. of participants | Statistical method | Effect size |
| 1 Mean reduction in diagnostic time (minutes) Show forest plot | 1 | Mean Difference (IV, Fixed, 95% CI) | Subtotals only | |
| Analysis 6.1 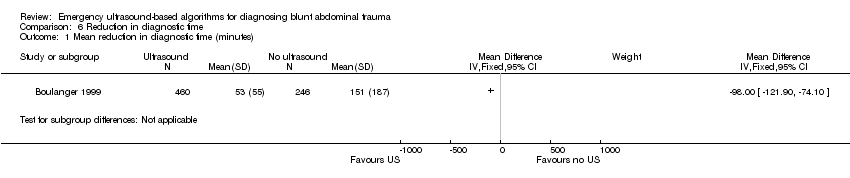 Comparison 6 Reduction in diagnostic time, Outcome 1 Mean reduction in diagnostic time (minutes). | ||||
| Outcome or subgroup title | No. of studies | No. of participants | Statistical method | Effect size |
| 1 Risk of delayed diagnosis Show forest plot | 1 | Risk Ratio (M‐H, Fixed, 95% CI) | Subtotals only | |
| Analysis 7.1 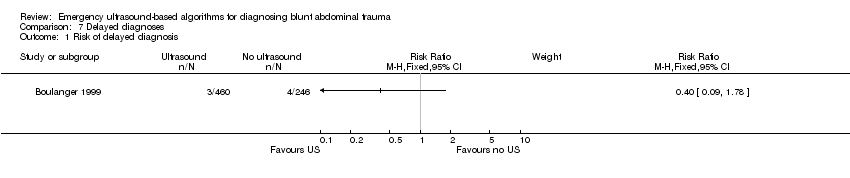 Comparison 7 Delayed diagnoses, Outcome 1 Risk of delayed diagnosis. | ||||
| Outcome or subgroup title | No. of studies | No. of participants | Statistical method | Effect size |
| 1 Risk of non‐therapeutic laparotomy Show forest plot | 1 | Risk Ratio (M‐H, Fixed, 95% CI) | Subtotals only | |
| Analysis 8.1 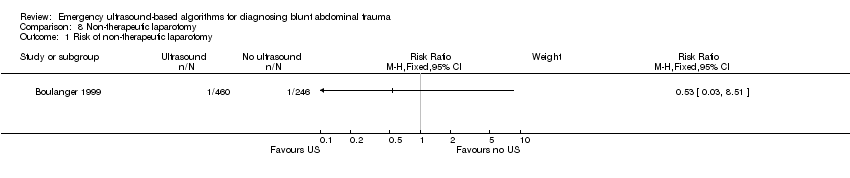 Comparison 8 Non‐therapeutic laparotomy, Outcome 1 Risk of non‐therapeutic laparotomy. | ||||
| Outcome or subgroup title | No. of studies | No. of participants | Statistical method | Effect size |
| 1 Mean length of stay (days) Show forest plot | 1 | Mean Difference (IV, Fixed, 95% CI) | Subtotals only | |
| Analysis 9.1 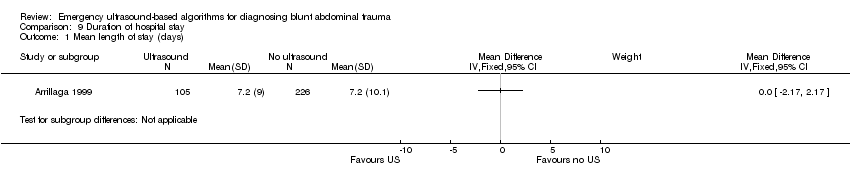 Comparison 9 Duration of hospital stay, Outcome 1 Mean length of stay (days). | ||||
| Outcome or subgroup title | No. of studies | No. of participants | Statistical method | Effect size |
| 1 Mean ICU days Show forest plot | 1 | Mean Difference (IV, Fixed, 95% CI) | Subtotals only | |
| Analysis 10.1  Comparison 10 Intensive care, Outcome 1 Mean ICU days. | ||||

Study selection process flow diagram for 2015 search update.

Risk of bias summary: review authors' judgements about each risk of bias item for each included study.
Comparison 1 Mortality, Outcome 1 Relative risk of mortality.
Comparison 2 Use of computed tomography (CT), Outcome 1 Difference in CT frequency.
Comparison 3 Use of diagnostic peritoneal lavage (DPL), Outcome 1 Difference in DPL frequency.
Comparison 4 Cost‐effectiveness, Outcome 1 Direct costs per patient (US$).
Comparison 5 Laparotomy, Outcome 1 Laparotomy rate.
Comparison 6 Reduction in diagnostic time, Outcome 1 Mean reduction in diagnostic time (minutes).
Comparison 7 Delayed diagnoses, Outcome 1 Risk of delayed diagnosis.
Comparison 8 Non‐therapeutic laparotomy, Outcome 1 Risk of non‐therapeutic laparotomy.
Comparison 9 Duration of hospital stay, Outcome 1 Mean length of stay (days).
Comparison 10 Intensive care, Outcome 1 Mean ICU days.
| Outcome or subgroup title | No. of studies | No. of participants | Statistical method | Effect size |
| 1 Relative risk of mortality Show forest plot | 3 | 1254 | Risk Ratio (M‐H, Random, 95% CI) | 1.00 [0.50, 2.00] |
| Outcome or subgroup title | No. of studies | No. of participants | Statistical method | Effect size |
| 1 Difference in CT frequency Show forest plot | 4 | 1462 | Risk Difference (M‐H, Random, 95% CI) | ‐0.52 [‐0.83, ‐0.21] |
| Outcome or subgroup title | No. of studies | No. of participants | Statistical method | Effect size |
| 1 Difference in DPL frequency Show forest plot | 2 | 1037 | Risk Difference (M‐H, Random, 95% CI) | ‐0.06 [‐0.09, ‐0.02] |
| Outcome or subgroup title | No. of studies | No. of participants | Statistical method | Effect size |
| 1 Direct costs per patient (US$) Show forest plot | 1 | Mean Difference (IV, Random, 95% CI) | Subtotals only | |
| Outcome or subgroup title | No. of studies | No. of participants | Statistical method | Effect size |
| 1 Laparotomy rate Show forest plot | 3 | 1131 | Risk Difference (M‐H, Fixed, 95% CI) | ‐0.00 [‐0.04, 0.04] |
| Outcome or subgroup title | No. of studies | No. of participants | Statistical method | Effect size |
| 1 Mean reduction in diagnostic time (minutes) Show forest plot | 1 | Mean Difference (IV, Fixed, 95% CI) | Subtotals only | |
| Outcome or subgroup title | No. of studies | No. of participants | Statistical method | Effect size |
| 1 Risk of delayed diagnosis Show forest plot | 1 | Risk Ratio (M‐H, Fixed, 95% CI) | Subtotals only | |
| Outcome or subgroup title | No. of studies | No. of participants | Statistical method | Effect size |
| 1 Risk of non‐therapeutic laparotomy Show forest plot | 1 | Risk Ratio (M‐H, Fixed, 95% CI) | Subtotals only | |
| Outcome or subgroup title | No. of studies | No. of participants | Statistical method | Effect size |
| 1 Mean length of stay (days) Show forest plot | 1 | Mean Difference (IV, Fixed, 95% CI) | Subtotals only | |
| Outcome or subgroup title | No. of studies | No. of participants | Statistical method | Effect size |
| 1 Mean ICU days Show forest plot | 1 | Mean Difference (IV, Fixed, 95% CI) | Subtotals only | |