Emergency ultrasound‐based algorithms for diagnosing blunt abdominal trauma
Information
- DOI:
- https://doi.org/10.1002/14651858.CD004446.pub4Copy DOI

- Database:
-
- Cochrane Database of Systematic Reviews
- Version published:
-
- 14 September 2015see what's new
- Type:
-
- Intervention
- Stage:
-
- Review
- Cochrane Editorial Group:
-
Cochrane Injuries Group
- Copyright:
-
- Copyright © 2015 The Cochrane Collaboration. Published by John Wiley & Sons, Ltd.
Article metrics
Altmetric:
Cited by:
Authors
Contributions of authors
First two versions of the review (2005 and 2007): Dirk Stengel was the principal investigator of this study, identified relevant literature, extracted and summarised data, and wrote the manuscript. Kai Bauwens, Jalid Sehouli, and Franz Porzsolt assisted in literature retrieval and data extraction. Kai Bauwens co‐reviewed eligible studies for methodological quality. Grit Rademacher, Sven Mutze, and Axel Ekkernkamp discussed core ideas, and contributed to data interpretation. All authors critically appraised the final version of this review.
2008 and 2013 updates: Dirk Stengel and Claas Güthoff screened the updated search results. No new studies were identified.
2015 revision: Dirk Stengel updated the manuscript. All authors participated in commenting upon and reviewing the changes, and agreed on the final version.
Sources of support
Internal sources
-
Department of Trauma and Orthopaedic Surgery at the Unfallkrankenhaus, Berlin, Germany.
External sources
-
No sources of support supplied
Declarations of interest
Dirk Stengel: None known.
Claas Güthoff: None known.
Grit Rademacher: None known.
Sven Mutze: None known.
Axel Ekkernkamp: None known.
Acknowledgements
We thank Professor Bernard R Boulanger, University of Kentucky, Lexington, Kentucky, USA and Dr O John Ma, Truman Medical Center, Kansas City, Missouri, USA for responding to our e‐mails and for their willingness to provide unpublished data. We also thank Dr Steve Vance, Synergy Medical Education Alliance, Michigan State University Emergency Medicine Residency, Saginaw, MI, USA for his evidence‐based emergency medicine review and subsequent response to a critical letter.
The authors would like to thank Kai Bauwens, Jalid Sehouli, and Franz Porzsolt who contributed to previous versions of the review.
This project was supported by the UK National Institute for Health Research, through Cochrane Infrastructure funding to the Cochrane Injuries Group. The views and opinions expressed are those of the authors and do not necessarily reflect those of the Systematic Reviews Programme, NIHR, NHS or the Department of Health.
Version history
| Published | Title | Stage | Authors | Version |
| 2015 Sep 14 | Emergency ultrasound‐based algorithms for diagnosing blunt abdominal trauma | Review | Dirk Stengel, Grit Rademacher, Axel Ekkernkamp, Claas Güthoff, Sven Mutze | |
| 2013 Jul 31 | Emergency ultrasound‐based algorithms for diagnosing blunt abdominal trauma | Review | Dirk Stengel, Kai Bauwens, Grit Rademacher, Axel Ekkernkamp, Claas Güthoff | |
| 2005 Apr 20 | Emergency ultrasound‐based algorithms for diagnosing blunt abdominal trauma | Review | Dirk Stengel, Kai Bauwens, Jalid Sehouli, Grit Rademacher, Sven Mutze, Axel Ekkernkamp, Franz Porzsolt | |
| 2003 Jul 21 | Emergency ultrasound‐based algorithms for diagnosing blunt abdominal trauma | Protocol | Dirk Stengel, Kai Bauwens, Jalid Sehouli, Grit Rademacher, Sven Mutze, Axel Ekkernkamp, Franz Porzsolt | |
Differences between protocol and review
2015 amendments: the objectives of the review have changed. Future updates of this review will include FAST ultrasound (performed by means of a four‐quadrant, focused assessment of sonography for trauma (FAST), rather than any type of ultrasound (as per the original protocol).
Notes
2015 amendment: future updates of this review will include FAST ultrasound (performed by means of a four‐quadrant, focused assessment of sonography for trauma (FAST), rather than any type of ultrasound (as per the original protocol).
Keywords
MeSH
Medical Subject Headings (MeSH) Keywords
Medical Subject Headings Check Words
Humans;
PICOs

Study selection process flow diagram for 2015 search update.

Risk of bias summary: review authors' judgements about each risk of bias item for each included study.

Comparison 1 Mortality, Outcome 1 Relative risk of mortality.
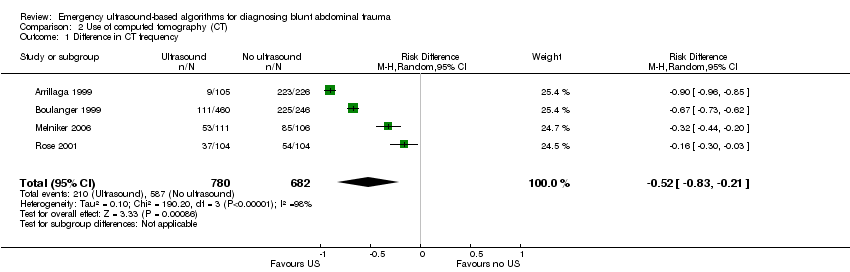
Comparison 2 Use of computed tomography (CT), Outcome 1 Difference in CT frequency.
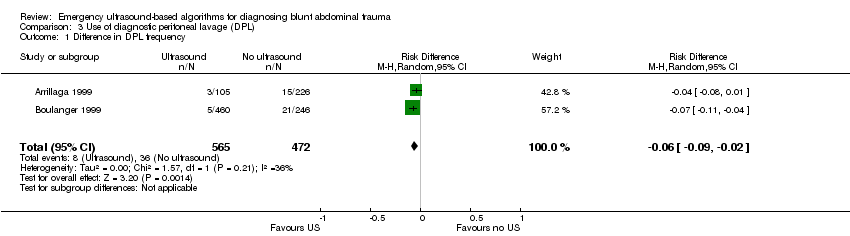
Comparison 3 Use of diagnostic peritoneal lavage (DPL), Outcome 1 Difference in DPL frequency.
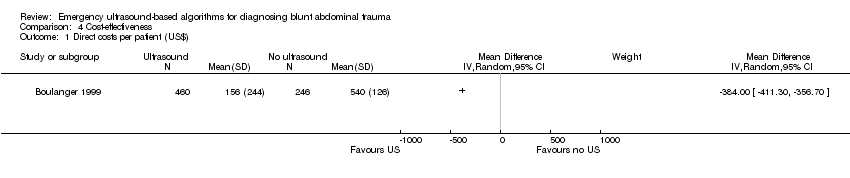
Comparison 4 Cost‐effectiveness, Outcome 1 Direct costs per patient (US$).

Comparison 5 Laparotomy, Outcome 1 Laparotomy rate.
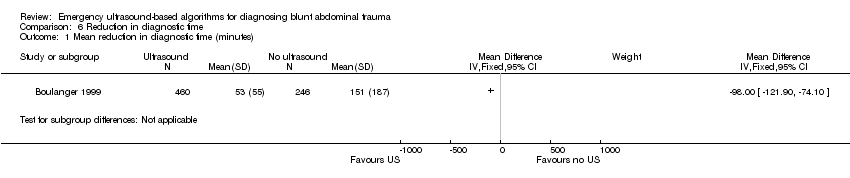
Comparison 6 Reduction in diagnostic time, Outcome 1 Mean reduction in diagnostic time (minutes).
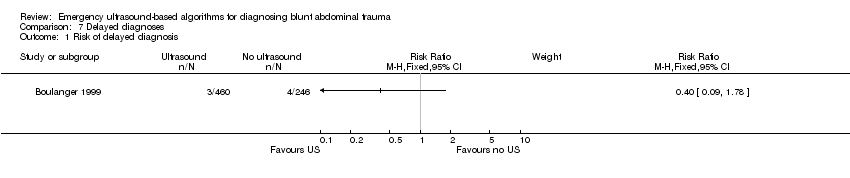
Comparison 7 Delayed diagnoses, Outcome 1 Risk of delayed diagnosis.
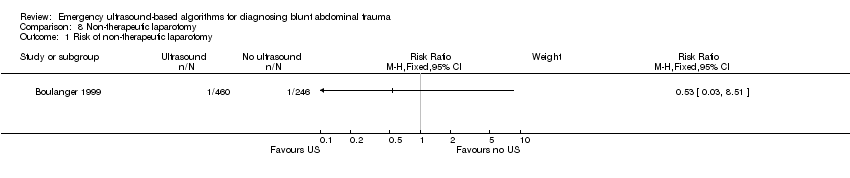
Comparison 8 Non‐therapeutic laparotomy, Outcome 1 Risk of non‐therapeutic laparotomy.
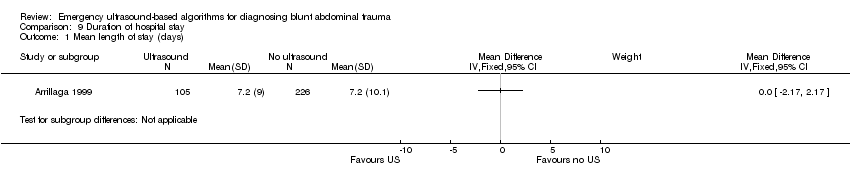
Comparison 9 Duration of hospital stay, Outcome 1 Mean length of stay (days).

Comparison 10 Intensive care, Outcome 1 Mean ICU days.
| Outcome or subgroup title | No. of studies | No. of participants | Statistical method | Effect size |
| 1 Relative risk of mortality Show forest plot | 3 | 1254 | Risk Ratio (M‐H, Random, 95% CI) | 1.00 [0.50, 2.00] |
| Outcome or subgroup title | No. of studies | No. of participants | Statistical method | Effect size |
| 1 Difference in CT frequency Show forest plot | 4 | 1462 | Risk Difference (M‐H, Random, 95% CI) | ‐0.52 [‐0.83, ‐0.21] |
| Outcome or subgroup title | No. of studies | No. of participants | Statistical method | Effect size |
| 1 Difference in DPL frequency Show forest plot | 2 | 1037 | Risk Difference (M‐H, Random, 95% CI) | ‐0.06 [‐0.09, ‐0.02] |
| Outcome or subgroup title | No. of studies | No. of participants | Statistical method | Effect size |
| 1 Direct costs per patient (US$) Show forest plot | 1 | Mean Difference (IV, Random, 95% CI) | Subtotals only | |
| Outcome or subgroup title | No. of studies | No. of participants | Statistical method | Effect size |
| 1 Laparotomy rate Show forest plot | 3 | 1131 | Risk Difference (M‐H, Fixed, 95% CI) | ‐0.00 [‐0.04, 0.04] |
| Outcome or subgroup title | No. of studies | No. of participants | Statistical method | Effect size |
| 1 Mean reduction in diagnostic time (minutes) Show forest plot | 1 | Mean Difference (IV, Fixed, 95% CI) | Subtotals only | |
| Outcome or subgroup title | No. of studies | No. of participants | Statistical method | Effect size |
| 1 Risk of delayed diagnosis Show forest plot | 1 | Risk Ratio (M‐H, Fixed, 95% CI) | Subtotals only | |
| Outcome or subgroup title | No. of studies | No. of participants | Statistical method | Effect size |
| 1 Risk of non‐therapeutic laparotomy Show forest plot | 1 | Risk Ratio (M‐H, Fixed, 95% CI) | Subtotals only | |
| Outcome or subgroup title | No. of studies | No. of participants | Statistical method | Effect size |
| 1 Mean length of stay (days) Show forest plot | 1 | Mean Difference (IV, Fixed, 95% CI) | Subtotals only | |
| Outcome or subgroup title | No. of studies | No. of participants | Statistical method | Effect size |
| 1 Mean ICU days Show forest plot | 1 | Mean Difference (IV, Fixed, 95% CI) | Subtotals only | |