Inhaled corticosteroids for bronchiectasis
Information
- DOI:
- https://doi.org/10.1002/14651858.CD000996.pub3Copy DOI

- Database:
-
- Cochrane Database of Systematic Reviews
- Version published:
-
- 16 May 2018see what's new
- Type:
-
- Intervention
- Stage:
-
- Review
- Cochrane Editorial Group:
-
Cochrane Airways Group
- Copyright:
-
- Copyright © 2018 The Cochrane Collaboration. Published by John Wiley & Sons, Ltd.
Article metrics
Altmetric:
Cited by:
Authors
Contributions of authors
The protocol was written by NK and AC based on previous protocols on cough in children. For the review update: NK and AC performed selection of articles from the search, data extraction, data analysis and writing of the review. HP prepared the manuscript. SB and JK reviewed the manuscript.
Sources of support
Internal sources
-
Royal Children's Hospital Foundation, Brisbane, Australia.
Salary support from the Foundation for the 2009 version of this review
External sources
-
National Health and Medical Research Council, Australia.
AC's Practitioner Fellowship and Project Grant
-
Asthma Australia, Australia.
HP is supported through an Early Career Fellowship
Declarations of interest
Nitin Kapur: none known.
Helen Petsky: none known.
Scott Bell: has received travel and accommodation support to attend investigator meetings (Vertex, Rempex), to participate in advisory boards and to speak at sponsored Symposia. Speakers fees and support to participate in preparation of educational materials and in advisory board have been paid to his Institution.
John Kolbe: has received funds of approximately NZ $500 from Novartis for lecture to GPs as part of an educational symposium. John also received funds to attend investigator meetings from Aradigm, GSK, Insmed, and Corus.
Anne Chang: grant provided by GSK is unrelated to this topic.
Acknowledgements
We thank Elizabeth Stovold for performing the search and Dr Chris Cates and the Cochrane Airways Group for their support.
Rebecca Normansell was the Editor for this review and commented critically on the review.
The Background and Methods sections of this review are based on a standard template used by Cochrane Airways.
This project was supported by the National Institute for Health Research (NIHR), via Cochrane Infrastructure funding to the Cochrane Airways Group. The views and opinions expressed therein are those of the authors and do not necessarily reflect those of the Systematic Reviews Programme, NIHR, National Health Service (NHS), or the Department of Health.
Version history
| Published | Title | Stage | Authors | Version |
| 2018 May 16 | Inhaled corticosteroids for bronchiectasis | Review | Nitin Kapur, Helen L Petsky, Scott Bell, John Kolbe, Anne B Chang | |
| 2009 Jan 21 | Inhaled steroids for bronchiectasis | Review | Nitin Kapur, Scott Bell, John Kolbe, Anne B Chang | |
| 2000 Apr 24 | Inhaled steroids for bronchiectasis | Review | Felix S F Ram, Athol Wells, John Kolbe | |
Differences between protocol and review
-
In the original protocol, we defined 'long‐term effect' as that measured at more than 12 months duration. We changed this to more than six months duration in the first review undertaken by the current group of review authors.
-
We included data from the Martinez‐Garcia 2006 study in the review, although the comparison between the untreated and the inhaled corticosteroids (ICS) groups were not blinded. Also, for clinical severity assessment in the Martinez‐Garcia 2006 study, we used outcome variables of sputum reduction > 50% and dyspnoea score improvement > 1 posthoc, since these were the ones available from the study.
-
We moved lung function to a primary outcome.
-
We included 'Summary of findings' tables in the review.
-
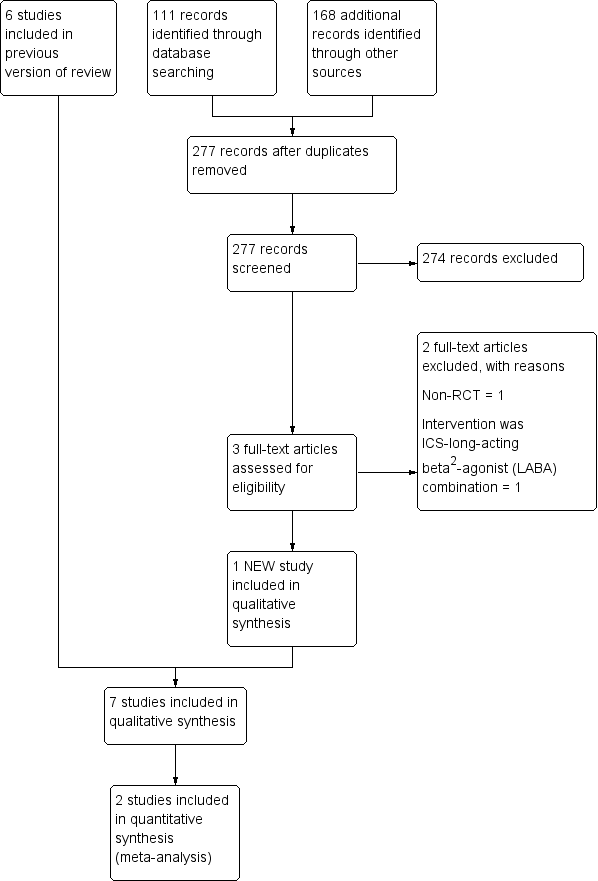
We added a study flow diagram.
-
We specified the methods in more detail following the MECIR standards.
-
We redrafted all sections under recommended headings.
Keywords
MeSH
Medical Subject Headings (MeSH) Keywords
- Administration, Inhalation;
- Adrenal Cortex Hormones [*administration & dosage];
- Androstadienes [administration & dosage];
- Anti‐Bacterial Agents [administration & dosage];
- Beclomethasone [administration & dosage];
- Bronchiectasis [*drug therapy, prevention & control];
- Disease Progression;
- Fluticasone;
- Forced Expiratory Volume;
- Randomized Controlled Trials as Topic;
- Respiratory Function Tests;
- Vital Capacity;
Medical Subject Headings Check Words
Adult; Humans;
PICOs

Risk of bias graph: review authors' judgements about each risk of bias item presented as percentages across all included studies.

Risk of bias summary: review authors' judgements about each risk of bias item for each included study.
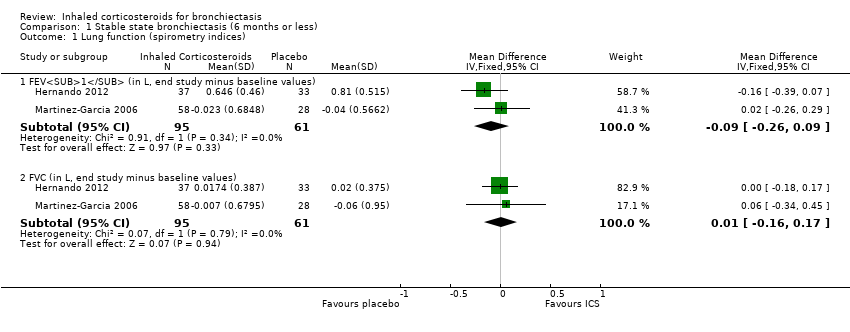
Comparison 1 Stable state bronchiectasis (6 months or less), Outcome 1 Lung function (spirometry indices).

Comparison 1 Stable state bronchiectasis (6 months or less), Outcome 2 Lung function (other indices).

Comparison 1 Stable state bronchiectasis (6 months or less), Outcome 3 Clinical severity indices.
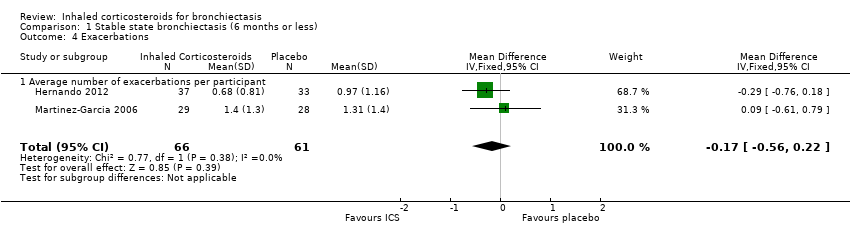
Comparison 1 Stable state bronchiectasis (6 months or less), Outcome 4 Exacerbations.
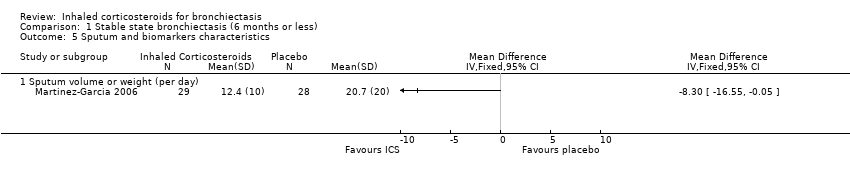
Comparison 1 Stable state bronchiectasis (6 months or less), Outcome 5 Sputum and biomarkers characteristics.

Comparison 1 Stable state bronchiectasis (6 months or less), Outcome 6 Pseudomonas aeruginosa colonisation.

Comparison 1 Stable state bronchiectasis (6 months or less), Outcome 7 St George HRQoL (end of study minus baseline).

Comparison 2 Stable state (> 6 months), Outcome 1 Lung function indices.

Comparison 2 Stable state (> 6 months), Outcome 2 Exacerbations.
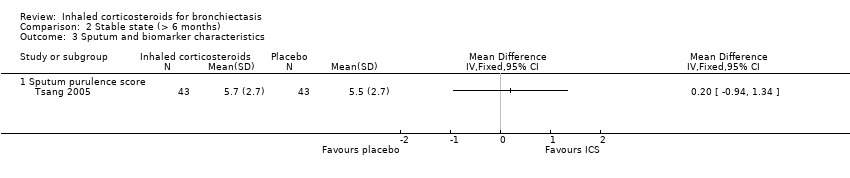
Comparison 2 Stable state (> 6 months), Outcome 3 Sputum and biomarker characteristics.
| Inhaled corticosteroids compared to placebo for bronchiectasis (< 6 months) | ||||||
| Patient or population: people with bronchiectasis | ||||||
| Outcomes | Anticipated absolute effects* (95% CI) | Relative effect | № of participants | Certainty of the evidence | Comments | |
| Risk with placebo | Risk with Inhaled corticosteroids | |||||
| Lung function (spirometry indices) ‐ FEV1 (in L, end study minus baseline values) | Mean change from baseline ranged from ‐0.038 to 0.805 | MD 0.09 lower | ‐ | 156 | ⊕⊕⊝⊝ Low1,2,3 | |
| Lung function (spirometry indices) ‐ FVC (in L, end study minus baseline values) | Mean change from baseline ranged from ‐0.062 to 0.0218 | MD 0.01 higher | ‐ | 156 | ⊕⊕⊝⊝ Low1,2,3 | |
| Lung function (other indices) ‐ diffusion capacity % predicted (end of study) | Mean end of study value 84.2 | MD 2.70 higher | ‐ | 57 | ⊕⊕⊝⊝ Low1,2,3 | |
| Lung function (other indices) ‐ RV % predicted (end of study values) | Mean end of study value 106 | MD 2.00 higher | ‐ | 57 | ⊕⊕⊝⊝ Low1,2,3 | |
| Lung function (other indices) ‐ TLC % predicted (end of study values) | Mean end of study value 86.4 | MD 3.20 higher | ‐ | 57 | ⊕⊕⊝⊝ Low1,2,3 | |
| Average number of exacerbations per participant | Average number of exacerbations per patient ranged from 0.97 to 1.31 | MD 0.17 lower | ‐ | 127 | ⊕⊕⊝⊝ Low1,2,3 | |
| Pseudomonas aeruginosa (P aeruginosa) colonisation | 410 per 1000 | 395 per 1000 | OR 0.94 | 156 | ⊕⊕⊝⊝ Low1,2,3 | |
| *The risk in the intervention group (and its 95% confidence interval) is based on the assumed risk in the comparison group and the relative effect of the intervention (and its 95% CI). | ||||||
| GRADE Working Group grades of evidence | ||||||
| 1The largest study was not a placebo controlled trial (Martinez‐Garcia 2006). | ||||||
| Inhaled corticosteroids compared to placebo for bronchiectasis (medium‐ to long‐term outcomes) | ||||||
| Patient or population: people with bronchiectasis | ||||||
| Outcomes | Anticipated absolute effects* (95% CI) | Relative effect | № of participants | Certainty of the evidence | Comments | |
| Risk with placebo | Risk with Inhaled corticosteroids | |||||
| Lung function indices ‐ FEV1% predicted (end study minus baseline values) | Mean change from baseline 0 | MD 0.30 higher | ‐ | 86 | ⊕⊕⊝⊝ Low1,2 | |
| Lung function indices ‐ FVC % predicted (end study minus baseline values) | Mean change from baseline 0.9 | MD 0.90 lower | ‐ | 86 | ⊕⊕⊝⊝ Low1,2 | |
| Number of participants improved | 628 per 1000 | 490 per 1000 | OR 0.57 | 86 | ⊕⊕⊝⊝ Low1,2 | |
| *The risk in the intervention group (and its 95% confidence interval) is based on the assumed risk in the comparison group and the relative effect of the intervention (and its 95% CI). | ||||||
| GRADE Working Group grades of evidence | ||||||
| 1Only a single study with small participant numbers; we downgraded outcome one point for imprecision. | ||||||
| Study ID | Intervention | Control | Duration of intervention |
| Beclomethasone dipropionate 750 µg twice daily by MDI | Placebo | 6 weeks | |
| Budesonide 400 µg twice daily | Placebo | 6 months | |
| Beclomethasone 800 µg per day over 2 doses | Placebo | 4 weeks | |
| Fluticasone 500 µg twice daily by MDI or 250 µg fluticasone twice daily | No treatment | 6 months | |
| Fluticasone 500 µg twice daily by accuhaler | Placebo | 4 weeks | |
| Fluticasone 500 µg twice daily by accuhaler | Placebo | 52 weeks | |
| Fluticasone 500 µg twice daily by accuhaler | Placebo | 52 weeks | |
| MDI: metered dose inhaler | |||
| Outcome or subgroup title | No. of studies | No. of participants | Statistical method | Effect size |
| 1 Lung function (spirometry indices) Show forest plot | 2 | Mean Difference (IV, Fixed, 95% CI) | Subtotals only | |
| 1.1 FEV1 (in L, end study minus baseline values) | 2 | 156 | Mean Difference (IV, Fixed, 95% CI) | ‐0.09 [‐0.26, 0.09] |
| 1.2 FVC (in L, end study minus baseline values) | 2 | 156 | Mean Difference (IV, Fixed, 95% CI) | 0.01 [‐0.16, 0.17] |
| 2 Lung function (other indices) Show forest plot | 1 | Mean Difference (IV, Fixed, 95% CI) | Subtotals only | |
| 2.1 Diffusion capacity % predicted (end of study) | 1 | 57 | Mean Difference (IV, Fixed, 95% CI) | 2.70 [‐2.49, 7.89] |
| 2.2 RV % predicted (end of study values) | 1 | 57 | Mean Difference (IV, Fixed, 95% CI) | 2.0 [‐9.41, 13.41] |
| 2.3 TLC % predicted (end of study values) | 1 | 57 | Mean Difference (IV, Fixed, 95% CI) | 3.20 [‐1.99, 8.39] |
| 3 Clinical severity indices Show forest plot | 1 | Odds Ratio (M‐H, Fixed, 95% CI) | Totals not selected | |
| 3.1 Number of participants with regular wheeze (combined) | 1 | Odds Ratio (M‐H, Fixed, 95% CI) | 0.0 [0.0, 0.0] | |
| 3.2 Number of participants without sputum reduction of > 50% (combined) | 1 | Odds Ratio (M‐H, Fixed, 95% CI) | 0.0 [0.0, 0.0] | |
| 3.3 Number of participants with no improvement in dyspnoea score > 1 (min important difference) (1000F) | 1 | Odds Ratio (M‐H, Fixed, 95% CI) | 0.0 [0.0, 0.0] | |
| 3.4 Number of participants with no clinically significant improvement in HRQoL | 1 | Odds Ratio (M‐H, Fixed, 95% CI) | 0.0 [0.0, 0.0] | |
| 4 Exacerbations Show forest plot | 2 | 127 | Mean Difference (IV, Fixed, 95% CI) | ‐0.17 [‐0.56, 0.22] |
| 4.1 Average number of exacerbations per participant | 2 | 127 | Mean Difference (IV, Fixed, 95% CI) | ‐0.17 [‐0.56, 0.22] |
| 5 Sputum and biomarkers characteristics Show forest plot | 1 | Mean Difference (IV, Fixed, 95% CI) | Totals not selected | |
| 5.1 Sputum volume or weight (per day) | 1 | Mean Difference (IV, Fixed, 95% CI) | 0.0 [0.0, 0.0] | |
| 6 Pseudomonas aeruginosa colonisation Show forest plot | 2 | 156 | Odds Ratio (M‐H, Fixed, 95% CI) | 0.94 [0.45, 1.96] |
| 7 St George HRQoL (end of study minus baseline) Show forest plot | 2 | Mean Difference (IV, Fixed, 95% CI) | Subtotals only | |
| 7.1 Total score | 2 | 127 | Mean Difference (IV, Fixed, 95% CI) | ‐3.54 [‐8.00, 0.92] |
| 7.2 Symptom score | 2 | 127 | Mean Difference (IV, Fixed, 95% CI) | ‐4.75 [‐10.42, 0.92] |
| 7.3 Activity score | 2 | 127 | Mean Difference (IV, Fixed, 95% CI) | ‐6.21 [‐12.40, ‐0.01] |
| 7.4 Impact score | 1 | 70 | Mean Difference (IV, Fixed, 95% CI) | ‐3.63 [‐9.35, 2.09] |
| Outcome or subgroup title | No. of studies | No. of participants | Statistical method | Effect size |
| 1 Lung function indices Show forest plot | 1 | Mean Difference (IV, Fixed, 95% CI) | Totals not selected | |
| 1.1 FEV1% predicted (end study minus baseline values) | 1 | Mean Difference (IV, Fixed, 95% CI) | 0.0 [0.0, 0.0] | |
| 1.2 FVC % predicted (end study minus baseline values) | 1 | Mean Difference (IV, Fixed, 95% CI) | 0.0 [0.0, 0.0] | |
| 2 Exacerbations Show forest plot | 1 | Odds Ratio (M‐H, Fixed, 95% CI) | Totals not selected | |
| 2.1 Number of participants improved | 1 | Odds Ratio (M‐H, Fixed, 95% CI) | 0.0 [0.0, 0.0] | |
| 3 Sputum and biomarker characteristics Show forest plot | 1 | Mean Difference (IV, Fixed, 95% CI) | Totals not selected | |
| 3.1 Sputum purulence score | 1 | Mean Difference (IV, Fixed, 95% CI) | 0.0 [0.0, 0.0] | |