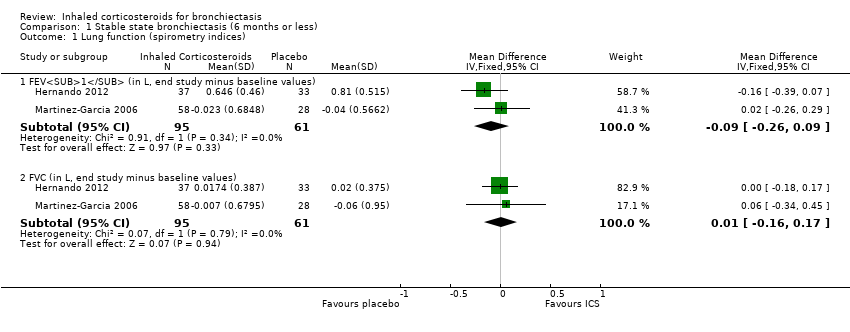
| 1 Lung function (spirometry indices) Show forest plot | 2 | | Mean Difference (IV, Fixed, 95% CI) | Subtotals only |
|
| 1.1 FEV1 (in L, end study minus baseline values) | 2 | 156 | Mean Difference (IV, Fixed, 95% CI) | ‐0.09 [‐0.26, 0.09] |
| 1.2 FVC (in L, end study minus baseline values) | 2 | 156 | Mean Difference (IV, Fixed, 95% CI) | 0.01 [‐0.16, 0.17] |
| 2 Lung function (other indices) Show forest plot | 1 | | Mean Difference (IV, Fixed, 95% CI) | Subtotals only |
|
| 2.1 Diffusion capacity % predicted (end of study) | 1 | 57 | Mean Difference (IV, Fixed, 95% CI) | 2.70 [‐2.49, 7.89] |
| 2.2 RV % predicted (end of study values) | 1 | 57 | Mean Difference (IV, Fixed, 95% CI) | 2.0 [‐9.41, 13.41] |
| 2.3 TLC % predicted (end of study values) | 1 | 57 | Mean Difference (IV, Fixed, 95% CI) | 3.20 [‐1.99, 8.39] |
| 3 Clinical severity indices Show forest plot | 1 | | Odds Ratio (M‐H, Fixed, 95% CI) | Totals not selected |
|
| 3.1 Number of participants with regular wheeze (combined) | 1 | | Odds Ratio (M‐H, Fixed, 95% CI) | 0.0 [0.0, 0.0] |
| 3.2 Number of participants without sputum reduction of > 50% (combined) | 1 | | Odds Ratio (M‐H, Fixed, 95% CI) | 0.0 [0.0, 0.0] |
| 3.3 Number of participants with no improvement in dyspnoea score > 1 (min important difference) (1000F) | 1 | | Odds Ratio (M‐H, Fixed, 95% CI) | 0.0 [0.0, 0.0] |
| 3.4 Number of participants with no clinically significant improvement in HRQoL | 1 | | Odds Ratio (M‐H, Fixed, 95% CI) | 0.0 [0.0, 0.0] |
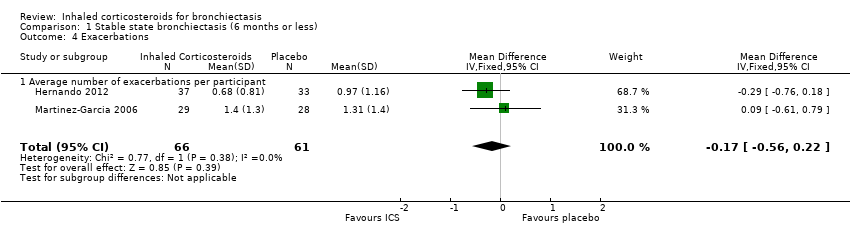
| 4 Exacerbations Show forest plot | 2 | 127 | Mean Difference (IV, Fixed, 95% CI) | ‐0.17 [‐0.56, 0.22] |
|
| 4.1 Average number of exacerbations per participant | 2 | 127 | Mean Difference (IV, Fixed, 95% CI) | ‐0.17 [‐0.56, 0.22] |
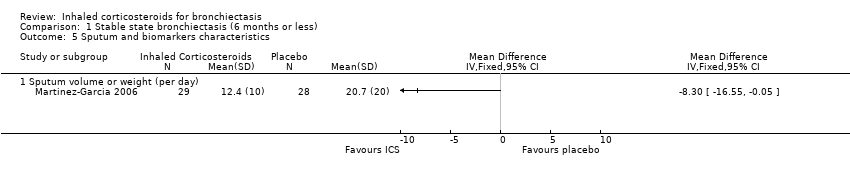
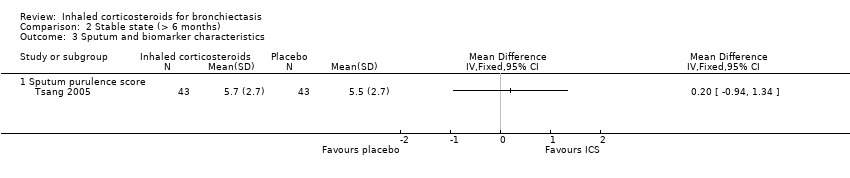
| 5 Sputum and biomarkers characteristics Show forest plot | 1 | | Mean Difference (IV, Fixed, 95% CI) | Totals not selected |
|
| 5.1 Sputum volume or weight (per day) | 1 | | Mean Difference (IV, Fixed, 95% CI) | 0.0 [0.0, 0.0] |
| 6 Pseudomonas aeruginosa colonisation Show forest plot | 2 | 156 | Odds Ratio (M‐H, Fixed, 95% CI) | 0.94 [0.45, 1.96] |
|
| 7 St George HRQoL (end of study minus baseline) Show forest plot | 2 | | Mean Difference (IV, Fixed, 95% CI) | Subtotals only |
|
| 7.1 Total score | 2 | 127 | Mean Difference (IV, Fixed, 95% CI) | ‐3.54 [‐8.00, 0.92] |
| 7.2 Symptom score | 2 | 127 | Mean Difference (IV, Fixed, 95% CI) | ‐4.75 [‐10.42, 0.92] |
| 7.3 Activity score | 2 | 127 | Mean Difference (IV, Fixed, 95% CI) | ‐6.21 [‐12.40, ‐0.01] |
| 7.4 Impact score | 1 | 70 | Mean Difference (IV, Fixed, 95% CI) | ‐3.63 [‐9.35, 2.09] |