Angioplastia con parche versus cierre primario para la endarterectomía carotídea
Appendices
Appendix 1. MEDLINE search strategies
MEDLINE 1966 to 1995
Term used "carotid endarterectomy"
MEDLINE (Ovid) 1994 to 2008 and Cochrane Central Register of Controlled Trials (lines 1 to 12)
1 Endarterectomy, carotid/
2 exp carotid arteries/su (surgery)
3 exp carotid artery diseases/su
4 exp carotid arteries/
5 exp carotid artery diseases/
6 carotid.tw.
7 4 or 5 or 6
8 endarterectomy/
9 (endarterectom$ or surg$).tw.
10 8 or 9
11 7 and 10
12 1 or 2 or 3 or 11
13 randomized controlled trial.pt.
14 randomized controlled trials as topic/
15 controlled clinical trial.pt.
16 controlled clinical trials as topic/
17 random allocation/
18 clinical trial.pt.
19 exp clinical trials as topic/
20 (clin$ adj25 trial$).tw.
21 random$.tw.
22 research design/
23 intervention studies/
24 control$.tw.
25 patch$.tw.
26 or/13‐25
27 12 and 26
28 limit 27 to humans
Appendix 2. EMBASE search strategies
EMBASE 1980 to 1995
Terms used "carotid endarterectomy" and "carotid surgery"
EMBASE (Ovid) 1994 to 2008
1 carotid endarterectomy/
2 carotid artery surgery/
3 exp carotid artery disease/su
4 exp carotid artery/
5 exp carotid artery disease/
6 4 or 5
7 artery surgery/ or endarterectomy/ or vascular surgery/ or surgery/
8 6 and 7
9 (carotid adj5 (endarterect$ or surgery)).tw.
10 1 or 2 or 3 or 8 or 9
11 Clinical trial/
12 randomized controlled trial/
13 controlled study/
14 randomization/
15 random$.tw.
16 Prospective study/
17 "Evaluation and follow up"/ or Follow up/
18 versus.tw.
19 prospective.tw.
20 types of study/
21 methodology/
22 comparative study/
23 ((intervention or experiment$) adj5 group$).tw.
24 Parallel design/
25 intermethod comparison/
26 (controls or control group$).tw.
27 (control$ adj trial$).tw.
28 patch$.tw.
29 or/11‐28
30 10 and 29
31 limit 30 to humans
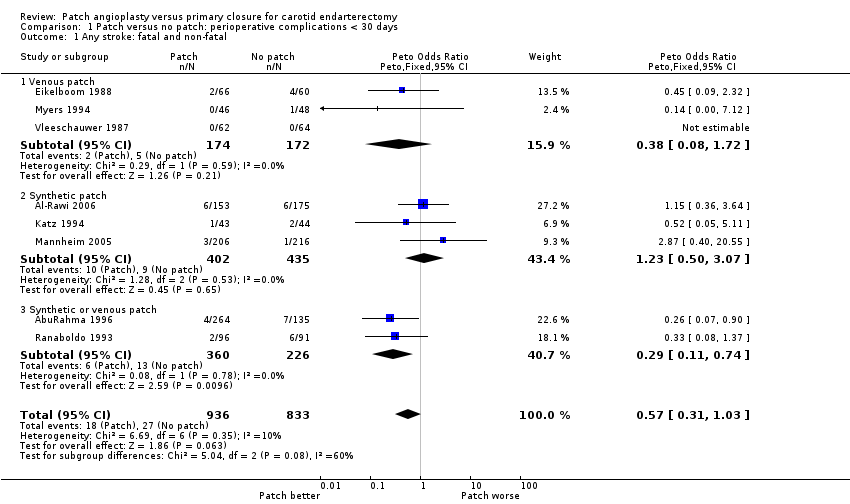
Comparison 1 Patch versus no patch: perioperative complications < 30 days, Outcome 1 Any stroke: fatal and non‐fatal.
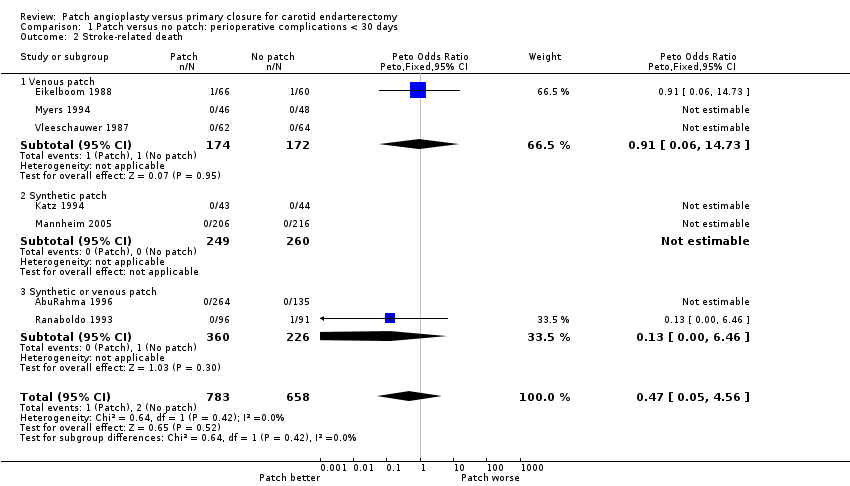
Comparison 1 Patch versus no patch: perioperative complications < 30 days, Outcome 2 Stroke‐related death.

Comparison 1 Patch versus no patch: perioperative complications < 30 days, Outcome 3 Stroke ipsilateral to endarterectomy site.
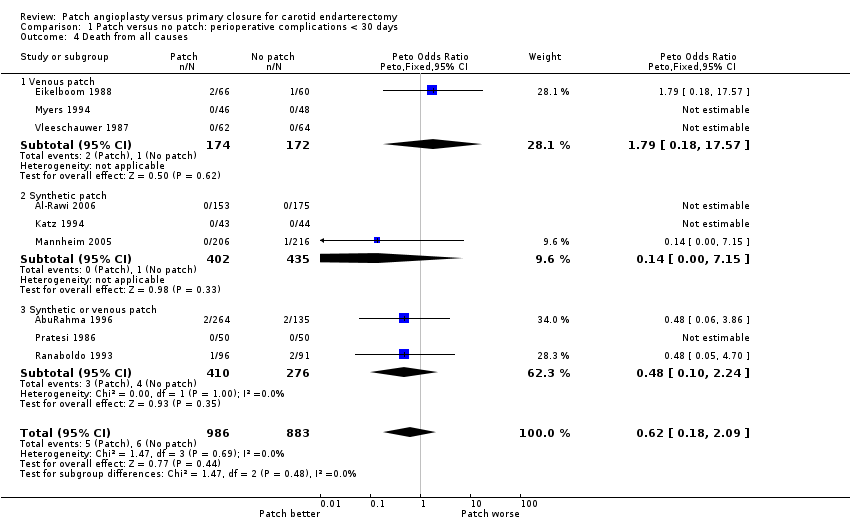
Comparison 1 Patch versus no patch: perioperative complications < 30 days, Outcome 4 Death from all causes.
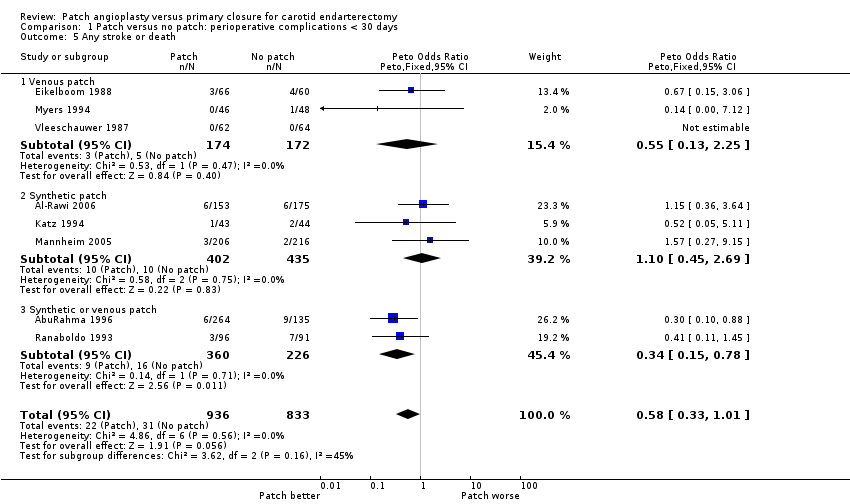
Comparison 1 Patch versus no patch: perioperative complications < 30 days, Outcome 5 Any stroke or death.

Comparison 1 Patch versus no patch: perioperative complications < 30 days, Outcome 6 Occlusion of the artery operated on.

Comparison 1 Patch versus no patch: perioperative complications < 30 days, Outcome 7 Rupture/haemorrhage of endarterectomy site.

Comparison 1 Patch versus no patch: perioperative complications < 30 days, Outcome 8 Infection of the endarterectomy site.
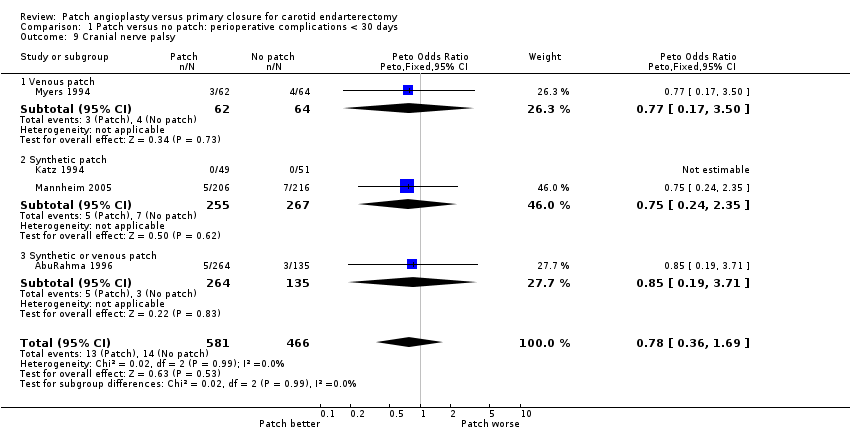
Comparison 1 Patch versus no patch: perioperative complications < 30 days, Outcome 9 Cranial nerve palsy.

Comparison 1 Patch versus no patch: perioperative complications < 30 days, Outcome 10 Complication with return to theatre.
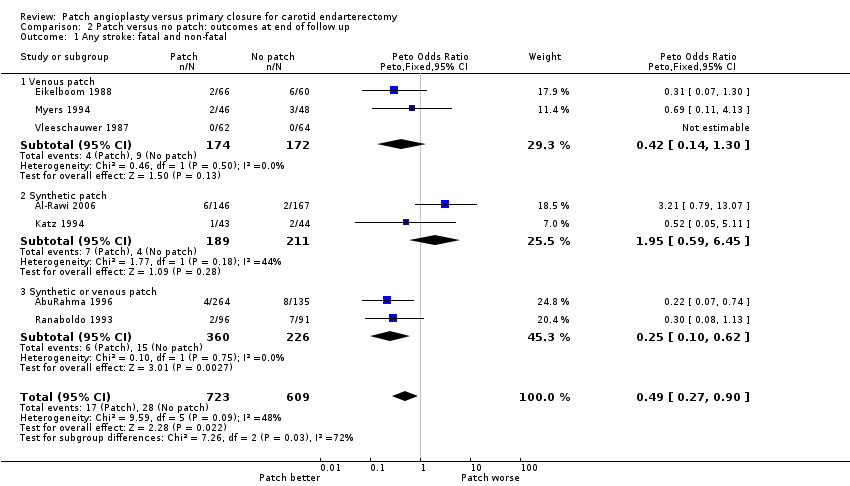
Comparison 2 Patch versus no patch: outcomes at end of follow up, Outcome 1 Any stroke: fatal and non‐fatal.
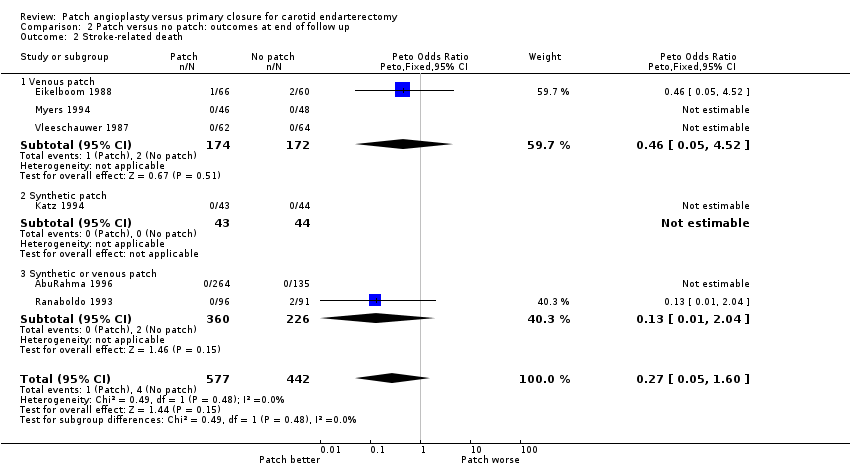
Comparison 2 Patch versus no patch: outcomes at end of follow up, Outcome 2 Stroke‐related death.
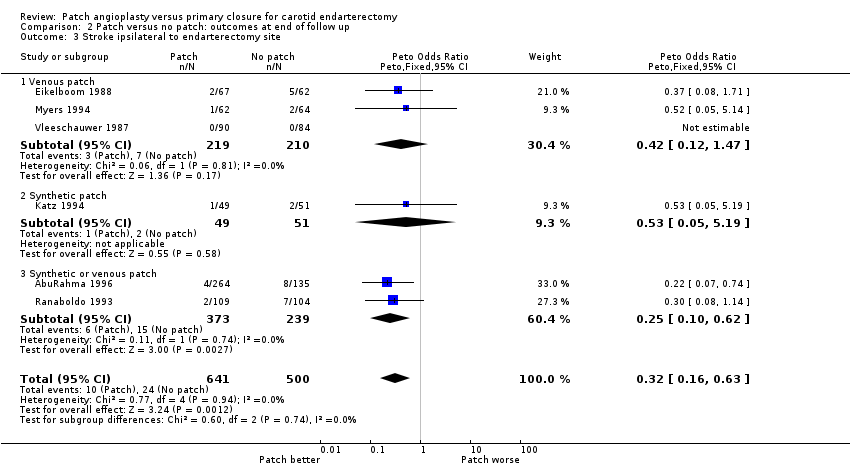
Comparison 2 Patch versus no patch: outcomes at end of follow up, Outcome 3 Stroke ipsilateral to endarterectomy site.
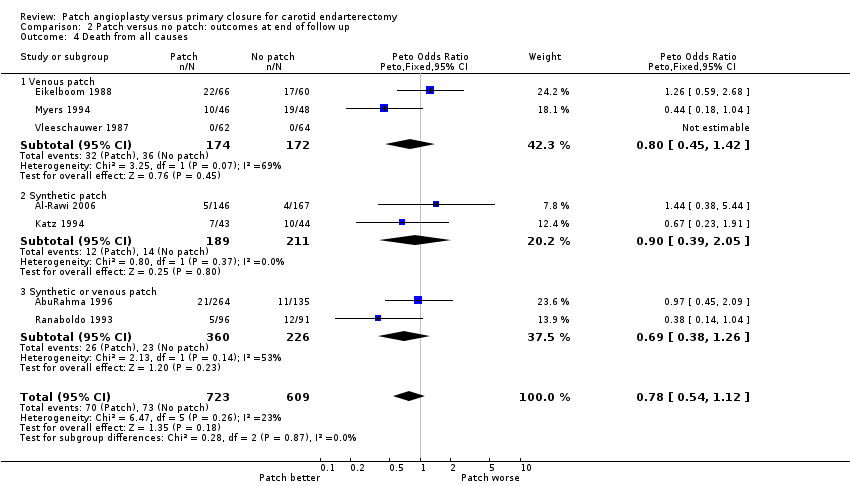
Comparison 2 Patch versus no patch: outcomes at end of follow up, Outcome 4 Death from all causes.

Comparison 2 Patch versus no patch: outcomes at end of follow up, Outcome 5 Any stroke or death.

Comparison 2 Patch versus no patch: outcomes at end of follow up, Outcome 6 Restenosis/occlusion of the operated artery.
| Study | Total patients | Total operations | Patch lost at 30 days | Patch lost at end | Primary lost at 30 days | Primary lost at end | Number of exclusions | Crossover patch ‐ non | Crossover non ‐ patch |
| 357 | 399 | 0 | 0 | 0 | 0 | 4 | 0 | 0 | |
| 315 | 338 | 0 | 7 | 0 | 8 | 10 | Data not available | Data not available | |
| 126 | 129 | 0 | 10 patients lost to doppler FU but not clinical FU | 0 | 7 to doppler FU but not clinical FU | 0 | 3 | 3 | |
| 87 | 100 | 0 | 5 | 0 | 7 | 0 | 0 | 0 | |
| 123 | 140 | 0 | 0 | 0 | 0 | 4 | Between 0 and 4 | Between 0 and 4 | |
| 404 | 422 | 0 | Data not available | 0 | Data not available | Data not available | 0 | 0 | |
| 136 (109 after exclusion of 27 patients undergoing obligatory vein patching) | 152 (122 analysed as 30 operations got obligatory vein patches) | 0 | 6 | 0 | 8 | 30 operations underwent obligatory vein patch closure and 16 patients had both sides done (total 46) | 0 | 0 | |
| 100 | 100 | Data not available | Data not available | Data not available | Data not available | Data not available | Data not available | Data not available | |
| 199 | 213 | 0 | 5 | 0 | 12 | 0 | 0 | 0 at 30‐day FU but 4 at 1‐year FU | |
| 126 | 174 | 0 | Data not available | 0 | Data not available | 0 | 0 | 0 | |
| FU: follow up | |||||||||
| Outcome or subgroup title | No. of studies | No. of participants | Statistical method | Effect size |
| 1 Any stroke: fatal and non‐fatal Show forest plot | 8 | 1769 | Peto Odds Ratio (Peto, Fixed, 95% CI) | 0.57 [0.31, 1.03] |
| 1.1 Venous patch | 3 | 346 | Peto Odds Ratio (Peto, Fixed, 95% CI) | 0.38 [0.08, 1.72] |
| 1.2 Synthetic patch | 3 | 837 | Peto Odds Ratio (Peto, Fixed, 95% CI) | 1.23 [0.50, 3.07] |
| 1.3 Synthetic or venous patch | 2 | 586 | Peto Odds Ratio (Peto, Fixed, 95% CI) | 0.29 [0.11, 0.74] |
| 2 Stroke‐related death Show forest plot | 7 | 1441 | Peto Odds Ratio (Peto, Fixed, 95% CI) | 0.47 [0.05, 4.56] |
| 2.1 Venous patch | 3 | 346 | Peto Odds Ratio (Peto, Fixed, 95% CI) | 0.91 [0.06, 14.73] |
| 2.2 Synthetic patch | 2 | 509 | Peto Odds Ratio (Peto, Fixed, 95% CI) | 0.0 [0.0, 0.0] |
| 2.3 Synthetic or venous patch | 2 | 586 | Peto Odds Ratio (Peto, Fixed, 95% CI) | 0.13 [0.00, 6.46] |
| 3 Stroke ipsilateral to endarterectomy site Show forest plot | 7 | 1201 | Peto Odds Ratio (Peto, Fixed, 95% CI) | 0.31 [0.15, 0.63] |
| 3.1 Venous patch | 3 | 349 | Peto Odds Ratio (Peto, Fixed, 95% CI) | 0.39 [0.09, 1.75] |
| 3.2 Synthetic patch | 1 | 100 | Peto Odds Ratio (Peto, Fixed, 95% CI) | 0.53 [0.05, 5.19] |
| 3.3 Synthetic or venous patch | 3 | 752 | Peto Odds Ratio (Peto, Fixed, 95% CI) | 0.27 [0.11, 0.62] |
| 4 Death from all causes Show forest plot | 9 | 1869 | Peto Odds Ratio (Peto, Fixed, 95% CI) | 0.62 [0.18, 2.09] |
| 4.1 Venous patch | 3 | 346 | Peto Odds Ratio (Peto, Fixed, 95% CI) | 1.79 [0.18, 17.57] |
| 4.2 Synthetic patch | 3 | 837 | Peto Odds Ratio (Peto, Fixed, 95% CI) | 0.14 [0.00, 7.15] |
| 4.3 Synthetic or venous patch | 3 | 686 | Peto Odds Ratio (Peto, Fixed, 95% CI) | 0.48 [0.10, 2.24] |
| 5 Any stroke or death Show forest plot | 8 | 1769 | Peto Odds Ratio (Peto, Fixed, 95% CI) | 0.58 [0.33, 1.01] |
| 5.1 Venous patch | 3 | 346 | Peto Odds Ratio (Peto, Fixed, 95% CI) | 0.55 [0.13, 2.25] |
| 5.2 Synthetic patch | 3 | 837 | Peto Odds Ratio (Peto, Fixed, 95% CI) | 1.10 [0.45, 2.69] |
| 5.3 Synthetic or venous patch | 2 | 586 | Peto Odds Ratio (Peto, Fixed, 95% CI) | 0.34 [0.15, 0.78] |
| 6 Occlusion of the artery operated on Show forest plot | 7 | 1435 | Peto Odds Ratio (Peto, Fixed, 95% CI) | 0.18 [0.08, 0.41] |
| 6.1 Venous patch | 2 | 255 | Peto Odds Ratio (Peto, Fixed, 95% CI) | 0.12 [0.01, 1.99] |
| 6.2 Synthetic patch | 2 | 428 | Peto Odds Ratio (Peto, Fixed, 95% CI) | 0.33 [0.06, 1.95] |
| 6.3 Synthetic or venous patch | 3 | 752 | Peto Odds Ratio (Peto, Fixed, 95% CI) | 0.16 [0.06, 0.42] |
| 7 Rupture/haemorrhage of endarterectomy site Show forest plot | 9 | 2031 | Peto Odds Ratio (Peto, Fixed, 95% CI) | 1.24 [0.61, 2.54] |
| 7.1 Venous patch | 3 | 429 | Peto Odds Ratio (Peto, Fixed, 95% CI) | 6.86 [0.14, 346.63] |
| 7.2 Synthetic patch | 3 | 850 | Peto Odds Ratio (Peto, Fixed, 95% CI) | 0.92 [0.39, 2.14] |
| 7.3 Synthetic or venous patch | 3 | 752 | Peto Odds Ratio (Peto, Fixed, 95% CI) | 2.32 [0.56, 9.57] |
| 8 Infection of the endarterectomy site Show forest plot | 7 | 1563 | Peto Odds Ratio (Peto, Fixed, 95% CI) | 0.38 [0.09, 1.54] |
| 8.1 Venous patch | 3 | 429 | Peto Odds Ratio (Peto, Fixed, 95% CI) | 0.0 [0.0, 0.0] |
| 8.2 Synthetic patch | 2 | 522 | Peto Odds Ratio (Peto, Fixed, 95% CI) | 0.38 [0.09, 1.54] |
| 8.3 Synthetic or venous patch | 2 | 612 | Peto Odds Ratio (Peto, Fixed, 95% CI) | 0.0 [0.0, 0.0] |
| 9 Cranial nerve palsy Show forest plot | 4 | 1047 | Peto Odds Ratio (Peto, Fixed, 95% CI) | 0.78 [0.36, 1.69] |
| 9.1 Venous patch | 1 | 126 | Peto Odds Ratio (Peto, Fixed, 95% CI) | 0.77 [0.17, 3.50] |
| 9.2 Synthetic patch | 2 | 522 | Peto Odds Ratio (Peto, Fixed, 95% CI) | 0.75 [0.24, 2.35] |
| 9.3 Synthetic or venous patch | 1 | 399 | Peto Odds Ratio (Peto, Fixed, 95% CI) | 0.85 [0.19, 3.71] |
| 10 Complication with return to theatre Show forest plot | 7 | 1281 | Peto Odds Ratio (Peto, Fixed, 95% CI) | 0.35 [0.16, 0.79] |
| 10.1 Venous patch | 3 | 429 | Peto Odds Ratio (Peto, Fixed, 95% CI) | 0.98 [0.06, 15.64] |
| 10.2 Synthetic patch | 1 | 100 | Peto Odds Ratio (Peto, Fixed, 95% CI) | 0.53 [0.05, 5.19] |
| 10.3 Synthetic or venous patch | 3 | 752 | Peto Odds Ratio (Peto, Fixed, 95% CI) | 0.29 [0.12, 0.73] |
| Outcome or subgroup title | No. of studies | No. of participants | Statistical method | Effect size |
| 1 Any stroke: fatal and non‐fatal Show forest plot | 7 | 1332 | Peto Odds Ratio (Peto, Fixed, 95% CI) | 0.49 [0.27, 0.90] |
| 1.1 Venous patch | 3 | 346 | Peto Odds Ratio (Peto, Fixed, 95% CI) | 0.42 [0.14, 1.30] |
| 1.2 Synthetic patch | 2 | 400 | Peto Odds Ratio (Peto, Fixed, 95% CI) | 1.95 [0.59, 6.45] |
| 1.3 Synthetic or venous patch | 2 | 586 | Peto Odds Ratio (Peto, Fixed, 95% CI) | 0.25 [0.10, 0.62] |
| 2 Stroke‐related death Show forest plot | 6 | 1019 | Peto Odds Ratio (Peto, Fixed, 95% CI) | 0.27 [0.05, 1.60] |
| 2.1 Venous patch | 3 | 346 | Peto Odds Ratio (Peto, Fixed, 95% CI) | 0.46 [0.05, 4.52] |
| 2.2 Synthetic patch | 1 | 87 | Peto Odds Ratio (Peto, Fixed, 95% CI) | 0.0 [0.0, 0.0] |
| 2.3 Synthetic or venous patch | 2 | 586 | Peto Odds Ratio (Peto, Fixed, 95% CI) | 0.13 [0.01, 2.04] |
| 3 Stroke ipsilateral to endarterectomy site Show forest plot | 6 | 1141 | Peto Odds Ratio (Peto, Fixed, 95% CI) | 0.32 [0.16, 0.63] |
| 3.1 Venous patch | 3 | 429 | Peto Odds Ratio (Peto, Fixed, 95% CI) | 0.42 [0.12, 1.47] |
| 3.2 Synthetic patch | 1 | 100 | Peto Odds Ratio (Peto, Fixed, 95% CI) | 0.53 [0.05, 5.19] |
| 3.3 Synthetic or venous patch | 2 | 612 | Peto Odds Ratio (Peto, Fixed, 95% CI) | 0.25 [0.10, 0.62] |
| 4 Death from all causes Show forest plot | 7 | 1332 | Peto Odds Ratio (Peto, Fixed, 95% CI) | 0.78 [0.54, 1.12] |
| 4.1 Venous patch | 3 | 346 | Peto Odds Ratio (Peto, Fixed, 95% CI) | 0.80 [0.45, 1.42] |
| 4.2 Synthetic patch | 2 | 400 | Peto Odds Ratio (Peto, Fixed, 95% CI) | 0.90 [0.39, 2.05] |
| 4.3 Synthetic or venous patch | 2 | 586 | Peto Odds Ratio (Peto, Fixed, 95% CI) | 0.69 [0.38, 1.26] |
| 5 Any stroke or death Show forest plot | 6 | 1019 | Peto Odds Ratio (Peto, Fixed, 95% CI) | 0.59 [0.42, 0.84] |
| 5.1 Venous patch | 3 | 346 | Peto Odds Ratio (Peto, Fixed, 95% CI) | 0.69 [0.40, 1.20] |
| 5.2 Synthetic patch | 1 | 87 | Peto Odds Ratio (Peto, Fixed, 95% CI) | 0.62 [0.23, 1.66] |
| 5.3 Synthetic or venous patch | 2 | 586 | Peto Odds Ratio (Peto, Fixed, 95% CI) | 0.51 [0.30, 0.86] |
| 6 Restenosis/occlusion of the operated artery Show forest plot | 8 | 1719 | Peto Odds Ratio (Peto, Fixed, 95% CI) | 0.24 [0.17, 0.34] |
| 6.1 Venous patch | 3 | 429 | Peto Odds Ratio (Peto, Fixed, 95% CI) | 0.34 [0.17, 0.66] |
| 6.2 Synthetic patch | 3 | 678 | Peto Odds Ratio (Peto, Fixed, 95% CI) | 0.46 [0.22, 0.98] |
| 6.3 Synthetic or venous patch | 2 | 612 | Peto Odds Ratio (Peto, Fixed, 95% CI) | 0.15 [0.09, 0.25] |