Angioplastia con parche versus cierre primario para la endarterectomía carotídea
References
References to studies included in this review
References to studies excluded from this review
Additional references
References to other published versions of this review
Characteristics of studies
Characteristics of included studies [ordered by study ID]
Jump to:
| Methods | R = computer‐generated sealed envelopes (artery randomised) | |
| Participants | USA | |
| Interventions | Rx: polytetrafluoroethylene patch or alternating saphenous vein patch (from ankle) and jugular vein | |
| Outcomes | Death, ipsilateral stroke, ipsilateral TIA and ipsilateral RIND at 30 days and 48 months | |
| Notes | Ex: patients with ICA < 4 mm or combined CABG or redo surgery | |
| Risk of bias | ||
| Bias | Authors' judgement | Support for judgement |
| Allocation concealment? | Low risk | A ‐ Adequate |
| Methods | R = envelope | |
| Participants | England | |
| Interventions | Rx: collagen‐coated polyester vascular patch | |
| Outcomes | Deaths < 30 days and end of FU | |
| Notes | Ex: 10 patients due to: poor cerebral blood flow (3 patients), ST depression (1 patient), high tortuosity (6 patients) | |
| Risk of bias | ||
| Bias | Authors' judgement | Support for judgement |
| Allocation concealment? | Unclear risk | C ‐ Inadequate |
| Methods | R = odd/even hospital number (patients randomised) | |
| Participants | The Netherlands | |
| Interventions | Rx: saphenous vein patch | |
| Outcomes | Deaths < 30 days and end of FU | |
| Notes | Ex: simultaneous cardiac surgery | |
| Risk of bias | ||
| Bias | Authors' judgement | Support for judgement |
| Allocation concealment? | High risk | C ‐ Inadequate |
| Methods | R = odd/even social security number (patients randomised) | |
| Participants | USA | |
| Interventions | Rx: polytetrafluoroethylene patch | |
| Outcomes | Death < 30 days and end of FU | |
| Notes | Ex: previous endarterectomy, simultaneous cardiac surgery, internal carotid artery diameter < 3.5 mm | |
| Risk of bias | ||
| Bias | Authors' judgement | Support for judgement |
| Allocation concealment? | High risk | C ‐ Inadequate |
| Methods | R = sealed envelopes (artery randomised) | |
| Participants | Australia | |
| Interventions | Rx: saphenous vein patch or polytetrafluoroethylene patch (random allocation) | |
| Outcomes | Ipsilateral stroke < 30 days | |
| Notes | Ex: unknown | |
| Risk of bias | ||
| Bias | Authors' judgement | Support for judgement |
| Allocation concealment? | Low risk | A ‐ Adequate |
| Methods | R = sealed envelopes | |
| Participants | Israel | |
| Interventions | Rx: polyester urethane patch angioplasty | |
| Outcomes | Death < 30 days and end of FU | |
| Notes | Ex: small ICA or need for interposition graft | |
| Risk of bias | ||
| Bias | Authors' judgement | Support for judgement |
| Allocation concealment? | Unclear risk | C ‐ Inadequate |
| Methods | R = opaque, sequentially numbered sealed envelopes (artery randomised) | |
| Participants | USA | |
| Interventions | Rx: saphenous vein patch | |
| Outcomes | Death < 30 days and end of FU | |
| Notes | Ex: ICA diameter < 5mm, arteriotomy > 3 cm, looped or kinked ICA | |
| Risk of bias | ||
| Bias | Authors' judgement | Support for judgement |
| Allocation concealment? | Low risk | A ‐ Adequate |
| Methods | R = unknown | |
| Participants | Italy | |
| Interventions | Rx: % autologous vein or synthetic (unknown) | |
| Outcomes | Death < 30 days and FU period | |
| Notes | Ex: unknown | |
| Risk of bias | ||
| Bias | Authors' judgement | Support for judgement |
| Allocation concealment? | Unclear risk | C ‐ Inadequate |
| Methods | R = opaque, sequentially‐numbered, sealed envelopes (artery randomised) | |
| Participants | United Kingdom | |
| Interventions | Rx: autologous vein (N = 53) or Dacron (N = 56) patches (non‐random allocation) | |
| Outcomes | Death < 30 days and end of FU | |
| Notes | Ex: unknown | |
| Risk of bias | ||
| Bias | Authors' judgement | Support for judgement |
| Allocation concealment? | Low risk | A ‐ Adequate |
| Methods | R ‐ sealed envelopes (not opaque or numbered) | |
| Participants | Germany | |
| Interventions | Rx: autologous vein patch | |
| Outcomes | Death < 30 days and end of FU | |
| Notes | Ex: Recurrent stenosis, kinked ICA | |
| Risk of bias | ||
| Bias | Authors' judgement | Support for judgement |
| Allocation concealment? | High risk | C ‐ Inadequate |
CABG: coronary artery bypass graft
DSA: digital subtraction angiography
Ex: exclusion criteria
FU: follow up
GA: general anaesthesia
ICA: internal carotid artery
R: concealment of allocation
RIND: reversible ischaemic neurological deficit
Rx: treatment
TIA: transient ischaemic attack
Characteristics of excluded studies [ordered by study ID]
Jump to:
| Study | Reason for exclusion |
| Randomised by flipping a coin | |
| Non‐random comparison of patching performed by one surgeon and primary closure performed by other surgeons in the same institute (personal communication with Dr Hertzer) |
Data and analyses
| Outcome or subgroup title | No. of studies | No. of participants | Statistical method | Effect size |
| 1 Any stroke: fatal and non‐fatal Show forest plot | 8 | 1769 | Peto Odds Ratio (Peto, Fixed, 95% CI) | 0.57 [0.31, 1.03] |
| Analysis 1.1 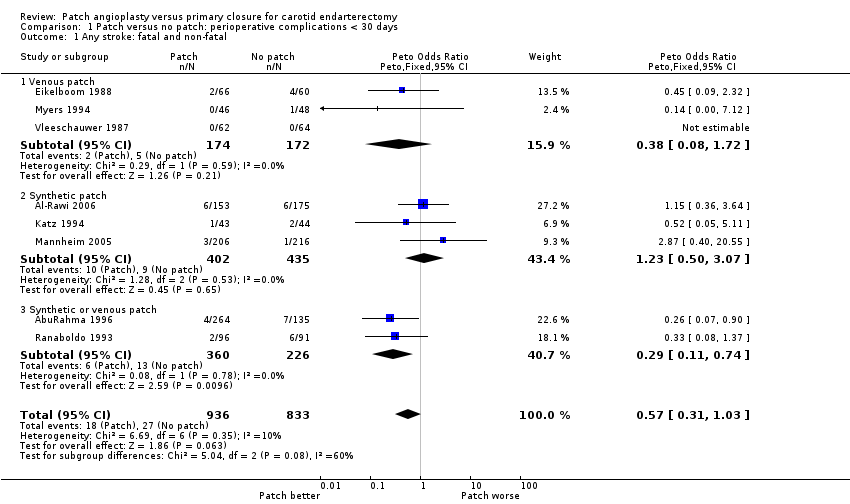 Comparison 1 Patch versus no patch: perioperative complications < 30 days, Outcome 1 Any stroke: fatal and non‐fatal. | ||||
| 1.1 Venous patch | 3 | 346 | Peto Odds Ratio (Peto, Fixed, 95% CI) | 0.38 [0.08, 1.72] |
| 1.2 Synthetic patch | 3 | 837 | Peto Odds Ratio (Peto, Fixed, 95% CI) | 1.23 [0.50, 3.07] |
| 1.3 Synthetic or venous patch | 2 | 586 | Peto Odds Ratio (Peto, Fixed, 95% CI) | 0.29 [0.11, 0.74] |
| 2 Stroke‐related death Show forest plot | 7 | 1441 | Peto Odds Ratio (Peto, Fixed, 95% CI) | 0.47 [0.05, 4.56] |
| Analysis 1.2 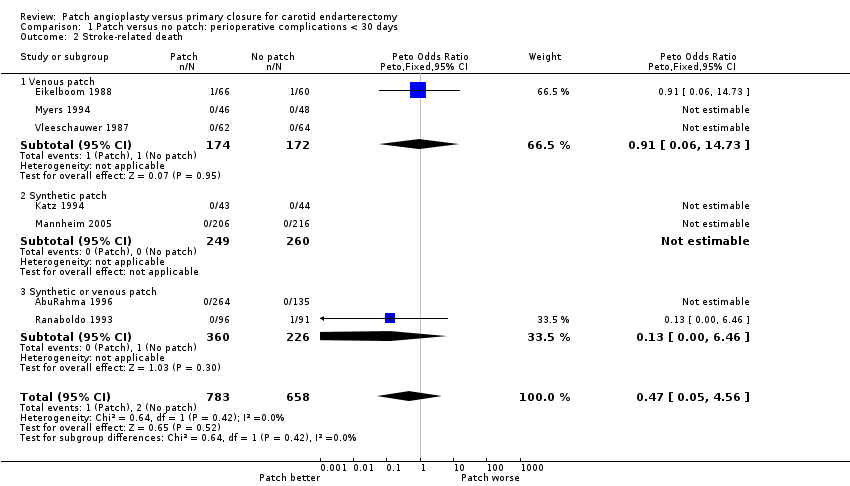 Comparison 1 Patch versus no patch: perioperative complications < 30 days, Outcome 2 Stroke‐related death. | ||||
| 2.1 Venous patch | 3 | 346 | Peto Odds Ratio (Peto, Fixed, 95% CI) | 0.91 [0.06, 14.73] |
| 2.2 Synthetic patch | 2 | 509 | Peto Odds Ratio (Peto, Fixed, 95% CI) | 0.0 [0.0, 0.0] |
| 2.3 Synthetic or venous patch | 2 | 586 | Peto Odds Ratio (Peto, Fixed, 95% CI) | 0.13 [0.00, 6.46] |
| 3 Stroke ipsilateral to endarterectomy site Show forest plot | 7 | 1201 | Peto Odds Ratio (Peto, Fixed, 95% CI) | 0.31 [0.15, 0.63] |
| Analysis 1.3  Comparison 1 Patch versus no patch: perioperative complications < 30 days, Outcome 3 Stroke ipsilateral to endarterectomy site. | ||||
| 3.1 Venous patch | 3 | 349 | Peto Odds Ratio (Peto, Fixed, 95% CI) | 0.39 [0.09, 1.75] |
| 3.2 Synthetic patch | 1 | 100 | Peto Odds Ratio (Peto, Fixed, 95% CI) | 0.53 [0.05, 5.19] |
| 3.3 Synthetic or venous patch | 3 | 752 | Peto Odds Ratio (Peto, Fixed, 95% CI) | 0.27 [0.11, 0.62] |
| 4 Death from all causes Show forest plot | 9 | 1869 | Peto Odds Ratio (Peto, Fixed, 95% CI) | 0.62 [0.18, 2.09] |
| Analysis 1.4 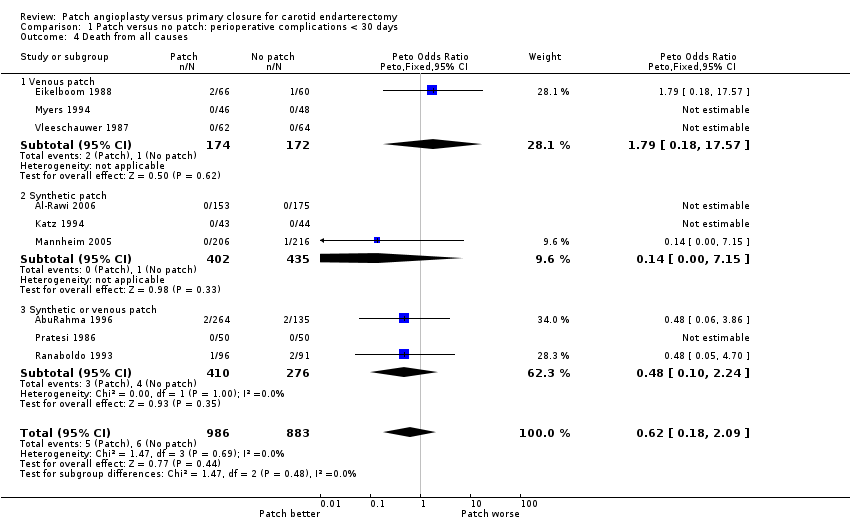 Comparison 1 Patch versus no patch: perioperative complications < 30 days, Outcome 4 Death from all causes. | ||||
| 4.1 Venous patch | 3 | 346 | Peto Odds Ratio (Peto, Fixed, 95% CI) | 1.79 [0.18, 17.57] |
| 4.2 Synthetic patch | 3 | 837 | Peto Odds Ratio (Peto, Fixed, 95% CI) | 0.14 [0.00, 7.15] |
| 4.3 Synthetic or venous patch | 3 | 686 | Peto Odds Ratio (Peto, Fixed, 95% CI) | 0.48 [0.10, 2.24] |
| 5 Any stroke or death Show forest plot | 8 | 1769 | Peto Odds Ratio (Peto, Fixed, 95% CI) | 0.58 [0.33, 1.01] |
| Analysis 1.5 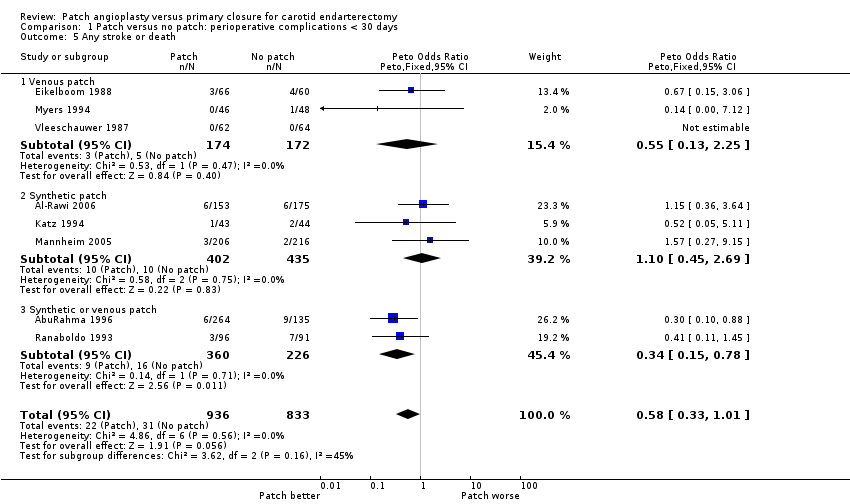 Comparison 1 Patch versus no patch: perioperative complications < 30 days, Outcome 5 Any stroke or death. | ||||
| 5.1 Venous patch | 3 | 346 | Peto Odds Ratio (Peto, Fixed, 95% CI) | 0.55 [0.13, 2.25] |
| 5.2 Synthetic patch | 3 | 837 | Peto Odds Ratio (Peto, Fixed, 95% CI) | 1.10 [0.45, 2.69] |
| 5.3 Synthetic or venous patch | 2 | 586 | Peto Odds Ratio (Peto, Fixed, 95% CI) | 0.34 [0.15, 0.78] |
| 6 Occlusion of the artery operated on Show forest plot | 7 | 1435 | Peto Odds Ratio (Peto, Fixed, 95% CI) | 0.18 [0.08, 0.41] |
| Analysis 1.6  Comparison 1 Patch versus no patch: perioperative complications < 30 days, Outcome 6 Occlusion of the artery operated on. | ||||
| 6.1 Venous patch | 2 | 255 | Peto Odds Ratio (Peto, Fixed, 95% CI) | 0.12 [0.01, 1.99] |
| 6.2 Synthetic patch | 2 | 428 | Peto Odds Ratio (Peto, Fixed, 95% CI) | 0.33 [0.06, 1.95] |
| 6.3 Synthetic or venous patch | 3 | 752 | Peto Odds Ratio (Peto, Fixed, 95% CI) | 0.16 [0.06, 0.42] |
| 7 Rupture/haemorrhage of endarterectomy site Show forest plot | 9 | 2031 | Peto Odds Ratio (Peto, Fixed, 95% CI) | 1.24 [0.61, 2.54] |
| Analysis 1.7  Comparison 1 Patch versus no patch: perioperative complications < 30 days, Outcome 7 Rupture/haemorrhage of endarterectomy site. | ||||
| 7.1 Venous patch | 3 | 429 | Peto Odds Ratio (Peto, Fixed, 95% CI) | 6.86 [0.14, 346.63] |
| 7.2 Synthetic patch | 3 | 850 | Peto Odds Ratio (Peto, Fixed, 95% CI) | 0.92 [0.39, 2.14] |
| 7.3 Synthetic or venous patch | 3 | 752 | Peto Odds Ratio (Peto, Fixed, 95% CI) | 2.32 [0.56, 9.57] |
| 8 Infection of the endarterectomy site Show forest plot | 7 | 1563 | Peto Odds Ratio (Peto, Fixed, 95% CI) | 0.38 [0.09, 1.54] |
| Analysis 1.8  Comparison 1 Patch versus no patch: perioperative complications < 30 days, Outcome 8 Infection of the endarterectomy site. | ||||
| 8.1 Venous patch | 3 | 429 | Peto Odds Ratio (Peto, Fixed, 95% CI) | 0.0 [0.0, 0.0] |
| 8.2 Synthetic patch | 2 | 522 | Peto Odds Ratio (Peto, Fixed, 95% CI) | 0.38 [0.09, 1.54] |
| 8.3 Synthetic or venous patch | 2 | 612 | Peto Odds Ratio (Peto, Fixed, 95% CI) | 0.0 [0.0, 0.0] |
| 9 Cranial nerve palsy Show forest plot | 4 | 1047 | Peto Odds Ratio (Peto, Fixed, 95% CI) | 0.78 [0.36, 1.69] |
| Analysis 1.9 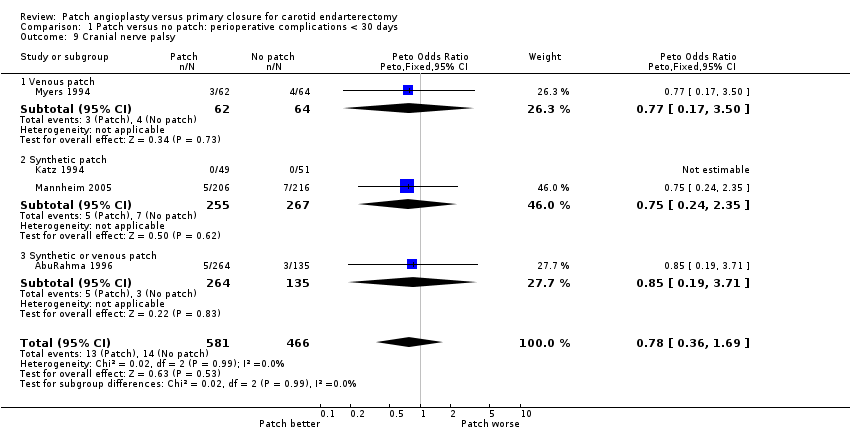 Comparison 1 Patch versus no patch: perioperative complications < 30 days, Outcome 9 Cranial nerve palsy. | ||||
| 9.1 Venous patch | 1 | 126 | Peto Odds Ratio (Peto, Fixed, 95% CI) | 0.77 [0.17, 3.50] |
| 9.2 Synthetic patch | 2 | 522 | Peto Odds Ratio (Peto, Fixed, 95% CI) | 0.75 [0.24, 2.35] |
| 9.3 Synthetic or venous patch | 1 | 399 | Peto Odds Ratio (Peto, Fixed, 95% CI) | 0.85 [0.19, 3.71] |
| 10 Complication with return to theatre Show forest plot | 7 | 1281 | Peto Odds Ratio (Peto, Fixed, 95% CI) | 0.35 [0.16, 0.79] |
| Analysis 1.10  Comparison 1 Patch versus no patch: perioperative complications < 30 days, Outcome 10 Complication with return to theatre. | ||||
| 10.1 Venous patch | 3 | 429 | Peto Odds Ratio (Peto, Fixed, 95% CI) | 0.98 [0.06, 15.64] |
| 10.2 Synthetic patch | 1 | 100 | Peto Odds Ratio (Peto, Fixed, 95% CI) | 0.53 [0.05, 5.19] |
| 10.3 Synthetic or venous patch | 3 | 752 | Peto Odds Ratio (Peto, Fixed, 95% CI) | 0.29 [0.12, 0.73] |
| Outcome or subgroup title | No. of studies | No. of participants | Statistical method | Effect size |
| 1 Any stroke: fatal and non‐fatal Show forest plot | 7 | 1332 | Peto Odds Ratio (Peto, Fixed, 95% CI) | 0.49 [0.27, 0.90] |
| Analysis 2.1 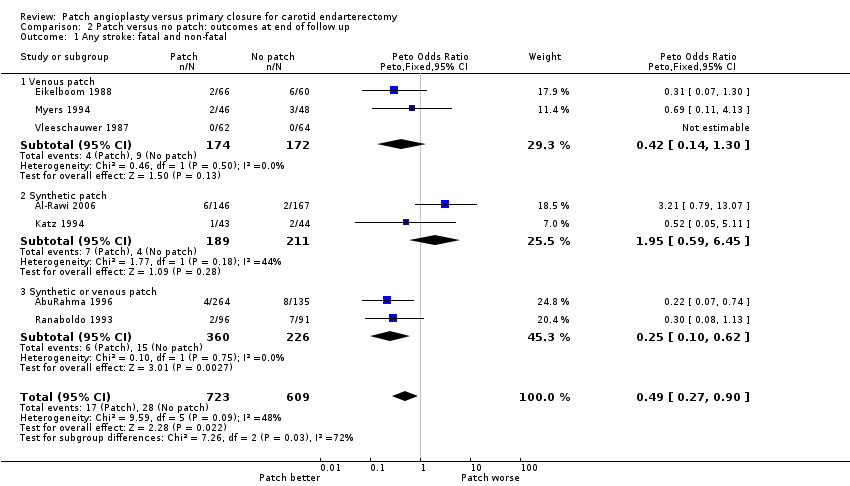 Comparison 2 Patch versus no patch: outcomes at end of follow up, Outcome 1 Any stroke: fatal and non‐fatal. | ||||
| 1.1 Venous patch | 3 | 346 | Peto Odds Ratio (Peto, Fixed, 95% CI) | 0.42 [0.14, 1.30] |
| 1.2 Synthetic patch | 2 | 400 | Peto Odds Ratio (Peto, Fixed, 95% CI) | 1.95 [0.59, 6.45] |
| 1.3 Synthetic or venous patch | 2 | 586 | Peto Odds Ratio (Peto, Fixed, 95% CI) | 0.25 [0.10, 0.62] |
| 2 Stroke‐related death Show forest plot | 6 | 1019 | Peto Odds Ratio (Peto, Fixed, 95% CI) | 0.27 [0.05, 1.60] |
| Analysis 2.2 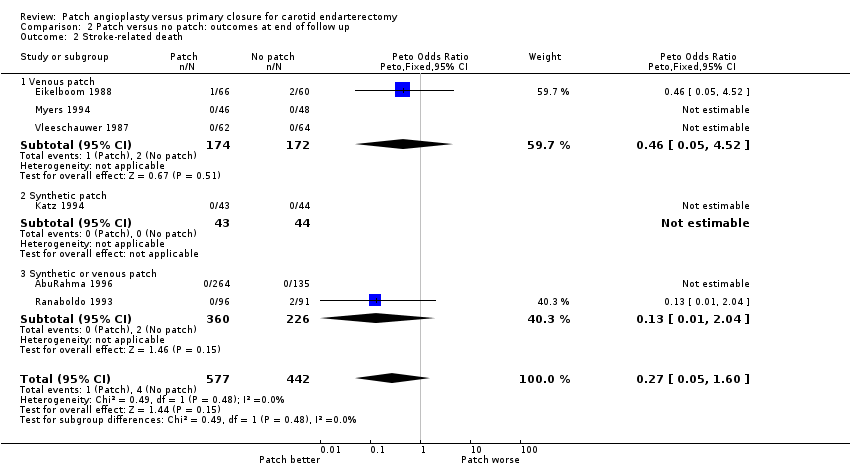 Comparison 2 Patch versus no patch: outcomes at end of follow up, Outcome 2 Stroke‐related death. | ||||
| 2.1 Venous patch | 3 | 346 | Peto Odds Ratio (Peto, Fixed, 95% CI) | 0.46 [0.05, 4.52] |
| 2.2 Synthetic patch | 1 | 87 | Peto Odds Ratio (Peto, Fixed, 95% CI) | 0.0 [0.0, 0.0] |
| 2.3 Synthetic or venous patch | 2 | 586 | Peto Odds Ratio (Peto, Fixed, 95% CI) | 0.13 [0.01, 2.04] |
| 3 Stroke ipsilateral to endarterectomy site Show forest plot | 6 | 1141 | Peto Odds Ratio (Peto, Fixed, 95% CI) | 0.32 [0.16, 0.63] |
| Analysis 2.3 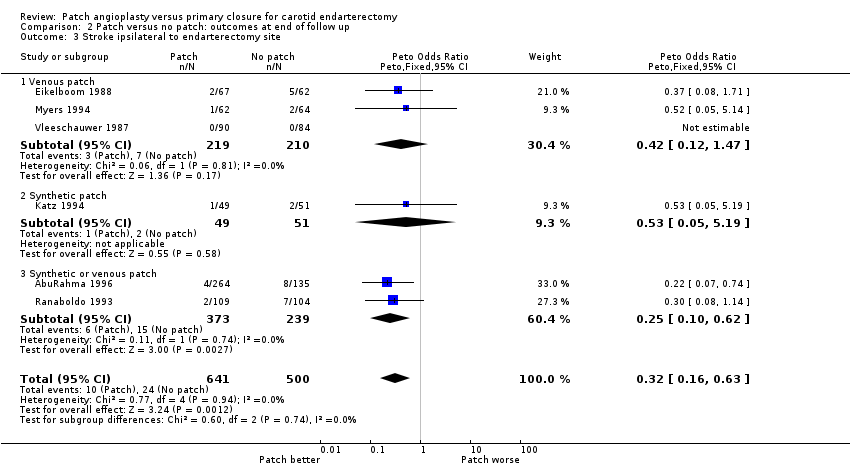 Comparison 2 Patch versus no patch: outcomes at end of follow up, Outcome 3 Stroke ipsilateral to endarterectomy site. | ||||
| 3.1 Venous patch | 3 | 429 | Peto Odds Ratio (Peto, Fixed, 95% CI) | 0.42 [0.12, 1.47] |
| 3.2 Synthetic patch | 1 | 100 | Peto Odds Ratio (Peto, Fixed, 95% CI) | 0.53 [0.05, 5.19] |
| 3.3 Synthetic or venous patch | 2 | 612 | Peto Odds Ratio (Peto, Fixed, 95% CI) | 0.25 [0.10, 0.62] |
| 4 Death from all causes Show forest plot | 7 | 1332 | Peto Odds Ratio (Peto, Fixed, 95% CI) | 0.78 [0.54, 1.12] |
| Analysis 2.4 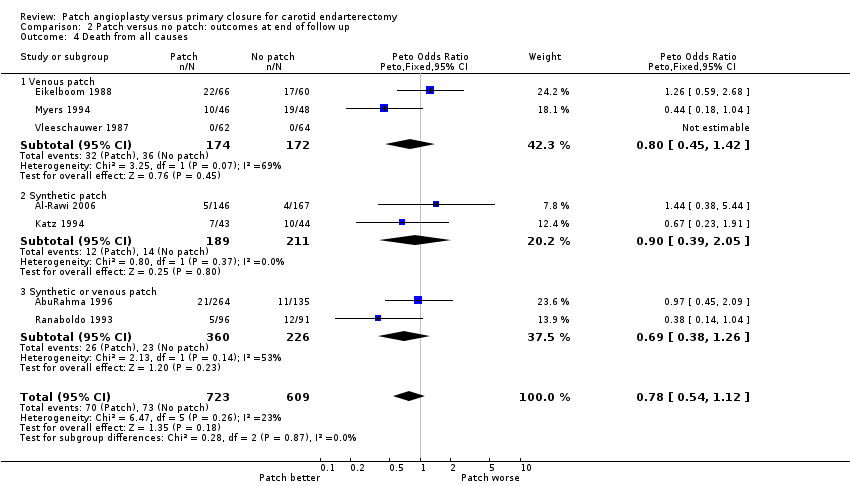 Comparison 2 Patch versus no patch: outcomes at end of follow up, Outcome 4 Death from all causes. | ||||
| 4.1 Venous patch | 3 | 346 | Peto Odds Ratio (Peto, Fixed, 95% CI) | 0.80 [0.45, 1.42] |
| 4.2 Synthetic patch | 2 | 400 | Peto Odds Ratio (Peto, Fixed, 95% CI) | 0.90 [0.39, 2.05] |
| 4.3 Synthetic or venous patch | 2 | 586 | Peto Odds Ratio (Peto, Fixed, 95% CI) | 0.69 [0.38, 1.26] |
| 5 Any stroke or death Show forest plot | 6 | 1019 | Peto Odds Ratio (Peto, Fixed, 95% CI) | 0.59 [0.42, 0.84] |
| Analysis 2.5  Comparison 2 Patch versus no patch: outcomes at end of follow up, Outcome 5 Any stroke or death. | ||||
| 5.1 Venous patch | 3 | 346 | Peto Odds Ratio (Peto, Fixed, 95% CI) | 0.69 [0.40, 1.20] |
| 5.2 Synthetic patch | 1 | 87 | Peto Odds Ratio (Peto, Fixed, 95% CI) | 0.62 [0.23, 1.66] |
| 5.3 Synthetic or venous patch | 2 | 586 | Peto Odds Ratio (Peto, Fixed, 95% CI) | 0.51 [0.30, 0.86] |
| 6 Restenosis/occlusion of the operated artery Show forest plot | 8 | 1719 | Peto Odds Ratio (Peto, Fixed, 95% CI) | 0.24 [0.17, 0.34] |
| Analysis 2.6  Comparison 2 Patch versus no patch: outcomes at end of follow up, Outcome 6 Restenosis/occlusion of the operated artery. | ||||
| 6.1 Venous patch | 3 | 429 | Peto Odds Ratio (Peto, Fixed, 95% CI) | 0.34 [0.17, 0.66] |
| 6.2 Synthetic patch | 3 | 678 | Peto Odds Ratio (Peto, Fixed, 95% CI) | 0.46 [0.22, 0.98] |
| 6.3 Synthetic or venous patch | 2 | 612 | Peto Odds Ratio (Peto, Fixed, 95% CI) | 0.15 [0.09, 0.25] |
Comparison 1 Patch versus no patch: perioperative complications < 30 days, Outcome 1 Any stroke: fatal and non‐fatal.
Comparison 1 Patch versus no patch: perioperative complications < 30 days, Outcome 2 Stroke‐related death.
Comparison 1 Patch versus no patch: perioperative complications < 30 days, Outcome 3 Stroke ipsilateral to endarterectomy site.
Comparison 1 Patch versus no patch: perioperative complications < 30 days, Outcome 4 Death from all causes.
Comparison 1 Patch versus no patch: perioperative complications < 30 days, Outcome 5 Any stroke or death.
Comparison 1 Patch versus no patch: perioperative complications < 30 days, Outcome 6 Occlusion of the artery operated on.
Comparison 1 Patch versus no patch: perioperative complications < 30 days, Outcome 7 Rupture/haemorrhage of endarterectomy site.
Comparison 1 Patch versus no patch: perioperative complications < 30 days, Outcome 8 Infection of the endarterectomy site.
Comparison 1 Patch versus no patch: perioperative complications < 30 days, Outcome 9 Cranial nerve palsy.
Comparison 1 Patch versus no patch: perioperative complications < 30 days, Outcome 10 Complication with return to theatre.
Comparison 2 Patch versus no patch: outcomes at end of follow up, Outcome 1 Any stroke: fatal and non‐fatal.
Comparison 2 Patch versus no patch: outcomes at end of follow up, Outcome 2 Stroke‐related death.
Comparison 2 Patch versus no patch: outcomes at end of follow up, Outcome 3 Stroke ipsilateral to endarterectomy site.
Comparison 2 Patch versus no patch: outcomes at end of follow up, Outcome 4 Death from all causes.
Comparison 2 Patch versus no patch: outcomes at end of follow up, Outcome 5 Any stroke or death.
Comparison 2 Patch versus no patch: outcomes at end of follow up, Outcome 6 Restenosis/occlusion of the operated artery.
| Study | Total patients | Total operations | Patch lost at 30 days | Patch lost at end | Primary lost at 30 days | Primary lost at end | Number of exclusions | Crossover patch ‐ non | Crossover non ‐ patch |
| 357 | 399 | 0 | 0 | 0 | 0 | 4 | 0 | 0 | |
| 315 | 338 | 0 | 7 | 0 | 8 | 10 | Data not available | Data not available | |
| 126 | 129 | 0 | 10 patients lost to doppler FU but not clinical FU | 0 | 7 to doppler FU but not clinical FU | 0 | 3 | 3 | |
| 87 | 100 | 0 | 5 | 0 | 7 | 0 | 0 | 0 | |
| 123 | 140 | 0 | 0 | 0 | 0 | 4 | Between 0 and 4 | Between 0 and 4 | |
| 404 | 422 | 0 | Data not available | 0 | Data not available | Data not available | 0 | 0 | |
| 136 (109 after exclusion of 27 patients undergoing obligatory vein patching) | 152 (122 analysed as 30 operations got obligatory vein patches) | 0 | 6 | 0 | 8 | 30 operations underwent obligatory vein patch closure and 16 patients had both sides done (total 46) | 0 | 0 | |
| 100 | 100 | Data not available | Data not available | Data not available | Data not available | Data not available | Data not available | Data not available | |
| 199 | 213 | 0 | 5 | 0 | 12 | 0 | 0 | 0 at 30‐day FU but 4 at 1‐year FU | |
| 126 | 174 | 0 | Data not available | 0 | Data not available | 0 | 0 | 0 | |
| FU: follow up | |||||||||
| Outcome or subgroup title | No. of studies | No. of participants | Statistical method | Effect size |
| 1 Any stroke: fatal and non‐fatal Show forest plot | 8 | 1769 | Peto Odds Ratio (Peto, Fixed, 95% CI) | 0.57 [0.31, 1.03] |
| 1.1 Venous patch | 3 | 346 | Peto Odds Ratio (Peto, Fixed, 95% CI) | 0.38 [0.08, 1.72] |
| 1.2 Synthetic patch | 3 | 837 | Peto Odds Ratio (Peto, Fixed, 95% CI) | 1.23 [0.50, 3.07] |
| 1.3 Synthetic or venous patch | 2 | 586 | Peto Odds Ratio (Peto, Fixed, 95% CI) | 0.29 [0.11, 0.74] |
| 2 Stroke‐related death Show forest plot | 7 | 1441 | Peto Odds Ratio (Peto, Fixed, 95% CI) | 0.47 [0.05, 4.56] |
| 2.1 Venous patch | 3 | 346 | Peto Odds Ratio (Peto, Fixed, 95% CI) | 0.91 [0.06, 14.73] |
| 2.2 Synthetic patch | 2 | 509 | Peto Odds Ratio (Peto, Fixed, 95% CI) | 0.0 [0.0, 0.0] |
| 2.3 Synthetic or venous patch | 2 | 586 | Peto Odds Ratio (Peto, Fixed, 95% CI) | 0.13 [0.00, 6.46] |
| 3 Stroke ipsilateral to endarterectomy site Show forest plot | 7 | 1201 | Peto Odds Ratio (Peto, Fixed, 95% CI) | 0.31 [0.15, 0.63] |
| 3.1 Venous patch | 3 | 349 | Peto Odds Ratio (Peto, Fixed, 95% CI) | 0.39 [0.09, 1.75] |
| 3.2 Synthetic patch | 1 | 100 | Peto Odds Ratio (Peto, Fixed, 95% CI) | 0.53 [0.05, 5.19] |
| 3.3 Synthetic or venous patch | 3 | 752 | Peto Odds Ratio (Peto, Fixed, 95% CI) | 0.27 [0.11, 0.62] |
| 4 Death from all causes Show forest plot | 9 | 1869 | Peto Odds Ratio (Peto, Fixed, 95% CI) | 0.62 [0.18, 2.09] |
| 4.1 Venous patch | 3 | 346 | Peto Odds Ratio (Peto, Fixed, 95% CI) | 1.79 [0.18, 17.57] |
| 4.2 Synthetic patch | 3 | 837 | Peto Odds Ratio (Peto, Fixed, 95% CI) | 0.14 [0.00, 7.15] |
| 4.3 Synthetic or venous patch | 3 | 686 | Peto Odds Ratio (Peto, Fixed, 95% CI) | 0.48 [0.10, 2.24] |
| 5 Any stroke or death Show forest plot | 8 | 1769 | Peto Odds Ratio (Peto, Fixed, 95% CI) | 0.58 [0.33, 1.01] |
| 5.1 Venous patch | 3 | 346 | Peto Odds Ratio (Peto, Fixed, 95% CI) | 0.55 [0.13, 2.25] |
| 5.2 Synthetic patch | 3 | 837 | Peto Odds Ratio (Peto, Fixed, 95% CI) | 1.10 [0.45, 2.69] |
| 5.3 Synthetic or venous patch | 2 | 586 | Peto Odds Ratio (Peto, Fixed, 95% CI) | 0.34 [0.15, 0.78] |
| 6 Occlusion of the artery operated on Show forest plot | 7 | 1435 | Peto Odds Ratio (Peto, Fixed, 95% CI) | 0.18 [0.08, 0.41] |
| 6.1 Venous patch | 2 | 255 | Peto Odds Ratio (Peto, Fixed, 95% CI) | 0.12 [0.01, 1.99] |
| 6.2 Synthetic patch | 2 | 428 | Peto Odds Ratio (Peto, Fixed, 95% CI) | 0.33 [0.06, 1.95] |
| 6.3 Synthetic or venous patch | 3 | 752 | Peto Odds Ratio (Peto, Fixed, 95% CI) | 0.16 [0.06, 0.42] |
| 7 Rupture/haemorrhage of endarterectomy site Show forest plot | 9 | 2031 | Peto Odds Ratio (Peto, Fixed, 95% CI) | 1.24 [0.61, 2.54] |
| 7.1 Venous patch | 3 | 429 | Peto Odds Ratio (Peto, Fixed, 95% CI) | 6.86 [0.14, 346.63] |
| 7.2 Synthetic patch | 3 | 850 | Peto Odds Ratio (Peto, Fixed, 95% CI) | 0.92 [0.39, 2.14] |
| 7.3 Synthetic or venous patch | 3 | 752 | Peto Odds Ratio (Peto, Fixed, 95% CI) | 2.32 [0.56, 9.57] |
| 8 Infection of the endarterectomy site Show forest plot | 7 | 1563 | Peto Odds Ratio (Peto, Fixed, 95% CI) | 0.38 [0.09, 1.54] |
| 8.1 Venous patch | 3 | 429 | Peto Odds Ratio (Peto, Fixed, 95% CI) | 0.0 [0.0, 0.0] |
| 8.2 Synthetic patch | 2 | 522 | Peto Odds Ratio (Peto, Fixed, 95% CI) | 0.38 [0.09, 1.54] |
| 8.3 Synthetic or venous patch | 2 | 612 | Peto Odds Ratio (Peto, Fixed, 95% CI) | 0.0 [0.0, 0.0] |
| 9 Cranial nerve palsy Show forest plot | 4 | 1047 | Peto Odds Ratio (Peto, Fixed, 95% CI) | 0.78 [0.36, 1.69] |
| 9.1 Venous patch | 1 | 126 | Peto Odds Ratio (Peto, Fixed, 95% CI) | 0.77 [0.17, 3.50] |
| 9.2 Synthetic patch | 2 | 522 | Peto Odds Ratio (Peto, Fixed, 95% CI) | 0.75 [0.24, 2.35] |
| 9.3 Synthetic or venous patch | 1 | 399 | Peto Odds Ratio (Peto, Fixed, 95% CI) | 0.85 [0.19, 3.71] |
| 10 Complication with return to theatre Show forest plot | 7 | 1281 | Peto Odds Ratio (Peto, Fixed, 95% CI) | 0.35 [0.16, 0.79] |
| 10.1 Venous patch | 3 | 429 | Peto Odds Ratio (Peto, Fixed, 95% CI) | 0.98 [0.06, 15.64] |
| 10.2 Synthetic patch | 1 | 100 | Peto Odds Ratio (Peto, Fixed, 95% CI) | 0.53 [0.05, 5.19] |
| 10.3 Synthetic or venous patch | 3 | 752 | Peto Odds Ratio (Peto, Fixed, 95% CI) | 0.29 [0.12, 0.73] |
| Outcome or subgroup title | No. of studies | No. of participants | Statistical method | Effect size |
| 1 Any stroke: fatal and non‐fatal Show forest plot | 7 | 1332 | Peto Odds Ratio (Peto, Fixed, 95% CI) | 0.49 [0.27, 0.90] |
| 1.1 Venous patch | 3 | 346 | Peto Odds Ratio (Peto, Fixed, 95% CI) | 0.42 [0.14, 1.30] |
| 1.2 Synthetic patch | 2 | 400 | Peto Odds Ratio (Peto, Fixed, 95% CI) | 1.95 [0.59, 6.45] |
| 1.3 Synthetic or venous patch | 2 | 586 | Peto Odds Ratio (Peto, Fixed, 95% CI) | 0.25 [0.10, 0.62] |
| 2 Stroke‐related death Show forest plot | 6 | 1019 | Peto Odds Ratio (Peto, Fixed, 95% CI) | 0.27 [0.05, 1.60] |
| 2.1 Venous patch | 3 | 346 | Peto Odds Ratio (Peto, Fixed, 95% CI) | 0.46 [0.05, 4.52] |
| 2.2 Synthetic patch | 1 | 87 | Peto Odds Ratio (Peto, Fixed, 95% CI) | 0.0 [0.0, 0.0] |
| 2.3 Synthetic or venous patch | 2 | 586 | Peto Odds Ratio (Peto, Fixed, 95% CI) | 0.13 [0.01, 2.04] |
| 3 Stroke ipsilateral to endarterectomy site Show forest plot | 6 | 1141 | Peto Odds Ratio (Peto, Fixed, 95% CI) | 0.32 [0.16, 0.63] |
| 3.1 Venous patch | 3 | 429 | Peto Odds Ratio (Peto, Fixed, 95% CI) | 0.42 [0.12, 1.47] |
| 3.2 Synthetic patch | 1 | 100 | Peto Odds Ratio (Peto, Fixed, 95% CI) | 0.53 [0.05, 5.19] |
| 3.3 Synthetic or venous patch | 2 | 612 | Peto Odds Ratio (Peto, Fixed, 95% CI) | 0.25 [0.10, 0.62] |
| 4 Death from all causes Show forest plot | 7 | 1332 | Peto Odds Ratio (Peto, Fixed, 95% CI) | 0.78 [0.54, 1.12] |
| 4.1 Venous patch | 3 | 346 | Peto Odds Ratio (Peto, Fixed, 95% CI) | 0.80 [0.45, 1.42] |
| 4.2 Synthetic patch | 2 | 400 | Peto Odds Ratio (Peto, Fixed, 95% CI) | 0.90 [0.39, 2.05] |
| 4.3 Synthetic or venous patch | 2 | 586 | Peto Odds Ratio (Peto, Fixed, 95% CI) | 0.69 [0.38, 1.26] |
| 5 Any stroke or death Show forest plot | 6 | 1019 | Peto Odds Ratio (Peto, Fixed, 95% CI) | 0.59 [0.42, 0.84] |
| 5.1 Venous patch | 3 | 346 | Peto Odds Ratio (Peto, Fixed, 95% CI) | 0.69 [0.40, 1.20] |
| 5.2 Synthetic patch | 1 | 87 | Peto Odds Ratio (Peto, Fixed, 95% CI) | 0.62 [0.23, 1.66] |
| 5.3 Synthetic or venous patch | 2 | 586 | Peto Odds Ratio (Peto, Fixed, 95% CI) | 0.51 [0.30, 0.86] |
| 6 Restenosis/occlusion of the operated artery Show forest plot | 8 | 1719 | Peto Odds Ratio (Peto, Fixed, 95% CI) | 0.24 [0.17, 0.34] |
| 6.1 Venous patch | 3 | 429 | Peto Odds Ratio (Peto, Fixed, 95% CI) | 0.34 [0.17, 0.66] |
| 6.2 Synthetic patch | 3 | 678 | Peto Odds Ratio (Peto, Fixed, 95% CI) | 0.46 [0.22, 0.98] |
| 6.3 Synthetic or venous patch | 2 | 612 | Peto Odds Ratio (Peto, Fixed, 95% CI) | 0.15 [0.09, 0.25] |