درمان با هدایت پپتید ناتریورتیک (natriuretic peptide) برای پیشگیری از مرگ و حوادث قلبیعروقی در میان بیماران بدون نارسایی قلبی
چکیده
پیشینه
بیماریهای قلبیعروقی (CVD) علت اصلی موربیدیتی و مورتالیتی در سطح جهان به شمار میروند. مداخله زودرس برای افراد مبتلا به خطر بالای قلبیعروقی در بهبود پیامدهای بیمار بسیار مهم است. استراتژیهای پیشگیری مرسوم برای CVD بر عوامل خطر متعارف مانند اضافه وزن، دیسلیپیدمی، دیابت و هیپرتانسیون تمرکز کردهاند، که ممکن است منعکس کننده آسیب بالقوه قلبیعروقی باشد. پپتیدهای ناتریورتیک (Natriuretic peptides; NPs)، از جمله نوع B پپتید ناتریورتیک (BNP) و پپتید ناتریورتیک نوع N‐terminal pro B؛ (NT‐proBNP)، بیومارکرهای خوبی برای تشخیص و ارزیابی تشخیصی نارسایی قلبی هستند. آنها برای پیشگیری CVD مورد علاقه هستند زیرا آنها به عنوان یک پاسخ محافظتی به استرس، فشار و آسیب قلبیعروقی، توسط قلب ترشح میشوند. بنابراین، اندازهگیری سطوح NP در بیماران بدون نارسایی قلبی ممکن است برای طبقهبندی خطر ارزشمند باشد، تا کسانی را که بیشترین خطر ابتلا به CVD را دارند و از اقدامات کاهش شدید خطر بهرهمند میشوند، شناسایی کنند.
اهداف
ارزیابی اثرات درمان با هدایت پپتید ناتریورتیک (NP) برای افراد مبتلا به عوامل خطر قلبیعروقی و بدون نارسایی قلبی.
روشهای جستوجو
جستوجوها در پایگاههای اطلاعاتی کتابشناختی زیر تا 9 جولای 2019 انجام شد: CENTRAL؛ MEDLINE؛ Embase و Web of Science. سه پایگاه ثبت کارآزمایی بالینی نیز در جولای 2019 جستوجو شدند.
معیارهای انتخاب
ما کارآزماییهای تصادفیسازی و کنترلشدهای را وارد کردیم که بزرگسالانی را با یک یا چند عامل خطر قلبیعروقی و بدون نارسایی قلبی وارد کرده و به مقایسه غربالگری مبتنی بر NP و پس از آن درمان با هدایت NP، در مقابل مراقبتهای استاندارد، در تمام شرایط (به عنوان مثال جامعه، بیمارستان) پرداخته بودند.
گردآوری و تجزیهوتحلیل دادهها
دو نویسنده مرور بهطور مستقل از هم عناوین و چکیدههای مقالات را غربالگری کرده و مطالعات را برای ورود انتخاب کردند، دادهها را استخراج کرده و خطر سوگیری (bias) را ارزیابی کردند. خطر نسبی (RRs) برای دادههای دو تایی و میانگین تفاوت (MDs) با 95% فواصل اطمینان (CIs) برای دادههای پیوسته محاسبه شد. ما با نویسندگان کارآزمایی برای به دست آوردن دادههای از دست رفته و به منظور بررسی ویژگیهای حیاتی مطالعه تماس گرفتیم. با استفاده از رویکرد درجهبندی توصیهها، ارزیابی، ارتقا و بررسی (Grading of Recommendations Assessment, Development and Evaluation; GRADE)، دو نویسنده مرور بهطور مستقل از هم کیفیت شواهد را ارزیابی کرده و از پروفایلر GRADE یا GRADEPRO برای انتقال دادهها از Review Manager به منظور ایجاد جدول «خلاصهای از یافتهها» استفاده شد.
نتایج اصلی
ما دو کارآزمایی تصادفیسازی و کنترلشده (سه گزارش) را با 1674 شرکتکننده، با میانگین سنی بین 64.1 و 67.8 سال وارد کردیم. پیگیری از 2 سال تا میانگین 4.3 سال متغیر بود.
برای معیارهای پیامد اولیه، برآوردهای اثر از یک مطالعه تکی، عدم قطعیت را برای اثر درمان با هدایت NP بر مورتالیتی قلبیعروقی در بیماران با عوامل خطر قلبیعروقی و بدون نارسایی قلبی نشان داد (RR: 0.33؛ 95% CI؛ 0.04 تا 3.17؛ یک مطالعه؛ 300 شرکتکننده؛ شواهد با کیفیت پایین). تجزیهوتحلیل ترکیبی نشان داد که در مقایسه با مراقبت استاندارد، درمان با هدایت NP احتمالا خطر بستری شدن را در بیمارستان به دلیل قلبیعروقی کاهش میدهد (RR: 0.52؛ 95% CI؛ 0.40 تا 0.68؛ 2 مطالعه؛ 1674 شرکتکننده؛ شواهد با کیفیت متوسط). این به معنای خطر برای 163 نفر به ازای هر 1000 نفر در گروه کنترل و 85 نفر (95% CI؛ 65 تا 111) به ازای هر 1000 نفر در گروه درمان با هدایت NP است.
هنگامی که معیارهای پیامد ثانویه مورد ارزیابی قرار گرفت، شواهدی از تجزیهوتحلیل ترکیبی، عدم قطعیت را برای اثر درمان با هدایت NP بر مورتالیتی به هر علت نشان داد (RR: 0.90؛ 95% CI؛ 0.60 تا 1.35؛ 2 مطالعه؛ 1354 شرکتکننده؛ شواهد با کیفیت پایین). تجزیهوتحلیل ترکیبی نشان داد که درمان با هدایت NP احتمالا خطر بستری شدن را در بیمارستان به هر دلیلی کاهش میدهد (RR: 0.83؛ 95% CI؛ 0.75 تا 0.92؛ 2 مطالعه؛ 1354 شرکتکننده؛ شواهد با کیفیت متوسط). این به معنای خطر برای 601 نفر در هر 1000 نفر در گروه کنترل و 499 نفر (95% CI؛ 457 تا 553) در هر 1000 نفر در گروه درمان با هدایت NP است. برآورد اثر از یک مطالعه تکی نشان میدهد که درمان با هدایت NP خطر ابتلا به اختلال عملکرد بطنی را کاهش میدهد (RR: 0.61؛ 95% CI؛ 0.41 تا 0.91؛ 1374 شرکتکننده؛ شواهد با کیفیت بالا). خطر در گروه کنترل این مطالعه 87 در 1000 نفر بود، در مقایسه با 53 (95% CI؛ 36 تا 79) نفر در هر 1000 نفر در گروه درمان با هدایت NP. نتایج حاصل از مطالعه مشابه نشان میدهد که درمان با هدایت NP، نسبت به مراقبت استاندارد، بر تغییر در سطح NP در پایان دوره پیگیری تاثیر نمیگذارد (MD: ‐4.06 pg/mL؛ 95% CI؛ 15.07‐ تا 6.95؛ یک مطالعه؛ 1374 شرکتکننده؛ شواهد با کیفیت متوسط).
نتیجهگیریهای نویسندگان
این مرور نشان میدهد که درمان با هدایت NP احتمالا اختلال عملکرد بطنی و بستری شدن در بیمارستان به دلایل قلبیعروقی و به هر علت را، برای بیمارانی با عوامل خطر قلبیعروقی و کسانی که نارسایی قلبی ندارند، کاهش میدهد. اثرات آن بر مورتالیتی و سطوح پپتید ناتریورتیک کمتر مشخص هستند. هیچ یک از مطالعات وارد شده برای ارزیابی مورتالیتی قدرت نداشتند. شواهد موجود عدم قطعیت را در مورد اثرات درمان با هدایت NP هم بر مورتالیتی قلبیعروقی و هم بر مورتالیتی به هر علت نشان میدهند؛ تعداد بسیار کم عوارض منجر به درجه بالایی از عدم دقت در این تخمینهای اثر شد. شواهد همچنین نشان میدهند که درمان با هدایت NP ممکن است در پایان دوره پیگیری تاثیری بر سطح NP نداشته باشد.
با توجه به آنکه هر دو کارآزمایی وارد شده در مرور ما، مطالعات عملگرا بودند، عدم کورسازی بیماران و پزشکان ممکن است نتایجی را با سوگیری به سوی یافتههای مشابه و همارز ایجاد کرده باشد. مطالعات بیشتر با حجم نمونههای به اندازه کافی قویتر و مدت زمان پیگیری طولانیتر، برای ارزیابی اثر درمان با هدایت NP بر مورتالیتی مورد نیاز هستند. با توجه به آنکه دو کارآزمایی در حال انجام است، که یکی از آنها یک کارآزمایی چند مرکزی بزرگ است، امید میرود که تکرارهای آینده این مرور، از حجم نمونههای بزرگتر در سراسر یک منطقه جغرافیایی گستردهتر بهرهمند شود.
PICOs
خلاصه به زبان ساده
درمان با هدایت پپتید ناتریورتیک (natriuretic peptide) برای پیشگیری از مرگ و عوارض قلبیعروقی در میان بیماران با عوامل خطر برای بیماری قلبی
سوال مطالعه مروری
ما میخواستیم ببینیم که آیا درمان با هدایت پپتید ناتریورتیک (natriuretic peptide; NP) بهتر از مراقبتهای معمول در پیشگیری از مرگ و حوادث قلبیعروقی میان بیماران مبتلا به عوامل خطر برای بیماریهای قلبی اما بدون نارسایی قلبی است.
پیشینه
بیماریهای قلبیعروقی (cardiovascular diseases; CVDs) گروهی از شرایط و بیماریهایی هستند که بر قلب و رگهای خونی تاثیر میگذارند. آنها علل اصلی مرگ قابل اجتناب در سراسر جهان هستند. عوامل خطری که احتمال ابتلای یک فرد را به CVD افزایش میدهند، عبارتند از دیابت، فشار خون بالا، کلسترول بالا، و چاقی. پپتیدهای ناتریورتیک (NPs) هورمونهای تولید شده توسط قلب هستند که در خون اندازهگیری میشوند. آنها به بدن کمک میکنند تا مایعات را حذف کنند، عروق خونی را شل کنند، و سدیم را وارد ادرار نمایند. هنگامی که قلب آسیبدیده است، بدن NPهای بیشتری را به منظور تلاش برای کاهش فشار روی قلب آزاد میکند. با اندازهگیری سطوح خونی NP فرد، ما میتوانیم کسانی را که آسیب به قلبشان وارد شده و کسانی را که در معرض خطر بالاتر مرگ و عوارض قلبیعروقی مانند حمله قلبی و استروک یا سکته مغزی قرار دارند، شناسایی کنیم. پس از آن ما میتوانیم از این اطلاعات برای کاهش خطر قلبیعروقی فرد با هدایت تصمیمگیریها در مورد مراقبتهای قلبیعروقی آنها استفاده کنیم (درمان بر پایه NP)، مانند اینکه چه دارویی را باید مصرف کنند، به چه بررسیهایی نیاز دارند، و چه اصلاحاتی را باید در سبک زندگی خود اعمال کنند.
ویژگیهای مطالعه
شواهد در این مرور تا جولای 2019 بهروز هستند. ما دو کارآزمایی تصادفیسازی و کنترلشده (که در آن شرکتکنندگان شانس مساوی برای اختصاص یافتن به هر یک از درمانها دارند) را شامل 1674 شرکتکننده بزرگسال وارد کردیم که یک یا چند عامل خطر برای ابتلا به CVD داشتند، و به مقایسه درمان با هدایت NP با مراقبت استاندارد پرداخته بودند. ما بیماران دارای علائم نارسایی قلبی را خارج کردیم. میانگین سنی شرکتکنندگان بین 64.1 و 67.8 سال متفاوت بود. بيماران به مدت دو سال و ميانگين 4.2 سال پيگيري شدند.
نتایج کلیدی
اثرات درمان با هدایت NP بر مرگ ناشی از CVD یا به هر دلیل دیگری همچنان نامشخص است زیرا نتایج ما غیردقیق بودند. شواهدی با کیفیت متوسط نشان میدهند که درمان با هدایت NP احتمالا تعداد موارد بستری شدن را در بیمارستان به دلیل عوارض قلبیعروقی و به هر دلیلی در بیماران با عوامل خطر قلبیعروقی، کاهش میدهند. ما انتظار داریم از 1000 بیماری که مراقبتهای استاندارد دریافت کردهاند، 163 نفر به دلیل یک عارضه قلبیعروقی در بیمارستان بستری شوند، در مقایسه با بین 65 و 111 بیماری که درمان با هدایت NP دریافت کردند. از 1000 بیمار با عوامل خطر قلبیعروقی که مراقبتهای استاندارد دریافت کردهاند، 601 نفر به هر دلیلی در بیمارستان پذیرش میشوند، در مقایسه با بین 457 و 553 بیماری که درمان هدایت شده با NP را دریافت کردند.
شواهدی با کیفیت بالا نشان می دهند که درمان هدایت شده با NP، در مقایسه با مراقبتهای استاندارد، خطر اختلال عملکرد بطنی را کاهش میدهد (وضعیتی که اغلب منجر به نارسایی قلبی میشود). نتایج ما نشان میدهند که از 1000 بیمار با عوامل خطر قلبیعروقی که مراقبتهای استاندارد دریافت کردهاند، 87 بیمار میتوانند دچار اختلال عملکرد بطن شوند، در مقایسه با بین 36 و 79 بیماری که درمان با هدایت NP را دریافت کردند. هیچ شواهدی نشان نمیدهد که درمان با هدایت NP، سطح NP را در پایان مطالعات تحت تاثیر قرار میدهد.
کیفیت شواهد
کیفیت شواهد در سراسر پیامدها از پایین تا بالا متغیر بود. دلایل کلیدی برای نگرانی در مورد کیفیت شواهد وارد شده، خطر سوگیری (bias) بود، زیرا بیماران و کارکنان مراقبتهای پزشکی برای بیماران میدانستند که در گروه کنترل یا مداخله قرار داشتند و این ممکن است مراقبتی را که آنها دریافت کردهاند، تحت تاثیر قرار داده باشد؛ برخی از نتایج به دست آمده غیردقیق بودند، و معلوم نیست مداخله مفید یا مضر بوده است. به دلیل آنکه ما فقط دو مطالعه را شناسایی کردیم که مناسب برای ورود به این مرور بود، تعمیمپذیری مرور محدود است.
Authors' conclusions
Summary of findings
| Natriuretic peptide‐guided treatment compared to standard care for the prevention of cardiovascular events in patients without heart failure | ||||||
| Patient or population: patients without heart failure | ||||||
| Outcomes | Anticipated absolute effects* (95% CI) | Relative effect | No. of participants | Certainty of the evidence | Comments | |
| Risk with standard care | Risk with natriuretic peptide‐guided treatment | |||||
| Cardiovascular mortality Follow‐up: 2 years | Study population | RR 0.33 | 300 | ⊕⊕⊝⊝ | Cardiovascular deaths not available, so cardiac deaths used | |
| 20 per 1000 | 7 per 1000 | |||||
| Cardiovascular hospitalisation (as defined by trialists) Follow‐up range: 2 years to mean 4.2 years | Study population | RR 0.52 | 1674 | ⊕⊕⊕⊝ | ||
| 163 per 1000 | 85 per 1000 | |||||
| All‐cause mortality | Study population | RR 0.90 | 1354 | ⊕⊕⊝⊝ | ||
| 60 per 1000 | 54 per 1000 | |||||
| All‐cause hospitalisation (all occurrences) | Study population | RR 0.83 | 1354 | ⊕⊕⊕⊝ | ||
| 601 per 1000 | 499 per 1000 | |||||
| Ventricular dysfunction (as defined by trialists) | Study population | RR 0.61 | 1374 | ⊕⊕⊕⊕ | Ventricular dysfunction was defined by trialists as left ventricular dysfunction and heart failure. Left ventricular dysfunction (LVD) included all patients with asymptomatic left ventricular systolic dysfunction (LVSD) and/or asymptomatic left ventricular diastolic dysfunction (LVDD). Heart failure included all patients with LVD (LVSD and/or LVDD) and with symptoms of heart failure requiring emergency admission to hospital | |
| 87 per 1000 | 53 per 1000 | |||||
| Change in NP level at the end of follow‐up | Mean change in NP level at the end of follow‐up was 9.52 pg/mL | MD 4.06 pg/mL higher | ‐ | 1374 | ⊕⊕⊕⊝ | These data come from Ledwidge 2013; NP level was reported as BNP. Huelsmann 2013 also reported change in NT‐proBNP after 1 year of treatment. However, these data were presented as median and interquartile range; therefore we could not calculate mean difference |
| *The risk in the intervention group (and its 95% confidence interval) is based on the assumed risk in the comparison group and the relative effect of the intervention (and its 95% CI). | ||||||
| GRADE Working Group grades of evidence. | ||||||
| aImprecision: very wide 95% confidence interval, which includes the line of null effect and is consistent with the possibility of both important benefits and harms. The sample size is small. Downgraded by two levels. bRisk of bias: both studies did not blind patients or personnel. Downgraded by one level. cImprecision: wide 95% confidence interval, which includes the line of null effect and is consistent with the possibility of important benefits and harms. Downgraded by one level. dRisk of bias: downgraded by one level due to attrition bias as one study excluded from analysis patients who were lost to follow‐up and those who withdrew, who did not have at least one year of detailed follow‐up cost data. eRisk of bias: echocardiographer and cardiologist reviewing end of study echo were blinded and diagnosis of ventricular dysfunction was based on clearly defined echocardiographic measures, which removed subjectivity in outcome assessment. Not downgraded. fImprecision: wide CIs that cross the line of no effect (zero) and include the possibility of the intervention causing both benefit and harm. Downgraded by one level. | ||||||
Background
Description of the condition
Cardiovascular disease (CVD) refers to a wide group of conditions that affect the heart and blood vessels (WHO 2013); it is the leading cause of mortality and morbidity globally and remains the foremost cause of preventable death (Santulli 2013; WHO 2016). An estimated 17.5 million people died from CVD in 2012, representing 31% of all global deaths (WHO 2016). In Europe, close to half of all deaths are caused by CVD (Nichols 2014), and the estimated cost to the EU economy is EUR 169 billion annually (HERC 2012).
The prevalence of CVD is set to increase further as a result of the epidemic of obesity, diabetes, hypertension, and dyslipidaemia (disturbance in lipid metabolism leading to changes in plasma lipoprotein function and/or levels) (Go 2014; Piepoli 2016; Santulli 2013). One‐quarter of adults aged 50 years have at least one risk factor for the development of CVD (Lloyd‐Jones 2006). According to the American Heart Association, nearly 35% of adults in the USA have obesity (body mass index (BMI) ≥ 30 kg/m²), almost 40% have dyslipidaemia, 33% have hypertension, 8.3% have diabetes, and 38% have abnormal fasting glucose or prediabetes (Go 2014). Among people free of CVD at 50 years of age, more than half of men and nearly 40% of women will develop CVD during their remaining life span (Lloyd‐Jones 2006). Diabetes confers the highest lifetime risk for CVD of any single risk factor (Lloyd‐Jones 2006), with hypertension, dyslipidaemia, and obesity also identified as factors indicating increased risk (Go 2014; Lloyd‐Jones 2006; Piepoli 2016; Santulli 2013).
CVD is a life course disease, commencing with risk factors (e.g. hypertension, dyslipidaemia) that over time may contribute to the development of subclinical disease (Berenson 1998). Without proper management of risk factors, subclinical CVD more rapidly transitions to overt CVD, meaning that early identification of high‐risk patients is crucial for improving patient prognosis (Kuller 1995; WHO 2016).
Traditional risk factor interventions for the prevention of CVD and cardiovascular events have brought about reductions in cardiovascular morbidity and mortality in at‐risk populations (Ebrahim 2011; Nadir 2012). Despite these efforts, a residual risk for the development of CVD remains that is not preventable by targeting traditional risk factors (Olsen 2007; Wang 2006). One study estimated that even among patients with optimal risk factor control, 43% of coronary events would still occur (Chiuve 2006). In patients with diabetes, current approaches to cardiovascular risk factor management do not appear to attenuate the future risk of heart failure (Rawshani 2018). Therefore, there is a clear gap between primary and secondary prevention of CVD that is not adequately addressed by the traditional risk factor approach.
Description of the intervention
The intervention in our review is the application of circulating brain natriuretic peptide (BNP) and N‐terminal pro B‐type natriuretic peptide (NT‐proBNP) levels to risk‐stratify patients with established CVD, but without heart failure, for more intensive cardiovascular management.
Biomarkers such as troponin 1, C‐reactive protein, and the natriuretic peptides (NPs) (BNP and NT‐proBNP) have emerged as potentially important adjuncts to traditional cardiovascular risk assessment (Zethelius 2008). BNP and NT‐proBNP have proven utility for the diagnosis and prognostication of patients with heart failure (Clerico 2004; Eurlings 2010; Groenning 2004; Januzzi 2011; Ponikowski 2016), and a recent Cochrane Review found that BNP‐guided treatment for patients with heart failure may reduce the number of heart failure‐related hospitalisations (McLellan 2016). These NPs have also demonstrated high independent strength in predicting CV events and mortality in patients without heart failure and in detecting left ventricular dysfunction (LVD) in both asymptomatic and symptomatic patients (Christenson 2010; McDonagh 1998; Tarnow 2006; Tonkin 2015; Wang 2004; Welsh 2012).
McDonagh and colleagues first proposed measurement of NP as a screening method for identification of left ventricular systolic dysfunction (LVSD) in the general population (McDonagh 1998). In their study, they demonstrated that almost half of those diagnosed with LVSD on echocardiography were asymptomatic, and that NP levels were elevated in both asymptomatic and symptomatic patients. Normal BNP levels in this population were estimated to be < 18 pg/mL, and other studies have shown that higher NP levels are associated with increased risk of CV events, mortality, and LVSD (Kara 2014; McDonagh 1998; Wang 2004). Numerous subsequent studies have reiterated the effectiveness of NP screening for detecting ventricular dysfunction (Betti 2009; McGrady 2013; Ng 2005).
NP screening provides a feasible strategy by which heart failure may be detected much earlier in its natural history, before development of more advanced, symptomatic disease (McDonagh 2002). However, widespread population screening is resource‐intensive and is unlikely to be cost‐effective. Several studies have demonstrated the cost‐effectiveness of NP screening for LVD in high‐risk subgroups, such as those with hypertension, ischaemic heart disease, or diabetes (Heidenreich 2004; Ledwidge 2015; Nielsen 2003).
Ledwidge and colleagues were the first to integrate community NP screening for risk stratification of patients with intensive diagnostic and therapeutic strategies (Ledwidge 2013). In this study, patients with elevated BNP received multi‐dimensional, collaborative care between the primary care physician and the cardiologist. This collaborative care approach reduced rates of LVD and heart failure, as well as emergency hospitalisations for major adverse cardiovascular events (MACE). In a subsequent study of patients with diabetes, Huelsmann and coworkers used elevated NT‐proBNP to select patients for usual care, or an intervention involving cardiologist‐led up‐titration of renin‐angiotensin‐aldosterone system (RAAS)‐modifying therapies and beta‐blockers to maximum doses (Huelsmann 2013). Although there is heterogeneity in the populations studied, the interventions applied, and the NP test thresholds used, NP‐guided treatment for prevention of heart failure has been incorporated into guidelines, including the 2017 American Heart Association/American College of Cardiology guidelines on Heart Failure (Yancy 2017), and the 2017 Canadian Cardiovascular Society Heart Failure Management Guidelines (Ezekowitz 2017).
This review sought to determine whether NP‐guided treatment for people with cardiovascular risk factors and without heart failure will improve morbidity and mortality versus standard care (defined as local guideline‐based care, including modification of pharmacological, educational, and lifestyle interventions, without accounting for the NP level).
How the intervention might work
Modulation of traditional risk factors (e.g. hypertension, dyslipidaemia) has improved cardiovascular outcomes in at‐risk individuals, but residual risk remains (Ebrahim 2011; Krogsbøll 2012).
BNP and the biologically inactive NT‐proBNP are members of the NP family that are released by cardiomyocytes in response to various stimuli, including myocyte stretch due to volume expansion and pressure overload, ischaemia (reduced coronary blood supply to the heart), fibrosis, and inflammation (Maeda 1998; Phelan 2012; Sabatine 2004; Yoshimura 1993). As NPs indicate a physiological response to established cardiovascular stress, strain, or damage, they add predictive power to conventional risk factors, which largely reflect the potential for cardiovascular insult (McGrady 2013; Onodera 2012; Tarnow 2006; Wang 2004).
Increases in plasma BNP/NT‐proBNP concentration have diagnostic and prognostic implications for selected populations, as demonstrated initially in heart failure, and subsequently in early‐stage and asymptomatic disease (Eurlings 2010; Gardner 2003; Kearley 2011). In some studies, NPs have shown superiority over traditional CVD risk factors, such as hypercholesterolaemia and hypertension, for identifying those at risk of heart failure (Clerico 2007), acute coronary syndrome (Glaser 2011; Scirica 2011), and coronary heart disease (Mishra 2014). Thus, measurement of NP levels to identify those at greatest risk of cardiovascular events, followed by targeted intensive risk reduction (including pharmacotherapy, diagnostic and investigation strategies, and lifestyle and educational interventions), may reduce the occurrence of mortality and morbidity, including MACE, in this population. Although it is the most commonly used endpoint for cardiovascular research, there is no standard definition for MACE, and individual outcomes used to make this composite endpoint vary by study (Kip 2008).
Why it is important to do this review
NP‐guided treatment for optimisation of heart failure management is well established (Ponikowski 2016; Yancy 2013), and this is the topic of another Cochrane Review (McLellan 2016). Evidence for the use of NPs to identify and deliver a targeted intervention to an at‐risk population is emerging, but this approach to CVD and heart failure prevention is not yet part of routine clinical care.
The 2017 Canadian Cardiovascular Society Heart Failure Management Guidelines suggest that in individuals at risk for development of heart failure (HF), "BNP > 50 pg/mL or NT‐proBNP > 125 pg/mL should prompt a request for specialist consultation and imaging, and/or initiation or intensification of neurohormonal blocking agents and lifestyle interventions" (Ezekowitz 2017). The 2017 American Guidelines for the Management of Heart Failure issued a 'moderate' recommendation that "for patients at risk of developing heart failure, NP‐based screening followed by team‐based care can be useful to prevent the development of left ventricular dysfunction (systolic or diastolic) or new‐onset heart failure" (Yancy 2017).
Due to the scarcity of scientific evidence and limited clinical experience in this area, it is difficult for guidelines to provide physicians with a clear consensus or specific recommendations on NP screening. In this review, we would like to collate and, through meta‐analysis, strengthen the existing body of evidence for this approach to CVD prevention, thereby allowing clearer recommendations to be made.
Objectives
To assess the effects of natriuretic peptide (NP)‐guided treatment for people with cardiovascular risk factors and without heart failure.
Methods
Criteria for considering studies for this review
Types of studies
We included all randomised controlled trials (RCTs).
Types of participants
We included adults (≥ 18 years of age) with risk factors for development of CVD. We considered the following risk factors.
-
Hypertension.
-
Dyslipidaemia.
-
Obesity (BMI ≥ 30 kg/m²).
-
Metabolic syndrome.
-
Vascular disease.
-
Diabetes mellitus.
-
Atrial fibrillation.
-
Valvular heart disease.
-
Elevated levels of NP, defined as BNP > 35 pg/mL, or NT‐proBNP > 125 pg/mL, or both (as considered by the European Society of Cardiology to be the upper limit of normal in the non‐acute heart failure setting (Ponikowski 2016)). We included NP measured by any assay.
We did not consider lifestyle risk factors, such as sedentary lifestyle, diet, smoking, and alcohol intake. We included all healthcare settings (i.e. hospital, community). We excluded people with symptomatic heart failure at baseline, diagnosed by an established reference standard such as echocardiography, cardiac magnetic resonance imaging, or specialist opinion based on reference criteria (e.g. Framingham) (McKee 1971), or a combination of these. At baseline, we excluded people who were being investigated for a possible diagnosis of symptomatic heart failure and people with any evidence of asymptomatic left ventricular systolic dysfunction (left ventricular ejection fraction < 50%) at baseline. We contacted study authors to obtain data on subgroups outlined in our protocol; however we did not receive additional data from these authors.
Types of interventions
We included RCTs comparing NP‐based screening (to identify patients at increased risk of developing a cardiovascular event) and subsequent NP‐guided treatment versus standard care. NP‐guided treatment includes modification and optimisation of pharmacological therapy (as defined by trialists), diagnostic and investigation strategies, and educational and lifestyle interventions based on NP levels, that is, supplementary to care provided in the control group. We included studies that involved any element of NP‐guided treatment. We defined standard care as local guideline‐based care, including modification of pharmacological, educational, and lifestyle interventions, without accounting for the participant's NP level.
Types of outcome measures
Primary outcomes
-
Cardiovascular mortality (as defined by trialists)
-
Cardiovascular hospitalisation (as defined by trialists)
Secondary outcomes
-
All‐cause mortality
-
All‐cause hospitalisation (all occurrences)
-
Ventricular dysfunction (as defined by trialists)
-
Change in NP level at completion of follow‐up
We used the definitions employed by investigators of the study under consideration.
Search methods for identification of studies
Electronic searches
The Information Specialist from the Cochrane Heart Group conducted systematic searches of the following databases for RCTs without language, publication year, or publication status restrictions (all searches conducted 9 July 2019; search strategies provided in Appendix 1).
-
Cochrane Central Register of Controlled Trials (CENTRAL; 2019, Issue 7), in the Cochrane Library.
-
Epub Ahead of Print, In‐Process & Other Non‐Indexed Citations, MEDLINE Daily, and MEDLINE (Ovid, 1946 to 8 July 2019).
-
Embase (Ovid, 1980 to 2019 week 27).
-
Conference Proceedings Citation Index ‐ Science (CPCI‐S) Web of Science (Thomson Reuters, 1990 to 9 July 2019).
The Information Specialist applied the Cochrane sensitivity‐maximising RCT filter to MEDLINE (Ovid) and adaptations of it to Embase and Web of Science (Lefebvre 2011).
We also conducted searches of ClinicalTrials.gov (www.ClinicalTrials.gov) (9 July 2019), the World Health Organization (WHO) International Clinical Trials Registry Platform (ICTRP) Search Portal (apps.who.int/trialsearch) (9 July 2019), and the EU Clinical Trials Register (www.clinicaltrialsregister.eu) (14 July 2019) for ongoing or unpublished trials.
Searching other resources
We checked reference lists of all primary studies and reviewed articles for additional references. We checked for retraction statements and errata among included studies but found none.
Data collection and analysis
Selection of studies
Two review authors (FR, CS) independently screened titles and abstracts of articles obtained in the search results and coded them as ‘retrieve' (eligible or potentially eligible/unclear) or ‘do not retrieve'. We retrieved the full‐text study reports. Two review authors (FR, CS) independently screened the full‐text articles for all potentially relevant studies, identified studies for final inclusion, and identified and recorded reasons for exclusion of ineligible studies. We resolved disagreements through discussion and, when required, we consulted a third review author (CR). When necessary, we contacted trial authors to clarify a study's eligibility. We identified and excluded duplicates and collated multiple reports of the same study so that each study rather than each report was the unit of interest in the review. We recorded the selection process in sufficient detail to complete a PRISMA flow diagram (Figure 1), along with a Characteristics of excluded studies table.

PRISMA flow diagram.
Data extraction and management
Two review authors (CS, RBP) independently performed data extraction using a data collection form based on the Cochrane Handbook for Systematic Reviews of Interventions (Higgins 2017). The form had been piloted by one study in the review (Ledwidge 2013). One review author (CS) extracted the following study characteristics from included studies.
-
Methods: study design, total duration of study, details of any run‐in period, number of study centres and locations, study setting, and date of study.
-
Participants: number of participants randomised, number of participants completing the study period, and number of participant withdrawals; mean age, age range, gender, severity of condition (as defined by trialists), diagnostic criteria, inclusion criteria, and exclusion criteria.
-
Interventions: intervention, comparison, concomitant medications, and excluded medications.
-
Outcomes: primary and secondary outcomes specified and collected and time points reported.
-
Notes: funding for trial and notable conflicts of interest of trial authors.
Two review authors (CS, RBP) independently extracted outcome data from included studies. We resolved disagreements by reaching consensus or by involving a third review author (CR). One review author (CS) transferred data into the Review Manager 5 (RevMan 5) file (Review Manager 2014), and another review author (FR) double‐checked the data for accuracy. We double‐checked that data were entered correctly by comparing data presented in the systematic review against the study reports. A second review author (FR) spot‐checked trial characteristics for accuracy against the trial report.
Assessment of risk of bias in included studies
Two review authors (CS, RBP) independently assessed risk of bias for each study using the criteria outlined in the Cochrane Handbook for Systematic Reviews of Interventions, and provided a summary judgement for each study (Higgins 2017). We resolved disagreements by discussion or by consultation with another review author (CR). We assessed risk of bias according to the following domains.
-
Random sequence generation.
-
Allocation concealment.
-
Blinding of participants and personnel.
-
Blinding of outcome assessment.
-
Incomplete outcome data.
-
Selective outcome reporting.
-
Other bias.
We judged each potential source of bias as high, low, or unclear, and provided a quote from the study report together with a justification for our judgement in the ‘Risk of bias' table. We summarised ‘Risk of bias' judgements across different studies for each of the domains listed. When we obtained information on risk of bias related to unpublished data or correspondence with a trialist, we noted this in the ‘Risk of bias' table. When considering treatment effects, we took into account the risk of bias for studies that contributed to that outcome. We had planned to undertake sensitivity analysis by excluding studies that were at high or unclear risk of bias for random sequence generation, allocation concealment, and incomplete data. However, due to the small number of included studies, this was not possible.
Assessment of bias in conducting the review
We conducted the review according to the published protocol and reported any deviations from it in the Differences between protocol and review section of the review.
Measures of treatment effect
For dichotomous data, we used the numbers of events in intervention and control groups for each trial to calculate the Mantel‐Haenszel risk ratio (RR) with 95% confidence intervals (CIs).
For continuous outcomes, we converted data into mean differences (MDs) and presented them with 95% CIs, as per the guidelines provided in the Cochrane Handbook for Systematic Reviews of Interventions (Higgins 2017).
We intended to use standardised mean differences (SMDs) to combine data when trials used different scales to measure the same variable. However, we found no such data in our included trials and we did not use SMDs.
Where applicable we described skewed data reported as medians and interquartile ranges (without variance data) narratively within the results text.
Unit of analysis issues
The review presents no issues related to the unit of analysis, as we have included only individually randomised trials with one comparator and one control arm each, and outcomes were measured at single time points only. If in future updates of this review we encounter trials with multiple intervention arms, or trials that report outcomes at different time points, we will follow methodological guidance provided by Deeks 2017.
Dealing with missing data
When data were missing, we contacted authors/investigators to verify critical study characteristics and to request further information.
Assessment of heterogeneity
We assessed statistical heterogeneity visually and by using the I² statistic. We conducted a fixed‐effect meta‐analysis when no heterogeneity was present. When we identified substantial heterogeneity (I² > 50%), we planned to employ a random‐effects model and to explore possible causes by conducting prespecified subgroup analyses (Ryan 2016; detailed in Subgroup analysis and investigation of heterogeneity). However, we did not identify substantial heterogeneity for any outcomes; therefore this was not necessary. We described clinical and methodological heterogeneity narratively.
Assessment of reporting biases
If we had been able to pool more than 10 trials, we would have created and examined a funnel plot to explore possible small‐study bias for the primary outcomes (Sedgwick 2013). However, due to the small number of included trials, we were unable to do this.
Data synthesis
We employed a fixed‐effect Mantel‐Haenszel model for calculating RRs for pooled outcomes, as substantial heterogeneity was not present for any of the outcomes (I² < 50%). Had we identified substantial heterogeneity for outcomes, we had planned to use a random‐effects model (see Assessment of heterogeneity above).
'Summary of findings' table
We created summary of findings Table for the main comparison by using the following primary and secondary outcomes: cardiovascular mortality (as defined by trialists), cardiovascular hospitalisation (as defined by trialists), all‐cause mortality, all‐cause hospitalisation (all occurrences), ventricular dysfunction (as defined by trialists), and change in NP level at completion of follow‐up.
We used the five GRADE considerations (risk of bias, inconsistency, imprecision, indirectness, and publication bias) to assess the certainty of a body of evidence as it relates to studies that contributed data to the analyses for prespecified outcomes. We used methods and recommendations as described in Section 8.5 and Chapter 12 of the Cochrane Handbook for Systematic Reviews of Interventions (Higgins 2017), along with GRADEpro GDT software (GRADEpro GDT 2015). Two review authors (CS, RBP) independently assessed the quality of evidence. We resolved disagreements by reaching consensus or by involving a third review author (FR). We used footnotes to document our justification for decisions to downgrade the quality of evidence.
Subgroup analysis and investigation of heterogeneity
We planned to perform the following subgroup analyses for the primary outcome.
-
Age (≥ 65 years vs < 65 years).
-
Gender.
-
Diabetes mellitus.
-
Obesity (BMI ≥ 30 kg/m² vs BMI < 30 kg/m²).
-
Atrial fibrillation versus non‐atrial fibrillation.
-
Valvular heart disease versus non‐valvular heart disease.
-
Ischaemic heart failure versus non‐ischaemic heart failure.
-
NP levels at baseline for classification of subgroups (BNP < 50 pg/mL and NT‐proBNP < 125 pg/mL; BNP ≥ 50 pg/mL and NT‐proBNP ≥ 125 pg/mL). These subgroups represent the cut‐off point specified by the 2017 Canadian Cardiovascular Society Heart Failure Management guidelines for implementation of strategies to prevent heart failure (Ezekowitz 2017) (please note that this subgroup was modified post hoc to reflect updates from the 2017 guidelines; see Differences between protocol and review).
-
Renal function (estimated glomerular filtration rate (eGFR) ≥ 60 mL/min/1.73 m² or < 60 mL/min/1.73 m² as measured by the Cockcroft and Gault or Modification of Diet in Renal Disease (MDRD) formula).
Older age, female gender, and diabetes are associated with higher NP levels (Raymond 2003; Wang 2002).
Due to the paucity of data, we could not conduct most of our planned subgroup analyses. We described the characteristics of included trials according to methods, participants, interventions, and outcomes to establish clinical and methodological heterogeneity across included trials narratively. We were able to perform subgroup analysis based on NP levels at baseline (according to the post hoc modified subgroup; see Differences between protocol and review).
We included the primary outcome cardiovascular hospitalisation in the subgroup analysis. We were unable to perform subgroup analysis on the other primary outcome ‐ cardiovascular mortality ‐ as only one study reported this outcome. Post hoc, we considered performing subgroup analysis on the secondary outcomes; however we did not have sufficient data to do this. We used the formal statistical test for heterogeneity across subgroups based on the random‐effects model to test for subgroup interactions (Borenstein 2008), and we used caution in interpreting subgroup analyses, as advised in Section 9.6 of the Cochrane Handbook for Systematic Reviews of Interventions (Deeks 2017).
Sensitivity analysis
We planned to carry out sensitivity analyses by including only studies at low risk of bias for random sequence generation, allocation concealment, and incomplete data. However, an insufficient number of studies met the inclusion criteria of the review, so we could not do this.
Results
Description of studies
Results of the search
Through the database searches, we retrieved 14,462 records, and via a search of clinical trial registries, we retrieved 1034 records. After de‐duplication, we screened 10,193 records by title and abstract. Of these, 10,156 records did not meet the inclusion criteria, and we excluded them. We assessed the remaining 37 records in full text for eligibility and excluded 22 of them. We assessed 15 reports of four studies as eligible. Two studies (10 reports) were ongoing. We included five reports of two studies in the qualitative synthesis and three reports of two studies in the quantitative synthesis, with one additional record later sourced with data from trialists. The flow of studies is displayed in Figure 1.
Included studies
Methods
Both of the included studies (reported in three references) were RCTs (Huelsmann 2013; Ledwidge 2013). Both studies were conducted in Europe; Ledwidge 2013 was a single‐centre study conducted in Ireland, and Huelsmann 2013 was conducted in Austria with patients cared for at two sites. Both studies had one comparison arm and compared NP‐guided treatment to standard care. Study duration ranged from two years in Huelsmann 2013 to mean 4.3 years in Ledwidge 2013. One study measured BNP (Ledwidge 2013), and the other measured NT‐proBNP (Huelsmann 2013). Full reports were available for both studies, and we obtained additional information for both studies through direct contact with the study authors.
Participants
Ledwidge 2013 was a pragmatic RCT involving one specialist centre and 39 general practices in the catchment area of a large teaching hospital. The trial recruited 1374 patients (677 in control group and 697 in intervention group). Participants included adults older than 40 years of age with a history of one or more of the following: hypertension, hyperlipidaemia, obesity, vascular disease (coronary artery disease, cerebrovascular disease, and peripheral vascular disease), diabetes mellitus, arrhythmia requiring therapy, or moderate to severe valvular disease. Patients who had symptoms of heart failure or established evidence of left ventricular systolic dysfunction were excluded. The mean age of participants was 65.4 years in the control group and 64.1 years in the intervention group, and more female than male participants were included (55.7% in the control group and 53.7% in the intervention group).
In Ledwidge 2013, data for the outcomes all‐cause hospitalisation and all‐cause mortality were derived from a subanalysis, which included a subsample of participants from the primary analysis. A total of 1054 participants were included (522 in the control group and 532 in the intervention group). The median age of participants was 65.8 years, and the mean duration of follow‐up was 4.3 years. Characteristics of participants in the subsample closely mirrored the full sample, although a marginally higher proportion of patients with hypertension at baseline were included in the subsample.
Huelsmann 2013 was an RCT in which all participants (control and intervention groups) were cared for at a specialist diabetic outpatient clinic, with intervention group participants attending additional appointments at a cardiac outpatient clinic of a different hospital. A total of 300 participants with type 2 diabetes and NT‐proBNP < 125 pg/mL were randomised (150 in control group and 150 in intervention group). Patients with established evidence of left ventricular systolic dysfunction (LVSD) were excluded. The mean age of participants was 67.2 years in the control group and 67.8 years in the intervention group. Slightly fewer female than male participants were included (43.3% in the control group and 41.3% in the intervention group).
Interventions
The components of the interventions delivered in both studies differed. In one study, participants in the control group received standard care defined as routine review by their primary care physician at least annually and specialist care as required (Ledwidge 2013). In the intervention group, BNP results were made available to the participants’ primary care physician, and patients with a BNP result of ≥ 50 pg/mL were referred to a specialist cardiovascular centre. Intervention group patients with a BNP result of < 50 pg/mL received the same care as those in the control group but with disclosure of BNP values to patients and their primary care physician. Participants with a BNP level of ≥ 50 pg/mL underwent echocardiography and review by a cardiologist at the study centre, who decided on further investigation and management. The intervention in participants with BNP ≥ 50 pg/mL was multi‐dimensional and included optimisation of therapy (no predefined protocol), investigation and treatment of abnormalities detected on echocardiography, lifestyle advice, and counselling regarding medication adherence.
In the second study, control group participants received standard care at a diabetes care unit with appointments every three months over a 12‐month period (Huelsmann 2013). In addition to usual care, the intervention group attended visits at a cardiac outpatient clinic where RAAS antagonists and beta‐blockers were up‐titrated to maximum tolerated doses in a predefined manner.
Distinct differences were evident in the content of the interventions delivered in both studies. In Ledwidge 2013, intervention group patients with elevated BNP received multi‐dimensional care. By contrast, the intervention delivered to the intervention group in Huelsmann 2013 focused solely upon up‐titration of RAAS antagonists and beta‐blockers to maximum doses. Despite differences in interventional components, both interventions focused on optimisation of therapy, and both studies observed increased use of RAAS‐modifying therapy. Thus, we decided to perform meta‐analysis. However, the heterogeneity of the interventions must be kept in mind when effects of the interventions are interpreted.
Outcomes
Both studies reported the following outcomes: cardiovascular hospitalisation (secondary outcome in both studies); all‐cause hospitalisation (secondary outcome in Huelsmann 2013; not a prespecified outcome in Ledwidge 2013 but data available); all‐cause mortality (not a prespecified outcome in either study but data provided); and change in NP level at the end of follow‐up (secondary outcome in both studies). Meta‐analysis was performed for each of these outcomes, except for change in NP level at the end of follow‐up (different NPs used in each study). One study reported cardiovascular mortality (not a prespecified outcome) (Huelsmann 2013). One study included the outcome ventricular dysfunction as a primary outcome (Ledwidge 2013). In this study, trialists defined ventricular dysfunction as left ventricular dysfunction (any patient with asymptomatic LVSD and/or asymptomatic left ventricular diastolic dysfunction (LVDD)) with or without heart failure (defined as any patient with LVD (LVSD and/or LVDD) and with symptoms of heart failure requiring emergency admission to hospital). We considered this outcome definition to be appropriate to our predefined outcomes as ventricular dysfunction is an umbrella term for both asymptomatic and symptomatic ventricular dysfunction.
Clinical and methodological heterogeneity
We recognise that there is clinical and methodological heterogeneity between the included studies, and we carefully considered the appropriateness of pooling results. First, the duration of follow‐up varied from two years in Huelsmann 2013 to mean 4.3 years in Ledwidge 2013. Second, there were important differences in the inclusion criteria of the studies: Huelsmann 2013 recruited only patients with type 2 diabetes and elevated NT‐proBNP, and Ledwidge 2013 recruited a heterogeneous cohort of patients with various cardiovascular risk factors. Ledwidge 2013 did not impose a threshold on NP level for inclusion in the study; therefore the control and intervention arms were heterogeneous for high‐ and low‐risk patients as classified by NP level. The components of the interventions also differed. Ledwidge 2013 used a multi‐dimensional intervention, and Huelsmann 2013 focused solely on optimisation of drug therapy.
We acknowledge these important differences between studies, and we tried to explore the effects of these differences when possible. We assessed statistical heterogeneity visually and by using the I² statistic. We did not identify any statistical heterogeneity in any of our outcomes (I² = 0 for all). We did not have sufficient data to perform subgroup analyses for factors such as diabetes or duration of follow‐up; however, we hope that in future updates of this review, we will find sufficient data to explore these factors.
We were able to perform subgroup analysis for the primary outcome cardiovascular hospitalisation in those with (1) BNP < 50 pg/mL/NT‐proBNP < 125 pg/mL and (2) BNP ≥ 50 pg/mL/NT‐proBNP ≥ 125 pg/mL (post hoc modification; see Differences between protocol and review). The results of this analysis show that there was no significant difference in the effect estimate between subgroups. In view of these factors, we decided to pool results from both studies when possible. However, the findings of this review should be interpreted with caution due to the potential for clinical and methodological heterogeneity between studies.
Excluded studies
We have included 15 studies (19 references) in the Characteristics of excluded studies table. We excluded 10 of these studies (14 references) as the participants had heart failure or ventricular dysfunction at baseline, two because the study was not designed as an RCT, one as trial outcomes did not match our prespecified primary and secondary outcomes, and one because the intervention did not meet our inclusion criteria. One study met our eligibility criteria for inclusion in the review (NCT00604006). However, we contacted the study author on 20 August 2019 to request data and were informed that no data were available. Therefore, we excluded the study. We excluded three more studies as they were duplicate reports of the same study.
Ongoing studies
We identified two ongoing trials that met our inclusion criteria (Dimitriu 2015; Huelsmann 2016). Details are shown in Characteristics of ongoing studies. Recruitment is ongoing for both trials. No data are available yet for Huelsmann 2016, and partial outcome data are available for Dimitriu 2015.
Risk of bias in included studies
We have detailed the risk of bias assessments in the Characteristics of included studies tables, and we have summarised these in the text below and in Figure 2 and Figure 3. Assessment of risk of bias was based on both published and unpublished data.
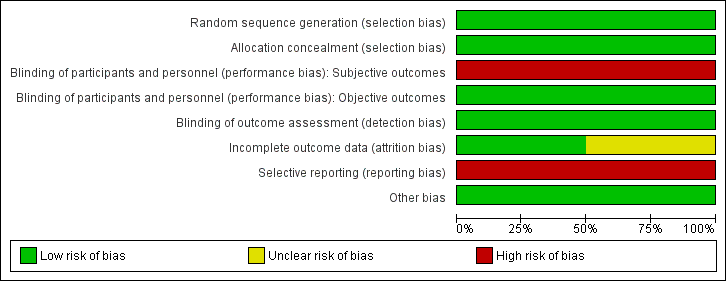
Risk of bias graph: review authors' judgements about each risk of bias item presented as percentages across all included studies.

Risk of bias summary: review authors' judgements about each risk of bias item for each included study.
Allocation
We judged both studies to be at low risk for selection bias, as the randomisation sequence was computer‐generated (Huelsmann 2013; Ledwidge 2013). Both studies clearly stated that the study was randomised, and one provided in the report sufficient details on the method of randomisation applied (Ledwidge 2013). For the second study, we obtained details on the method of randomisation through personal contact with the study author (Huelsmann 2013).
Allocation concealment was appropriate in both studies, and we judged risk of bias to be low (Huelsmann 2013; Ledwidge 2013). Neither study reported allocation concealment in sufficient detail in the published report. We obtained information on allocation concealment through personal contact with study authors.
Blinding
Blinding of participants and personnel (i.e. those delivering the intervention) to treatment allocation was not feasible due to the nature of the interventions. We determined that objective outcomes such as cardiovascular mortality, all‐cause mortality, ventricular dysfunction (echocardiographer and cardiologist reviewing end of study echo were blinded, and a clear definition of ventricular dysfunction was provided), and change in NP level at the end of follow‐up (laboratory measured parameter) were likely to be at low risk of performance bias in both studies, when included (Huelsmann 2013; Ledwidge 2013). Subjective outcomes (cardiovascular hospitalisation and all‐cause hospitalisation) were likely to be at high risk of performance bias in both studies (Huelsmann 2013; Ledwidge 2013).
We judged detection bias to be at low risk in both studies; outcome assessors were blinded to treatment allocation (Huelsmann 2013; Ledwidge 2013).
Incomplete outcome data
We judged one study to be at low risk of bias for incomplete outcome data (Huelsmann 2013), and we determined that the second was at unclear risk of bias (Ledwidge 2013). Both studies reported attrition by intervention arm, and one study provided detailed reasons for withdrawal (Ledwidge 2013). Huelsmann 2013 reported similar attrition between arms (13% in the control group and 9% in the intervention group). In Ledwidge 2013, overall attrition (withdrawal and loss to follow‐up) was 23.2% in the intervention group and 29.7% in the control group. Given the longer mean duration of the study (4.2 years), the attrition rate is considered reasonable.
In Ledwidge 2013, withdrawal was slightly higher in the control group than in the intervention group (19% vs 13%). However, detailed reasons for patient withdrawal were provided, and it is clear that the differential withdrawal rate was unrelated to study outcomes of interest; therefore this is unlikely to have biased the results.
Ledwidge 2013 performed an intention‐to‐treat (ITT) analysis to account for missing data for the following outcomes: cardiovascular hospitalisation (multiple imputation using chained equations), ventricular dysfunction, and change in NP level at the end of follow‐up (last observation carried forward used for both). With regard to the outcomes all‐cause hospitalisation and all‐cause mortality, participants who were lost to follow‐up or who did not provide at least one year of data were excluded from the analysis. As this study contributed most of the data for these outcomes, we judged these outcomes to be at overall high risk of attrition bias.
Huelsmann 2013 did not perform an ITT analysis. However, participants who withdrew agreed to be followed‐up for the outcomes all‐cause hospitalisation, cardiovascular hospitalisation, and death (information was obtained from mortality data and hospital files), so missing data was not an issue for these outcomes; therefore risk of attrition bias was low. For the outcome change in NP level at end of follow‐up, patients who withdrew from the study were excluded from the analysis.
Selective reporting
Both studies were preregistered at appropriate clinical trials registries, where predefined outcomes of interest were listed (Huelsmann 2013; Ledwidge 2013). Both studies were considered at high risk for reporting bias.
Huelsmann 2013 reported on all planned outcomes specified in the clinical trials registry entry; however, additional secondary outcomes listed in the paper were not prespecified in the clinical trials registry (all‐cause hospitalisation, unplanned cardiovascular hospitalisation or death, and heart failure hospitalisation).
Ledwidge 2013 has not yet reported on some of the secondary outcomes outlined in the study protocol (unpublished protocol obtained from study authors): (1) relative effects of intervention in prespecified subgroups: above and below median age, male/female, hypertension, diabetes, vascular disease, structural CVD, obesity; (2) relative effects of the intervention on Health and Lifestyle questionnaire; and (3) evaluation of clinical, demographic, biochemical, pharmacological, genomic, proteomic, and metabolomic determinants of natriuretic peptides. Through direct communication with study authors, we confirmed that these outcomes have not yet been reported.
Other potential sources of bias
We did not identify any other potential sources of bias; therefore we judged risk of bias for this domain to be low.
Effects of interventions
Cardiovascular mortality
One study with 300 participants reported cardiac mortality (Huelsmann 2013); therefore we were unable to perform meta‐analysis. As data for cardiovascular mortality were not available, we used event numbers for cardiac mortality. Event numbers were very low (one death in the intervention group and three in the control group), and there was uncertainty about effects of the intervention (risk ratio (RR) 0.33, 95% confidence interval (CI) 0.04 to 3.17; low‐quality evidence; Analysis 1.1).
Cardiovascular hospitalisation
Two studies with 1674 participants reported on cardiovascular hospitalisation (Huelsmann 2013; Ledwidge 2013). Study authors reported 135 cardiovascular hospitalisations in the control group and 72 in the intervention group (16% vs 9%). Pooled results based on a fixed‐effect model favoured the intervention group (RR 0.52, 95% CI 0.40 to 0.68; I² = 0%; moderate‐quality evidence; Analysis 1.2). Thus, moderate‐quality evidence suggests that NP‐guided treatment probably reduces the risk of cardiovascular hospitalisation.
All‐cause mortality
Two studies with 1354 participants reported on all‐cause mortality (Huelsmann 2013; Ledwidge 2013). In all, 45 deaths due to any reason were reported in the control group (7%) and 41 in the intervention group (6%). Pooled evidence, based on a fixed‐effect model, favoured NP‐guided treatment, but overall, the evidence showed uncertainty (RR 0.90, 95% CI 0.60 to 1.35; I² = 0%; low‐quality evidence; Analysis 1.4).
All‐cause hospitalisation
Two studies with 1354 participants reported on all‐cause hospitalisation (Huelsmann 2013; Ledwidge 2013). Study authors reported 404 hospitalisations for any reason in the control group (60%) and 341 in the intervention group (50%). The pooled result based on a fixed‐effect model favoured the intervention (RR 0.83, 95% CI 0.75 to 0.92; I² = 0%; moderate‐quality evidence; Analysis 1.5). Thus, moderate‐quality evidence suggests that NP‐guided treatment probably reduces the risk of all‐cause hospitalisation.
Ventricular dysfunction
One study with 1374 participants reported on ventricular dysfunction, defined as heart failure or left ventricular dysfunction (Ledwidge 2013). Fifty‐nine participants in the control group (9%) and 37 in the intervention group (5%) developed ventricular dysfunction. Results show a reduction in the risk of developing ventricular dysfunction with NP‐guided treatment compared to standard care (RR 0.61, 95% CI 0.41 to 0.91; high‐quality evidence; Analysis 1.6).
Change in NP level at the end of follow‐up
Both studies reported change in NP level (Huelsmann 2013; Ledwidge 2013). For Ledwidge 2013, we calculated change in BNP from baseline to follow‐up (mean 4.2 years). Huelsmann 2013 provided median NT‐proBNP values at baseline and after one year (follow‐up for all other outcomes was two years, but patients attended study visits for only 12 months). Given that each study used a different biomarker and that NP level was measured at different time points, it was not appropriate to perform meta‐analysis on this outcome. Furthermore, data from Huelsmann 2013 were reported as median and interquartile range (IQR), indicating that the data were skewed.
NP levels increased in both groups from baseline to time of measurement. This is consistent with previous research demonstrating that NP level increases with age (Redfield 2002; Wang 2002). In Ledwidge 2013, the mean difference in NP level from baseline to follow‐up was slightly lower in the intervention group than in the control group (mean difference (MD) from baseline to follow‐up: control arm 9.52 pg/mL, intervention arm 5.46 pg/mL). However, the evidence shows uncertainty for the effects of NP‐guided treatment on NP level at the end of follow‐up (MD between groups: 4.06 pg/mL, 95% CI ‐15.07 pg/mL to 6.95 pg/mL; 1 study; 1374 participants; moderate‐quality evidence; Analysis 1.7). Results show no significant differences between groups in change in BNP from baseline to follow‐up (P = 0.47).
For Huelsmann 2013, as the data were provided as median and IQR, we were unable to calculate the mean difference between groups. From the median values presented, we noted no significant change in NT‐proBNP concentration between groups after one year of treatment (NT‐proBNP at baseline (presented as median value): control group 266 pg/mL, IQR 181 to 402 pg/mL; intervention group 235 pg/mL, IQR 169 to 343 pg/mL; NT‐proBNP after 12 months (presented as median value): control group 264 pg/mL, IQR 167 to 394 pg/mL; intervention group 248 pg/mL, IQR 169 to 433 pg/mL).
It should be noted that currently no consensus has been reached on what should be considered a clinically significant change in NP level among patients without heart failure. Preanalytical factors and analytical and biological variability (which increases with time) contribute to the total intraindividual variability in NP level (Fraser 2006). Research conducted in heart failure patients suggests that changes in NT‐proBNP and BNP of 50% and 66%, respectively, over the course of one week are likely to signal a clinically significant change in patient status (O'Hanlon 2007), and an earlier small study suggested that in heart failure patients, a change in BNP/NT‐proBNP exceeding 30% is clinically meaningful (Bettencourt 2004).
Subgroup analysis
With the exception of NP level at baseline, it was not possible to explore subgroups within study populations as per protocol. In the review protocol, we planned to perform subgroup analysis according to those with (1) BNP 35 pg/mL to 100 pg/mL or NT‐proBNP 125 pg/mL to 300 pg/mL, and (2) BNP ≥ 100 pg/mL and NT‐proBNP ≥ 300 pg/mL. However, this was changed post hoc in light of the thresholds recommended by more recent guidelines (Ezekowitz 2017) (see Differences between protocol and review). We performed subgroup analysis for the following values: (1) BNP < 50 pg/mL and NT‐proBNP < 125 pg/mL, and (2) BNP ≥ 50 pg/mL and NT‐proBNP ≥ 125 pg/mL.
Subgroup analysis by NP level for the primary outcome cardiovascular hospitalisation shows that NP‐guided treatment reduced the risk of cardiovascular hospitalisation in both subgroups. Point estimates were similar in both subgroups and confidence intervals overlapped (BNP < 50 pg/mL and NT‐proBNP < 125 pg/mL: RR 0.55, 95% CI 0.32 to 0.95; 1 study; 876 participants; BNP ≥ 50 pg/mL and NT‐proBNP ≥ 125 pg/mL: RR 0.49, 95% CI 0.36 to 0.65; 2 studies; 798 participants; Analysis 1.3). The subgroup test for differences was non‐significant (P = 0.66).
We did not have sufficient data to perform subgroup analysis of NP level for the other pooled outcomes (all‐cause hospitalisation and all‐cause mortality).
Discussion
Summary of main results
We included in our review three reports of two trials (Huelsmann 2013; Ledwidge 2013). We identified two ongoing trials with treatment arms that include interventions assessed in this review (Dimitriu 2015; Huelsmann 2016). We performed pooled analysis on the outcomes cardiovascular hospitalisation, all‐cause hospitalisation, and all‐cause mortality. Single studies included the outcomes ventricular dysfunction and cardiovascular mortality; thus we could not perform pooled analyses.
Moderate‐quality evidence indicates that natriuretic peptide (NP)‐guided treatment probably reduces the risk of cardiovascular hospitalisation (48% risk reduction) and all‐cause hospitalisation (17% risk reduction) in those with risk factors for cardiovascular disease (CVD). High‐quality evidence shows a reduction in the risk of developing ventricular dysfunction with NP‐guided treatment compared to standard care; however this evidence was derived from a single study. Due to wide confidence intervals, there was uncertainty around the estimate of effects for the outcomes cardiovascular mortality, all‐cause mortality, and change in NP level at the end of follow‐up. Therefore, we cannot draw clear conclusions as to the effects of NP‐guided treatment on these outcomes.
Subgroup analysis by NP level at baseline shows that NP‐guided treatment reduces the risk of cardiovascular hospitalisation to a similar degree in both subgroups. This analysis also indicates that differences in patient characteristics according to NP level at baseline in each study did not introduce heterogeneity into our results (all participants in Huelsmann 2013 had NT‐proBNP >125 pg/mL, and Ledwidge 2013 did not impose a threshold on NP level for inclusion in the study).
It must be noted that we identified clinical and methodological heterogeneity in the two included studies (Huelsmann 2013; Ledwidge 2013). Although we did not identify any statistical heterogeneity in our pooled results, we were largely unable to explore possible sources of heterogeneity through subgroup analysis due to lack of data; therefore the results of this review should be interpreted with caution.
Overall completeness and applicability of evidence
The generalisability of this review was limited by the small number of studies identified for inclusion. However, although only two studies met the criteria for our review, our conclusions for all outcomes except cardiovascular mortality (data from one study with 300 participants; Huelsmann 2013) are based on analysis of between 1354 and 1674 analytical units, which contributes to the robustness of our findings.
Both studies were conducted at large urban centres in high‐income countries in Europe, and most participants were Caucasian. Therefore, our findings may not be generalisable to other ethnicities and income settings. In both studies, the intervention was delivered through a specialist cardiology outpatient clinic by a team of speciality staff (note that in Ledwidge 2013, intervention group patients with BNP < 50 pg/mL were cared for by their primary care physician). It is possible that results observed in the two studies would not be reproducible in other, less than ideal healthcare settings, such as primary care alone without specialist support.
Despite the small number of studies included, we were able to obtain data on all outcomes prespecified in the review protocol, and we were able to perform meta‐analysis on three of the six outcomes. Although we were able to obtain data on the outcome measures cardiovascular mortality, all‐cause mortality, and all‐cause hospitalisation, these were not planned outcomes of the included studies (all‐cause hospitalisation was a planned secondary outcome in Huelsmann 2013, but not in Ledwidge 2013). Neither of the studies included in our review were powered to detect differences in mortality between control and intervention groups; this, combined with the short duration of follow‐up, accounts for the small event numbers and imprecision seen in effect estimates for the outcomes cardiovascular mortality and all‐cause mortality. Thus, adequately powered studies with longer duration of follow‐up are needed to accurately assess the effects of NP‐guided treatment on mortality.
Evidence on the effects of NP‐guided treatment on the outcome ventricular dysfunction is available from a single study (Ledwidge 2013). Given the low event rate, the absolute risk reduction was small and the generalisability of this potential benefit is limited.
The comparator in the studies included in this review is 'standard care', which we defined as local guideline‐based care, including modification of pharmacological, educational, and lifestyle interventions, while not taking into account the participant’s NP level. It is important to note that standard care may vary considerably from setting to setting, depending on factors such as resource limitations, physician characteristics, and local guidelines. For some physicians, standard care may simply encompass the prescribing of drug therapy, but others may take a more holistic approach, routinely incorporating advice about lifestyle factors and medication adherence behaviours. Therefore, it is possible that the relative effects of the intervention may vary depending on the setting and the definition of standard care adopted by physicians.
We intended to perform subgroup analysis to determine whether several factors including age, gender, diabetes mellitus, obesity, atrial fibrillation versus non‐atrial fibrillation, valvular heart disease versus non‐valvular heart disease, ischaemic heart failure versus non‐ischaemic heart failure, NP level at baseline, or renal function had any impact on the primary outcome. However, due to the paucity of data, we were unable to perform our planned subgroup analyses, with the exception of NP level at baseline. This information would be useful for investigating whether all people with cardiovascular risk factors derive a similar benefit from NP‐guided treatment, or whether efforts should be targeted towards specific subpopulations. For future updates of this review, we hope that more detailed subgroup data will be available, so we can provide a more robust analysis.
Neither of the studies included explicitly reported on the safety of the intervention or provided the number of adverse events, although Huelsmann 2013 did note that there were no hospitalisations for adverse events.
We identified two ongoing trials (Dimitriu 2015; Huelsmann 2016). The results of these trials are likely to have an important impact on our confidence in the estimates of effect and may change the estimates relative to the current evidence base, given the number of participants and the estimated number of events.
Quality of the evidence
The quality of evidence for the outcomes included in this review ranged from low to high. Potential sources of bias identified included selective reporting, lack of blinding of participants and personnel for subjective outcomes, and attrition bias.
We deemed the quality of evidence (GRADE; summary of findings Table for the main comparison) to be moderate for cardiovascular hospitalisation, all‐cause hospitalisation (both downgraded by one level due to high risk of performance bias), and change in NP level at the end of follow‐up (downgraded by one level due to imprecision of effect size; wide confidence interval consistent with the possibility of causing benefit and harm). High‐quality evidence from a single study suggests that the risk of developing ventricular dysfunction is reduced by NP‐guided treatment. Although only one study reported this outcome, we did not downgrade for indirectness, in view of the large sample size and the broad patient population included in this study.
We judged the quality of evidence for cardiovascular mortality (single study) to be low due to serious concerns over substantial imprecision and small sample size; thus our confidence in the pooled result is low, and our estimate is likely to be affected by future research. We also considered the quality of evidence for the outcome all‐cause mortality (two studies) to be low due to concerns over imprecision and attrition bias.
We judged imprecision by whether the 95% confidence interval (CI) included the null, and whether it included important benefits and harms. When the confidence interval of the overall effect included both no effect and potential harm, we downgraded the evidence. Thus, we downgraded the evidence for cardiovascular mortality, all‐cause mortality, and change in NP level at the end of follow‐up. We did not downgrade the quality of evidence for any outcome due to inconsistency as no statistical heterogeneity was identified, nor for indirectness.
It is important to note that for the outcome cardiovascular hospitalisation, we noted slight heterogeneity in the definitions used by study authors. Huelsmann 2013 defined cardiovascular hospitalisation as any unplanned hospitalisation based on a cardiac (e.g. arrhythmia) or other macrovascular event (e.g. stroke, coronary artery disease, peripheral arterial disease). Ledwidge 2013 defined cardiovascular hospitalisation as emergency hospitalisation for any of the following major adverse cardiovascular events: arrhythmia, transient ischaemic attack, stroke, myocardial infarction, peripheral or pulmonary thrombosis/embolus, or heart failure. Although Huelsmann 2013 used a slightly broader definition, we were satisfied that the two definitions were similar enough to permit pooling of the results.
We acknowledge that there are several caveats in the interpretation of our results. First, none of the studies included in this review were designed to evaluate the effects of NP‐guided treatment on mortality; hence event numbers were low and there was significant imprecision in the estimates of effect. Second, our outcome results were dominated by a single study (Ledwidge 2013), which contributed 82% of the data to our pooled analyses. Third, we recognise that there is methodological and clinical heterogeneity between the included studies, and we were unable to explore these sources of heterogeneity through subgroup analysis due to the paucity of data. We carefully considered the appropriateness of pooling the data. In view of the lack of statistical heterogeneity identified between studies, we made a decision to pool the studies for our analysis. We were also cognisant of the fact that our review addresses a broad question in a broad participant group; therefore the heterogeneity in our studies may reflect the 'real‐life' situation. Thus, even in view of the heterogeneity, meta‐analysis is still likely to be useful. However, it is important to note that our pooled results should be interpreted with caution due to the potential for clinical and methodological heterogeneity between studies.
Potential biases in the review process
Four of the review authors (ML, KMD, CW, JG) were involved in one of the included studies. These authors were not involved in the screening of articles, nor in assessing the risk of bias or grading the quality of included studies for this systematic review and meta‐analysis.
We acknowledge the potential for publication bias in the systematic review. Although we did perform a thorough search with no date or language restrictions, there is inevitably the possibility that we may not have found relevant unpublished trials. However, we received excellent support from the Cochrane Heart Information Specialist, who assisted us in performing comprehensive and systematic database searches to minimise the risk of publication bias. In addition, we minimised study selection bias by assigning two review authors to independently review search results and to evaluate studies for inclusion against our predefined inclusion criteria.
Due to lack of available data, we were unable to perform most of our planned subgroup analyses. It is unclear whether the additional data would have altered the overall findings of this review.
Agreements and disagreements with other studies or reviews
To the best of our knowledge, this is the first systematic review and meta‐analysis to examine the effects of NP‐guided treatment for prevention of cardiovascular events in patients without heart failure. Multiple systematic reviews and meta‐analyses ‐ Balion 2014; De Vecchis 2014; Li 2013; Porapakkham 2010; Savarese 2013; Troughton 2014 ‐ and one Cochrane Review ‐ McLellan 2016 ‐ have explored the effects of NP‐guided treatment for patients with heart failure. However, due to the different patient populations included, it is not appropriate to make comparisons with these reviews.
A community cohort study by AbouEzzeddine and colleagues mirrors the findings of our meta‐analysis (AbouEzzedine 2016). These study authors identified a ‘STOP‐HF‐like’ cohort of 1576 participants without heart failure or systolic dysfunction from the Olmsted County population who had one or more cardiovascular risk factors (hypertension, hyperlipidaemia, obesity, vascular disease, diabetes, atrial fibrillation, or valve disease). Participants underwent screening for multiple biomarkers, including BNP and NT‐proBNP, and received a ‘STOP‐HF‐type’ preventive intervention over a four‐year period.
Review authors provided a theoretical model to evaluate whether biomarker‐guided management can prevent development of heart failure or occurrence of major adverse cardiovascular events (MACE) in a community sample. AbouEzzeddine and colleagues applied the effect estimates obtained from the biomarker screening strategy employed in STOP‐HF to demonstrate the efficacy of applying this strategy outside of the rigorously controlled randomised controlled trial (RCT) setting (Meijers 2016). Biomarker screening followed by a preventive intervention achieved a reduction of 19% and 25% when screened with N‐terminal pro B‐type natriuretic peptide (NT‐proBNP) and brain natriuretic peptide (BNP), respectively, in the biomarker‐positive population. However, this analysis assumed no change in MACE incidence in the population that was biomarker‐negative (AbouEzzedine 2016).
In our meta‐analysis, the intervention was associated with a 48% reduction in the risk of hospitalisation due to cardiovascular causes. The difference in observed risk estimates may be due to disparities in the design of the intervention delivered to patients. In the study by AbouEzzeddine et al, the intervention consisted of a single agent or strategy for cardiovascular prevention. By comparison, participants in Huelsmann 2013 and Ledwidge 2013 received a specialist intervention with thorough evaluation and follow‐up. This, along with the ideal conditions of the RCT environment, may account for the stronger effect estimates observed in these studies.
Both Huelsmann 2013 and Ledwidge 2013 are included in the 2017 Canadian Cardiovascular Society Heart Failure Management Guidelines (Ezekowitz 2017), which recommend that among individuals with risk factors for the development of heart failure, those with BNP > 50 pg/mL or NT‐proBNP > 125 pg/mL should undergo imaging and consultation with a specialist, followed by optimisation of neurohormonal blocking therapy and lifestyle interventions.
US guidelines also recommend NP screening for patients with risk factors for developing heart failure, with subsequent optimisation of guideline‐directed management and therapy by a cardiovascular specialist, to prevent the development of left ventricular dysfunction (systolic or diastolic) or new‐onset heart failure (Yancy 2017). In common with our own recommendations, these guidelines recommend further studies to examine the effects of NP screening and subsequent NP‐guided care on mortality.
Risk of bias graph: review authors' judgements about each risk of bias item presented as percentages across all included studies.
Risk of bias summary: review authors' judgements about each risk of bias item for each included study.

Comparison 1 Natriuretic peptide‐guided treatment versus standard care, Outcome 1 Cardiovascular mortality (as defined by trialists).

Comparison 1 Natriuretic peptide‐guided treatment versus standard care, Outcome 2 Cardiovascular hospitalisation (as defined by trialists).

Comparison 1 Natriuretic peptide‐guided treatment versus standard care, Outcome 3 Cardiovascular hospitalisation (as defined by trialists) by natriuretic peptide level.

Comparison 1 Natriuretic peptide‐guided treatment versus standard care, Outcome 4 All‐cause mortality.

Comparison 1 Natriuretic peptide‐guided treatment versus standard care, Outcome 5 All‐cause hospitalisation (all occurrences).

Comparison 1 Natriuretic peptide‐guided treatment versus standard care, Outcome 6 Ventricular dysfunction (as defined by trialists).

Comparison 1 Natriuretic peptide‐guided treatment versus standard care, Outcome 7 Change in NP level at the end of follow‐up.
| Natriuretic peptide‐guided treatment compared to standard care for the prevention of cardiovascular events in patients without heart failure | ||||||
| Patient or population: patients without heart failure | ||||||
| Outcomes | Anticipated absolute effects* (95% CI) | Relative effect | No. of participants | Certainty of the evidence | Comments | |
| Risk with standard care | Risk with natriuretic peptide‐guided treatment | |||||
| Cardiovascular mortality Follow‐up: 2 years | Study population | RR 0.33 | 300 | ⊕⊕⊝⊝ | Cardiovascular deaths not available, so cardiac deaths used | |
| 20 per 1000 | 7 per 1000 | |||||
| Cardiovascular hospitalisation (as defined by trialists) Follow‐up range: 2 years to mean 4.2 years | Study population | RR 0.52 | 1674 | ⊕⊕⊕⊝ | ||
| 163 per 1000 | 85 per 1000 | |||||
| All‐cause mortality | Study population | RR 0.90 | 1354 | ⊕⊕⊝⊝ | ||
| 60 per 1000 | 54 per 1000 | |||||
| All‐cause hospitalisation (all occurrences) | Study population | RR 0.83 | 1354 | ⊕⊕⊕⊝ | ||
| 601 per 1000 | 499 per 1000 | |||||
| Ventricular dysfunction (as defined by trialists) | Study population | RR 0.61 | 1374 | ⊕⊕⊕⊕ | Ventricular dysfunction was defined by trialists as left ventricular dysfunction and heart failure. Left ventricular dysfunction (LVD) included all patients with asymptomatic left ventricular systolic dysfunction (LVSD) and/or asymptomatic left ventricular diastolic dysfunction (LVDD). Heart failure included all patients with LVD (LVSD and/or LVDD) and with symptoms of heart failure requiring emergency admission to hospital | |
| 87 per 1000 | 53 per 1000 | |||||
| Change in NP level at the end of follow‐up | Mean change in NP level at the end of follow‐up was 9.52 pg/mL | MD 4.06 pg/mL higher | ‐ | 1374 | ⊕⊕⊕⊝ | These data come from Ledwidge 2013; NP level was reported as BNP. Huelsmann 2013 also reported change in NT‐proBNP after 1 year of treatment. However, these data were presented as median and interquartile range; therefore we could not calculate mean difference |
| *The risk in the intervention group (and its 95% confidence interval) is based on the assumed risk in the comparison group and the relative effect of the intervention (and its 95% CI). | ||||||
| GRADE Working Group grades of evidence. | ||||||
| aImprecision: very wide 95% confidence interval, which includes the line of null effect and is consistent with the possibility of both important benefits and harms. The sample size is small. Downgraded by two levels. bRisk of bias: both studies did not blind patients or personnel. Downgraded by one level. cImprecision: wide 95% confidence interval, which includes the line of null effect and is consistent with the possibility of important benefits and harms. Downgraded by one level. dRisk of bias: downgraded by one level due to attrition bias as one study excluded from analysis patients who were lost to follow‐up and those who withdrew, who did not have at least one year of detailed follow‐up cost data. eRisk of bias: echocardiographer and cardiologist reviewing end of study echo were blinded and diagnosis of ventricular dysfunction was based on clearly defined echocardiographic measures, which removed subjectivity in outcome assessment. Not downgraded. fImprecision: wide CIs that cross the line of no effect (zero) and include the possibility of the intervention causing both benefit and harm. Downgraded by one level. | ||||||
| Outcome or subgroup title | No. of studies | No. of participants | Statistical method | Effect size |
| 1 Cardiovascular mortality (as defined by trialists) Show forest plot | 1 | Risk Ratio (M‐H, Fixed, 95% CI) | Subtotals only | |
| 2 Cardiovascular hospitalisation (as defined by trialists) Show forest plot | 2 | 1674 | Risk Ratio (M‐H, Fixed, 95% CI) | 0.52 [0.40, 0.68] |
| 3 Cardiovascular hospitalisation (as defined by trialists) by natriuretic peptide level Show forest plot | 2 | 1674 | Risk Ratio (M‐H, Fixed, 95% CI) | 0.50 [0.38, 0.65] |
| 3.1 BNP < 50 pg/mL and NT‐proBNP < 125 pg/mL | 1 | 876 | Risk Ratio (M‐H, Fixed, 95% CI) | 0.55 [0.32, 0.95] |
| 3.2 BNP > 50 pg/mL and NT‐proBNP > 125 pg/mL | 2 | 798 | Risk Ratio (M‐H, Fixed, 95% CI) | 0.48 [0.36, 0.65] |
| 4 All‐cause mortality Show forest plot | 2 | 1354 | Risk Ratio (M‐H, Fixed, 95% CI) | 0.90 [0.60, 1.35] |
| 5 All‐cause hospitalisation (all occurrences) Show forest plot | 2 | 1354 | Risk Ratio (M‐H, Fixed, 95% CI) | 0.83 [0.75, 0.92] |
| 6 Ventricular dysfunction (as defined by trialists) Show forest plot | 1 | Risk Ratio (M‐H, Fixed, 95% CI) | Subtotals only | |
| 7 Change in NP level at the end of follow‐up Show forest plot | 1 | Mean Difference (IV, Fixed, 95% CI) | Subtotals only | |