| Study ID (Acronym) | Gillespie 2014 (REMoxTB) | Jawahar 2013 | Jindani 2014 (RIFAQUIN) | Merle 2014 (OFLOTUB) | Velayutham 2014 |
| Setting | Multiple sites in Africa (Kenya, South Africa, Tanzania, Zambia), Asia (China, India, Malaysia Thailand), Latin America (Mexico) | 6 sites in 2 cities in India | 6 cities in 4 countries in Africa (Botswana, South Africa, Zambia, Zimbabwe) | 5 countries in Africa (Benin, Guinea, Kenya, Senegal, South Africa) | 2 cities in India |
| Participants |
| Number randomized | 1931 | 429 | 827 | 1836 | 801 |
| Age | Adults (> 18 years) | Adults (> 18 years) | Adults (> 18 years) | Adults (18 to 65 years) | Adults (> 18 years) |
| HIV infection | Included (if CD4 count > 250 cells/μL and not on ART); 110 (7%) | Excluded | Included (if CD4 count > 150/mm³ and not on ART; 158 (27%) | Included if not stage 3 or 4 disease and not on ART; 304 (17%) | Excluded |
| Diagnosis of TB | Positive sputum smears on 2 occasions Culture‐confirmed susceptibility to rifampicin, isoniazid, pyrazinamide, and moxifloxacin | Newly diagnosed pulmonary TB with at least 2 positive sputum cultures. Confirmed by culture and MDR‐TB excluded, susceptibility to ofloxacin (as proxy for moxifloxacin) | 2 sputum samples that were positive for tubercle bacilli on direct smear microscopy No resistance to isoniazid, rifampicin, or moxifloxacin | Acid‐fast bacilli in 2 consecutive sputum smears; confirmed by culture (solid medium) and drug sensitivity tests to rifampicin, isoniazid, ethambutol, streptomycin, and gatifloxacin | 2 positive sputum smear smears for tuberculosis. Culture‐confirmed and MDR‐TB ruled out; susceptible to ofloxacin (as proxy for moxifloxacin) |
| Intervention(s) and comparator |
| Duration of ATT | 4 monthsa | 6 months | 4 monthsb | 6 months | 4 months | 6 monthsc | 4 months | 6 months | 4 monthsa | 6 months |
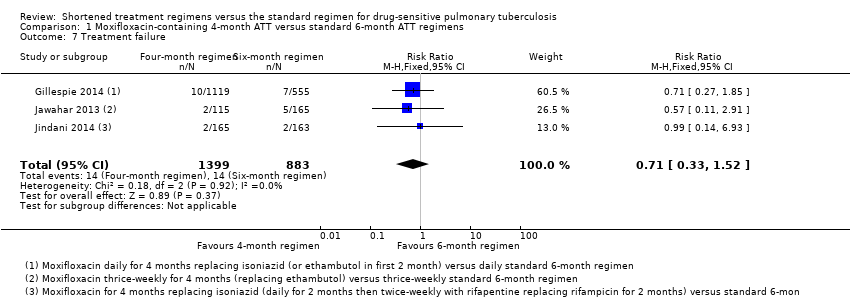
| Regimens | 2HRZM/2HRM + 2MRZE/2MR | 2HRZE/4HR | 2(HRZG)₃/ 2 (HRG)₃ 2(HRZM)₃/2(HRM)₃ | 2(HRZE)₃ /4(HR)₃ | 2MRZE/ 2P₂M₂ | 2HRZE/ 4HR | 2HRZG/ 2HRG | 2HRZE/4HR | 3HRZM + 2HRZM/ 2RHM + 2HRZM/ 2(RHM)₃ + 2HRZM/ 2(RHEM)₃ | 2(HRZE)₃/ 4(HR)₃ |
| Number allocated | 655 + 636 = 1291 | 640 | 141 118 | 170 | 275 | 275 | 917 | 919 | 629 | 172 |
| Late screening failures excluded after allocation | 38 + 32 = 70 | 40 | 5 3 | 5 | 36 | 35 | 62 | 51 | 13 | 8 |
| Number eligible | 1231 | 600 | 136 115 | 165 | 239 | 240 | 852 | 868 | 616 | 164 |
| Number analysed in m‐ITT analysis (% of those allocated) | 568 + 551 = 1119 (87) | 555 (87) | 136 (97) 115 (98) | 165 (97) | 193 (70) | 188 (68) | 791 (86) | 794 (86) | 590 (94) | 151 (88) |
| Number analysed in per‐protocol analysis (% of those allocated) | 514 + 524 = 1038 (80) | 510 (80) | 131 (93) 113 (96) | 159 (94) | 165 (60) | 163 (59) | 651 (71) | 601 (65) | As above |
| Number analysed in ancillary analysis (ITT) (% of those allocated) | 617 + 604 = 1221 (94) | 600 (94) | Not done | 239 (87) | 240 (87) | Not reported | Not reported |
| Outcomes reported |
| Relapse | Relapse within 18 months after randomization in those with negative culture with treatment. Relapse strains were those shown to be identical on 24‐locus MIRU analysis LJ solid media and MGIT liquid media used for culture | Recurrence of TB over 24 months after treatment in those with a favourable response with treatment: either bacteriologic recurrence (LJ solid media) or clinical/radiologic recurrence
Relapse not differentiated from re‐infection but majority occurred within 6 months after treatment | Relapse within 12 to 18 months after treatment. Two positive cultures within a period of 4 months without an intervening negative culture). Re‐infections differentiated from relapse through genotyping (MIRU‐VNTRs) LJ solid media used for culture in some centres, MGIT liquid media in others, and both in some centres | Recurrence of TB over 24 months after treatment proven bacteriologically (2 consecutive positive sputum samples a day apart) or clinically Genotyping (MIRU‐VNTRs) results available for only 70/140 (55%) of those with culture confirmed recurrence. Most were relapses | Not reported |
| Deaths | All deaths TB deaths | Reported (only non‐TB deaths occurred) | All deaths TB deaths | Death during treatment Death after treatment | Not reported |
| Treatment discontinuation | Includes those who did not complete treatment, relocated, or withdrew consent | Includes those who did not complete treatment and those lost to follow‐up | Includes change in treatment due to adverse events, loss to follow‐up, and other treatment changes | Includes those who withdrew consent during treatment and dropouts | Reported but disaggregated data for each group not available |
| Positive smear/ sputum culture at 2 months | Reported using LJ solid media (used in this review) and MGIT liquid media for all randomized participants excluding late screening failures | Reported using LJ solid media for all randomized participants excluding late screening failures | Reported but disaggregated data for moxifloxacin 4‐month and 6‐month treatment groups not available Data also not available for all participants from LJ media | Reported for 752 in the 4‐month and 759 in the 6‐month regimens (88% and 87% of those eligible, respectively) Culture using LJ solid media | Reported for 590 (94%) in the 4‐month and 151 (88%) in the 6‐month regimens |
| Acquired drug resistance | Reported | Reported | Reported | Not reported | Not reported |
| Treatment failure | Includes culture confirmed and not confirmed | Includes culture confirmed and unconfirmed | Culture confirmed | Includes culture confirmed failure | Not reported |
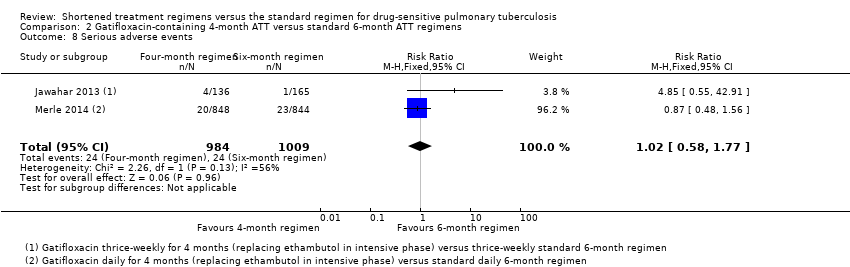
| Serious adverse events | Reported for all randomized participants excluding late screening failures. Grade 3 and 4 severity (DAIDS 2009) | Deduced from adverse events reported for all randomized participants excluding late screening failures. Not graded | Reported for all participants randomized who took 1 dose and assessed as severe or life‐threatening during and 2 weeks after treatment. grade 3 and 4 severity (DAIDS 2009) | Reported for 1692 (92%) of all randomized participants. grade 3 and 4 severity (DAIDS 2009) | Deduced from adverse events reported. Not graded |
| Other adverse events | Not reported | Reported | Not reported | QT prolongation Hyperglycaemic episodes | Reported |