Certolizumab pegol para inducir la remisión de la enfermedad de Crohn
Appendices
Appendix 1. Search strategies
MEDLINE (inception to date)
1. random$.tw.
2. factorial$.tw.
3. (crossover$ or cross over$ or cross‐over$).tw.
4. placebo$.tw.
5. single blind.mp.
6. double blind.mp.
7. triple blind.mp.
8. (singl$ adj blind$).tw.
9. (double$ adj blind$).tw.
10. (tripl$ adj blind$).tw.
11 assign$.tw.
12. allocat$.tw.
13. randomized controlled trial/
14. or/1‐13
15. exp Crohn disease/ or Crohn*.mp.
16. (inflammatory bowel disease* or IBD).mp.
17. 15 or 16
18. exp certolizumab pegol/
19. (CDP870 OR 'CDP 870' OR CDP‐870 OR 'certolizumab pegol' OR certolizumab OR cimzia).mp.
20. 18 or 19
21. 14 and 17 and 20
Embase (inception to date)
1. random$.tw.
2. factorial$.tw.
3. (crossover$ or cross over$ or cross‐over$).tw.
4. placebo$.tw.
5. single blind.mp.
6. double blind.mp.
7. triple blind.mp.
8. (singl$ adj blind$).tw.
9. (double$ adj blind$).tw.
10. (tripl$ adj blind$).tw.
11 assign$.tw.
12. allocat$.tw.
13. crossover procedure/
14. double blind procedure/
15. single blind procedure/
16. triple blind procedure/
17. randomized controlled trial/
18. or/1‐17
19. exp Crohn disease/ or Crohn*.mp.
20. (inflammatory bowel disease* or IBD).mp.
21. 19 or 20
22. exp certolizumab pegol/
23. (CDP870 OR 'CDP 870' OR CDP‐870 OR 'certolizumab pegol' OR certolizumab OR cimzia).mp.
24. 22 or 23
25. 18 and 21 and 24
CENTRAL (inception to date)
#1 MeSH descriptor: [Inflammatory bowel diseases] explode all trees
#2 MeSH descriptor: [Crohn Disease] explode all trees
#3 Crohn
#4 #1 or #2 or #3
#5 MeSH descriptor: [Certolizumab pegol] explode all trees
#6 CDP870 OR 'CDP 870' OR CDP‐870 OR 'certolizumab pegol' OR certolizumab OR cimzia
#7 #5 or #6
#8 #4 and #7
Cochrane IBD Group Specialized Register (inception to date)
#1 (CDP870 OR 'CDP 870' OR CDP‐870 OR 'certolizumab pegol' OR certolizumab OR cimzia).ti.
#2 Crohn.ti.
#3 1 and 2

Study flow diagram.

Risk of bias summary: review authors' judgements about each risk of bias item for each included study.

Risk of bias graph: review authors' judgements about each risk of bias item presented as percentages across all included studies.
Forest plot of comparison: 1 Certolizumab pegol versus placebo, outcome: 1.1 Clinical remission at week 8.

Forest plot of comparison: 1 Certolizumab pegol versus placebo, outcome: 1.2 Clinical response at week 8.

Forest plot of comparison: 1 Certolizumab pegol versus placebo, outcome: 1.6 Serious adverse events.

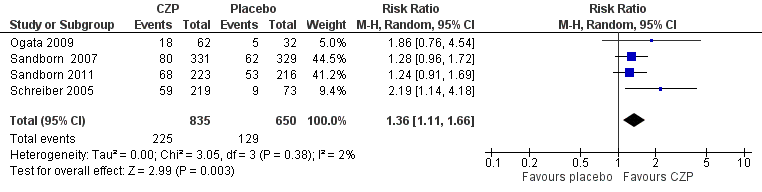
Comparison 1 Certolizumab pegol versus placebo, Outcome 1 Clinical remission at week 8.

Comparison 1 Certolizumab pegol versus placebo, Outcome 2 Clinical response at week 8.
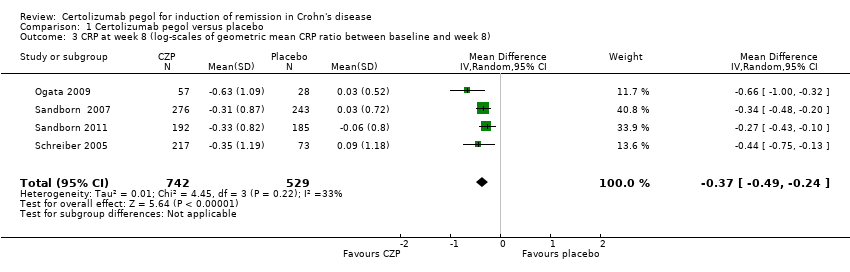
Comparison 1 Certolizumab pegol versus placebo, Outcome 3 CRP at week 8 (log‐scales of geometric mean CRP ratio between baseline and week 8).

Comparison 1 Certolizumab pegol versus placebo, Outcome 4 IBDQ total score at week 8 (mean change from baseline).
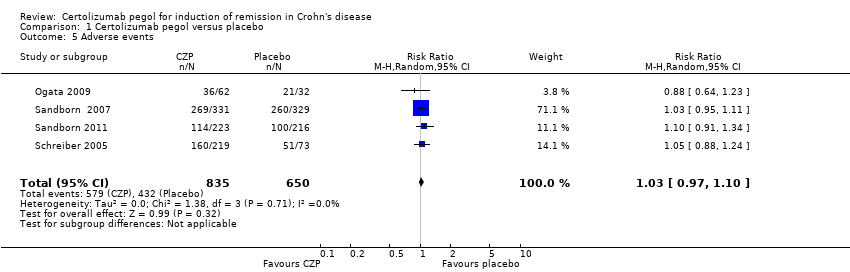
Comparison 1 Certolizumab pegol versus placebo, Outcome 5 Adverse events.
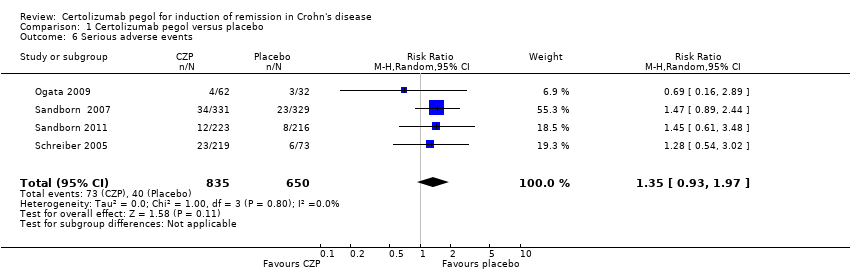
Comparison 1 Certolizumab pegol versus placebo, Outcome 6 Serious adverse events.

Comparison 1 Certolizumab pegol versus placebo, Outcome 7 Withdrawals due to adverse events.

Comparison 1 Certolizumab pegol versus placebo, Outcome 8 Clinical remission at week 8 (Subgroup analysis based on CZP doses).

Comparison 1 Certolizumab pegol versus placebo, Outcome 9 Clinical remission at week 8 (Subgroup analysis of no previous treatment with TNF‐α inhibitors).
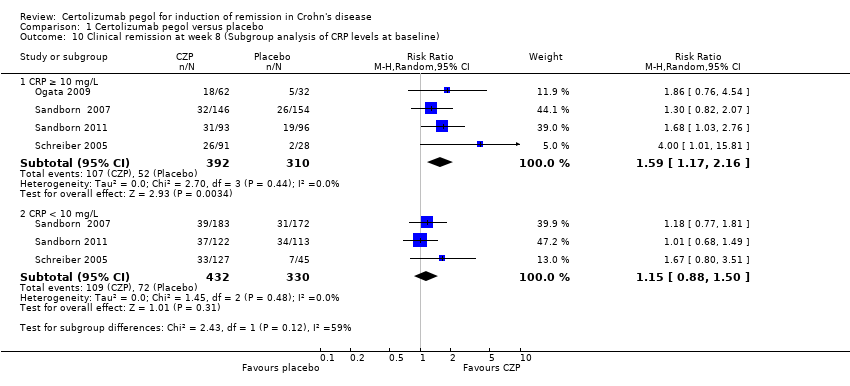
Comparison 1 Certolizumab pegol versus placebo, Outcome 10 Clinical remission at week 8 (Subgroup analysis of CRP levels at baseline).

Comparison 1 Certolizumab pegol versus placebo, Outcome 11 Clinical remission at week 8 (Sensitivity analysis of excluding studies with high risk of bias).

Comparison 1 Certolizumab pegol versus placebo, Outcome 12 Clinical remission at week 8 (sensitivity analysis of using available case data).
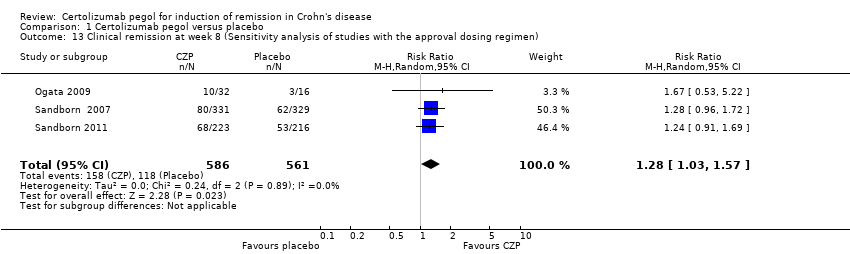
Comparison 1 Certolizumab pegol versus placebo, Outcome 13 Clinical remission at week 8 (Sensitivity analysis of studies with the approval dosing regimen).
| Certolizumab pegol compared to placebo for induction of remission in Crohn's disease | ||||||
| Patient or population: Patients with active Crohn's disease Settings: Outpatient Intervention: Certolizumab pegol Comparison: Placebo | ||||||
| Outcomes | Illustrative comparative risks* (95% CI) | Relative effect | No of Participants | Quality of the evidence | Comments | |
| Assumed risk | Corresponding risk | |||||
| Control | Certolizummab pegol | |||||
| Clinical remission Follow‐up: 8 weeks | 198 per 1000 | 270 per 1000 (220 to 329) | RR 1.36 (1.11 to 1.66) | 1485 | ⊕⊕⊕⊝ | Certolizumab pegol was shown to be superior to placebo regarding clinical remission at week 8 Clinical remission was defined as a CDAI < 150 |
| Clinical response Follow‐up: 8 weeks | 309 per 1000 | 399 per 1000 (337 to 473) | RR 1.29 (1.09 to 1.53) | 1485 (4 studies) | ⊕⊕⊕⊝ | Clinical response was defined as CDAI reduction ≥ 100 from baseline |
| Serious adverse events Follow‐up: 8 weeks | 62 per 1000 | 83 per 1000 (57 to 121) | RR 1.35 (0.93 to 1.97) | 1485 (4 studies) | ⊕⊕⊕⊝ | Reported serious adverse events included worsening Crohn's disease, infections, and malignancy |
| *The basis for the assumed risk (e.g. the median control group risk across studies) is provided in footnotes. The corresponding risk (and its 95% confidence interval) is based on the assumed risk in the comparison group and the relative effect of the intervention (and its 95% CI). | ||||||
| GRADE Working Group grades of evidence | ||||||
| 1 Downgraded one level due to high risk of bias in one study in the pooled analysis 2 Downgraded one level due to imprecision (113 events) | ||||||
| Outcome or subgroup title | No. of studies | No. of participants | Statistical method | Effect size |
| 1 Clinical remission at week 8 Show forest plot | 4 | 1485 | Risk Ratio (M‐H, Random, 95% CI) | 1.36 [1.11, 1.66] |
| 2 Clinical response at week 8 Show forest plot | 4 | 1485 | Risk Ratio (M‐H, Random, 95% CI) | 1.29 [1.09, 1.53] |
| 3 CRP at week 8 (log‐scales of geometric mean CRP ratio between baseline and week 8) Show forest plot | 4 | 1271 | Mean Difference (IV, Random, 95% CI) | ‐0.37 [‐0.49, ‐0.24] |
| 4 IBDQ total score at week 8 (mean change from baseline) Show forest plot | 4 | 1315 | Mean Difference (IV, Random, 95% CI) | 2.12 [‐1.27, 5.50] |
| 5 Adverse events Show forest plot | 4 | 1485 | Risk Ratio (M‐H, Random, 95% CI) | 1.03 [0.97, 1.10] |
| 6 Serious adverse events Show forest plot | 4 | 1485 | Risk Ratio (M‐H, Random, 95% CI) | 1.35 [0.93, 1.97] |
| 7 Withdrawals due to adverse events Show forest plot | 4 | 1485 | Risk Ratio (M‐H, Random, 95% CI) | 1.01 [0.57, 1.78] |
| 8 Clinical remission at week 8 (Subgroup analysis based on CZP doses) Show forest plot | 4 | Risk Ratio (M‐H, Random, 95% CI) | Subtotals only | |
| 8.1 Certolizumab pegol 100mg | 1 | 99 | Risk Ratio (M‐H, Random, 95% CI) | 2.48 [0.81, 7.58] |
| 8.2 Certolizumab pegol 200mg | 2 | 142 | Risk Ratio (M‐H, Random, 95% CI) | 1.84 [0.75, 4.50] |
| 8.3 Certolizumab pegol 400mg | 4 | 1244 | Risk Ratio (M‐H, Random, 95% CI) | 1.30 [1.06, 1.60] |
| 9 Clinical remission at week 8 (Subgroup analysis of no previous treatment with TNF‐α inhibitors) Show forest plot | 1 | Risk Ratio (M‐H, Random, 95% CI) | Totals not selected | |
| 10 Clinical remission at week 8 (Subgroup analysis of CRP levels at baseline) Show forest plot | 4 | Risk Ratio (M‐H, Random, 95% CI) | Subtotals only | |
| 10.1 CRP ≥ 10 mg/L | 4 | 702 | Risk Ratio (M‐H, Random, 95% CI) | 1.59 [1.17, 2.16] |
| 10.2 CRP < 10 mg/L | 3 | 762 | Risk Ratio (M‐H, Random, 95% CI) | 1.15 [0.88, 1.50] |
| 11 Clinical remission at week 8 (Sensitivity analysis of excluding studies with high risk of bias) Show forest plot | 3 | 1193 | Risk Ratio (M‐H, Random, 95% CI) | 1.29 [1.05, 1.59] |
| 12 Clinical remission at week 8 (sensitivity analysis of using available case data) Show forest plot | 4 | 1463 | Risk Ratio (M‐H, Random, 95% CI) | 1.36 [1.11, 1.67] |
| 13 Clinical remission at week 8 (Sensitivity analysis of studies with the approval dosing regimen) Show forest plot | 3 | 1147 | Risk Ratio (M‐H, Random, 95% CI) | 1.28 [1.03, 1.57] |