Programas de pausas en el trabajo para la prevención de los síntomas y trastornos musculoesqueléticos en trabajadores sanos
Información
- DOI:
- https://doi.org/10.1002/14651858.CD012886.pub2Copiar DOI

- Base de datos:
-
- Cochrane Database of Systematic Reviews
- Versión publicada:
-
- 23 julio 2019see what's new
- Tipo:
-
- Intervention
- Etapa:
-
- Review
- Grupo Editorial Cochrane:
-
Grupo Cochrane de Salud laboral
- Copyright:
-
- Copyright © 2019 The Cochrane Collaboration. Published by John Wiley & Sons, Ltd.
Cifras del artículo
Altmetric:
Citado por:
Autores
Contributions of authors
Conceiving the protocol: TL
Designing the protocol: TL, CM, MR, BS
Coordinating the protocol: TL, CM, BS
Designing search strategies: TL, BS
Writing the protocol: TL, CM, MR, BS
Providing general advice on the protocol: CM
Selection of studies: TL, BS
Data extraction: TL, BS
Data analysis: TL
Writing the review: TL, CM, MR, BS
Sources of support
Internal sources
-
University Hospital Tübingen, Eberhard Karls University of Tübingen, Germany.
Funding for TL, MR, and BS
-
Australia’s National Health and Medical Research Council, Australia.
Funding for the fellowship of CM.
External sources
-
No sources of support supplied
Declarations of interest
Tessy Luger: None known
Christopher Maher: I have received competitive grants from government agencies and industry to support my research. As an invited speaker at conferences, I have had my expenses covered and also received small gifts such as a box of chocolates or a bottle of wine. I have received honoraria for marking theses, reviewing grants and preparing talks.
Monika A. Rieger: Our Institute receives an unrestricted grant by Südwestmetall (employers' association of the metal and electric industry Baden‐Württemberg) which covered about half of the costs of the Institute for several years. The cooperation treaty between Südwestmetall, University of Tübingen, Medical Faculty of the University of Tübingen, University Hospital of Tübingen rules all aspects which are necessary to secure the 'unrestrictedness', and a board of independent trustees monitors this regulation.
Benjamin Steinhilber: None known
Acknowledgements
Many thanks goes to Jani Ruotsalainen, Managing Editor, and Jos Verbeek, Coordinating Editor, from the Cochrane Work Review Group, for their help in all stages of both the protocol and the review. In addition, we would like to thank external peer referees Päivi Leino‐Arjas, Renea Johnston, and Esa‐Pekka Takala for their comments on the protocol, and Gillian Gummer and Anne Lethaby for copy editing the text of the protocol and the review, respectively. We would like to thank librarians Heikki Laitinen, Kaisa Hartikainen, and Diane Mader for their help on designing the final search strategies and translating the primary MEDLINE search strategy into those compliant for the other databases. We would like to thank Heikki Laitinen, René Spijker, Pieter Coenen, and Daphne Geerse for helping us performing two of the searches in databases we did not have access to. We would like to thank librarian Susanne Wolf for her help in providing us with all full texts of potentially eligible studies. We would like to thank external peer referees Donna Urquhart, Päivi Leino‐Arjas, and Renea Johnston for their comments on the review.
Version history
| Published | Title | Stage | Authors | Version |
| 2019 Jul 23 | Work‐break schedules for preventing musculoskeletal symptoms and disorders in healthy workers | Review | Tessy Luger, Christopher G Maher, Monika A Rieger, Benjamin Steinhilber | |
| 2017 Nov 28 | Work‐break schedules for preventing musculoskeletal disorders in workers | Protocol | Tessy Luger, Christopher G Maher, Monika A Rieger, Benjamin Steinhilber | |
Differences between protocol and review
The objective and title were modified, including also symptoms besides disorders, since symptoms are recognised as a precursor of developing disorders, including self‐reported musculoskeletal pain, discomfort and fatigue.
The title and objectives were modified, so that it is clear that only healthy workers were considered, since the aim is primary prevention. In addition, we provided a definition of a healthy worker in the section on types of participants.
The work‐break intervention had to happen at work, meaning that our definition of a work break did not include a free evening after work, a weekend or a holiday. In the section on types of interventions, we added that the work‐break intervention had to happen at work and during working hours.
In the section on types of outcome measures, we modified the first two primary outcome categories. Originally, they were called participant‐reported musculoskeletal pain and participant‐reported musculoskeletal discomfort or fatigue. They have been modified into newly diagnosed musculoskeletal disorders and participant‐reported musculoskeletal symptoms, including pain, discomfort and fatigue. This categorisation is better, since we are focussed on primary prevention. Although none of the included studies lasted long enough to report on diagnosed disorders, all of them reported either pain, discomfort or fatigue as a symptom which is recognised as preceding the actual development of disorders.
We performed sensitivity analyses to check whether combining the outcomes participant‐reported musculoskeletal pain, participant‐reported musculoskeletal discomfort, and participant‐reported musculoskeletal fatigue was justified. Similary, we performed sensitivity analyses to check whether combining the different outcome measures of productivity and work performance was justified. We added this information in the section on sensitivity analyses and reported the results in the sections where the effects of interventions were described. In addition, the sensitivity analyses are discussed in the section on potential biases in the review process.
The planned number of comparison categories in the protocol was three; however, after collecting the studies, we decided to create five comparisons in the review, which belonged to one of the three main categories of comparisons: frequency, duration or type of work breaks.
Keywords
MeSH
Medical Subject Headings (MeSH) Keywords
Medical Subject Headings Check Words
Adult; Humans;
PICO
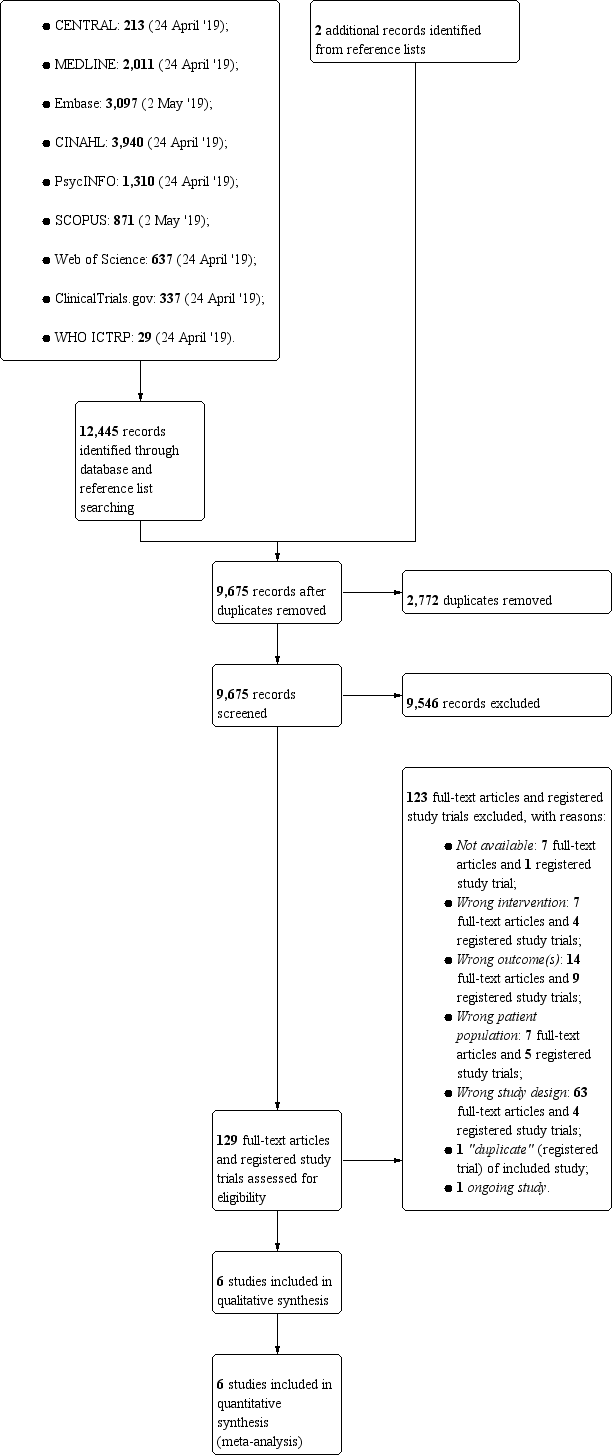
Study flow diagram.

Risk of bias graph: review authors' judgements about each risk of bias item presented as percentages across all included studies.
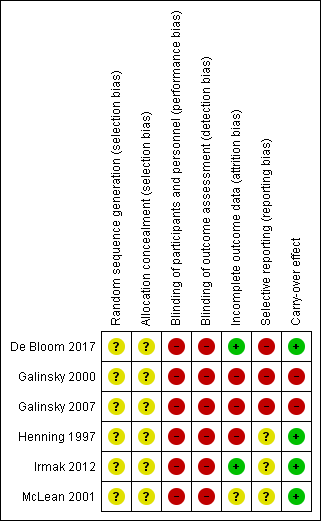
Risk of bias summary: review authors' judgements about each risk of bias item for each included study.

Comparison 1 Additional work breaks versus no additional work breaks, Outcome 1 Participant‐reported musculoskeletal pain, discomfort or fatigue (follow‐up 4 or 10 weeks).

Comparison 1 Additional work breaks versus no additional work breaks, Outcome 2 Productivity or work performance (follow‐up 4 or 10 weeks).
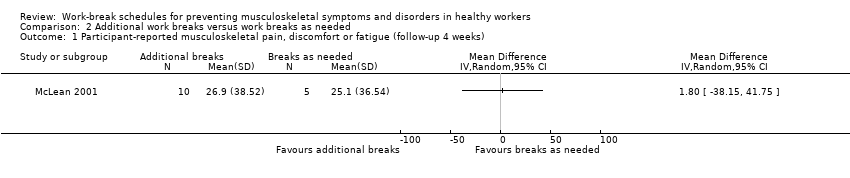
Comparison 2 Additional work breaks versus work breaks as needed, Outcome 1 Participant‐reported musculoskeletal pain, discomfort or fatigue (follow‐up 4 weeks).

Comparison 2 Additional work breaks versus work breaks as needed, Outcome 2 Productivity or work performance (follow‐up 4 weeks).

Comparison 3 Additional higher frequency work breaks versus additional lower frequency work breaks, Outcome 1 Participant‐reported musculoskeletal pain, discomfort or fatigue (follow‐up 4 weeks).

Comparison 3 Additional higher frequency work breaks versus additional lower frequency work breaks, Outcome 2 Productivity or work performance (follow‐up 4 weeks).

Comparison 4 Active work breaks versus passive work breaks, Outcome 1 Participant‐reported musculoskeletal pain, discomfort or fatigue (follow‐up 5 weeks).

Comparison 5 Relaxation work breaks versus physical work breaks, Outcome 1 Participant‐reported musculoskeletal pain, discomfort or fatigue (follow‐up 5 weeks).
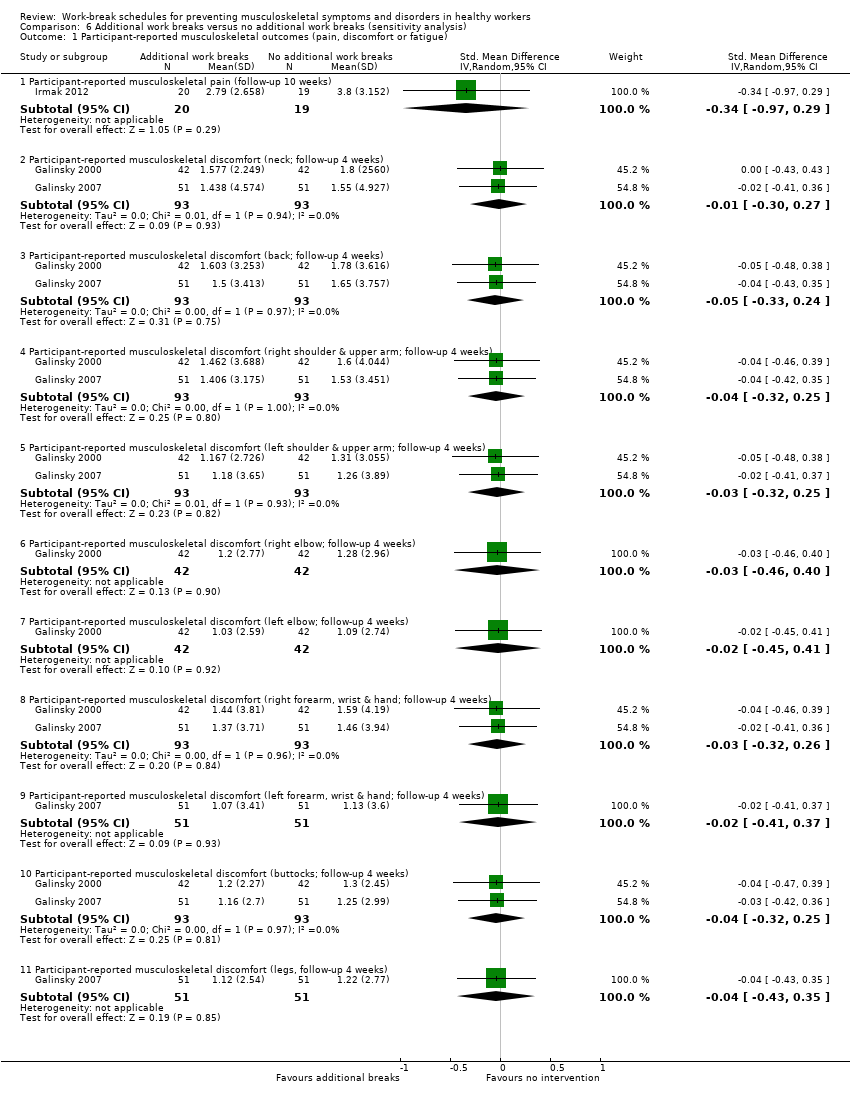
Comparison 6 Additional work breaks versus no additional work breaks (sensitivity analysis), Outcome 1 Participant‐reported musculoskeletal outcomes (pain, discomfort or fatigue).

Comparison 6 Additional work breaks versus no additional work breaks (sensitivity analysis), Outcome 2 Productivity or work performance.
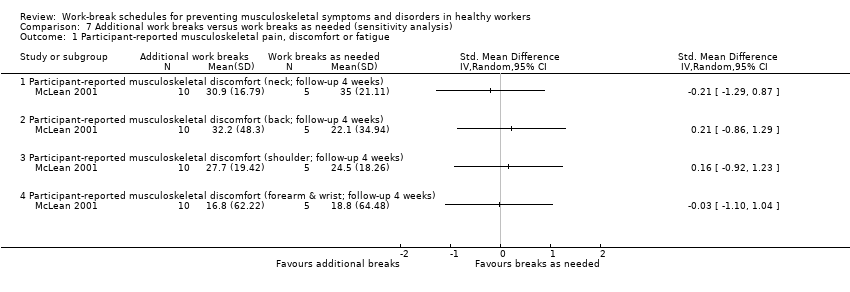
Comparison 7 Additional work breaks versus work breaks as needed (sensitivity analysis), Outcome 1 Participant‐reported musculoskeletal pain, discomfort or fatigue.

Comparison 8 Additional higher frequency work breaks versus additional lower frequency work breaks (sensitivity analysis), Outcome 1 Participant‐reported musculoskeletal pain, discomfort or fatigue.
| Additional work breaks compared to no additional work breaks for preventing musculoskeletal symptoms and disorders in workers | ||||||
| Patient or population: office workers | ||||||
| Outcomes | Anticipated absolute effects* (95% CI) | Relative effect | № of participants | Certainty of the evidence | Comments | |
| Assumed risk | Corresponding risk | |||||
| No additional work breaks | Additional work breaks | |||||
| Participant‐reported musculoskeletal pain, discomfort or fatigue Method: 0‐100 mm VAS or 1‐5 NRS Follow‐up: 4 or 10 weeks | The mean participant‐reported musculoskeletal pain, discomfort or fatigue (4 or 10 weeks) ranged across control groups from 1.38 ‐ 3.801 | The mean after shift/after intervention participant‐reported musculoskeletal pain, discomfort or fatigue (4 or 10 weeks) 0.08 standard deviations lower (0.35 lower to 0.18 higher) | ‐ | 225 | ⊕⊕⊝⊝ | |
| Productivity or work performance Method: total number of documents entered per day, or keystrokes per hour, or WRFQ Follow‐up: 4 or 10 weeks | The mean productivity or work performance (4 or 10 weeks) ranged across control groups from ‐4.25 ‐ 209.092 | The mean after shift/after intervention productivity or work performance (4 or 10 weeks) was 0.07 standard deviations lower (0.33 lower to 0.19 higher) | ‐ | 225 | ⊕⊝⊝⊝ | |
| *The risk in the intervention group (and its 95% confidence interval) is based on the assumed risk in the comparison group and the relative effect of the intervention (and its 95% CI). | ||||||
| GRADE Working Group grades of evidence | ||||||
| NRS: Numeric Rating Scale. 1 Data include estimates based on Table 2 and Figure 2 in Galinsky 2000 and Figure 1 in Galinsky 2007. 2 Data include estimates based on Section 3.3 in Galinsky 2000 and Section Data Entry Performance > Rest break schedule in Galinsky 2007. 3 Downgraded one level because of a potential risk of bias. 4 Downgraded one level because the total number of participants was less than 300 (small sample size for a continuous variable). 5 Downgraded one level because of surrogate outcome that is not important in itself but assumed indirectly important for the intervention's evaluation. | ||||||
| Additional work breaks compared to work breaks as needed for preventing musculoskeletal symptoms and disorders in workers | ||||||
| Patient or population: office workers | ||||||
| Outcomes | Anticipated absolute effects* (95% CI) | Relative effect | № of participants | Certainty of the evidence | Comments | |
| Assumed risk | Corresponding risk | |||||
| Work breaks as needed | Additional work breaks | |||||
| Participant‐reported musculoskeletal pain, discomfort or fatigue Method: 0‐100 mm VAS Follow‐up: 4 weeks | The mean participant‐reported musculoskeletal pain, discomfort or fatigue (4 weeks) was 25.10 | The mean after intervention participant‐reported musculoskeletal pain, discomfort or fatigue (4 weeks) in the intervention group was 1.80 higher (38.15 lower to 41.75 higher) | ‐ | 15 | ⊕⊝⊝⊝ | |
| Productivity or work performance Method: number of words typed per 3 hours Follow‐up: 4 weeks | The mean productivity or work performance (4 weeks) was ‐317.00 compared to no breaks | The mean after intervention productivity or work performance (4 weeks) in the intervention group was 542.50 higher (177.22 higher to 907.78 higher) | ‐ | 15 | ⊕⊝⊝⊝ | |
| *The risk in the intervention group (and its 95% confidence interval) is based on the assumed risk in the comparison group and the relative effect of the intervention (and its 95% CI). | ||||||
| GRADE Working Group grades of evidence | ||||||
| VAS: Visual Analogue Scale. 2 Downgraded two levels because the total number of participants was less than 50 (small sample size for a continuous variable) and because of low precision of the effect estimate (0.5 was included in the 95% CI of the SMD). 3 Downgraded one level because of surrogate outcome that was not important in itself but assumed indirectly important for the intervention's evaluation. | ||||||
| Additional higher frequency work breaks compared to additional lower frequency work breaks for preventing musculoskeletal symptoms and disorders in workers | ||||||
| Patient or population: office workers | ||||||
| Outcomes | Anticipated absolute effects* (95% CI) | Relative effect | № of participants | Certainty of the evidence | Comments | |
| Assumed risk | Corresponding risk | |||||
| Additional lower frequency work breaks | Additional higher frequency work breaks | |||||
| Participant‐reported musculoskeletal pain, discomfort or fatigue Method: 0‐100 mm VAS Follow‐up: 4 weeks | The mean participant‐reported musculoskeletal pain, discomfort or fatigue (4 weeks) was 21.08 | The mean after intervention participant‐reported musculoskeletal pain, discomfort or fatigue (4 weeks) was 11.65 higher (41.07 lower to 64.37 higher) | ‐ | 10 | ⊕⊝⊝⊝ | |
| Productivity or work performance Method: number of words typed per 3 hours Follow‐up: 4 weeks | The mean productivity or work performance (4 weeks) was 267.00 compared to no breaks | The mean after intervention productivity or work performance (4 weeks) in the intervention group was 83.00 lower (305.27 lower to 139.27 higher) | ‐ | 10 | ⊕⊝⊝⊝ | |
| *The risk in the intervention group (and its 95% confidence interval) is based on the assumed risk in the comparison group and the relative effect of the intervention (and its 95% CI). | ||||||
| GRADE Working Group grades of evidence | ||||||
| VAS: Visual Analogue Scale. 2 Downgraded two levels because the total number of participants was less than 25 (small sample size for a continuous variable) and because of low precision of the effect estimate (0.5 was included in the 95% CI of the SMD). 3 Downgraded one level because of surrogate outcome that was not important in itself but assumed indirectly important for the intervention's evaluation. | ||||||
| Active work breaks compared to passive work breaks for preventing musculoskeletal symptoms and disorders in workers | ||||||
| Patient or population: office workers | ||||||
| Outcomes | Anticipated absolute effects* (95% CI) | Relative effect | № of participants | Certainty of the evidence | Comments | |
| Assumed risk | Corresponding risk | |||||
| Passive work breaks | Active work breaks | |||||
| Participant‐reported musculoskeletal pain, discomfort or fatigue Method: 1‐7 NRS Follow‐up: 5 weeks | The mean participant‐reported musculoskeletal pain, discomfort or fatigue (5 weeks) was 4.15 | The mean difference after intervention participant‐reported musculoskeletal pain, discomfort or fatigue (5 weeks) in the intervention group was 0.17 lower (0.71 lower to 0.37 higher) | ‐ | 153 | ⊕⊕⊝⊝ | |
| *The risk in the intervention group (and its 95% confidence interval) is based on the assumed risk in the comparison group and the relative effect of the intervention (and its 95% CI). | ||||||
| GRADE Working Group grades of evidence | ||||||
| NRS: Numeric Rating Scale. 2 Downgraded one level because the total number of participants was less than 200 (small sample size for a continuous variable). | ||||||
| Relaxation work breaks compared to physical work breaks for preventing musculoskeletal symptoms and disorders in workers | ||||||
| Patient or population: office workers | ||||||
| Outcomes | Anticipated absolute effects* (95% CI) | Relative effect | № of participants | Certainty of the evidence | Comments | |
| Assumed risk | Corresponding risk | |||||
| Physical work breaks | Relaxation work breaks | |||||
| Participant‐reported musculoskeletal pain ,discomfort or fatigue Method: 1‐7 NRS Follow‐up: 5 weeks | The mean participant‐reported musculoskeletal pain, discomfort or fatigue (5 weeks) was 3.88 | The mean difference after intervention participant‐reported musculoskeletal pain, discomfort or fatigue (5 weeks) in the intervention group was 0.20 higher (0.43 lower to 0.82 higher) | ‐ | 97 | ⊕⊕⊝⊝ | |
| *The risk in the intervention group (and its 95% confidence interval) is based on the assumed risk in the comparison group and the relative effect of the intervention (and its 95% CI). | ||||||
| GRADE Working Group grades of evidence | ||||||
| NRS: Numeric Rating Scale. 2 Downgraded one level because the total number of participants was less than 100 (small sample size for a continuous variable). | ||||||
| Outcome or subgroup title | No. of studies | No. of participants | Statistical method | Effect size |
| 1 Participant‐reported musculoskeletal pain, discomfort or fatigue (follow‐up 4 or 10 weeks) Show forest plot | 3 | 225 | Std. Mean Difference (IV, Random, 95% CI) | ‐0.08 [‐0.35, 0.18] |
| 2 Productivity or work performance (follow‐up 4 or 10 weeks) Show forest plot | 3 | 225 | Std. Mean Difference (IV, Random, 95% CI) | ‐0.07 [‐0.33, 0.19] |
| Outcome or subgroup title | No. of studies | No. of participants | Statistical method | Effect size |
| 1 Participant‐reported musculoskeletal pain, discomfort or fatigue (follow‐up 4 weeks) Show forest plot | 1 | Mean Difference (IV, Random, 95% CI) | Totals not selected | |
| 2 Productivity or work performance (follow‐up 4 weeks) Show forest plot | 1 | Mean Difference (IV, Random, 95% CI) | Totals not selected | |
| Outcome or subgroup title | No. of studies | No. of participants | Statistical method | Effect size |
| 1 Participant‐reported musculoskeletal pain, discomfort or fatigue (follow‐up 5 weeks) Show forest plot | 1 | Mean Difference (IV, Random, 95% CI) | Totals not selected | |
| Outcome or subgroup title | No. of studies | No. of participants | Statistical method | Effect size |
| 1 Participant‐reported musculoskeletal pain, discomfort or fatigue (follow‐up 5 weeks) Show forest plot | 1 | Mean Difference (IV, Random, 95% CI) | Totals not selected | |
| Outcome or subgroup title | No. of studies | No. of participants | Statistical method | Effect size |
| 1 Participant‐reported musculoskeletal outcomes (pain, discomfort or fatigue) Show forest plot | 3 | Std. Mean Difference (IV, Random, 95% CI) | Subtotals only | |
| 1.1 Participant‐reported musculoskeletal pain (follow‐up 10 weeks) | 1 | 39 | Std. Mean Difference (IV, Random, 95% CI) | ‐0.34 [‐0.97, 0.29] |
| 1.2 Participant‐reported musculoskeletal discomfort (neck; follow‐up 4 weeks) | 2 | 186 | Std. Mean Difference (IV, Random, 95% CI) | ‐0.01 [‐0.30, 0.27] |
| 1.3 Participant‐reported musculoskeletal discomfort (back; follow‐up 4 weeks) | 2 | 186 | Std. Mean Difference (IV, Random, 95% CI) | ‐0.05 [‐0.33, 0.24] |
| 1.4 Participant‐reported musculoskeletal discomfort (right shoulder & upper arm; follow‐up 4 weeks) | 2 | 186 | Std. Mean Difference (IV, Random, 95% CI) | ‐0.04 [‐0.32, 0.25] |
| 1.5 Participant‐reported musculoskeletal discomfort (left shoulder & upper arm; follow‐up 4 weeks) | 2 | 186 | Std. Mean Difference (IV, Random, 95% CI) | ‐0.03 [‐0.32, 0.25] |
| 1.6 Participant‐reported musculoskeletal discomfort (right elbow; follow‐up 4 weeks) | 1 | 84 | Std. Mean Difference (IV, Random, 95% CI) | ‐0.03 [‐0.46, 0.40] |
| 1.7 Participant‐reported musculoskeletal discomfort (left elbow; follow‐up 4 weeks) | 1 | 84 | Std. Mean Difference (IV, Random, 95% CI) | ‐0.02 [‐0.45, 0.41] |
| 1.8 Participant‐reported musculoskeletal discomfort (right forearm, wrist & hand; follow‐up 4 weeks) | 2 | 186 | Std. Mean Difference (IV, Random, 95% CI) | ‐0.03 [‐0.32, 0.26] |
| 1.9 Participant‐reported musculoskeletal discomfort (left forearm, wrist & hand; follow‐up 4 weeks) | 1 | 102 | Std. Mean Difference (IV, Random, 95% CI) | ‐0.02 [‐0.41, 0.37] |
| 1.10 Participant‐reported musculoskeletal discomfort (buttocks; follow‐up 4 weeks) | 2 | 186 | Std. Mean Difference (IV, Random, 95% CI) | ‐0.04 [‐0.32, 0.25] |
| 1.11 Participant‐reported musculoskeletal discomfort (legs, follow‐up 4 weeks) | 1 | 102 | Std. Mean Difference (IV, Random, 95% CI) | ‐0.04 [‐0.43, 0.35] |
| 2 Productivity or work performance Show forest plot | 3 | Std. Mean Difference (IV, Random, 95% CI) | Subtotals only | |
| 2.1 Productivity or work performance (WRFQ, follow‐up 10 weeks) | 1 | 39 | Std. Mean Difference (IV, Random, 95% CI) | 0.39 [‐0.24, 1.03] |
| 2.2 Productivity or work performance (keystrokes per hour; follow‐up 4 weeks) | 2 | 186 | Std. Mean Difference (IV, Random, 95% CI) | 0.01 [‐0.27, 0.30] |
| 2.3 Productivity or work performance (entered documents per day; follow‐up 4 weeks) | 2 | 186 | Std. Mean Difference (IV, Random, 95% CI) | ‐0.01 [‐0.29, 0.28] |
| Outcome or subgroup title | No. of studies | No. of participants | Statistical method | Effect size |
| 1 Participant‐reported musculoskeletal pain, discomfort or fatigue Show forest plot | 1 | Std. Mean Difference (IV, Random, 95% CI) | Totals not selected | |
| 1.1 Participant‐reported musculoskeletal discomfort (neck; follow‐up 4 weeks) | 1 | Std. Mean Difference (IV, Random, 95% CI) | 0.0 [0.0, 0.0] | |
| 1.2 Participant‐reported musculoskeletal discomfort (back; follow‐up 4 weeks) | 1 | Std. Mean Difference (IV, Random, 95% CI) | 0.0 [0.0, 0.0] | |
| 1.3 Participant‐reported musculoskeletal discomfort (shoulder; follow‐up 4 weeks) | 1 | Std. Mean Difference (IV, Random, 95% CI) | 0.0 [0.0, 0.0] | |
| 1.4 Participant‐reported musculoskeletal discomfort (forearm & wrist; follow‐up 4 weeks) | 1 | Std. Mean Difference (IV, Random, 95% CI) | 0.0 [0.0, 0.0] | |