Programas de pausas en el trabajo para la prevención de los síntomas y trastornos musculoesqueléticos en trabajadores sanos
Resumen
Antecedentes
Los trastornos musculoesqueléticos relacionados con el trabajo son el grupo de trastornos musculoesqueléticos más comunes relacionados con la licencia por enfermedad en todo el mundo. Los trastornos musculoesqueléticos representan entre el 21% y el 28% de los días de ausentismo laboral en 2017/2018 en los Países Bajos, Alemania y el Reino Unido. Existen varias intervenciones que pueden ser efectivas para abordar la alta prevalencia de trastornos musculoesqueléticos relacionados con el trabajo en los trabajadores, como las intervenciones físicas, cognitivas y organizativas. Esta revisión se centra en las pausas en el trabajo como medida de prevención primaria, que son un tipo de intervención organizativa.
Objetivos
Comparar la efectividad de los diferentes programas de pausas en el trabajo para la prevención de los síntomas y trastornos musculoesqueléticos relacionados con el trabajo en trabajadores sanos, en comparación con los programas de pausas en el trabajo convencionales o alternativos.
Métodos de búsqueda
Se hicieron búsquedas en el Registro Cochrane Central de Ensayos Controlados (CENTRAL), MEDLINE, Embase, CINAHL, PsycINFO, SCOPUS, Web of Science, ClinicalTrials.gov y en la Plataforma de Registro Internacional de Ensayos Clínicos de la Organización Mundial de la Salud hasta abril/mayo 2019. Además, se realizaron búsquedas en las referencias de los estudios incluidos y de las revisiones de la literatura pertinente.
Criterios de selección
Se incluyeron ensayos controlados aleatorios (ECA) de intervenciones de pausas en el trabajo para la prevención de los síntomas y trastornos musculoesqueléticos relacionados con el trabajo en los trabajadores. Los estudios eran aptos para la inclusión cuando intervenían en la frecuencia, la duración y el tipo de pausas en el trabajo, en comparación con una intervención convencional o una intervención alternativa de pausas en el trabajo. Se incluyeron solo aquellos estudios en que la población investigada incluía a trabajadores adultos sanos, que estaban libres de afecciones musculoesqueléticas durante la inscripción en el estudio, sin restricciones de sexo ni ocupación. Los resultados primarios fueron los trastornos musculoesqueléticos de diagnóstico reciente, el dolor musculoesquelético, el malestar o la fatiga informados por el paciente y la productividad o el rendimiento laboral. Se consideraron los cambios en la carga de trabajo como resultados secundarios.
Obtención y análisis de los datos
Dos autores de la revisión examinaron de forma independiente los títulos, los resúmenes y los textos completos para determinar la elegibilidad de los estudios, extrajeron los datos y evaluaron el riesgo de sesgo. Cuando fue necesario, se estableció contacto con los autores para solicitar datos adicionales. Cuando fue posible, se realizaron metanálisis y se evaluó la calidad general de la evidencia para cada resultado de cada comparación mediante los cinco criterios GRADE.
Resultados principales
Se incluyeron seis estudios (373 trabajadores), cuatro ECA paralelos, un ECA cruzado (cross‐over) y un ECA combinado paralelo más cruzado (cross‐over). Al menos 295 de los empleados eran mujeres y al menos 39 hombres; no se especificó el sexo de los 39 empleados restantes en el ensayo del estudio. Los estudios investigaron diferentes frecuencias de pausas en el trabajo (cinco estudios) y diferentes tipos de pausas en el trabajo (dos estudios). Ninguno de los estudios investigó diferentes duraciones de las pausas en el trabajo. Se consideró que todos los estudios presentaban un riesgo de sesgo alto. La calidad de la evidencia para los resultados primarios de fatiga, molestias y dolor musculoesquelético informados por el participante fue baja; la calidad de la evidencia para los resultados primarios de productividad y rendimiento laboral fue muy baja. Los estudios se realizaron en Europa o América del Norte, y ninguno en países de ingresos bajos o medios. Un estudio no pudo incluirse en los análisis de los datos, porque no se han informado resultados detallados.
Cambios en la frecuencia de las pausas en el trabajo
Existe evidencia de calidad baja de que las pausas en el trabajo adicionales pueden no tener un efecto considerable sobre el dolor musculoesquelético, el malestar ni la fatiga, en comparación con ninguna pausa de trabajo adicional (diferencia de medias estandarizada [DME] ‐0,08; IC del 95%: ‐0,35 a 0,18; tres estudios; 225 participantes). Las pausas adicionales pueden no tener un efecto positivo sobre la productividad o el rendimiento laboral, en comparación con ninguna pausa adicional (DME ‐0,07; IC del 95%: ‐0,33 a 0,19; tres estudios; 225 participantes; evidencia de calidad muy baja).
Se encontró evidencia de calidad baja de que las pausas en el trabajo adicionales pueden no tener un efecto considerable sobre el dolor musculoesquelético, el malestar o la fatiga informadas por los participantes (DM 1,80 en una escala de EAV de 100 mm; IC del 95%: ‐41,07 a 64,37; un estudio; 15 participantes), cuando se comparan con las pausas en el trabajo según necesidad (es decir, las pausas en el trabajo tomadas a discreción). Existe evidencia de calidad muy baja de que las pausas en el trabajo adicionales pueden tener un efecto positivo sobre la productividad o el rendimiento laboral, en comparación con las pausas en el trabajo según necesidad (DM 542,5 número de palabras escritas por sesión de registro de 3 horas; IC del 95%: 177,22 a 907,78; un estudio; 15 participantes).
Las pausas en el trabajo adicionales de mayor frecuencia pueden no tener un efecto considerable sobre el dolor, el malestar o la fatiga musculoesquelética informada por los participantes (DM 11,65 en una escala de EAV de 100 mm; IC del 95%: ‐41,07 a 64,37; un estudio; diez participantes; evidencia de calidad baja), en comparación con las pausas en el trabajo adicionales de menor frecuencia. Se encontró evidencia de calidad muy baja de que las pausas en el trabajo adicionales de mayor frecuencia pueden no tener un efecto considerable sobre la productividad o el rendimiento laboral (DM ‐83,00 número de palabras escritas por sesión de registro de tres horas; IC del 95%: ‐305,27 a 139,27; un estudio; 10 participantes), en comparación con las pausas en el trabajo adicionales de menor frecuencia.
Cambios en la duración de las pausas en el trabajo
No se identificaron ensayos que evaluaran el efecto de las diferentes duraciones de las pausas en el trabajo.
Cambios en la clase de pausa de trabajo
Se encontró evidencia de calidad baja de que las pausas activas pueden no tener un efecto positivo considerable sobre el dolor musculoesquelético, el malestar y la fatiga informados por los participantes (DM ‐0,17 en una escala de 1 a 7 NRS; IC del 95%: ‐0,71 a 0,37; un estudio; 153 participantes), en comparación con las pausas en el trabajo pasivas.
Las pausas en el trabajo de relajación pueden no tener un efecto significativo sobre el dolor musculoesquelético, el malestar ni la fatiga informados por los participantes, en comparación con las pausas físicas (DM 0,20 en una escala de 1 a 7 NRS; IC del 95%: ‐0,43 a 0,82; un estudio; 97 participantes; evidencia de calidad baja).
Conclusiones de los autores
Se encontró evidencia de calidad baja de que las diferentes frecuencias de pausas en el trabajo pueden no tener efecto sobre el dolor, el malestar y la fatiga musculoesqueléticos informados por los participantes. En cuanto a la productividad y el rendimiento del trabajo, hubo evidencia de calidad muy baja de que diferentes frecuencias de pausas en el trabajo pueden tener un efecto positivo. Para los diferentes tipos de fractura, puede no haber efectos sobre el dolor musculoesquelético, el malestar ni la fatiga informados por los participantes según la evidencia de calidad baja. Se necesitan estudios adicionales de alta calidad para determinar la efectividad de la frecuencia, la duración y el tipo de intervenciones de pausas en el trabajo en los trabajadores, si es posible, con tamaños de la muestra mucho mayores que los estudios incluidos en la presente revisión. Además, deben reconsiderarse las intervenciones de pausas en el trabajo, teniendo en cuenta las poblaciones de trabajadores que no son oficinistas y la posibilidad de combinar la intervención de pausas en el trabajo con otras intervenciones como el asesoramiento o el entrenamiento ergonómico, que pueden tener un efecto sobre los resultados musculoesqueléticos y el rendimiento laboral.
PICO
Resumen en términos sencillos
Programas de pausas en el trabajo para la prevención de los síntomas y trastornos musculoesqueléticos en trabajadores sanos
Se calcula que el número de trabajadores que padecen trastornos musculoesqueléticos relacionados con el trabajo representa entre el 21% y el 28% del total de días de licencia por enfermedad en 2017/2018 en el Reino Unido, Alemania y los Países Bajos. Estas cifras indican que los trastornos musculoesqueléticos relacionados con el trabajo son un problema importante tanto para la sociedad como para los empleadores. Las intervenciones pueden contrarrestar este problema, por ejemplo, mediante cambios en el lugar de trabajo o en la organización del trabajo. Se han investigado muchas intervenciones, como el entrenamiento en los principios de la ergonomía (diseñosde trabajo para aumentar la productividad y la comodidad en el lugar de trabajo), la información y el asesoramiento, el ajuste de los puestos de trabajo, el ajuste de los horarios de las pausas en el trabajo y la rotación del trabajo. La revisión actual se centró en el efecto de los diferentes programas de pausas en el trabajo sobre los resultados de los síntomas musculoesqueléticos relacionados con el trabajo, ya que en la actualidad se carece de una revisión sistemática global sobre esta intervención en particular. Los diferentes horarios de pausas en el trabajo pueden llevar a una interrupción o una disminución de los largos períodos de cargas de trabajo repetitivo o monótono. También pueden llevar a la interrupción de períodos más largos en que los trabajadores tienen que adoptar posturas estáticas o incómodas, factores reconocidos como factores de riesgo para desarrollar trastornos musculoesqueléticos relacionados con el trabajo.
Objetivo
Se intentó averiguar si las diferentes frecuencias, duraciones y tipos de pausas en el trabajo pueden prevenir los síntomas y trastornos musculoesqueléticos relacionados con el trabajo en trabajadores sanos. Se consideró que los trabajadores estaban sanos cuando no presentaban trastornos musculoesqueléticos en el momento de la inscripción en el estudio.
Estudios
Se seleccionaron varias medidas de resultado primarias, incluidos los trastornos musculoesqueléticos recién diagnosticados, los síntomas musculoesqueléticos informados por los participantes, como el dolor, el malestar y la fatiga, y la productividad y el rendimiento laboral. Esta última medida no es directamente relevante para el trabajador, sino para el empleador cuando se trata de mantener la producción empresarial. Se seleccionaron los cambios en la carga de trabajo como medida de resultado secundaria, que puede incluir cambios en la fuerza de salida, manifestaciones electromiográficas (registro de la actividad eléctrica de los músculos mediante electrodos) de fatiga muscular o cambios subjetivos en la carga de trabajo (NASA‐TLX). Ninguno de los estudios incluidos informó sobre trastornos musculoesqueléticos recién diagnosticados o cambios en la carga de trabajo.
Se realizaron búsquedas en la bibliografía hasta el 2 de mayo 2019 para encontrar ensayos controlados aleatorios (ECA), cuasialeatorios, ECA por grupos y ECA cruzados (cross‐over) de intervenciones de pausas en el trabajo para prevenir los trastornos musculoesqueléticos relacionados con el trabajo. Se analizaron todos los estudios pertinentes para responder a la pregunta de la investigación y se encontraron seis estudios con 373 trabajadores, la mayoría de los cuales eran mujeres (≥ 78%), con un período de seguimiento de dos a diez semanas.
Resultados clave
Efecto de las diferentes frecuencias de pausas en el trabajo
Cinco de los seis estudios evaluaron diferentes frecuencias de pausas en el trabajo. La implementación de pausas en el trabajo adicionales (tres estudios) puede no tener un efecto sobre el dolor, el malestar o la fatiga musculoesquelética en comparación con ninguna pausa de trabajo adicional o pausas en el trabajo adicionales que se toman según sea necesario. Las pausas en el trabajo adicionales (tres estudios) pueden tener un efecto positivo sobre la productividad y el rendimiento laboral en comparación con un esquema de pausas en el trabajo convencional. En un estudio se compararon las pausas en el trabajo adicionales de mayor frecuencia con las pausas de menor frecuencia, lo que no dio lugar a diferencias en el dolor musculoesquelético, el malestar ni la fatiga informados por los participantes, ni en la productividad o el rendimiento laboral.
Efecto de las diferentes duraciones de las pausas en el trabajo
Ninguno de los estudios evaluó el efecto de la duración de las pausas en el trabajo.
Efecto de los diferentes tipos de pausas en el trabajo
Dos de los seis estudios evaluaron diferentes tipos de pausas en el trabajo. Las pausas en el trabajo activas (un estudio) no pueden reducir ni aumentar la incidencia del dolor musculoesquelético, la incomodidad ni la fatiga, o la productividad ni el rendimiento laboral informados por los participantes. De manera similar, se compararon diferentes pausas en el trabajo activas entre sí (un estudio), es decir, pausas en el trabajo activas físicas y de relajación, que no indicaron diferencias en el dolor, el malestar ni la fatiga musculoesquelética informados por los participantes, ni en la productividad o el rendimiento laboral.
Conclusions
En la actualidad, se concluye que existen evidencia de calidad muy baja a baja de que las diferentes frecuencias y tipos de pausas en el trabajo pueden no reducir de modo significativo la incidencia de los trastornos musculoesqueléticos. Aunque los resultados indican que puede haber un efecto positivo de las diferentes frecuencias de pausas en el trabajo sobre la productividad y el rendimiento laboral, se necesitan estudios de alta calidad con tamaños de muestra suficientemente grandes para evaluar la efectividad de las diferentes intervenciones de pausas en el trabajo. Además, deben reconsiderarse las intervenciones de pausas en el trabajo y tener en cuenta las poblaciones de trabajadores que no son oficinistas y la posibilidad de combinar las intervenciones de pausas en el trabajo con otras intervenciones, como el asesoramiento o el entrenamiento ergonómico, que pueden prevenir los trastornos musculoesqueléticos.
Authors' conclusions
Summary of findings
| Additional work breaks compared to no additional work breaks for preventing musculoskeletal symptoms and disorders in workers | ||||||
| Patient or population: office workers | ||||||
| Outcomes | Anticipated absolute effects* (95% CI) | Relative effect | № of participants | Certainty of the evidence | Comments | |
| Assumed risk | Corresponding risk | |||||
| No additional work breaks | Additional work breaks | |||||
| Participant‐reported musculoskeletal pain, discomfort or fatigue Method: 0‐100 mm VAS or 1‐5 NRS Follow‐up: 4 or 10 weeks | The mean participant‐reported musculoskeletal pain, discomfort or fatigue (4 or 10 weeks) ranged across control groups from 1.38 ‐ 3.801 | The mean after shift/after intervention participant‐reported musculoskeletal pain, discomfort or fatigue (4 or 10 weeks) 0.08 standard deviations lower (0.35 lower to 0.18 higher) | ‐ | 225 | ⊕⊕⊝⊝ | |
| Productivity or work performance Method: total number of documents entered per day, or keystrokes per hour, or WRFQ Follow‐up: 4 or 10 weeks | The mean productivity or work performance (4 or 10 weeks) ranged across control groups from ‐4.25 ‐ 209.092 | The mean after shift/after intervention productivity or work performance (4 or 10 weeks) was 0.07 standard deviations lower (0.33 lower to 0.19 higher) | ‐ | 225 | ⊕⊝⊝⊝ | |
| *The risk in the intervention group (and its 95% confidence interval) is based on the assumed risk in the comparison group and the relative effect of the intervention (and its 95% CI). | ||||||
| GRADE Working Group grades of evidence | ||||||
| NRS: Numeric Rating Scale. 1 Data include estimates based on Table 2 and Figure 2 in Galinsky 2000 and Figure 1 in Galinsky 2007. 2 Data include estimates based on Section 3.3 in Galinsky 2000 and Section Data Entry Performance > Rest break schedule in Galinsky 2007. 3 Downgraded one level because of a potential risk of bias. 4 Downgraded one level because the total number of participants was less than 300 (small sample size for a continuous variable). 5 Downgraded one level because of surrogate outcome that is not important in itself but assumed indirectly important for the intervention's evaluation. | ||||||
| Additional work breaks compared to work breaks as needed for preventing musculoskeletal symptoms and disorders in workers | ||||||
| Patient or population: office workers | ||||||
| Outcomes | Anticipated absolute effects* (95% CI) | Relative effect | № of participants | Certainty of the evidence | Comments | |
| Assumed risk | Corresponding risk | |||||
| Work breaks as needed | Additional work breaks | |||||
| Participant‐reported musculoskeletal pain, discomfort or fatigue Method: 0‐100 mm VAS Follow‐up: 4 weeks | The mean participant‐reported musculoskeletal pain, discomfort or fatigue (4 weeks) was 25.10 | The mean after intervention participant‐reported musculoskeletal pain, discomfort or fatigue (4 weeks) in the intervention group was 1.80 higher (38.15 lower to 41.75 higher) | ‐ | 15 | ⊕⊝⊝⊝ | |
| Productivity or work performance Method: number of words typed per 3 hours Follow‐up: 4 weeks | The mean productivity or work performance (4 weeks) was ‐317.00 compared to no breaks | The mean after intervention productivity or work performance (4 weeks) in the intervention group was 542.50 higher (177.22 higher to 907.78 higher) | ‐ | 15 | ⊕⊝⊝⊝ | |
| *The risk in the intervention group (and its 95% confidence interval) is based on the assumed risk in the comparison group and the relative effect of the intervention (and its 95% CI). | ||||||
| GRADE Working Group grades of evidence | ||||||
| VAS: Visual Analogue Scale. 2 Downgraded two levels because the total number of participants was less than 50 (small sample size for a continuous variable) and because of low precision of the effect estimate (0.5 was included in the 95% CI of the SMD). 3 Downgraded one level because of surrogate outcome that was not important in itself but assumed indirectly important for the intervention's evaluation. | ||||||
| Additional higher frequency work breaks compared to additional lower frequency work breaks for preventing musculoskeletal symptoms and disorders in workers | ||||||
| Patient or population: office workers | ||||||
| Outcomes | Anticipated absolute effects* (95% CI) | Relative effect | № of participants | Certainty of the evidence | Comments | |
| Assumed risk | Corresponding risk | |||||
| Additional lower frequency work breaks | Additional higher frequency work breaks | |||||
| Participant‐reported musculoskeletal pain, discomfort or fatigue Method: 0‐100 mm VAS Follow‐up: 4 weeks | The mean participant‐reported musculoskeletal pain, discomfort or fatigue (4 weeks) was 21.08 | The mean after intervention participant‐reported musculoskeletal pain, discomfort or fatigue (4 weeks) was 11.65 higher (41.07 lower to 64.37 higher) | ‐ | 10 | ⊕⊝⊝⊝ | |
| Productivity or work performance Method: number of words typed per 3 hours Follow‐up: 4 weeks | The mean productivity or work performance (4 weeks) was 267.00 compared to no breaks | The mean after intervention productivity or work performance (4 weeks) in the intervention group was 83.00 lower (305.27 lower to 139.27 higher) | ‐ | 10 | ⊕⊝⊝⊝ | |
| *The risk in the intervention group (and its 95% confidence interval) is based on the assumed risk in the comparison group and the relative effect of the intervention (and its 95% CI). | ||||||
| GRADE Working Group grades of evidence | ||||||
| VAS: Visual Analogue Scale. 2 Downgraded two levels because the total number of participants was less than 25 (small sample size for a continuous variable) and because of low precision of the effect estimate (0.5 was included in the 95% CI of the SMD). 3 Downgraded one level because of surrogate outcome that was not important in itself but assumed indirectly important for the intervention's evaluation. | ||||||
| Active work breaks compared to passive work breaks for preventing musculoskeletal symptoms and disorders in workers | ||||||
| Patient or population: office workers | ||||||
| Outcomes | Anticipated absolute effects* (95% CI) | Relative effect | № of participants | Certainty of the evidence | Comments | |
| Assumed risk | Corresponding risk | |||||
| Passive work breaks | Active work breaks | |||||
| Participant‐reported musculoskeletal pain, discomfort or fatigue Method: 1‐7 NRS Follow‐up: 5 weeks | The mean participant‐reported musculoskeletal pain, discomfort or fatigue (5 weeks) was 4.15 | The mean difference after intervention participant‐reported musculoskeletal pain, discomfort or fatigue (5 weeks) in the intervention group was 0.17 lower (0.71 lower to 0.37 higher) | ‐ | 153 | ⊕⊕⊝⊝ | |
| *The risk in the intervention group (and its 95% confidence interval) is based on the assumed risk in the comparison group and the relative effect of the intervention (and its 95% CI). | ||||||
| GRADE Working Group grades of evidence | ||||||
| NRS: Numeric Rating Scale. 2 Downgraded one level because the total number of participants was less than 200 (small sample size for a continuous variable). | ||||||
| Relaxation work breaks compared to physical work breaks for preventing musculoskeletal symptoms and disorders in workers | ||||||
| Patient or population: office workers | ||||||
| Outcomes | Anticipated absolute effects* (95% CI) | Relative effect | № of participants | Certainty of the evidence | Comments | |
| Assumed risk | Corresponding risk | |||||
| Physical work breaks | Relaxation work breaks | |||||
| Participant‐reported musculoskeletal pain ,discomfort or fatigue Method: 1‐7 NRS Follow‐up: 5 weeks | The mean participant‐reported musculoskeletal pain, discomfort or fatigue (5 weeks) was 3.88 | The mean difference after intervention participant‐reported musculoskeletal pain, discomfort or fatigue (5 weeks) in the intervention group was 0.20 higher (0.43 lower to 0.82 higher) | ‐ | 97 | ⊕⊕⊝⊝ | |
| *The risk in the intervention group (and its 95% confidence interval) is based on the assumed risk in the comparison group and the relative effect of the intervention (and its 95% CI). | ||||||
| GRADE Working Group grades of evidence | ||||||
| NRS: Numeric Rating Scale. 2 Downgraded one level because the total number of participants was less than 100 (small sample size for a continuous variable). | ||||||
Background
Description of the condition
Over the past decades, companies in the industrial sector have automated and standardised their operations (Docherty 2002), resulting in work tasks becoming more similar, and employees being exposed to more repetitive and monotonous work (Mathiassen 2006). Repetition and monotony are two important characteristics of work that increase the risks of an employee developing work‐related musculoskeletal disorders (Buckle 2002). Vulnerable body sites for work‐related musculoskeletal disorders include, among others, the back, arms, hands, wrists (Barr 2004), shoulders and neck (Eltayeb 2009). Several work‐related site‐specific disorders have been identified in the literature, including low back pain (Irwin 2007), epicondylitis (Herquelot 2013), carpal tunnel syndrome (Palmer 2007), thoracic outlet syndrome (Laulan 2011), meniscal tears (Snoeker 2013), knee osteoarthritis (Ezzat 2014) and plantar fasciitis (Foye 2007). For de Quervain's synovitis this has been suspected but this was not confirmed in studies (Stahl 2015).
Work‐related musculoskeletal disorders place a heavy burden on current society, not only because of their prevalence but also because of the costs associated with work absenteeism due to such disorders. Prevalence rates and lost working days vary across countries due to differences in the economic situation. For example, musculoskeletal disorders accounted for about 24% of all work‐related illnesses in 2017/2018 in the UK and resulted in 6.6 million working days lost (HSE 2019). In the Netherlands, musculoskeletal disorders accounted for an average of about 28% of work absenteeism days and for an average of about 20% of work disability days in 2017 (ArboNed 2019). In Germany, musculoskeletal disorders accounted for about 21% of work absenteeism days in 2018 (DAK 2019). In general, the prevalence of work‐related musculoskeletal disorders increases with age and is higher in males than in females (ArboNed 2019; HSE 2019).
Description of the intervention
A potential solution for reducing the incidence of work‐related musculoskeletal disorders is to design interventions that prevent exposure to factors that increase risk of developing a work‐related musculoskeletal disorder. Due to the multifactorial aetiology of such disorders (Armstrong 1993; Kraatz 2013; Roquelaure 2009), this is quite a challenge. Nevertheless, several studies have suggested conducting interventions at the level of work‐break frequency or duration or both, or type of exposure at work (Burger 1959) and have investigated the efficacy (laboratory studies) or effectiveness (studies at true workplaces) of increasing break frequency, or changing the pattern of breaks whilst measuring effects on musculoskeletal fatigue, discomfort level and work performance (e.g. Galinsky 2007; Luger 2015; Sundelin 1993).
This review will focus on work‐break schedule interventions specifically aimed at preventing work‐related musculoskeletal symptoms and disorders among workers. The goal of work‐break schedules is to interrupt or decrease long periods of repetitive or monotonous workloads and the periods in which workers have to adopt awkward postures. We define a work break as a temporary disengagement from work, with the following characteristics.
-
Frequency: work breaks provided over a working period or working day may differ in number.
-
Duration: work breaks may be provided as: microbreaks, such as breaks lasting up to two minutes; short breaks, such as a coffee break; or longer breaks, such as a lunch break.
-
Type: different types of work breaks may be provided, such as passive or rest breaks (Brewer 2006), active breaks involving high‐intensity or stretching exercises, and walking (Falla 2007) or cognitive breaks (Mathiassen 2014).
How the intervention might work
In situations where work‐related musculoskeletal symptoms or disorders are prevalent, it may be advantageous to apply work breaks. It is generally assumed that work breaks may provide a recovery period for any musculoskeletal structure that is stressed during the working process (the process thought to precede the pathogenesis of work‐related musculoskeletal disorders (Rashedi 2015)), thus helping to maintain work performance (Tucker 2003). However, work breaks may differ in frequency, duration and type.
Frequency of work breaks
On a regular working day, employees are often offered one or more coffee breaks and a longer meal break, which differs for each country with regards to legal prescriptions and wage agreements. Studies have investigated whether providing more frequent breaks could be beneficial. For example, in a field cross‐over study among field workers who completed three days of strawberry harvesting while in a stooped position, workers were exposed to either the regular‐break pattern (i.e. two 10‐minute rest breaks and one 30‐minute lunch break) or to the intervention rest‐break pattern (i.e. four extra five‐minute breaks in addition to the regular‐break pattern) (Faucett 2007). The study focused on both primary and secondary prevention, because workers with musculoskeletal symptoms were also included and randomised. The intervention rest‐break pattern improved musculoskeletal symptoms and fatigue scores among workers, and their productivity did not differ from that of workers using the regular‐break pattern. A recent field study among workers from companies in various sectors showed that a higher frequency of rest breaks is associated with less work‐related fatigue and distress (Blasche 2017), however, nothing was mentioned about whether total break duration changed accordingly. While both of these studies provide subjective results in favour of more frequent work breaks, objective findings are currently scarce and make it difficult to give practical advice on an effective work‐break pattern.
Duration of work breaks
The duration of work breaks may play a crucial role in the recovery of tissues and muscles. A multicentre cohort study among surgeons investigated the effectiveness of intraoperative microbreaks lasting about 1.5 to 2 minutes, provided at 20‐ to 40‐minute intervals (Park 2017). This field study showed that microbreaks can be practical and efficient in reducing musculoskeletal pain without prolonging the overall operative time. A field cross‐over study showed that musculoskeletal fatigue was lower among surgeons taking 20‐second microbreaks than among surgeons who did not take such breaks (Dorion 2013). In both of these studies, task duration and work accuracy were not affected, an important factor in surgical work since other human lives are at stake. Additionally, it has been shown in a field study that 30‐second microbreaks in computer work provided every 20 or 40 minutes improved perceived discomfort in all body areas and had no detrimental effect on productivity (McLean 2001). Hence, a number of studies have shown promising results for the provision of work breaks of varying durations. However, studies are still lacking that would aim to identify the optimal duration of work breaks by comparing different break durations.
Type of work breaks
Finally, the type of work break may play a role in the amount of recovery the tissues and muscles actually receive. In general, there are two types of work breaks that can be implemented: passive breaks in which workers just rest, or active breaks in which workers are instructed to, for example, stretch, walk or perform a cognitive task. A randomised controlled trial (RCT) involving visual display unit workers with musculoskeletal symptoms investigated two types of break activities (stretching or dynamic contractions) to be conducted during three‐minute work breaks (Nakphet 2014). The results showed that both types of break activities had a favourable and similar effect on muscle discomfort and productivity. Such promising results were, however, not evident in a recent laboratory cross‐over trial in which individuals performing a one‐hour pick‐and‐place task received one‐minute active or passive breaks every 12 minutes (Luger 2015). Neither type of supplementary break influenced perceived discomfort when compared with one hour of work without breaks. Hence, the literature provides some information regarding the most suitable types of work breaks, but the studies providing this information vary in study design and in the settings in which the types of breaks were investigated.
Hence, although there is some knowledge on the efficacy and effectiveness of work‐break schedules based on their frequency, duration and type, an overview of the results of studies investigating one or more of these aspects of work‐break schedules is lacking.
The drawback of work breaks is that their implementation is highly dependent on the type of work being carried out (i.e. not all work settings allow for a flexible arrangement of work and breaks). Additionally, the employer and employee both need to accept the changes required by the work‐break pattern: (1) the employer by organising extra time for breaks, and (2) the employee by accepting a longer presence at work to cover more break time but the same amount of work time. The diversity of study populations may give more insight into the effectiveness of work‐break interventions with regard to employees’ age and gender, since the prevalence of work‐related musculoskeletal disorders differs with age and gender (HSE 2019). Acceptability, gender and age may also impact the effectiveness of work‐break interventions.
Why it is important to do this review
Musculoskeletal disorders pose a large burden on current society due to their high prevalence but also due to the substantial costs associated with the lost work days and lost productivity associated with these disorders (March 2014). This underlines the importance of finding effective interventions to prevent work‐related musculoskeletal symptoms and disorders, of which work breaks may provide one potential option.
A systematic review on the use of workplace interventions for preventing musculoskeletal disorders in computer users identified work breaks as one possible type of intervention (Brewer 2006). In this review, four of six studies with observation periods ranging from two weeks to up to seven months found the effects of passive work breaks on musculoskeletal health to be inconsistent. The remaining two studies found moderate evidence that active work breaks do not influence musculoskeletal health. A more recent cluster RCT investigated the use of a prevention programme that included a work‐break tool to improve the balance between work and recovery among construction workers (Oude Hengel 2013). This study found that, although not statistically significant, the prevention programme was associated with a decline in the prevalence of musculoskeletal symptoms and long‐term sick leave. However, the work‐break tool was only one of three tools comprising the prevention programme, which also included physical therapy sessions to lower the physical workload and empowerment training sessions to increase the influence of workers at the work‐site (Oude Hengel 2013). Hence, the results of the prevention programme cannot be attributed solely to any of the three components of the programme. Another RCT investigated a 10‐week active rest programme among workers, consisting of a warm‐up, cognitive functional training, aerobic exercise, resistance training and a cool‐down, for 10 minutes per day and three times per week (Michishita 2017b). The intervention programme was implemented in employees’ lunch breaks and aimed to improve personal relationships, mental and physical health, and work ability. Several, but not all, aspects related to personal relationships and mental health improved after the programme, which the authors attributed to the increased activity during lunch breaks.
Overall, the evidence for the application of work‐break interventions is not straightforward and, although work‐related musculoskeletal symptoms and disorders are a clear worldwide problem, there is currently no systematic review focusing solely on the effectiveness of work‐break interventions for preventing work‐related musculoskeletal symptoms and disorders. With this review, we aim to investigate the available RCT evidence for the effectiveness of work‐break interventions in order to provide direction for optimising current prevention approaches and to help prioritise future research directions.
Objectives
To compare the effectiveness of different work‐break schedules for preventing work‐related musculoskeletal symptoms and disorders in healthy workers, when compared to conventional or alternate work‐break schedules.
Methods
Criteria for considering studies for this review
Types of studies
We included RCTs, quasi‐RCTs (in which the method used for the allocation of participants is not random, such as alternate allocation, allocation by date of birth, or day of the week), cluster‐randomised trials (randomisation of a group of people such as a work group or workplace rather than randomisation of the individual) and cross‐over RCTs. We included only studies conducted in a real workplace, excluding studies conducted under laboratory conditions. We included studies reported as full‐text, those published in abstract form only, and unpublished data.
Types of participants
We included trials that enrolled healthy adult workers (aged 18 years or above). The health status of the worker was determined when the worker was free of musculoskeletal disorders during study enrolment. There were no restrictions on sex and no restrictions on occupation.
Types of interventions
We included studies that evaluated one or more of the following types of work‐break interventions realised at work and during working hours.
-
Changes in the frequency of work breaks
-
Intervention: higher (i.e. > 3 per day)
-
Control: low (i.e. ≤ 3 per day)
-
-
Changes in the duration of work breaks
-
Intervention: short (i.e. ≤ 15 minute) or micro (i.e. ≤ 1 minute)
-
Control: 15 to 30 minutes (15‐minute breaks during the morning and afternoon shifts, 30‐minute breaks halving the 8‐hour working day; see the study by Galinsky 2000 for a discussion about conventional work‐break schedules)
-
-
Changes in the type of work break
-
Intervention: active or cognitive
-
Control: passive
-
These work‐break interventions were tested or applied at work in real work situations, meaning that 'breaks' such as vacation, weekend or the evening after work (Fritz 2013) were not included in the work breaks that we evaluated in the current review. To be included, a study had to compare the intervention with a control (no intervention or conventional break pattern (Galinsky 2000) or another type of work‐break intervention).
Types of outcome measures
We included studies that assessed the effect of a work‐break schedule on at least one of the following primary outcomes.
Primary outcomes
-
Newly diagnosed musculoskeletal disorders
-
Medical assessment by an occupational physician
-
Scales assessing newly diagnosed musculoskeletal disorders referring to injuries that affect musculoskeletal, peripheral nervous and neurovascular systems caused or aggravated by occupational exposure
-
-
Participant‐reported musculoskeletal symptoms, including pain, discomfort and fatigue
-
Assessing of pain, discomfort or fatigue by a visual analogue scale (VAS) or numeric rating scales (NRS)
-
-
Productivity or work performance
-
Assessment of the level of work functioning, change in work productivity or work time loss as assessed by outcome measures such as the Health and Work Performance Questionnaire (Kessler 2003) or similar instruments
-
Tracking the development of musculoskeletal disorders is time‐consuming, and such longer‐duration longitudinal studies are scarce. Therefore, besides the first primary outcome category (newly diagnosed musculoskeletal disorders), we added the second primary outcome category including participant‐reported musculoskeletal symptoms such as pain, discomfort and fatigue. These three symptoms are surrogates of musculoskeletal disorders and recognised precursors of developing musculoskeletal disorders (Burger 1959; Van der Beek 1998; Westgaard 1996).
Secondary outcomes
-
Workload changes
-
Objective measurements of force or force reduction, muscular load or electromyographic manifestations of muscular fatigue, or endurance time as measured by strain gauge force transducers, dynamometers or electromyography; subjective measurements of workload, such as those assessed using questionnaires (e.g. the NASA TLX questionnaire (Hart 1988))
-
Among secondary outcomes, we included workload changes, since these are often indirectly related to the musculoskeletal symptoms, such as pain, discomfort and fatigue, and therefore also with development of musculoskeletal disorders (Burger 1959; Van der Beek 1998; Westgaard 1996).
Search methods for identification of studies
Electronic searches
We systematically searched for all eligible published and unpublished trials. We imposed no restrictions on language of publication, which means we arranged for the translation of key sections of foreign‐language studies or attempted to find native speakers or people who are proficient in the publications’ language to assist with translating these studies for potential inclusion.
Our search strategy for the MEDLINE database is shown in (Appendix 1); this search strategy was adjusted to the formats of other databases, when necessary. We searched the following electronic databases to identify potentially eligible studies that were already published:
-
Cochrane Central Register of Controlled Trials (CENTRAL; Wiley Online Library) (Appendix 2);
-
MEDLINE (PubMed) (Appendix 1);
-
Embase (OVID) (Appendix 3);
-
CINAHL (EBSCO) (Appendix 4);
-
PsycINFO (EBSCO) (Appendix 5);
-
SCOPUS (Elsevier) (Appendix 6);
-
Web of Science (Thomson Reuters) (Appendix 7).
We also conducted a search for unpublished trials in ClinicalTrials.gov (ClinicalTrials.gov) (Appendix 8) and the World Health Organization International Clinical Trials Registry Platform (who.int/ictrp/en/) (Appendix 9).
Searching other resources
We checked the reference lists of all primary studies included and those of review articles for additional references. We contacted experts in the field to identify additional unpublished studies.
Data collection and analysis
Selection of studies
We followed a two‐stage plan for selecting studies for inclusion in the review, using Covidence software (Covidence 2019). In stage one, two review authors (TL, BS) independently screened the titles and abstracts of the identified citations, and obtained the full text of all studies that at least one author deemed potentially eligible. In stage two, two review authors (TL, BS) independently assessed the full publication for eligibility and compared their results. We tabulated the characteristics of excluded studies in the ‘Characteristics of excluded studies’ table. We resolved any disagreement through discussion or, if required, by consulting a third review author (MR). We identified and excluded duplicates, and collated multiple reports of the same study so that each study, rather than each report, was the unit of interest in the review. We recorded the selection process in sufficient detail to complete a PRISMA flow diagram (Moher 2009) (Figure 1).

Study flow diagram.
When our systematic searches identified studies conducted by one of the review authors, we avoided a conflict of interest by having all decisions concerning inclusion and exclusion made by review authors who were not involved with the study.
Data extraction and management
We entered study characteristics and outcome data into a data collection form that we tested on at least one study in the review. One review author (TL) extracted the following study characteristics from the included studies.
-
General: authors and year of publication.
-
Methods: study design, total duration of study, study location, study setting, withdrawals, and date of study.
-
Participants: number, randomisation, mean age or age range, sex/gender, occupation/working activity, health status, inclusion criteria, and exclusion criteria.
-
Interventions: description of intervention, comparison, duration, intensity, content of both intervention and control condition, co‐interventions, and washout period, including the length between the application of the intervention and the control or vice versa (applicable to cross‐over RCTs).
-
Outcomes: description of primary and secondary outcomes specified and collected, and time points reported.
-
Notes: funding for trial, and notable conflicts of interest of trial authors.
Two review authors (TL, BS) independently extracted outcome data from the included studies. We noted in the ‘Characteristics of included studies’ table if outcome data were not reported in a usable way. We resolved disagreements by consensus or by consulting a third review author (MR). One review author (TL) transferred data into Review Manager 5 (Review Manager 2014); a second review author (BS) spot‐checked study characteristics for accuracy against the trial report. Should we have decided to include studies published in a language in which our author team was not proficient, we arranged for a native speaker or someone sufficiently proficient in the language to fill in the data extraction form for us.
Assessment of risk of bias in included studies
Two review authors (TL, BS) independently assessed the risk of bias in each study using the criteria outlined in the Cochrane Handbook for Systematic Reviews of Interventions (Higgins 2011a). We resolved any disagreements through discussion or by involving a third review author (MR). We assessed the risk of bias according to the following domains:
-
random sequence generation;
-
allocation concealment;
-
blinding of participants and personnel;
-
blinding of outcome assessment;
-
incomplete outcome data;
-
selective outcome reporting;
-
carry‐over.
We graded each potential source of bias as high, low or unclear, and provided a quote from the study report together with a justification for our judgement in the ‘Risk of bias’ table. We summarised the ‘Risk of bias’ judgements across different studies for each of the domains listed. We considered blinding separately for different key outcomes where necessary (e.g. for the assessment of blinding of outcomes, the risk of bias for a diagnosis of musculoskeletal disorder may be very different than that for a participant‐reported discomfort scale). Where information on risk of bias related to unpublished data or to correspondence with a trialist, we noted this in the ‘Risk of bias’ table.
We considered random sequence generation, allocation concealment, incomplete outcome data, selective outcome reporting, and carry‐over (applicable to cross‐over RCTs) to be key domains. We judged a study to have an overall high risk of bias when we judged one or more key domains to have a high risk of bias. Conversely, we judged a study to have an overall low risk of bias when we judged all key domains to have a low risk of bias.
Assessment of bias in conducting the systematic review
We conducted the review according to a published protocol and reported any deviations from it in the ‘Differences between protocol and review’ section of the systematic review.
Measures of treatment effect
We entered the outcome data for each study into the data tables in Review Manager 2014 in order to calculate the treatment effects. We used mean differences or standardised mean differences for continuous outcomes. We planned to use risk ratios for dichotomous outcomes and hazard rations for time to event data, if we had outcomes with such data. If only effect estimates and their 95% confidence intervals or standard errors were reported in studies, we entered these data into Review Manager 2014 using the generic inverse variance method. We ensured that higher scores for continuous outcomes had the same meaning for each outcome, explained the direction to the reader, and reported where the directions were reversed, if necessary. When the results could not be entered in either way, we described them in the ‘Characteristics of included studies’ tables, or entered the data into ‘Additional tables’.
For cross‐over trials that reported continuous outcomes, we used the paired analysis as reported by the authors and included the mean difference between the intervention and control conditions and its standard error into Review Manager 2014 using the generic inverse variance method for calculating the effect estimate. In cases where the authors did not report paired analysis, we conducted the analysis ourselves based on the reported or imputed correlation between the outcomes of the intervention and the control conditions, as advised in Chapter 16 of the Cochrane Handbook for Systematic Reviews of Interventions (Higgins 2011c).
Unit of analysis issues
We did not locate any cluster‐randomised trials to include in this review. If we had located such studies, we planned to calculate the design effect based on a fairly large assumed intra‐cluster correlation of 0.10. We considered 0.10 to be a realistic estimate based on intra‐cluster correlation values typically seen in cluster RCTs (Campbell 2001). For the calculations, we would follow the methods as stated in the Cochrane Handbook for Systematic Reviews of Interventions (Higgins 2011a).
Dealing with missing data
We contacted investigators or study sponsors in order to verify key study characteristics and obtain missing numerical outcome data, where possible (e.g. when a study was published in abstract form only). Where this was not possible and the missing data were thought to introduce serious bias, we explored the impact of including such studies in the overall assessment of results using sensitivity analysis. If we were unable to obtain these data even after contacting authors, we listed such studies under ‘Studies awaiting classification’.
If numerical outcome data, such as standard deviations or correlation coefficients, were missing and could not be obtained from the authors, we calculated them from other available statistics, such as P values, according to the methods described in the Cochrane Handbook for Systematic Reviews of Interventions (Higgins 2011a).
Assessment of heterogeneity
We assessed the clinical homogeneity of the results of the included studies based on similarity of population, intervention, outcome and follow‐up. We followed the algorithm provided by (Verbeek 2012).
We considered populations as similar when they were exposed to similar physical demands in their job.
We considered interventions as similar when they belonged to one of the three intervention categories as defined in the section 'Types of interventions'. Interventions that addressed a low or high work‐break frequency were considered different; interventions that addressed a long, short or micro work‐break duration were considered different; and interventions that addressed a passive, active or cognitive work‐break type were considered different.
We considered any method used to record participant‐reported complaints (e.g. Borg scale, VAS, questionnaires) and participant‐reported workloads (e.g. the TLX questionnaire) to be similar. We considered any standardised questionnaire used for the assessment of work performance and productivity (e.g. Health and Work Performance Questionnaire) to be similar. We considered any objective technique related to workload changes (e.g. force, endurance time, muscle activity) to be similar.
We regarded short‐term (up to six weeks), medium‐term (from six weeks to up to six months) and long‐term (more than six months) follow‐up times to be different.
We assessed heterogeneity by the visual inspection of forest plots and by using the I² statistic. We then quantified the degree of heterogeneity (Higgins 2011a), and considered an I² value greater than 75% to represent substantial heterogeneity. In the presence of substantial heterogeneity and a sufficient number of studies, we explored possible causes by conducting prespecified subgroup analyses.
Assessment of reporting biases
If we had been able to pool seven or more trials in any single meta‐analysis, we planned to assess publication bias by funnel plots and examine funnel plot asymmetry using the Egger’s test (Higgins 2011a). Due to too few studies, we could not examine funnel plot asymmetry for assessing publication bias.
Data synthesis
We pooled data from studies judged to be clinically homogeneous using Review Manager 5 software (Review Manager 2014). If more than one study provided usable data in any single comparison, we performed meta‐analyses. We plotted the results of each RCT as point estimates with corresponding 95% confidence intervals. We used a random‐effects model to pool the results of studies (Borenstein 2009) for all analyses. When I² was higher than 75% we did not pool the results of studies in meta‐analysis. We narratively described skewed data and, if possible, reported medians and interquartile ranges in addition. Skewness of data was assessed using the methods and recommendations as described in Section 9.4.5.3 of the Cochrane Handbook of Systematic Reviews and Interventions (Deeks 2011).
If multiple trial arms would have been reported in a trial, we planned to include only the relevant arms. If two comparisons would have been combined in the same meta‐analysis, we planned to halve the control group to avoid double‐counting.
Summary of findings table
We created a ‘Summary of findings’ table using the following outcomes.
-
Participant‐reported musculoskeletal pain.
-
Participant‐reported musculoskeletal discomfort or fatigue.
-
Productivity or work performance.
-
Workload changes.
Quality of the evidence
We used the five GRADE considerations (study limitations based on risk of bias assessment, consistency of effect, imprecision, indirectness and publication bias) to assess the quality of a body of evidence as it related to the studies that contributed data to the data analyses for the prespecified outcomes. We used the methods and recommendations described in Section 8.5 (Higgins 2011b) and Chapter 12 of the Cochrane Handbook for Systematic Reviews of Interventions (Schünemann 2011), the Handbook for grading quality of evidence and the strength of recommendations using the GRADE approach (Schünemann 2013), using GRADE profiler software (GRADEpro GDT). We justified all decisions to downgrade or upgrade the quality of studies using footnotes and we made comments to aid readers’ understanding of the review, where necessary.
Subgroup analysis and investigation of heterogeneity
When data would have allowed it, we planned to carry out the following subgroup analyses for each outcome.
-
Type of intervention (if possible, we planned to compare studies that changed the frequency of work breaks with studies that changed the duration of work breaks and with studies that changed the type of work breaks).
-
Age (if possible, we planned to compare studies conducted in participants aged 18 to 40 years with studies where all participants were aged 41 years and older).
-
Sex (if possible, we planned to compare males with females).
-
Type of work task (if possible, we planned to compare industrial or factory work, such as assembling, with computer work and social work, such as nursing and garbage collecting).
We would have used the Chi² test to test for subgroup interactions in Review Manager 5 software (Review Manager 2014). However, we included and pooled too few trials to be able to perform subgroup analyses.
Sensitivity analysis
We combined the outcomes self‐reported musculoskeletal pain and self‐reported musculoskeletal discomfort or fatigue and merged different scales or results of different body regions together. We performed a sensitivity analysis to determine whether combining these musculoskeletal outcomes was justified and would not change the result of the meta‐analysis when each single musculoskeletal outcome was evaluated.
We considered studies to be at high risk of bias if one of the main biases was rated unclear or high risk, i.e. random sequence allocation, allocation concealment, incomplete outcome data, selective outcome reporting, or carry‐over. We planned to assess the robustness of our conclusions by excluding studies judged to have a high risk of bias from our meta‐analyses. However, we did not find enough studies to perform such analysis, i.e. none of the included studies was judged to have a low risk of bias.
Reaching conclusions
We based our conclusions only on findings from the quantitative or narrative synthesis of included studies for this review. We confined our recommendations for practice to those supported by the evidence, such as values and available resources. Our implications for research suggested priorities for future research and outlined the remaining uncertainties in the area.
Results
Description of studies
See: Figure 1, Characteristics of included studies, Characteristics of excluded studies.
Results of the search
The electronic searches identified a total of 12,445 references (Figure 1), collected from several databases: CENTRAL 213 (Appendix 2, 24 April 2019); MEDLINE 2,011 (Appendix 1, 24 April 2019); Embase 3,097 (Appendix 3, 2 May 2019); CINAHL 3,940 (Appendix 4, 24 April 2019); PsycINFO 1,310 (Appendix 5, 24 April 2019); SCOPUS 871 (Appendix 6, 2 May 2019); Web of Science 637 (Appendix 7, 24 April 2019); ClinicalTrials.gov 37 (Appendix 8, 24 April 2019); WHO ICTRP 29 (Appendix 9, 24 April 2019). References of selected systematic reviews and included studies led to the potential inclusion of an additional two references. The total of 12,447 references was reduced to 9,675 after removing 2,772 duplicates. The titles, keywords and abstracts of the 9,675 potentially relevant references were independently screened by two review authors (TL, BS). We selected 129 references for full‐text analysis. Two review authors (TL, BS) independently read and analysed the full texts, and finally selected six studies for inclusion in this review.
Included studies
Study design
All six studies were randomised controlled studies, of which four had a parallel design (De Bloom 2017; Henning 1997; Irmak 2012; McLean 2001), one a cross‐over design (Galinsky 2000), and one a mixture of parallel and cross‐over design (Galinsky 2007). See Characteristics of included studies table for further details.
Participants and location
The included studies analysed a total of 373 employees: De Bloom 2017 analysed 153 Finnish knowledge employees, Galinsky 2000 analysed 42 American data‐entry operators, Galinsky 2007 analysed 51 American data‐entry operators, Henning 1997 analysed 73 American computer operators, Irmak 2012 analysed 39 Turkish office workers, and McLean 2001 analysed 15 Canadian computer operators. At least 295 of the 373 analysed employees were female, at least 39 male, and for the remaining 39 employees, sex was not specified (Irmak 2012).
Interventions
Five out of six studies evaluated different frequencies of work breaks (Galinsky 2000; Galinsky 2007; Henning 1997; Irmak 2012; McLean 2001), and two out of six studies evaluated different types of work breaks (De Bloom 2017; Henning 1997). No study evaluated different durations of work breaks.
Outcomes
Participant‐reported musculoskeletal pain was reported by one study, measured on a visual analogue scale (Irmak 2012). Participant‐reported discomfort was reported by four studies, measured on either a numeric rating scale (Galinsky 2000; Galinsky 2007; Henning 1997) or a visual analogue scale (McLean 2001). Participant‐reported fatigue was reported by one study, measured on a numeric rating scale (De Bloom 2017). Productivity or work performance was reported by five studies (Galinsky 2000; Galinsky 2007; Henning 1997; Irmak 2012; McLean 2001), measured objectively (Galinsky 2000; Galinsky 2007; Henning 1997; McLean 2001) or using a questionnaire (Irmak 2012). No study evaluated newly diagnosed musculoskeletal disorders or workload changes as outcome measures.
Follow‐up period
All studies reported outcomes within the treatment period and/or directly after the treatment period. For most studies, this follow‐up period was short‐term, i.e. up to six weeks (De Bloom 2017; Galinsky 2000; Galinsky 2007; Henning 1997; McLean 2001). For one study, the follow‐up period of 10 weeks was medium‐term, i.e. from six weeks up to six months (Irmak 2012).
Excluded studies
One reference was a registered trial (NCT03559153), of which the data collection phase was completed in April 2019; this reference was assigned to the ongoing studies category (Characteristics of ongoing studies table). From the remaining 128 references, we excluded a total of 122 references for different reasons. Eight references were excluded because they were not available and the abstract did not provide enough information to decide whether the study could potentially be included or not (Baidya 1988; ISRCTN13222474; Kissel 1994; Peper 2006; Petz 1964; Rosa 1985; Tooley 2004; Yusuf 2006). Twelve references (i.e. nine studies) were excluded because they included the wrong population, e.g. students or symptomatic subjects (Blasche 2018; Chaikumarn 2018; Chakrabarty 2016; Faucett 2007; JPRN‐UMIN000033210; Lanhers 2015; NCT03840304; Van den Heuvel 2003; Vijendren 2018). Eleven references were excluded because they incorporated the wrong intervention (ACTRN12618000061235; Battecha 2019; Blasche 2017; Havenstein 2017; Keller 2019; Mihaila 1971; NCT01996176; NCT03375749; NCT03468894; Nijp 2016; Oude Hengel 2013). Twenty‐three references were excluded because they reported the wrong outcomes, i.e. outcomes focussing on physical activity, non‐work related productivity or performance, or only a secondary outcome (Brown 2014; CTRI/2019/01/017117; Czernieckij 1966; Evans 2012; Frey 2002; Gilson 2009; Krajewski 2010; Largo‐Wight 2017; Mailey 2017; McLean 2000; Michishita 2017a; Michishita 2017b; Moreira 2007; NCT02951624; NCT02960750; NCT03163953; NCT03560544; Oriyama 2014; Oude Hengel 2012; Sianoja 2018; Taylor 2016). The remaining sixty‐seven references were excluded due to a wrong study design, mostly because randomisation was absent. For further details regarding the study populations and settings of the excluded studies, see Characteristics of excluded studies table.
Risk of bias in included studies
We judged all included studies to have an overall high risk of bias. The results are summarised in the 'Risk of bias' graph, which is an overview of the review authors' judgements about each 'Risk of bias' item presented as percentages across all included studies (Figure 2). Figure 3 shows the 'Risk of bias' summary of each 'Risk of bias' item for each of the six included studies.

Risk of bias graph: review authors' judgements about each risk of bias item presented as percentages across all included studies.

Risk of bias summary: review authors' judgements about each risk of bias item for each included study.
Allocation
None of the studies reported using a random number table or equivalent for generating a random sequence and thus all were judged to have an unclear risk of bias. None of the studies reported using adequate measures for concealing allocation such using sealed opaque envelopes and thus all were judged to have an unclear risk of bias associated with allocation concealment.
Blinding
Blinding of the intervention was not performed in any of the studied interventions as blinding of the different break schedules is difficult to achieve. Therefore, we judged all six studies to have a high risk of performance bias. All six studies included one or more measures that were self‐reported, which made us rate the risk for detection bias of all studies as high.
Incomplete outcome data
Two studies reported the number of dropouts that occurred before study start and during follow‐up (De Bloom 2017; Henning 1997). One of these studies had so many dropouts, that we judged the risk of bias as high (Henning 1997). The other study used a statistical method (MICE) to impute the missing data, and we judged the risk of bias as low (De Bloom 2017). One study did not report potential dropouts during their study at all, thus, we rated this study as having an unclear risk of attrition bias (McLean 2001). One study did not report potential dropouts during their study; however, after contact with the authors we were informed that no subjects had dropped out during the study (Irmak 2012). Therefore, we judged this study to have a low risk of attrition bias. In the remaining two studies, the dropout rate during follow‐up or due to incomplete outcome data reached over 50%, and the authors decided to report only half of the follow‐up period (Galinsky 2000; Galinsky 2007). Therefore, these two studies were rated as having a high risk of attrition bias.
Selective reporting
Three studies reported all outcomes in the results section that were listed in the methods section (Henning 1997; Irmak 2012; McLean 2001). However, since there was no registered trial protocol, we could not verify whether the study plan was realised, so these three studies were judged as having an unclear risk of reporting bias. Two studies were judged as having a high risk of reporting bias, because not all outcomes mentioned in the methods section were reported in the results section (Galinsky 2000; Galinsky 2007). One study reported all outcomes in the results section that were mentioned in the methods section (De Bloom 2017). However, since the published study protocol listed more outcomes than those reported in the published paper, we judged the level of reporting bias for this study to be high.
Other potential sources of bias
Two studies that used a cross‐over study design were judged to have a high risk for a potential carry‐over effect, because there was no wash‐out period in between the experimental conditions (Galinsky 2000; Galinsky 2007). Three studies that followed a parallel study design were considered free from risk of a carry‐over effect (De Bloom 2017; Henning 1997; Irmak 2012). One study used a parallel group design and compared within‐subject differences with a baseline measurement just before implementation of the experiment. Because the authors explicitly mentioned that they avoided carry‐over effects, the risk of carry‐over effects was judged as low (McLean 2001).
Effects of interventions
See: Summary of findings for the main comparison Additional work breaks compared to no additional work breaks for preventing musculoskeletal symptoms and disorders in workers; Summary of findings 2 Additional work breaks compared to work breaks as needed for preventing musculoskeletal symptoms and disorders in workers; Summary of findings 3 Additional higher frequency work breaks compared to additional lower frequency work breaks for preventing musculoskeletal symptoms and disorders in workers; Summary of findings 4 Active work breaks compared to passive work breaks for preventing musculoskeletal symptoms and disorders in workers; Summary of findings 5 Relaxation work breaks compared to physical work breaks for preventing musculoskeletal symptoms and disorders in workers
See: summary of findings Table for the main comparison; summary of findings Table 2; summary of findings Table 3; summary of findings Table 4; summary of findings Table 5.
1. Changes in the frequency of work breaks
We identified five RCTs that compared different work‐break frequencies (Henning 1997; Galinsky 2000; Galinsky 2007; Irmak 2012; McLean 2001). However, one of these studies was not included in the meta‐analyses, because the authors did not report numeric results, which could also not be retrieved after email contact with the authors (Henning 1997).
1.1 Additional work breaks versus no additional work breaks
Four studies compared additional work breaks with no additional work breaks. The additional work breaks included: additional 2‐minute exercise breaks (Irmak 2012), additional 5‐minute passive breaks (Galinsky 2000; Galinsky 2007), additional 30‐second and 3‐minute passive and active breaks (Henning 1997).
Outcome: participant‐reported musculoskeletal pain, discomfort or fatigue
We found low‐quality evidence that additional work breaks may have no considerable effect on participant‐reported musculoskeletal pain, discomfort and fatigue compared to no additional work breaks (standardised mean difference (SMD) ‐0.08; 95% confidence interval (CI) ‐0.35 to 0.18; Analysis 1.1). For this analysis, the participant‐reported musculoskeletal outcomes of three studies were pooled: participant‐reported musculoskeletal pain (Irmak 2012) and participant‐reported musculoskeletal discomfort (Galinsky 2000; Galinsky 2007). The participant‐reported musculoskeletal discomfort outcomes are suspected of being skewed; however, we did not receive data other than means and standard deviations from the authors.
Sensitivity analysis
We performed a sensitivity analysis, within which the pooled analysis (Analysis 1.1) was compared to the single analyses (Analysis 6.1). Based on the sensitivity analyses, we decided that the pooled analysis was representative of the single analyses because it showed similar outcomes. We reported the standardised mean difference (SMD) because the scales of participant‐reported musculoskeletal pain, discomfort and fatigue differed between studies, including a numeric rating scale (NRS) ranging from 1 to 5 (worse) (Galinsky 2000; Galinsky 2007) and a visual analogue scale (VAS) ranging from 0 mm to 100 mm (worse) (Irmak 2012).
Outcome: productivity or work performance
There was very low‐quality evidence that additional work breaks may have no considerable effect on productivity or work performance compared to no additional work breaks (SMD ‐0.07; 95% CI ‐0.33 to 0.19; Analysis 1.2). We pooled the different work productivity outcomes of three studies: work role functioning questionnaire (Irmak 2012), keystrokes per hour (Galinsky 2000; Galinsky 2007), and entered documents per day (Galinsky 2000; Galinsky 2007). The keystrokes per hour and entered documents per day are suspected of being skewed; however, also here we did not receive data other than means and standard deviations.
Sensitivity analysis
The sensitivity analysis showed that the single productivity outcomes (Analysis 6.2) showed similar effects in the same direction as the pooled analysis (Analysis 1.2). The single productivity outcomes were measured differently, including: a numeric rating scale ranging from 1 (worse) to 5 (Irmak 2012) and a number per hour or per day (Galinsky 2000; Galinsky 2007).
1.2 Additional work breaks versus work breaks as needed
One study compared additional work breaks with work breaks as needed (i.e. microbreaks taken at own discretion) (McLean 2001).
Outcome: participant‐reported musculoskeletal pain, discomfort or fatigue
We found very low‐quality evidence that additional work breaks may have no considerable effect on musculoskeletal pain, discomfort or fatigue when compared to work breaks as needed (MD 1.80; 95% CI ‐38.15 to 41.75, Analysis 2.1). The participant‐reported musculoskeletal outcomes of one study (McLean 2001) were pooled and provided as mean differences, because each outcome was measured on the same VAS scale ranging from 0 mm to 100 mm (worse).
Sensitivity analysis
We performed a sensitivity analysis, comparing the pooled analysis (Analysis 2.1) with the single analyses of discomfort and fatigue per body region (Analysis 7.1). Because none of the outcomes per body region were statistically significant (i.e. 0 was included in the confidence interval) and neither was the outcome of the pooled analysis, we considered the pooled analysis (Analysis 2.1) to be representative of the outcomes of the single body regions (Analysis 7.1).
Outcome: productivity or work performance
There was very low‐quality evidence that additional work breaks may have improved work productivity or performance (words typed per three hours) when compared to work breaks as needed (MD 542.50; 95% CI 177.22 to 907.78; Analysis 2.2).
1.3 Additional higher frequency work breaks versus additional lower frequency work breaks
One study compared additional high frequency work breaks with additional low frequency work breaks (McLean 2001).
Outcome: participant‐reported musculoskeletal pain, discomfort or fatigue
There was very low‐quality evidence that additional higher frequency work breaks may have no considerable effect on musculoskeletal pain, discomfort or fatigue compared to additional lower frequency work breaks (MD 11.65; 95% CI ‐41.07 to 64.37; Analysis 3.1). The participant‐reported musculoskeletal discomfort ratings coming from one study (McLean 2001) were pooled and provided as mean differences because outcomes of each single body region were reported on the same VAS scale ranging from 0 mm to 100 mm (worse).
Sensitivity analysis
A sensitivity analysis was performed, comparing the pooled analysis across body parts (Analysis 3.1) with the single analyses per body region (Analysis 8.1). Because none of the outcomes per body region showed a statistically significant difference between additional higher and lower frequency work breaks (Analysis 8.1), we considered the pooled analysis (Analysis 3.1), which also showed a statistically non‐significant difference between additional higher and lower frequency work breaks, to be representative of the outcomes of the single body regions (Analysis 8.1).
Outcome: productivity or work performance
We found very low‐quality evidence that additional higher frequency work breaks may not be associated with an increase in work productivity or performance (number of words typed per three hours) compared with additional low frequency work breaks (MD ‐83.00; 95% CI ‐305.27 to 139.27; Analysis 3.2).
2. Changes in the type of work break
We identified two RCTs that compared changes in the type of work breaks (De Bloom 2017; Henning 1997). However, one of the studies was not included in the meta‐analyses, because the authors did not report numeric results, which could also not be retrieved after email contact with the authors (Henning 1997).
2.1 Active work breaks versus passive work breaks
Two studies compared active work breaks with passive work breaks (De Bloom 2017; Henning 1997). The active work breaks included: park walk (De Bloom 2017) and muscle relaxation (De Bloom 2017).
Outcome: participant‐reported musculoskeletal discomfort or fatigue
We found low‐quality evidence that active work breaks may not have a considerable effect on participant‐reported musculoskeletal fatigue when compared to passive work breaks (MD ‐0.17; 95% CI ‐0.71 to 0.37; Analysis 4.1), as measured on a seven‐point NRS (range from 1 to 7 (worse)).
2.2 Relaxation work breaks versus physical work breaks
One study compared relaxation work breaks with physical work breaks (De Bloom 2017).
Outcome: participant‐reported musculoskeletal pain, discomfort or fatigue
There was low‐quality evidence that active relaxation work breaks may not have a considerable effect on musculoskeletal pain, discomfort or fatigue when compared with physical work breaks (MD 0.20; 95% CI ‐0.43 to 0.82; Analysis 5.1). This outcome was measured on a seven‐point NRS, ranging from 1 to 7 (worse).
Discussion
Summary of main results
This systematic review evaluated the effectiveness of different work‐break interventions for preventing work‐related musculoskeletal symptoms and disorders in healthy workers, when compared to conventional or alternate work‐break schedules. We included six randomised controlled trials and 373 participants, of which four used a parallel RCT (De Bloom 2017; Henning 1997; Irmak 2012; McLean 2001) and two a cross‐over RCT design (Galinsky 2000; Galinsky 2007). The studies were all performed in real work places but addressed office workers only. All studies were at overall high risk of bias. We included three types of interventions: work‐break frequency, work‐break duration and work‐break type. From the included studies, we deduced five comparisons of which three belonged to work‐break frequency (summary of findings Table for the main comparison; summary of findings Table 2; summary of findings Table 3), none to work‐break duration, and two to work‐break type (summary of findings Table 4; summary of findings Table 5).
For the interventions related to frequency of work breaks, three comparisons were included: (1) additional work breaks versus no additional work breaks; (2) additional work breaks versus work breaks as needed (i.e. microbreaks taken at own discretion); (3) additional higher frequency work breaks versus additional lower frequency work breaks. For the first comparison, there was low to very low‐quality evidence, based on three studies, that additional work breaks have no considerable effect on self‐reported musculoskeletal pain, discomfort or fatigue or on productivity or work performance compared to no additional work breaks (summary of findings Table for the main comparison). For the second comparison, there was low‐quality evidence, based on one study, that additional work breaks have no beneficial effect on self‐reported musculoskeletal pain, discomfort or fatigue and very low‐quality evidence that additional work breaks may have a positive effect on productivity or work performance compared to work breaks as needed (summary of findings Table 2). For the third comparison, there was very low‐quality evidence, based on one study, that additional higher frequency work breaks have no beneficial effect on self‐reported musculoskeletal pain, discomfort or fatigue or on productivity or work performance compared to additional lower frequency work breaks (summary of findings Table 3). For all three comparisons, musculoskeletal outcomes were pooled and productivity and work performance outcomes were pooled. The sensitivity analyses showed that the pooling did not influence the results of the meta‐analyses.
For the interventions related to type of work breaks, two comparisons were included: (4) active work breaks versus passive work breaks; (5) relaxation work breaks versus physical work breaks. For the fourth comparison, there was low‐quality evidence, based on one study, that active work breaks have no considerable effect on self‐reported musculoskeletal pain, discomfort or fatigue compared to no passive work breaks (summary of findings Table 4). For the fifth comparison, there was low‐quality evidence, based on one study, that relaxation work breaks have no considerable effect on self‐reported musculoskeletal pain, discomfort or fatigue compared to no physical work breaks (summary of findings Table 5).
Taken together, the five studies that were included in the comparisons did not show a considerable effect of different frequencies and types of work‐break schedules on our primary outcomes, i.e. self‐reported musculoskeletal pain, discomfort or fatigue and productivity or work performance. None of the included studies reported newly diagnosed musculoskeletal disorders, secondary outcome measures or any adverse events resulting from the added or alternate work breaks.
Overall completeness and applicability of evidence
The aim of this review was to compare the effectiveness of different work‐break schedules for preventing work‐related musculoskeletal symptoms and disorders in healthy workers. The review included a broad search strategy that aimed to find all RCTs including healthy workers in real work places. The large number of potentially relevant references resulting from the search (i.e. 9,675; see: Figure 1) was checked by two reviewers. Only six studies were eligible for inclusion, of which one study could not be used due to poor data reporting and studies could be pooled only for the main comparison (total of three studies). Of the three categories of work‐break interventions, only two could be addressed, i.e. frequency and type of work breaks, meaning that duration of work breaks has not been investigated in randomised controlled studies so far.
The evidence resulting from the five comparisons dealing with different work‐break frequencies and types, was of low to very low‐quality. Furthermore, none of the comparisons yielded a statistically significant beneficial or detrimental effect of the intervention (corresponding risk) compared to the control (assumed risk). In addition, the studies included office workers only, which could be due to the locations where the studies took place, which were in high‐income countries (Europe and Northern America). Thus, office work was not being characterised by strict, predetermined work‐break schedules, as can be found in the production industry, but was rather characterised by low physical demands. The small, statistically non‐significant findings that were reported by the included studies may be the result of the marginal effect the different work‐break interventions have among office workers on the selected outcomes. Work breaks may be more effective in occupations requiring higher physical load, such as in assembly work or in nursing. Consequently, work‐break interventions should be reconsidered, by including an examination whether the work‐break intervention is sufficient to improve musculoskeletal outcomes and might be more effective when combined with another type of intervention, such as targeting worker's fitness so that employees are better able to tolerate the workload or providing ergonomic counselling so that employees are better informed about the risks of their work.
The population of 373 workers included in this review included mainly women (at least 295; i.e. ≥79%) and relatively few men (at least 39; i.e. ≥11%). This ratio may not be representative of the population of office workers.
The outcomes included in the studies all belonged to our predefined primary outcomes: self‐reported musculoskeletal pain, discomfort or fatigue, and work productivity or performance. None of the studies reported newly diagnosed musculoskeletal disorders or workload changes. We did not consider this as a disadvantage, because the primary outcomes are much more relevant than the secondary outcomes for evaluating work‐break interventions. The primary outcomes should give insight into the potential of the intervention regarding improvements of the musculoskeletal system and stability of productivity and performance.
Quality of the evidence
For each outcome of the five comparisons, we assessed the quality of the evidence using the GRADE profiler software (GRADEpro GDT) based on the five considerations, i.e. study limitations, consistency of effect, imprecision, indirectness and publication bias. Downgrading for potential study limitations was done using the outcomes of the 'Risk of bias' assessment. Since all studies had an overall high potential risk of bias, the certainty of the evidence of all outcomes was downgraded one level. The main reasons for the high risk of overall bias were high risk of performance, detection, attrition and reporting bias (see: Figure 2; Figure 3). Consistency of the effect was judged based on the heterogeneity or I2 statistic provided in Data and analyses. None of the outcomes was downgraded, because consistency of the effect was considered not serious because none of the outcomes had an I2 statistic over 75%. Indirectness of the results was judged as serious for the primary outcome productivity and work performance, because this outcome was not directly important for workers. All objective outcomes were therefore downgraded one level for certainty of the evidence. The certainty of the evidence of the subjective outcomes was not downgraded for indirectness, because the subjective outcomes were considered directly relevant for the worker. Imprecision of the results may influence the certainty of the evidence when sample sizes are very small (rule of thumb is > 400 subjects) and when the precision of the effect estimate is low, i.e. when the standardised mean difference (SMD) crosses 0.5 in the 95% confidence interval (CI). In case of either low sample size or low precision of the effect estimate, we downgraded the certainty of evidence for the outcome one level. In cases of both low sample size and low precision of the effect estimate, we downgraded the certainty of evidence for the outcome two levels. We were not able to judge whether there was publication bias and judged this GRADE consideration as undetected.
All in all, the overall quality of the body of evidence was assessed based on the judgements of the five considerations (see Chapter 12 of the Cochrane Handbook for Systematic Reviews of Interventions; Schünemann 2011). Consequently, the evidence of all subjective outcomes under each comparison was judged to be of low quality, meaning that our confidence in the effect estimate is limited, and the true effect may be substantially different from the estimate of effect. Furthermore, the evidence of all objective outcomes under each comparison was judged to be of very low quality, meaning that we have very little confidence in the effect estimate and the true effect is likely to be substantially different from the estimate of effect. The consequence of this very low‐ to low‐quality evidence makes further research highly necessary for developing recommendations about the effect of work‐break interventions based on the reported outcomes in this review.
Potential biases in the review process
We conducted a comprehensive and transparent review process, where two review authors independently performed the selection of studies, data extraction, and 'Risk of bias' assessment. We attempted to minimise selection bias in the search by not restricting by date of publication or language. We furthermore screened the reference lists of included studies and selected literature reviews (Hoe 2018; Shrestha 2018; Stock 2018), after which we added another two references for potential inclusion. During the full‐text assessment, both potential references had to be excluded due to wrong outcomes (Evans 2012; Gilson 2009). Disagreements in the selection process were resolved through consensus, meaning that a third assessor was not necessary. Due to the very small number of studies included in the current review, we were not able to create funnel plots and assess publication bias. In case more studies can be included in an update of this review, we aim to assess publication bias.
We avoided duplicate publication bias by using study data only once. This strategy was applied only in the case of De Bloom 2017, where we selected both the registered trial and article publication for potential inclusion. We contacted authors in case data reporting in the identified study was marginal or in case other relevant information was unclear or missing, which was the case for all six included studies. When contacting the authors, all of them replied. The authors of the study of Henning 1997 informed us that they did not have the data any more because the study was performed too long ago. The authors of the study of Irmak 2012 shared their detailed results with us and answered additional questions about the study protocol and population. The authors of the studies of De Bloom 2017, Galinsky 2000, Galinsky 2007 and McLean 2001 shared additional information about their study protocol and population.
Three randomised controlled trials that incorporated a work‐break intervention had to be excluded because the intervention was part of a bigger program and could not be assessed separately (Oude Hengel 2013), because the study population contained symptomatic workers (Faucett 2007) and because the outcomes did not fit with our primary outcome measures (Brown 2014). The authors of two studies (Faucett 2007; Oude Hengel 2013) were contacted to gather this information and make the decision for exclusion.
We performed the data analyses, during which we decided to pool the primary outcomes musculoskeletal pain, discomfort and fatigue. This applied to the data analyses as part of three comparisons (Analysis 1.1; Analysis 1.2; Analysis 2.1; Analysis 3.1). To make sure that these pooled analyses were representative of each single data analysis, we performed sensitivity analyses to compare the pooled analyses with each single analysis (Analysis 6.1; Analysis 6.2; Analysis 7.1; Analysis 8.1). We concluded that the pooled analyses were representative, since their results (Analysis 1.1; Analysis 1.2; Analysis 2.1; Analysis 3.1) did not differ that much from the single analyses (Analysis 6.1; Analysis 6.2; Analysis 7.1; Analysis 8.1). Because the pooled musculoskeletal and productivity/work performance outcomes were both assessed on different scales, we had to report the standardised mean differences (SMD) for the pooled analyses.
In this review, we did not incorporate adverse events as a potential secondary outcome. However, adverse events resulting from additional or alternate work breaks could lead to an increase of harmful effects to be prevented, in this case more instead of less musculoskeletal pain, discomfort or fatigue as a surrogate for disorders. We have screened post hoc the included studies and can report that, of the six trials included in the current review, no trials noted that they measured adverse events and no trials reported adverse event rates in both the control and experimental groups. Additionally, this review primarily focussed on musculoskeletal outcomes, which means that we could not make any conclusions about the effectiveness of work breaks on other health aspects, such as cardiovascular health and mental well‐being.
Agreements and disagreements with other studies or reviews
Several literature reviews have been published that focussed on work breaks or on workplace interventions in general to prevent or decrease musculoskeletal‐related outcomes. When comparing our results with the other literature reviews, most of the findings were not comparable for different reasons. Our review focussed on RCTs within which participants had to be symptom‐free during study enrolment. Some other reviews had no restrictions on whether the study population was symptomatic or non‐symptomatic and included other designs than RCTs as well, such as non‐RCTs (Boocock 2007; Hoe 2018; Kennedy 2010; Van Eerd 2016; Verbeek 2019; Waongenngarm 2018). Due to these criteria, the one review that focussed on work breaks only included 11 studies (Waongenngarm 2018). Four other reviews focussed on workplace or occupational health and safety interventions in general, of which one review included 31 studies (Boocock 2007), one included 36 studies (Kennedy 2010), one included 61 studies (Van Eerd 2016), and one included 28 studies Verbeek 2019. Another review that was somewhat comparable to the current review, included workplace interventions in general among office workers only, and included 15 studies (Hoe 2018).
The review of Waongenngarm 2018 aimed to evaluate the effect of breaks on low back pain, discomfort and work productivity in office workers. The study included studies that were published in English, investigated office workers only, and did not set strict restrictions on the study design resulting in included studies being both RCTs and non‐RCTs. Since they used relatively few key words to search through the databases, they may have failed to include studies that we included in the current review. The authors concluded that there was low‐quality evidence supporting the effectiveness of breaks on discomfort prevention and moderate‐quality evidence that breaks had no adverse effect on work productivity. The four studies that were included in the current review under different work‐break frequencies, were also among the eleven studies included in the review of Waongenngarm 2018. However, due to the additional seven studies, which were mainly laboratory studies or field RCTs also including symptomatic workers, the results of their meta‐analyses, that there was low‐quality evidence that breaks were effective in preventing discomfort, were different from those of the current review.
In Boocock 2007, the aim was to evaluate the effect of primary, secondary and tertiary interventions on upper extremity musculoskeletal disorders. Studies were included when they were published in English, were published between 1999 and 2004 and included follow‐up periods of two months or longer. The latter criterion is the main reason that Boocock 2007 included a completely different pool of RCTs and non‐RCTs. Therefore, it is difficult to compare the conclusions of Boocock 2007 with the current review, since they did not include a category of work breaks based on their 31 included studies.
In the review of Kennedy 2010, the primary aim was to evaluate whether occupational health and safety interventions had an effect on upper extremity musculoskeletal symptoms, signs, disorders, injuries, claims and lost time. Their secondary aim was to evaluate which types of occupational health and safety interventions were effective. The authors used a broad search strategy, as was used in the current review. One of the intervention categories evaluated in the review of Kennedy 2010 was 'rest breaks', which included four studies. Three of the studies were similar to the ones we included (Galinsky 2000; Galinsky 2007; McLean 2001). However, the fourth RCT that was included by Kennedy 2010 was excluded by us during our full‐text screening phase, because the investigated study population contained symptomatic workers, which we used as an exclusion criterion (Van den Heuvel 2003). The conclusion of the review of Kennedy 2010 was that limited evidence supported a positive effect of work breaks on upper extremity musculoskeletal outcomes. They furthermore concluded that there was insufficient evidence to support the possibility that active breaks may have a positive effect on upper extremity outcomes. Although they restricted their intervention effect to the upper extremity instead of the whole body, the conclusions are comparable and support the need for high‐quality studies about work‐break interventions for preventing musculoskeletal symptoms and disorders. In line with our review, the work populations studied in the included RCTs and non‐RCTs of Kennedy 2010 consisted mainly of office workers. Given this limitation, we propose that the effectiveness of different work‐break interventions in other work settings be investigated as well, possibly as a combined intervention to increase its effectiveness.
The aim of the review of Verbeek 2019 was to provide an overview of a wide range of interventions for improving recovery from cognitive and physical work, for which the authors used an exhaustive study inclusion process. Seven categories of interventions were formed and grouped into person‐directed and work‐directed interventions. Work breaks were considered a work‐directed intervention, to which four of the 28 included studies were assigned. None of these four studies were included in the current review, because they either used a study design other than an RCT (Beynon 2000; Mathiassen 1996), included the wrong outcomes (Oude Hengel 2012) or the wrong patient population (Lim 2016). From the four work‐break studies, the review authors reported that longer breaks are suggested as being beneficial for increasing work recovery based on the work physiology theory. Although this scoping review could not comment on the effectiveness of workplace interventions, it provides a nice overview of different types of interventions aimed at increasing recovery from work and it provides encouragement for future studies that are suggested to focus on the development and improvement of the different types of interventions, including work breaks. Due to the different approach used in the scoping review of Verbeek 2019, their conclusions cannot be compared with the interpretations coming from the current review.
The review of Van Eerd 2016 aimed to evaluate the effect of workplace interventions to prevent upper extremity musculoskeletal disorders. They searched for studies eligible for inclusion and set restrictions on the outcome measures, which had to be related to the upper extremity and to the publication language, which had to be English. Both RCT and non‐RCT designs were allowed. The one intervention category evaluated in the review of Van Eerd 2016 that may be comparable to the current review, is the stretching exercise program, within which six studies were included. One of those six studies was also included in the current review (Galinsky 2000); the other five studies reported effects of interventions other than break interventions, were non‐RCTs, or included symptomatic workers. The different included studies have resulted in the different conclusion developed by Van Eerd 2016, that there is moderate‐quality evidence for stretching exercise programmes having a positive effect on preventing upper extremity musculoskeletal disorders.
In Hoe 2018, the goal was to evaluate the effect of interventions on preventing work‐related musculoskeletal disorders in office workers. The databases searched were similar to those searched in the current review; however, the search string used by Hoe 2018 was rather narrow compared to the current review. During their study selection process, Hoe 2018 included studies that used a randomised controlled design, assessed office workers only, evaluated interventions performed in the workplace examining a physical, organisational or cognitive ergonomic intervention, and measured outcomes related to the neck and upper extremity or work‐related function and productivity. Hoe 2018 included four studies in the category organisational ergonomic interventions, three of which were included also in the current review. The fourth included study evaluated a biofeedback intervention which interrupted the work flow at the computer but did not provide a work break as based on our criteria, including a moment of non‐work (King 2013). The conclusion of Hoe 2018 with respect to organisational ergonomic interventions was that they found low‐quality evidence that supplementary breaks may reduce self‐reported discomfort. This trend is similar to our review, but the confidence intervals of the single outcomes per study did not show statistical significance, which may have resulted in the different final conclusion.
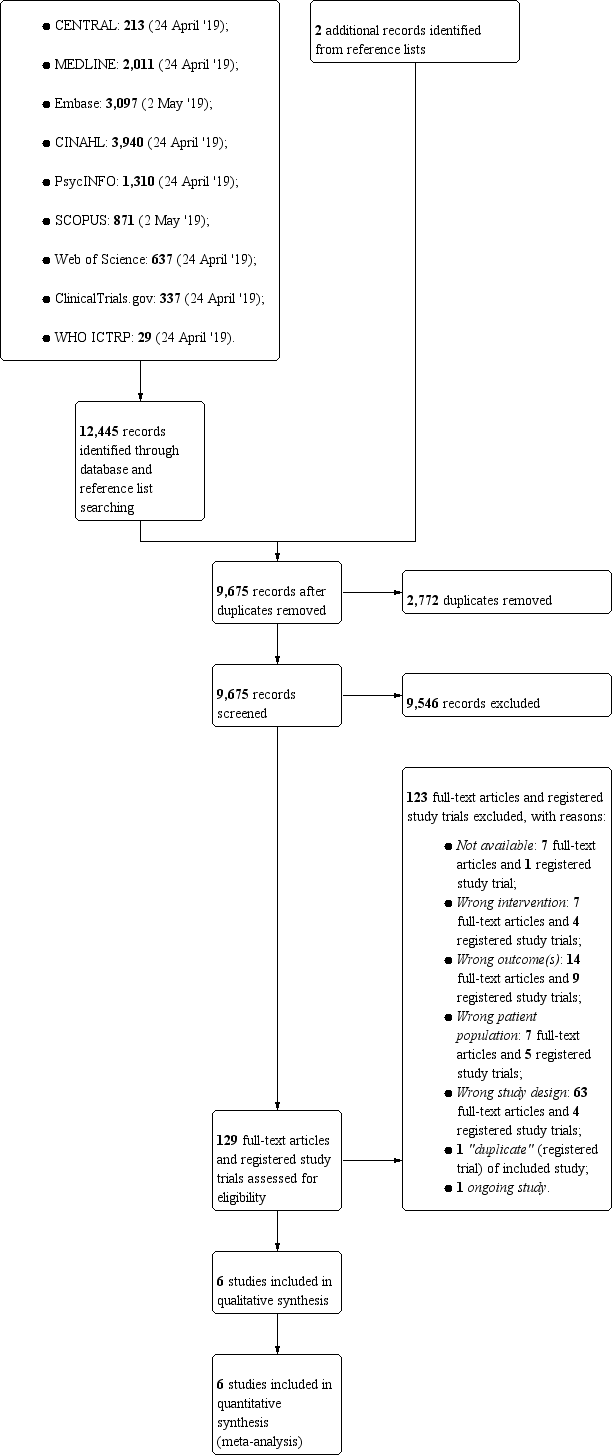
Study flow diagram.

Risk of bias graph: review authors' judgements about each risk of bias item presented as percentages across all included studies.
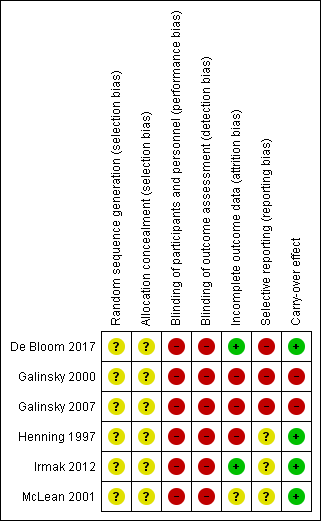
Risk of bias summary: review authors' judgements about each risk of bias item for each included study.

Comparison 1 Additional work breaks versus no additional work breaks, Outcome 1 Participant‐reported musculoskeletal pain, discomfort or fatigue (follow‐up 4 or 10 weeks).

Comparison 1 Additional work breaks versus no additional work breaks, Outcome 2 Productivity or work performance (follow‐up 4 or 10 weeks).
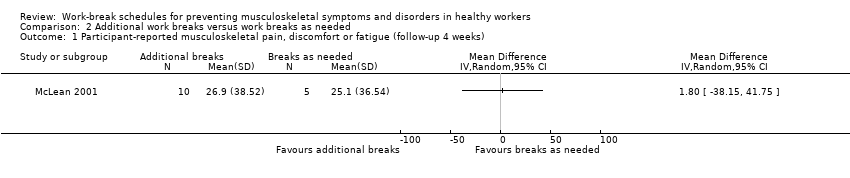
Comparison 2 Additional work breaks versus work breaks as needed, Outcome 1 Participant‐reported musculoskeletal pain, discomfort or fatigue (follow‐up 4 weeks).

Comparison 2 Additional work breaks versus work breaks as needed, Outcome 2 Productivity or work performance (follow‐up 4 weeks).

Comparison 3 Additional higher frequency work breaks versus additional lower frequency work breaks, Outcome 1 Participant‐reported musculoskeletal pain, discomfort or fatigue (follow‐up 4 weeks).

Comparison 3 Additional higher frequency work breaks versus additional lower frequency work breaks, Outcome 2 Productivity or work performance (follow‐up 4 weeks).

Comparison 4 Active work breaks versus passive work breaks, Outcome 1 Participant‐reported musculoskeletal pain, discomfort or fatigue (follow‐up 5 weeks).

Comparison 5 Relaxation work breaks versus physical work breaks, Outcome 1 Participant‐reported musculoskeletal pain, discomfort or fatigue (follow‐up 5 weeks).
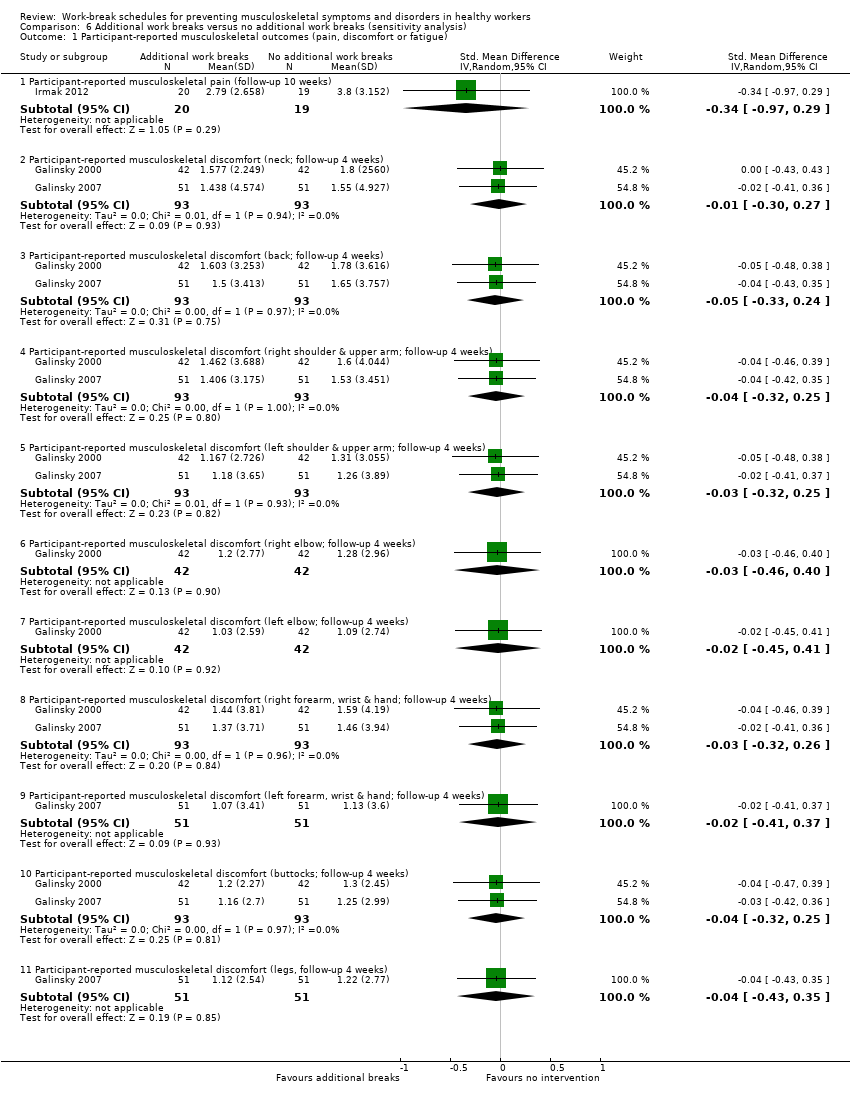
Comparison 6 Additional work breaks versus no additional work breaks (sensitivity analysis), Outcome 1 Participant‐reported musculoskeletal outcomes (pain, discomfort or fatigue).

Comparison 6 Additional work breaks versus no additional work breaks (sensitivity analysis), Outcome 2 Productivity or work performance.
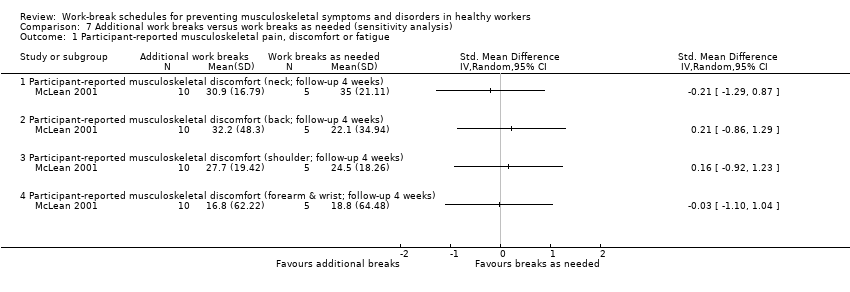
Comparison 7 Additional work breaks versus work breaks as needed (sensitivity analysis), Outcome 1 Participant‐reported musculoskeletal pain, discomfort or fatigue.

Comparison 8 Additional higher frequency work breaks versus additional lower frequency work breaks (sensitivity analysis), Outcome 1 Participant‐reported musculoskeletal pain, discomfort or fatigue.
| Additional work breaks compared to no additional work breaks for preventing musculoskeletal symptoms and disorders in workers | ||||||
| Patient or population: office workers | ||||||
| Outcomes | Anticipated absolute effects* (95% CI) | Relative effect | № of participants | Certainty of the evidence | Comments | |
| Assumed risk | Corresponding risk | |||||
| No additional work breaks | Additional work breaks | |||||
| Participant‐reported musculoskeletal pain, discomfort or fatigue Method: 0‐100 mm VAS or 1‐5 NRS Follow‐up: 4 or 10 weeks | The mean participant‐reported musculoskeletal pain, discomfort or fatigue (4 or 10 weeks) ranged across control groups from 1.38 ‐ 3.801 | The mean after shift/after intervention participant‐reported musculoskeletal pain, discomfort or fatigue (4 or 10 weeks) 0.08 standard deviations lower (0.35 lower to 0.18 higher) | ‐ | 225 | ⊕⊕⊝⊝ | |
| Productivity or work performance Method: total number of documents entered per day, or keystrokes per hour, or WRFQ Follow‐up: 4 or 10 weeks | The mean productivity or work performance (4 or 10 weeks) ranged across control groups from ‐4.25 ‐ 209.092 | The mean after shift/after intervention productivity or work performance (4 or 10 weeks) was 0.07 standard deviations lower (0.33 lower to 0.19 higher) | ‐ | 225 | ⊕⊝⊝⊝ | |
| *The risk in the intervention group (and its 95% confidence interval) is based on the assumed risk in the comparison group and the relative effect of the intervention (and its 95% CI). | ||||||
| GRADE Working Group grades of evidence | ||||||
| NRS: Numeric Rating Scale. 1 Data include estimates based on Table 2 and Figure 2 in Galinsky 2000 and Figure 1 in Galinsky 2007. 2 Data include estimates based on Section 3.3 in Galinsky 2000 and Section Data Entry Performance > Rest break schedule in Galinsky 2007. 3 Downgraded one level because of a potential risk of bias. 4 Downgraded one level because the total number of participants was less than 300 (small sample size for a continuous variable). 5 Downgraded one level because of surrogate outcome that is not important in itself but assumed indirectly important for the intervention's evaluation. | ||||||
| Additional work breaks compared to work breaks as needed for preventing musculoskeletal symptoms and disorders in workers | ||||||
| Patient or population: office workers | ||||||
| Outcomes | Anticipated absolute effects* (95% CI) | Relative effect | № of participants | Certainty of the evidence | Comments | |
| Assumed risk | Corresponding risk | |||||
| Work breaks as needed | Additional work breaks | |||||
| Participant‐reported musculoskeletal pain, discomfort or fatigue Method: 0‐100 mm VAS Follow‐up: 4 weeks | The mean participant‐reported musculoskeletal pain, discomfort or fatigue (4 weeks) was 25.10 | The mean after intervention participant‐reported musculoskeletal pain, discomfort or fatigue (4 weeks) in the intervention group was 1.80 higher (38.15 lower to 41.75 higher) | ‐ | 15 | ⊕⊝⊝⊝ | |
| Productivity or work performance Method: number of words typed per 3 hours Follow‐up: 4 weeks | The mean productivity or work performance (4 weeks) was ‐317.00 compared to no breaks | The mean after intervention productivity or work performance (4 weeks) in the intervention group was 542.50 higher (177.22 higher to 907.78 higher) | ‐ | 15 | ⊕⊝⊝⊝ | |
| *The risk in the intervention group (and its 95% confidence interval) is based on the assumed risk in the comparison group and the relative effect of the intervention (and its 95% CI). | ||||||
| GRADE Working Group grades of evidence | ||||||
| VAS: Visual Analogue Scale. 2 Downgraded two levels because the total number of participants was less than 50 (small sample size for a continuous variable) and because of low precision of the effect estimate (0.5 was included in the 95% CI of the SMD). 3 Downgraded one level because of surrogate outcome that was not important in itself but assumed indirectly important for the intervention's evaluation. | ||||||
| Additional higher frequency work breaks compared to additional lower frequency work breaks for preventing musculoskeletal symptoms and disorders in workers | ||||||
| Patient or population: office workers | ||||||
| Outcomes | Anticipated absolute effects* (95% CI) | Relative effect | № of participants | Certainty of the evidence | Comments | |
| Assumed risk | Corresponding risk | |||||
| Additional lower frequency work breaks | Additional higher frequency work breaks | |||||
| Participant‐reported musculoskeletal pain, discomfort or fatigue Method: 0‐100 mm VAS Follow‐up: 4 weeks | The mean participant‐reported musculoskeletal pain, discomfort or fatigue (4 weeks) was 21.08 | The mean after intervention participant‐reported musculoskeletal pain, discomfort or fatigue (4 weeks) was 11.65 higher (41.07 lower to 64.37 higher) | ‐ | 10 | ⊕⊝⊝⊝ | |
| Productivity or work performance Method: number of words typed per 3 hours Follow‐up: 4 weeks | The mean productivity or work performance (4 weeks) was 267.00 compared to no breaks | The mean after intervention productivity or work performance (4 weeks) in the intervention group was 83.00 lower (305.27 lower to 139.27 higher) | ‐ | 10 | ⊕⊝⊝⊝ | |
| *The risk in the intervention group (and its 95% confidence interval) is based on the assumed risk in the comparison group and the relative effect of the intervention (and its 95% CI). | ||||||
| GRADE Working Group grades of evidence | ||||||
| VAS: Visual Analogue Scale. 2 Downgraded two levels because the total number of participants was less than 25 (small sample size for a continuous variable) and because of low precision of the effect estimate (0.5 was included in the 95% CI of the SMD). 3 Downgraded one level because of surrogate outcome that was not important in itself but assumed indirectly important for the intervention's evaluation. | ||||||
| Active work breaks compared to passive work breaks for preventing musculoskeletal symptoms and disorders in workers | ||||||
| Patient or population: office workers | ||||||
| Outcomes | Anticipated absolute effects* (95% CI) | Relative effect | № of participants | Certainty of the evidence | Comments | |
| Assumed risk | Corresponding risk | |||||
| Passive work breaks | Active work breaks | |||||
| Participant‐reported musculoskeletal pain, discomfort or fatigue Method: 1‐7 NRS Follow‐up: 5 weeks | The mean participant‐reported musculoskeletal pain, discomfort or fatigue (5 weeks) was 4.15 | The mean difference after intervention participant‐reported musculoskeletal pain, discomfort or fatigue (5 weeks) in the intervention group was 0.17 lower (0.71 lower to 0.37 higher) | ‐ | 153 | ⊕⊕⊝⊝ | |
| *The risk in the intervention group (and its 95% confidence interval) is based on the assumed risk in the comparison group and the relative effect of the intervention (and its 95% CI). | ||||||
| GRADE Working Group grades of evidence | ||||||
| NRS: Numeric Rating Scale. 2 Downgraded one level because the total number of participants was less than 200 (small sample size for a continuous variable). | ||||||
| Relaxation work breaks compared to physical work breaks for preventing musculoskeletal symptoms and disorders in workers | ||||||
| Patient or population: office workers | ||||||
| Outcomes | Anticipated absolute effects* (95% CI) | Relative effect | № of participants | Certainty of the evidence | Comments | |
| Assumed risk | Corresponding risk | |||||
| Physical work breaks | Relaxation work breaks | |||||
| Participant‐reported musculoskeletal pain ,discomfort or fatigue Method: 1‐7 NRS Follow‐up: 5 weeks | The mean participant‐reported musculoskeletal pain, discomfort or fatigue (5 weeks) was 3.88 | The mean difference after intervention participant‐reported musculoskeletal pain, discomfort or fatigue (5 weeks) in the intervention group was 0.20 higher (0.43 lower to 0.82 higher) | ‐ | 97 | ⊕⊕⊝⊝ | |
| *The risk in the intervention group (and its 95% confidence interval) is based on the assumed risk in the comparison group and the relative effect of the intervention (and its 95% CI). | ||||||
| GRADE Working Group grades of evidence | ||||||
| NRS: Numeric Rating Scale. 2 Downgraded one level because the total number of participants was less than 100 (small sample size for a continuous variable). | ||||||
| Outcome or subgroup title | No. of studies | No. of participants | Statistical method | Effect size |
| 1 Participant‐reported musculoskeletal pain, discomfort or fatigue (follow‐up 4 or 10 weeks) Show forest plot | 3 | 225 | Std. Mean Difference (IV, Random, 95% CI) | ‐0.08 [‐0.35, 0.18] |
| 2 Productivity or work performance (follow‐up 4 or 10 weeks) Show forest plot | 3 | 225 | Std. Mean Difference (IV, Random, 95% CI) | ‐0.07 [‐0.33, 0.19] |
| Outcome or subgroup title | No. of studies | No. of participants | Statistical method | Effect size |
| 1 Participant‐reported musculoskeletal pain, discomfort or fatigue (follow‐up 4 weeks) Show forest plot | 1 | Mean Difference (IV, Random, 95% CI) | Totals not selected | |
| 2 Productivity or work performance (follow‐up 4 weeks) Show forest plot | 1 | Mean Difference (IV, Random, 95% CI) | Totals not selected | |
| Outcome or subgroup title | No. of studies | No. of participants | Statistical method | Effect size |
| 1 Participant‐reported musculoskeletal pain, discomfort or fatigue (follow‐up 5 weeks) Show forest plot | 1 | Mean Difference (IV, Random, 95% CI) | Totals not selected | |
| Outcome or subgroup title | No. of studies | No. of participants | Statistical method | Effect size |
| 1 Participant‐reported musculoskeletal pain, discomfort or fatigue (follow‐up 5 weeks) Show forest plot | 1 | Mean Difference (IV, Random, 95% CI) | Totals not selected | |
| Outcome or subgroup title | No. of studies | No. of participants | Statistical method | Effect size |
| 1 Participant‐reported musculoskeletal outcomes (pain, discomfort or fatigue) Show forest plot | 3 | Std. Mean Difference (IV, Random, 95% CI) | Subtotals only | |
| 1.1 Participant‐reported musculoskeletal pain (follow‐up 10 weeks) | 1 | 39 | Std. Mean Difference (IV, Random, 95% CI) | ‐0.34 [‐0.97, 0.29] |
| 1.2 Participant‐reported musculoskeletal discomfort (neck; follow‐up 4 weeks) | 2 | 186 | Std. Mean Difference (IV, Random, 95% CI) | ‐0.01 [‐0.30, 0.27] |
| 1.3 Participant‐reported musculoskeletal discomfort (back; follow‐up 4 weeks) | 2 | 186 | Std. Mean Difference (IV, Random, 95% CI) | ‐0.05 [‐0.33, 0.24] |
| 1.4 Participant‐reported musculoskeletal discomfort (right shoulder & upper arm; follow‐up 4 weeks) | 2 | 186 | Std. Mean Difference (IV, Random, 95% CI) | ‐0.04 [‐0.32, 0.25] |
| 1.5 Participant‐reported musculoskeletal discomfort (left shoulder & upper arm; follow‐up 4 weeks) | 2 | 186 | Std. Mean Difference (IV, Random, 95% CI) | ‐0.03 [‐0.32, 0.25] |
| 1.6 Participant‐reported musculoskeletal discomfort (right elbow; follow‐up 4 weeks) | 1 | 84 | Std. Mean Difference (IV, Random, 95% CI) | ‐0.03 [‐0.46, 0.40] |
| 1.7 Participant‐reported musculoskeletal discomfort (left elbow; follow‐up 4 weeks) | 1 | 84 | Std. Mean Difference (IV, Random, 95% CI) | ‐0.02 [‐0.45, 0.41] |
| 1.8 Participant‐reported musculoskeletal discomfort (right forearm, wrist & hand; follow‐up 4 weeks) | 2 | 186 | Std. Mean Difference (IV, Random, 95% CI) | ‐0.03 [‐0.32, 0.26] |
| 1.9 Participant‐reported musculoskeletal discomfort (left forearm, wrist & hand; follow‐up 4 weeks) | 1 | 102 | Std. Mean Difference (IV, Random, 95% CI) | ‐0.02 [‐0.41, 0.37] |
| 1.10 Participant‐reported musculoskeletal discomfort (buttocks; follow‐up 4 weeks) | 2 | 186 | Std. Mean Difference (IV, Random, 95% CI) | ‐0.04 [‐0.32, 0.25] |
| 1.11 Participant‐reported musculoskeletal discomfort (legs, follow‐up 4 weeks) | 1 | 102 | Std. Mean Difference (IV, Random, 95% CI) | ‐0.04 [‐0.43, 0.35] |
| 2 Productivity or work performance Show forest plot | 3 | Std. Mean Difference (IV, Random, 95% CI) | Subtotals only | |
| 2.1 Productivity or work performance (WRFQ, follow‐up 10 weeks) | 1 | 39 | Std. Mean Difference (IV, Random, 95% CI) | 0.39 [‐0.24, 1.03] |
| 2.2 Productivity or work performance (keystrokes per hour; follow‐up 4 weeks) | 2 | 186 | Std. Mean Difference (IV, Random, 95% CI) | 0.01 [‐0.27, 0.30] |
| 2.3 Productivity or work performance (entered documents per day; follow‐up 4 weeks) | 2 | 186 | Std. Mean Difference (IV, Random, 95% CI) | ‐0.01 [‐0.29, 0.28] |
| Outcome or subgroup title | No. of studies | No. of participants | Statistical method | Effect size |
| 1 Participant‐reported musculoskeletal pain, discomfort or fatigue Show forest plot | 1 | Std. Mean Difference (IV, Random, 95% CI) | Totals not selected | |
| 1.1 Participant‐reported musculoskeletal discomfort (neck; follow‐up 4 weeks) | 1 | Std. Mean Difference (IV, Random, 95% CI) | 0.0 [0.0, 0.0] | |
| 1.2 Participant‐reported musculoskeletal discomfort (back; follow‐up 4 weeks) | 1 | Std. Mean Difference (IV, Random, 95% CI) | 0.0 [0.0, 0.0] | |
| 1.3 Participant‐reported musculoskeletal discomfort (shoulder; follow‐up 4 weeks) | 1 | Std. Mean Difference (IV, Random, 95% CI) | 0.0 [0.0, 0.0] | |
| 1.4 Participant‐reported musculoskeletal discomfort (forearm & wrist; follow‐up 4 weeks) | 1 | Std. Mean Difference (IV, Random, 95% CI) | 0.0 [0.0, 0.0] | |