Tourniquet use for knee replacement surgery
Abstract
Background
Many surgeons prefer to perform total knee replacement surgery with the aid of a tourniquet. A tourniquet is an occlusive device that restricts distal blood flow to help create a bloodless field during the procedure. A tourniquet may be associated with increased risk of pain and complications.
Objectives
To determine the benefits and harms of tourniquet use in knee replacement surgery.
Search methods
We searched MEDLINE, Embase, and Cochrane Central Register of Controlled Trials (CENTRAL) up to 26 March 2020. We searched clinicaltrials.gov, the World Health Organization trials portal, and several international registries and joint registries up to March 2020.
Selection criteria
We included randomised controlled trials (RCTs) comparing knee replacement with use of a tourniquet versus without use of a tourniquet and non‐randomised studies with more than 1000 participants. Major outcomes included pain, function, global assessment of success, health‐related quality of life, serious adverse events (including venous thromboembolism, infection, re‐operation, and mortality), cognitive function, and survival of the implant. Minor outcomes included blood loss, economic outcomes, implant stability, and adverse events.
Data collection and analysis
Two review authors screened abstracts and full texts, extracted data, performed risk of bias assessments, and assessed the certainty of the evidence using the GRADE approach.
Main results
We included 41 RCTs with 2819 participants. Trials included from 20 to 199 participants. Mean age ranged between 58 and 84 years. More than half of the RCTs had unclear risk of selection bias and unclear risk of performance and detection bias due to absence of blinding of participants and surgeons.
Major outcomes
Pain: at postoperative day 1, pain (on a scale from zero to 10, with higher scores indicating worse pain) was ranked at 4.56 points after surgery without a tourniquet and at 1.25 points (MD) higher (95% CI 0.32 higher to 2.19 higher) with a tourniquet (8 studies; 577 participants), for an absolute difference of 12.5% higher pain scores (95% CI 3.2% higher to 21.9% higher) and a relative difference of 19% higher pain scores (95% CI 3.4% higher to 49% higher) with a tourniquet. Evidence for these findings was of moderate certainty, downgraded due to risk of bias. Knee replacement with a tourniquet probably led to higher postoperative pain scores at day 1, although this difference may or may not be noticeable to patients (based on a minimal clinically important difference (MCID) of 1.0).
Function: at 12 months, tourniquet use probably makes little or no difference to function, based on an MCID of 5.3 for Knee Society Score (KSS) and 5.0 for Oxford Knee Score (OKS). Mean function (on a scale from 0 to 100, with higher scores indicating better outcomes) was 90.03 points after surgery without a tourniquet and was 0.29 points worse (95% CI 1.06 worse to 0.48 better) on a 0 to 100 scale, absolute difference was 0.29% worse (1.06% worse to 0.48% better), with a tourniquet (5 studies; 611 participants). This evidence was downgraded to moderate certainty due to risk of bias.
Global assessment of success: low‐certainty evidence (downgraded due to bias and imprecision) indicates that tourniquet use may have little or no effect on success. At six months, 47 of 50 (or 940 per 1000) reported overall successful treatment after surgery without a tourniquet and 47 of 50 (or 940 per 1000) with a tourniquet (risk ratio (RR) 1.0, 95% CI 0.91 to 1.10) based on one study with 100 participants.
Health‐related quality of life: at six months, tourniquet may have little or no effect on quality of life. The 12‐Item Short Form Survey (SF‐12) score (mental component from zero to 100 (100 is best)) was 54.64 after surgery without a tourniquet and 1.53 (MD) better (95% CI 0.85 worse to 3.91 better) with a tourniquet (1 study; 199 participants); absolute difference was 1.53% better (0.85% worse to 3.91% better). Evidence was of low certainty, downgraded due to risk of bias and small number of participants.
Serious adverse events: the risk of serious adverse events was probably higher with tourniquet; 26 of 898 (29 per 1000) reported events following surgery without a tourniquet compared to 53 of 901 (59 per 1000) with a tourniquet (RR 1.73, 95% CI 1.10 to 2.73) in 21 studies (1799 participants). Twenty‐nine more per 1000 patients (95% CI 3 to 50 more per 1000 patients) had a serious adverse event with a tourniquet. Forty‐eight (95% CI 20 to 345) participants would need to have surgery without a tourniquet to avoid one serious adverse event. This evidence was downgraded to moderate certainty due to risk of bias.
Cognitive function: one study reported cognitive function as an outcome; however the data were incompletely reported and could not be extracted for analysis.
Survival of implant: it is uncertain if tourniquet has an effect on implant survival due to very low certainty evidence (downgraded for bias, and twice due to very low event rates); 2 of 107 (19 per 1000) required revision surgery in the surgery with a tourniquet group compared to 1 of 107 (9 per 1000) without a tourniquet group at up to two years' follow‐up (RR 1.44, 95% CI 0.23 to 8.92). This equates to a 0.4% (0.7% lower to 7% more) increased absolute risk in surgery with a tourniquet.
Authors' conclusions
Moderate certainty evidence shows that knee replacement surgery with a tourniquet is probably associated with an increased risk of serious adverse events. Surgery with a tourniquet is also probably associated with higher postoperative pain, although this difference may or may not be noticeable to patients. Surgery with a tourniquet does not appear to confer any clinically meaningful benefit on function, treatment success or quality of life. Further research is required to explore the effects of tourniquet use on cognitive function and implant survival, to identify any additional harms or benefits.
If a tourniquet continues to be used in knee replacement surgery, patients should be informed about the potential increased risk of serious adverse events and postoperative pain.
PICO
Plain language summary
What are the benefits and risks of using a tourniquet in knee replacement surgery?
Why is this question important?
Knee replacement is a common operation that involves replacing a damaged, worn, or diseased knee with an artificial joint made of metal and plastic.
Most surgeons prefer to carry out knee replacement surgery with the aid of a tourniquet ‐ a tight band placed around the thigh that restricts blood flow to the knee.
Potential benefits of using a tourniquet include limiting blood loss during surgery and making it easier to conduct the operation. However, a tourniquet may increase the risk of pain and complications for patients after surgery. We reviewed evidence from research studies to find out about the benefits and risks of using a tourniquet in knee replacement surgery.
How did we identify and evaluate the evidence?
First, we searched for relevant, robust studies in the medical literature. We then compared the results and summarised the evidence from all studies. Finally, we assessed how certain the evidence was. To do this, we considered factors such as the way studies were conducted, study size, and consistency of findings across studies. Based on our assessments, we categorised the evidence as being of very low, low, moderate, or high certainty.
What did we find?
We found 41 studies that involved 2819 people (944 men and 1777 women) who were randomly assigned to have surgery with a tourniquet, or surgery without. This type of study, known as a randomised controlled trial, provides the most robust evidence about the effects of a treatment.
Studies were conducted in hospitals in Australia, Asia, Europe, and the USA. Each study involved between 20 and 166 people who were between 58 and 84 years of age. They were followed for between one day and two years after surgery.
Five studies were publicly funded, and one study received funding from a medical equipment manufacturing company. The other 35 studies did not receive specific funding or did not state who funded them.
The studies provided low to moderate evidence that:
‐ pain on the first day after surgery is probably worse with a tourniquet. On average, on a scale of 0 to 10 (higher scores = worse pain), people operated on with a tourniquet rated their pain as 5.81. People operated on without a tourniquet rated their pain as 4.56 (average difference: 1.25 points);
‐ knee function one year after surgery is probably similar with or without a tourniquet. On average, on a scale of 0 to 100 (higher scores = better functioning), people operated on with a tourniquet rated their knee function as 89.74. People operated on without a tourniquet rated their knee function as 90.03 (average difference: 0.29 points);
‐ satisfaction with treatment may be similar with or without a tourniquet. Six months after the operation, 94% of people operated on with or without a tourniquet were 'extremely' or 'very' satisfied with their treatment;
‐ there may be little or no difference in health‐related quality of life with or without a tourniquet. On average, on a scale of 0 to 100 (higher scores = better quality of life), people operated on with a tourniquet rated their quality of life as 54.64. People who had surgery without a tourniquet rated their quality of life as 56.17 (average difference: 1.53 points); and
‐ serious adverse events such as blood clots in the leg or lung, infection, or re‐operation other than to replace the artificial joint are probably more likely to occur with a tourniquet. Five per cent of people operated on with a tourniquet reported serious adverse events compared to 2.9% of people operated on without a tourniquet.
We do not know if using a tourniquet affects chances of needing a second operation to replace an artificial joint because available evidence is of very low certainty.
No studies investigated the effects of surgery with a tourniquet on people’s ability to process thoughts (cognitive function).
What does this mean?
Knee replacement with a tourniquet is probably slightly less beneficial, and is associated with greater risks, than surgery without a tourniquet.
How up‐to‐date is this review?
Evidence in this Cochrane Review is current to March 2020.
Authors' conclusions
Summary of findings
| Participants: patients undergoing knee replacement surgery Settings: hospitals around the world performing knee replacement surgery Intervention: surgery performed with a tourniquet for all or part of the procedure Comparator: surgery performed without a tourniquet | ||||||
|---|---|---|---|---|---|---|
| Outcomes | Anticipated absolute effects* | Relative effect (95% CI) | No. of participants | Certainty of the evidence | Comments | |
| Risk without tourniquet | Risk with tourniquet | |||||
| Pain Visual analogue scale (VAS) for pain from zero to 10 (higher scores indicate more pain) Follow‐up day 1 postoperative pain scores | Mean pain was 4.56 | MD 1.25 worse pain | ‐ | 577 (8 RCTs) | ⊕⊕⊕⊝ | Knee replacement with a tourniquet led to higher postoperative pain scores at day 1, although this difference may or may not be noticeable to patients b Absolute difference 12.5% worse (3.2% worse to 21.9% worse) Relative difference 19% worse (3.4% worse to 49% worse)c |
| Function Similar 0 to 100 scales (100 is best) were used to measure the same conceptual functional outcome: Knee Injury and Osteoarthritis Outcome Score Activities of Daily Living (KOOS‐ADL); Knee Society Score (KSS); Hospital for Special Surgery Score (HSS) Follow‐up 12 months | Mean function was 90.03 | MD 0.29 worse function (1.06 worse to 0.48 better)d | ‐ | 611 (5 RCTs) | ⊕⊕⊕⊝ MODERATEa | Knee replacement with tourniquet probably has little or no meaningful effect on function b Absolute difference 0.29% worse (1.06% worse to 0.48% better) Relative difference 0.57% worse (2.07% worse to 0.94% better)c |
| Global assessment of success Participants reporting overall successful treatment and satisfactione Follow‐up 6 months | 940 per 1000 | 940 per 1000 (855 to 1034) | RR 1.0 (0.91 to 1.10) | 100 (1 RCT) | ⊕⊕⊝ LOWa,f | Number of participants reporting success may not differ Absolute difference 0% (8.5% worse to 9.4% better) Relative difference 0% (9% worse to 10% better) |
| Health‐related quality of life SF‐12 mental component from zero to 100 (100 is best) Follow‐up 6 months | Mean health‐related quality of life was 54.64 | MD 1.53 better (0.85 worse to 3.91 better) | 199 | ⊕⊕⊝ | Knee replacement with tourniquet may have little or no meaningful effect on health‐related quality of lifeb Absolute difference 1.53% better (0.85% worse to 3.91% better) Relative difference 3% better (2% worse to 7% better)c | |
| Serious adverse events | 29 per 1000 | 59 per 1000 (32 to 79) | RR 1.73 | 1799 | ⊕⊕⊕⊝ | Knee replacement with tourniquet probably has a meaningful effect on risk of serious adverse events Absolute difference 2.1% more (0.29% more to 5.00% more)g Relative difference 73% (10% more to 173% more) Number needed to harm (NNTH) is 48 (20 to 345) participants to have surgery with a tourniquet for 1 serious adverse event (venous thromboembolism, infection, or re‐operation) |
| Cognitive function | ‐ | ‐ | ‐ | ‐ | ‐ | No studies with adequate data |
| Survival of the implant Risk of revision At 1 year | 9 per 1000 | 13 per 1000 (2 to 83) | RR 1.44 (0.23 to 8.92) | 214 | ⊕⊕⊕⊝ | It is uncertain if knee replacement has an effect on survival of implant at 1 year Absolute difference 0.4% more (0.7% less to 7% more) in the surgery with a tourniquet group Relative difference 44% more (77% lower to 892% more) in the surgery with a tourniquet group |
| *The risk in the intervention group (and its 95% confidence interval) is based on the assumed risk in the comparison group and the relative effect of the intervention (and its 95% CI). | ||||||
| GRADE Working Group grades of evidence. | ||||||
| aDowngraded by one level due to risk of bias. Many studies had unclear risk of allocation concealment and unclear risk of participant blinding. bWe assumed that clinically important improvement was 1 point or 10% absolute improvement for pain on a VAS (0 to 10) (Dworkin 2008; Kelly 2001; Wall 2017); 5.3 points or 5.3% absolute improvement in KSS for function (Chean Lee 2017), and 10 points or 10% absolute improvement for health‐related quality of life. cRelative changes calculated relative to baseline in the surgery with a tourniquet group (i.e. absolute change (mean difference) divided by mean at baseline in the surgery without a tourniquet group from Liu 2017 b (values were 6.54 points on a 0 to 10 point VAS scale for pain and 51.3 on a 0 to 100 point KSS scale for function) and Goel 2019 (values were 54.64 on a 0 to 100 point SF‐12 mental component score for continuous outcomes). dThe mean difference was calculated by multiplying the SMD by the baseline SD (4.8) of the control group (Liu 2017 b). eParticipant satisfaction was derived from one study (Huang 2017). Satisfaction was defined as the number of participants who were 'extremely' or 'very' satisfied with their treatment. fDowngraded by one level due to imprecision. Small total number of participants. Not enough information to calculate effect estimate precisely. gConfidence intervals around absolute risk demonstrated an effect equal to or greater than 0.29%, which was deemed to be highly clinically relevant given the seriousness of the outcome. The total number of events was low; however, this was expected, and we did not downgrade for imprecision, as this was is in line with previous literature on SAEs (Benjamin 2016), which reported an incidence of VTE of 2.4% in patients undergoing TKR. Our results therefore do not indicate a 'low' total number of events for this outcome of interest. hDowngraded again due to very serious imprecision (only three events reported across the studies). | ||||||
Background
Description of the condition
Knee replacement surgery is widely regarded as an established and effective surgical procedure performed for relief of pain from end‐stage arthritis (Skou 2016). During knee replacement surgery, joint surfaces are removed and are replaced with artificial components. All of the knee joint surface can be replaced (total knee replacement ‐ TKR), part of the joint can be replaced (partial knee replacement; e.g. unicondylar, patellofemoral), or a redo of an existing knee replacement can be performed (revision knee replacement). TKR is by far the most common type of knee replacement, with more than 106,000 performed in the UK in 2018 (National Joint Registry 2018; Scottish Arthroplasty Project 2019).
A 2010 survey found that 95% of surgeons in the USA use a tourniquet for knee replacement surgery (Zhang 2014), and the UK's National Joint Registry (NJR) reported that 93% of knee replacements were done with a tourniquet in 2003 (National Joint Registry 2004). A UK‐based survey conducted in 2016 demonstrated that 90% of surgeons prefer to use a tourniquet when undertaking TKR (Gibbs 2016). This preference is similar to that in other European countries; the Swedish Joint Registry reported that 90% of cases were performed with a tourniquet (The Swedish Knee Arthroplasty Register 2012).
Description of the intervention
A thigh tourniquet is an occlusive device that squeezes the upper leg and restricts distal blood flow. Using a tourniquet may help create a bloodless field during the procedure (Alcelik 2012).
Two broad types of thigh tourniquet are used for TKR surgery.
-
Inflatable/pneumatic: a cuff placed around the thigh is filled with compressed gas. Pressure in the cuff is maintained by a microprocessor and can be adjusted (Kumar 2016).
-
Non‐inflatable: a rubber or elasticated cloth ring is placed around the thigh. A device that achieves the required pressure is applied and cannot be adjusted unless it is replaced with a new device (Kumar 2016).
Before the tourniquet is applied, the leg can be elevated or exsanguinated (using a bandage or similar device), to help reduce the amount of pooled blood within the leg (Chiu 2012).
A thigh tourniquet can be used for the duration of the procedure or for part of the procedure (e.g. during cementation of the components only).
How the intervention might work
The tourniquet is designed to apply pressure to the thigh above the internal pressure of local blood vessels (limb occlusion pressure), thereby restricting both arterial and venous blood flow distally (Alcelik 2012; Gibbs 2016).
Why it is important to do this review
The effects of using a tourniquet in knee replacement surgery have already been reported in the following four systematic reviews: Alcelik 2012; Smith 2010; Tai 2011; and Zhang 2014. However, 21 additional randomised controlled trials have since been published: Alexandersson 2019; Ayik 2020; Dong 2019Ejaz 2014; Ejaz 2015; Ejaz 2015 b; Goel 2019; Harston 2015; Huang 2017; Jawhar 2015; Jawhar 2020; Kumar 2015; Liu 2014; Liu 2017; Liu 2017 b; Mori 2016; Ozkunt 2018; Vertullo 2017; Wu 2018; Zhang 2016; Zhou 2017. These newer trials have explored additional outcomes of interest including pain, function, and serious adverse events, and combining data derived from these studies will help to identify the benefits and risks of using a tourniquet.
Potential benefits of using a tourniquet
Surgical field of view
Using a tourniquet may improve the surgical field of view by limiting intraoperative blood loss (Zhang 2014).
Cementation
Most TKR components are cemented in place to hold and stabilise them in the correct position on the bone. Cement, which is initially soft when it is inserted, interdigitates into the porous bone, forming a strong bond with the bone as it sets. Some surgeons believe that using a tourniquet helps reduce bleeding from the porous bone ends and allows the soft cement to bond more effectively, thereby improving long‐term survival of the knee implant components (Grewal 1992; Pfitzner 2016).
Blood loss
One previous systematic review showed that intraoperative blood loss was reduced when a tourniquet was used (Alcelik 2012). However, when another group reviewed overall blood loss (Zhang 2014), they found no difference between intervention groups.
Potential risks of using a tourniquet
Pain and function
A tourniquet may cause pain, both during and after surgery (Abdel‐Salem 1995). In addition to pain, a tourniquet may cause bruising and swelling of the thigh muscles, which it squeezes. These muscles are important for mobilisation, thus inhibiting postoperative function and recovery.
Venous thromboembolism (VTE)
A tourniquet causes both arterial and venous stasis within the lower leg for the duration that it is inflated (typically over an hour). Thus it is possible that use of a surgical tourniquet might increase the risk of postoperative venous thromboembolism (VTE) (Tai 2011; Wauke 2002; Zhang 2014). Systematic reviews have shown that a tourniquet may increase the risk of VTE (Zhang 2014), although another review found that this increased risk was not statistically significant (Tai 2011).
Systemic emboli
VTE may not be the only thromboembolic risk associated with using a tourniquet. Systemic emboli can occur following deflation of a tourniquet (Berman 1998). Transoesophageal echocardiography has demonstrated shower‐like echogenic materials circulating from the lower limbs to the right atrium, ventricle, and pulmonary artery after release of a thigh tourniquet, as well as macroscopic emboli in the central circulation (Berman 1998). As the carotid arteries are the first branches from the aortic arch in a straight‐line orientation, some of these clots may enter the cerebral circulation. Transcranial Doppler ultrasound studies show 60% prevalence of echogenic material in the circle of Willis after a tourniquet is released and have revealed that microemboli can occur even in the absence of a patent foramen ovale (connection between left and right sides of the circulation within the heart) (Sulek 1999). The most likely route for emboli in these circumstances is through the pulmonary capillaries or the opening of other pulmonary vessels (Sulek 1999). The critical time is immediately after release of the tourniquet, when there is potential haemodynamic instability and evidence to suggest a five‐fold increase in the amount of embolic material (Huh 2012; Parmet 1998). The presence of cerebral emboli that can cause cerebral damage may explain the higher than expected prevalence of postoperative cognitive deficit following TKR surgery, which in published reports varies from 41% to 75% at seven days to 18% to 45% at three months postoperatively (Deo 2011).
Other effects
Alcelik 2012 concluded that minor complications are more common when a tourniquet is used; similarly, Zhang 2014 showed increased complications, including infection, blister, haematoma, wound oozing, bruising, nerve palsy, and re‐operation in the surgery with a tourniquet group.
Objectives
To determine the benefits and harms of tourniquet use in knee replacement surgery.
Methods
Criteria for considering studies for this review
Types of studies
Randomised
We included studies in which participants are randomised to intervention groups and studies in which allocation to interventions is quasi‐randomised (i.e. not strictly random, for example, by date of birth, hospital record number, or alternation).
Non‐randomised
Randomised studies, particularly in the field of this review, are unlikely to include more than 1000 participants. To help improve estimates of potential risks (e.g. adverse events of the intervention, many of which may be rare events (VTE approximately < 5% (Zhang 2014)), we aimed to include observational cohort studies and unselected case series of 1000 or more participants, which include concurrent comparison groups (e.g. published data from joint replacement registries). The minimum sample of 1000 was based on a previous work (Gurung 2015), which recommended this number when risks for rare events are estimated.
To minimise selection bias within non‐randomised studies, we aimed to include only studies that use statistical adjustment for baseline case mix (e.g. multi‐variable analyses to adjust for age, co‐morbidity, and type of knee replacement (total or partial, primary, or revision)).
Types of participants
We included participants who underwent knee replacement surgery for any indication, regardless of age. All types of knee replacement, including total replacement, partial replacement, and revision surgery, were included in this review.
Types of interventions
We included studies of all types of thigh tourniquet (inflatable or non‐inflatable) used for the duration or for part of knee replacement surgery. Comparators could be:
-
placebo: this may include a sham tourniquet, for example, one that is applied but is not inflated;
-
no tourniquet; or
-
alternative measures to improve the surgical field of view or to reduce intraoperative blood loss (e.g. this may include tranexamic acid).
Types of outcome measures
Major outcomes
According to the Outcome Measures in Rheumatology (OMERACT) core outcome set (Bellamy 1997), pain, function/disability, global assessment of success, and health‐related quality of life are major outcomes. We prioritised them according to previous evidence on the hierarchy of patient‐reported outcomes (Juhl 2012).
1. Pain
Measured using mean pain or mean change in pain on a visual analogue scale (VAS), a numerical rating scale, or another scale.
2. Function
Measured with instruments such as Knee Society Score (KSS), Western Ontario and McMaster Universities Arthritis Index (WOMAC), Knee Injury and Osteoarthritis Outcome Score (KOOS), Oxford Knee Score (OKS). We will extract all available function scores and will present total scores in the primary analysis and subscores as additional analyses when available.
3. Global assessment of success
As reported by the participant (e.g. proportion of participants reporting overall successful treatment and participant satisfaction).
4. Health‐related quality of life
Measured with instruments such as the 36‐Item Short Form Survey (SF‐36) or EuroQoL Group Quality of Life Questionnaire based on 5 dimensions (EQ‐5D).
5. Serious adverse events (SAEs)
A serious adverse event is an adverse event that fulfils one of more of the following criteria: results in death, is immediately life‐threatening, requires hospitalisation or prolongation of existing hospitalisation, or is an important medical condition. We screened studies to report the following SAEs: number of deaths, infection (joint or wound), nerve damage, ischaemia, VTE, systemic embolic events, and re‐operation, excluding revisions for implant failure.
6. Cognitive function
Measured with instruments such as Mini‐Mental State Examination (MMSE), Oxford Cognitive Screen (OCS), and Montreal Cognitive Assessment (MoCA).
7. Survival of the implant
Measured as revision rate. The preferred marker of implant failure will be revision surgery. The outcome included in this review is revision risk.
We prioritised the major outcomes in numerical order, as given above.
Minor outcomes
Following discussion between the senior review authors, we prioritised the minor outcomes in numerical order as shown below.
1. Blood loss
a. Total blood loss during surgery (intraoperative blood loss)
b. Postoperative blood loss measured from drainage systems and blood transfusion rates
c. Overall blood loss
2. Economic outcomes
a. Resource usage: direct healthcare and societal costs to facilitate a cost‐effectiveness analysis
b. Duration of surgery: surgery start and finish times when available
c. Length of hospital stay
3. Implant stability
Validated methods such as radiostereometric analysis (RSA).
4. Adverse events
We report adverse events that are not classified as serious adverse events based on the criteria above.
Timing of outcome assessment
Studies are likely to report the outcomes discussed at several time points. We therefore planned to group these assessments into three categories: short‐term (up to and including three months), medium‐term (after three months and up to and including 12 months), and long‐term follow‐up (longer than one year).
The greatest effect of the intervention on pain was likely to be seen in the very early postoperative phase. Therefore we have made day 1 the time point for this primary outcome. We have also reported pain scores at later time points up to six weeks, when we anticipated pain levels would be lower and any differences would be fewer.
The primary time point for SAE, function, health‐related quality of life, global assessment of success, and cognitive function is within 12 months of surgery, and the primary time point for revision surgery is any revision surgery performed within the follow‐up period of the study. For studies included in this review, it was 24 months.
Search methods for identification of studies
Electronic searches
This current review includes randomised controlled trials (RCTs) published between 1946 and 26 March 2020 and non‐randomised studies published between 1946 and 26 March 2020.
We searched the following databases for randomised trials.
-
Cochrane Central Register of Controlled Trials, via Cochrane Library (Appendix 1).
-
OVID MEDLINE, 1946 to 26 March 2020 (Appendix 2).
-
OVID Embase, 1974 to 26 March 2020 (Appendix 3).
-
ClinicalTrials.gov for ongoing trials (Appendix 4).
-
World Heath Organization (WHO) International Clinical Trials Registry Platform (ICTRP) search portal (www.who.int/ictrp/en/; Appendix 5).
We also searched the following databases for non‐randomised studies.
-
OVID MEDLINE, 1946 to 26 March 2020 (Appendix 6).
-
OVID Embase, 1974 to 26 March 2020 (Appendix 7).
Searching other resources
We checked the reference lists of all primary studies and review articles for additional references.
In addition, we searched the following established joint registry programmes for relevant published reports and used the contacts below to identify any missing joint registry programmes.
Australasia
-
Australian Orthopaedic Association National Joint Replacement Registry (aoanjrr.sahmri.com/)
-
New Zealand National Joint Register (https://nzoa.org.nz/nzoa-joint-registry)
Europe
-
Danish Knee Arthroplasty Register (https://www.sundhed.dk/sundhedsfaglig/kvalitet/kliniske-kvalitetsdatabaser/planlagt-kirugi/knaealloplastikregister/)
-
European Arthroplasty Register (https://www.efort.org/about-us/nore/)
-
Scottish Arthroplasty Project (www.arthro.scot.nhs.uk/)
-
Slovak National Arthroplasty Register (sar.mfn.sk/the-slovak-arthroplasty-register.348.html)
-
Swedish Knee Arthroplasty Register (www.myknee.se/en/)
-
National Joint Registry of England and Wales (www.njrcentre.org.uk/njrcentre/default.aspx)
-
Norwegian Arthroplasty Register (nrlweb.ihelse.net/eng/)
-
Portugese Arthroplasty Register (www.rpa.spot.pt/)
-
RIPO Bologna, Italy (ripo.cineca.it/)
-
Romanian Arthroplasty Register (www.rne.ro/?lang=en)
North America
-
American Joint Replacement Registry (www.ajrr.net/)
-
Canadian Joint Replacement Register (www.cihi.ca/en/types-of-care/specialized-services/joint-replacements/canadian-joint-replacement-registry)
-
Health East Joint Replacement Registry (www.healtheast.org/orthopaedics/registry.html)
-
Kaiser Permanente National Implant Registries (www.kpimplantregistries.org/)
We searched for errata or retractions from included studies published in full text on PubMed (www.ncbi.nlm.nih.gov/pubmed), and we reported in the review the date this was done.
Data collection and analysis
Selection of studies
Two review authors (IA and PW) independently screened titles and abstracts of all studies for potential inclusion that we identified as a result of the search. We coded them as 'retrieve' (eligible or potentially eligible/unclear) or 'do not retrieve'. After retrieving the full‐text study reports/publications, two review authors (IA and PW for RCTs, IA and AC for non‐randomised studies) independently screened them and identified studies for inclusion; we also identified and recorded reasons for exclusion of ineligible studies. We resolved any disagreement through discussion, or, if required, we consulted a third review author (MU). We identified and excluded duplicates and collated multiple reports of the same study, so that each study, rather than each report, is the unit of interest in the review. We recorded the selection process in sufficient detail to complete a PRISMA flow diagram and Characteristics of excluded studies section. Search strategies can be seen in the appendices (Appendix 1; Appendix 2; Appendix 3; Appendix 4; Appendix 5; Appendix 6; Appendix 7).
Data extraction and management
We used a data collection form for study characteristics and outcome data that has been piloted on at least one study in the review. One review author (IA) extracted study characteristics from the included studies. A second review author (PW) cross‐checked study characteristics for accuracy against the trial report. We extracted the following study characteristics.
-
Methods: study design, total duration of study, details of any 'run‐in' period, number of study centres and locations, study setting, withdrawals, and dates of study.
-
Participants: number (N), mean age, age range, sex, disease duration, inclusion criteria, and exclusion criteria.
-
Interventions: type of surgery, number of participants in tourniquet group, and number of participants in comparator group (sham/no tourniquet/other).
-
Outcomes: major and minor outcomes specified and collected, and time points reported.
-
Characteristics of the design of the trial, as outlined in the Assessment of risk of bias in included studies section below.
-
Notes: funding for trial and notable declarations of interest of trial authors.
Two review authors (IA and AC) independently extracted outcome data from the included studies. We extracted the number of events and the number of participants in each treatment group for dichotomous outcomes, and we extracted means and standard deviations and number of participants in each treatment group for continuous outcomes. For non‐randomised trials, we aimed to extract adjusted outcome measures.
We aimed to use non‐randomised studies to extract outcomes of interest that are rare (e.g. VTE, implant failure rate).
We noted in the Characteristics of included studies table if outcome data were not reported in a usable way, and when data were transformed or estimated from a graph. We resolved disagreements by reaching consensus or by involving a third review author (MU). One review author (IA) transferred data into the Review Manager 5 file (RevMan 2014). We double‐checked that data were entered correctly by comparing data presented in the review with data presented in study reports.
Our a priori decision rules to extract data in the event of multiple outcome reporting in trials are as follows.
-
When trialists report both final values and change from baseline values for the same outcome, we extracted change from baseline values.
-
When trialists report both unadjusted and adjusted‐for‐baseline values for the same outcome, we extracted unadjusted baseline values.
-
When trialists report data analysed based on the intention‐to treat (ITT) sample and another sample (e.g. per protocol, as treated), we extracted ITT‐analysed data.
-
When trials do not include a measure of overall pain but include one or more other measures of pain, for the purpose of pooling data we combined overall pain with other types of pain in the following hierarchy: unspecified pain, pain at rest, pain with activity, daytime pain.
-
When trialists report multiple pain outcome measures, for the purposes of pooling data we extracted one measure using the following hierarchy: visual analogue scale, numerical or cognitive rating scale, McGill Pain Questionnaire, or another scale.
-
When trialists report multiple measures of function or disability, for the purposes of pooling data we extracted a single measure using the following hierarchy: Oxford Knee Score (OKS), Knee Injury and Osteoarthritis Outcome Score (KOOS), Knee Society Score (KSS), Western Ontario and McMaster Universities Arthritis Index (WOMAC), or an other scale.
Assessment of risk of bias in included studies
Randomised studies
Two review authors (IA and PW) independently assessed risks of bias for each study, using the criteria outlined in the Cochrane Handbook for Systematic Reviews of Interventions, version 6.1 (Higgins 2020a). We resolved disagreements by discussion or by consultation with another review author (MU). We assessed risks of bias according to the following domains.
-
Random sequence generation (only for randomised studies).
-
Allocation concealment (only for randomised studies).
-
Blinding of participants and personnel.
-
Blinding of outcome assessment.
-
Incomplete outcome data.
-
Selective outcome reporting.
-
Other potential bias (e.g. discrepancies between groups for co‐morbidities that could act as confounding factors, such as clotting disorders; differences in application of co‐interventions, such as postoperative rehabilitation).
We graded each potential source of bias as high, low, or unclear, and we provided a quote from the study report together with a justification for our judgement in the 'Risk of bias' table. We summarised risk of bias judgements across different studies for each of the domains listed. We considered blinding separately for different key outcomes when necessary (e.g. for unblinded outcome assessment, risk of bias for all‐cause mortality may be different than for a participant‐reported pain scale). We also considered the impact of missing data by key outcomes.
When information on risk of bias relates to unpublished data or correspondence with a trialist, we noted this in the 'Risk of bias' table.
When considering treatment effects, we aimed to take into account the risk of bias for studies that contributed to that outcome.
We presented the figures generated by the 'Risk of bias' tool to provide summary assessments of risks of bias.
Non‐randomised studies
We planned to use ROBINS‐I (Risk Of Bias In Non‐randomised Studies of Interventions), a tool for assessing risk of bias in non‐randomised studies (Sterne 2016). This approach involved three stages for each study.
Stage 1
To specify the research question, list confounding domains and co‐interventions, and specify the outcomes being examined. Confounding factors that may influence outcome include:
-
co‐morbidities such as vascular disease;
-
previous VTE disease;
-
prothrombotic conditions such as malignancy;
-
use and type of VTE prophylaxis (such as low molecular weight heparin, aspirin, or intermittent calf pump);
-
type of implant used;
-
use of cement; and
-
basic participant demographics, including age, body mass index (BMI), and American Society of Anesthesiologists (ASA) grade.
Stage 2
Risk of bias assessment for a specific result.
Stage 3
Overall risk of bias 'triangulated' across all studies. This tool evaluated the following area of bias.
-
Confounding.
-
Selection bias.
-
Bias in measurement classification of interventions.
-
Bias due to deviations in intended interventions.
-
Bias due to missing data.
-
Bias in measurement of outcomes.
-
Bias in selection of the reported result.
Studies would be reported as having low risk of bias, moderate risk of bias, serious risk of bias, or critical risk of bias. A 'no information' category will be used to describe the risk of bias where there is insufficient information to permit a judgement for the study.
Assessment of bias in conducting the systematic review
We conducted the review according to the published protocol and reported any deviations from it in the Differences between protocol and review section of the review.
Measures of treatment effect
We used risk ratios (RRs) with 95% confidence intervals (CIs) to report categorical outcomes. We analysed continuous data as mean differences (MDs) or as standardised mean differences (SMDs), depending on whether the same scale was used to measure an outcome, along with 95% CIs. We then translated the SMD back to a common scale by multiplying SMD by baseline standard deviation (SD) for the control group from the most representative study (Higgins 2020b). We entered data presented as a scale with a consistent direction of effect across studies.
In the Effects of interventions section under Results and in the 'Comments' column of the 'Summary of findings' table, we provide the absolute per cent difference, the relative per cent change from baseline, and the number needed to treat for an additional beneficial outcome (NNTB); we calculated the NNTB only when the outcome showed a clinically significant difference.
For dichotomous outcomes, such as serious adverse events, we calculated the NNTB from the control group event rate and the risk ratio, using the Visual Rx NNT calculator (Cates 2008). We will calculate the NNTB for continuous measures using the Wells calculator (available at the CMSG Editorial office; musculoskeletal.cochrane.org/).
For dichotomous outcomes, we calculated the absolute per cent change from the difference in risks between intervention and control groups using GRADEpro (GRADEpro 2015), and we expressed this as a percentage. For continuous outcomes, we calculated the absolute risk difference as improvement in the intervention group minus improvement in the control group, in the original units.
We calculated the relative per cent change for dichotomous data as the RR minus 1, expressed as a percentage. For continuous outcomes, we calculated the relative difference in change from baseline as the absolute benefit divided by the baseline mean of the control group.
Unit of analysis issues
We anticipated most studies to use a simple parallel‐group design. However, if we found any other design (e.g. cluster‐randomised), we planned to use generic inverse variance methods to combine data. For analysis, we planned to use details of intraclass correlation coefficients (ICCs) and cluster sizes for trials of this type, if reported effects had not been adjusted for clustering.
When multiple trial arms are reported in a single trial, we included only the relevant arms.
We preferred trials that reported a unit of analysis at the participant level, to maintain independence of the outcome variable. When studies reported outcomes in patients undergoing bilateral total knee replacement surgery, the unit of analysis was presented at a joint level (e.g. each individual knee; Kumar 2015; Liu 2017; Liu 2017 b). For these studies, we extracted outcomes only if they were reported as specifically related to each individual knee (e.g. pain, function, global assessment of success, SAEs (infection, VTE, re‐operation, nerve damage), survival of implant, intraoperative blood loss (per knee), duration of surgery). In these studies, trial authors made direct comparisons between one knee and the other; as a result, outcomes were knee‐specific and therefore could be included in the meta‐analysis.
Dealing with missing data
We contacted investigators or study sponsors to verify key study characteristics and to obtain missing numerical outcome data when possible (e.g. when a study is identified as an abstract only, when data are not available for all participants). When this was not possible, and when missing data were thought to introduce serious bias, we explored the impact of including such studies in the overall assessment of results by performing a sensitivity analysis. We described any assumptions and imputations for handling missing data and we explored the effect of imputation by conducting sensitivity analyses.
For dichotomous outcomes (e.g. number of withdrawals due to adverse events), we calculated the withdrawal rate using the number of participants randomised to the group as the denominator.
For continuous outcomes (e.g. mean change in pain score), we calculated MD or SMD based on the number of participants analysed at that time point. If the number of participants analysed was not presented for each time point, we aimed to use the number of randomised participants in each group at baseline.
When possible, we aimed to compute missing SDs from other statistics such as standard errors, confidence intervals, or P values, according to the methods recommended in the Cochrane Handbook for Systematic Reviews of Interventions, version 6.1 (Deeks 2020). If we could not estimate standard deviations, we aimed to impute them (e.g. from other studies in the meta‐analysis).
Assessment of heterogeneity
We assessed clinical and methodological diversity in terms of participants, interventions, outcomes, and study characteristics for included studies, to determine whether a meta‐analysis was appropriate. We assessed statistical heterogeneity by visually inspecting the forest plot to assess for obvious differences in results between studies, and by using I² and Chi² statistical tests.
As recommended in the Cochrane Handbook for Systematic Reviews of Interventions, version 6.1 (Deeks 2020), I² value of 0% to 40% indicates 'might not be important'; 30% to 60% may represent 'moderate heterogeneity'; 50% to 90% may represent 'substantial heterogeneity'; and 75% to 100% represents 'considerable heterogeneity'. We considered the importance of I² to depend on the magnitude and direction of effects and on the strength of evidence for heterogeneity (e.g. P value from Chi² test, confidence interval for I²). If we identified substantial heterogeneity, we reported this and investigated possible causes by following the recommendations provided in Section 9.6 of the Cochrane Handbook for Systematic Reviews of Interventions, version 6.1 (Deeks 2020).
Assessment of reporting biases
We aimed to create and examine a funnel plot to explore possible small‐study biases. In interpreting funnel plots, we examined the different possible reasons for funnel plot asymmetry, as outlined in Section 13 of the Cochrane Handbook for Systematic Reviews of Interventions, version 6.1 (Page 2020), and we related this information to results of the review. If we were able to pool more than 10 trials, we decided to undertake formal statistical tests to investigate funnel plot asymmetry and to follow the recommendations provided in Section 13 of the Cochrane Handbook for Systematic Reviews of Interventions, version 6.1 (Page 2020). For continuous data, we tested asymmetry by using a weighted linear regression of the standardised mean against its standard error (Egger 1997). For dichotomous data, we used a weighted linear regression based upon the odds ratio against its variance (Harbord 2009). In both cases, we considered a P value below 0.05 as evidence that publication bias was present. We performed analyses using the “meta” R package (Schwarzer 2007).
To assess outcome reporting bias, we checked trial protocols against published reports. For studies published after 1 July 2005, we screened the Clinical Trial Register at the International Clinical Trials Registry Platform of the World Health Organization for the a priori trial protocol (apps.who.int/trialssearch). We evaluated whether selective reporting of outcomes was present.
Data synthesis
We pooled outcomes of clinically and methodologically homogeneous studies, when meaningful, using a random‐effects model. We performed analysis using Review Manager 5 (RevMan 2014), and we produced forest plots for all analyses. We aimed to pool outcomes of non‐randomised studies only if the studies were clinically homogeneous, using a random‐effects model, which allows for different study variances. We aimed to use log‐RR data (with corresponding standard errors (SEs) on the log scale) and aimed to pool outcomes using the generic inverse variance method. We aimed to use non‐randomised studies to analyse only outcomes that are rare (e.g. VTE, implant failure rate). We planned to assess clinical homogeneity based on participants, interventions (procedures performed with a tourniquet), outcomes (VTE and implant failure), and study characteristics, including study design. Two review authors (IA and PW) determined if at least three of these features are matching between each study, to pool the data.
Subgroup analysis and investigation of heterogeneity
We planned to carry out the following subgroup analyses.
-
Different surgical procedures that may affect outcome (e.g. total versus partial knee replacement, primary versus knee replacement and revision knee replacement).
-
Different types of tourniquet that may affect outcome (e.g. inflatable, non‐inflatable).
Types of surgical procedures vary in complexity, and this may impact both the duration of tourniquet use and the risk of complications.
We planned to use the following outcomes in subgroup analyses.
-
Pain.
-
Function.
-
Adverse events.
We planned to use the formal test for subgroup interactions in Review Manager 5 (RevMan 2014), and we used caution in interpreting subgroup analyses, as advised in Section 10 of the Cochrane Handbook for Systematic Reviews of Interventions, version 6.1 (Deeks 2020).
Sensitivity analysis
If studies differed markedly from most other studies (different outcomes), and if we deemed it necessary to exclude them, we conducted sensitivity analyses to report whether the overall effect changed when these studies were removed.
When we identified sufficient studies, we performed sensitivity analyses to assess the impact of selection bias, performance bias, and detection bias on major outcomes.
Interpreting results and reaching conclusions
We followed the guidelines provided in Chapter 15 of the Cochrane Handbook for Systematic Reviews of Interventions, version 6.1 when interpreting results (Schunemann 2020b), and we were aware of distinguishing lack of evidence of effect from lack of effect. We based our conclusions only on findings from the quantitative or narrative synthesis of included studies for this review. We avoided making recommendations for practice, and our implications for research suggest priorities for future research and outline remaining uncertainties in this area.
Summary of findings and assessment of the certainty of the evidence
'Summary of findings' table
We created a 'Summary of findings' (SoF) table using the following outcomes:
-
Pain
-
Function
-
Global assessment of success
-
Health‐related quality of life
-
Serious adverse events
-
Cognitive function
-
Survival of the implant
The comparison in the SoF table was: tourniquet versus no tourniquet.
Two review authors (IA and PW) independently assessed the quality of the evidence. We used the five GRADE considerations (study limitations, consistency of effect, imprecision, indirectness and publication bias) to assess the quality of a body of evidence as it relates to the studies which contribute data to the meta‐analyses for the pre‐specified outcomes. We used methods and recommendations from Chapter 14 of the Cochrane Handbook for Systematic Reviews of Interventions, version 6.1 (Schunemann 2020a), and used GRADEpro software to prepare the SoF tables (GRADEpro 2015). We justified all decisions to downgrade the quality of studies using footnotes, and made comments to aid the reader's understanding of the review where necessary.
The planned minimum clinically important difference (MCID) was 1 point or 10% absolute improvement for pain on a VAS (0‐10) (Dworkin 2008; Kelly 2001; Wall 2017); 5.3 points or 5.3% absolute improvement in KSS for function (Chean Lee 2017) and 10 points or 10% absolute improvement for health‐related quality of life (Karjalainen 2019).
Results
Description of studies
Results of the search
Randomised controlled trials
The database search was performed on March 2020. Results of the search can be seen in Figure 1. The search returned 1290 citations through databases (CENTRAL 539; MEDLINE 340; Embase 411) and a further 150 citations from trial registries (Clinical trials.gov 42; WHO 108). No further citations were obtained from grey literature (e.g. unpublished studies, registry data). After duplicates were removed, title and abstracts were screened for eligibility, leaving 53 full texts for further assessment. In total, 41 studies met the inclusion criteria of this review and were included for further analysis: Abdel‐Salem 1995; Aglietti 2000; Alexandersson 2019; Ayik 2020; Clarke 2001; Dong 2019; Ejaz 2014; Ejaz 2015; Ejaz 2015 b; Goel 2019; Harston 2015; Huang 2017; Jawhar 2015; Jawhar 2020; Juelsgaard 2001; Kato 2002; Kiss 2005; Kumar 2015; Ledin 2012; Li 2008; Li 2009; Liu 2014; Liu 2017; Liu 2017 b; Matziolis 2004; Molt 2014; Mori 2016; Ozkunt 2018; Pfitzner 2014; Tai 2012; Tetro 2001; Vandenbussche 2001; Vertullo 2017; Wakankar 1999; Wauke 2002; Wu 2018; Yavarikia 2010; Zhang 2010; Zhang 2016; Zhou 2011; Zhou 2017. Eleven studies were excluded following full‐text screening. Reasons for exclusion were:

Study flow diagram: search for randomised controlled trials.
-
wrong comparator (n = 6): Brin 2015; Dennis 2016; Friedrich 1990Husted 2005; Nielsen 2016; Padala 2004;
-
commentary piece (n = 1): Dorr 2014;
-
wrong study design (n = 3): Harvey 1997; Huang 2015; Nicolaiciuc 2019b; and
-
supplementary piece (n = 1): Mourikis 2009.
We identified 12 ongoing studies meeting the inclusion criteria and presented their characteristics in the Characteristics of ongoing studies table. All of these studies were in the recruitment phase or the follow‐up period: Duncan 2019; Forsmo 2018; Gill 2018; Kange 2017; Liebensteiner 2016; Pei 2016; Pei 2016 (b); Shen 2018; Singh 2019; Vasquez 2019; Wall 2016; Wang 2016.
We identified a study protocol or registration for 13 studies (Alexandersson 2019; Dong 2019; Ejaz 2014; Ejaz 2015; Ejaz 2015 b; Goel 2019; Harston 2015; Huang 2017; Jawhar 2015; Jawhar 2020; Molt 2014; Wu 2018; Zhou 2017); however, despite contacting authors, we could gather no study protocols nor registrations for 28 studies (Abdel‐Salem 1995; Aglietti 2000; Ayik 2020; Clarke 2001; Juelsgaard 2001; Kato 2002; Kiss 2005; Kumar 2015; Ledin 2012; Li 2008; Li 2009; Liu 2014; Liu 2017; Liu 2017 b; Matziolis 2004; Mori 2016; Ozkunt 2018; Pfitzner 2014; Tai 2012; Tetro 2001; Vandenbussche 2001; Vertullo 2017; Wakankar 1999; Wauke 2002; Yavarikia 2010; Zhang 2010; Zhang 2016; Zhou 2011).
Non‐randomised studies
The search for non‐randomised studies was performed in March 2020 and returned 1535 citations through database screening (MEDLINE 656, Embase 879). No further citations were found through searching grey literature. After duplicates were removed, 895 citations underwent title and abstract screening. Once complete, 16 full texts were assessed for eligibility. All 16 were excluded, as the sample size was less than 1000, which was a pre‐specified inclusion criterion (Ajnin 2020; Bakker 2019; Barros 2017; Burg 2009; Fakuda 2007; Hasanain 2018; Jarolem 1995; Kheir 2018; Matziolis 2011; Mutlu 2015; Nicolaiciuc 2019; Nishiguchi 2008; Schimizu 2016; Schnettler 2017; Stroh 2011; Zhang 2019). We also searched registry databases; only the Swedish Registry reported tourniquet use but provided no data on SAEs or revision rates. The search results are summarised in Figure 2.

Study flow diagram: search for non‐randomised studies.
Included studies
We have provided a full description of the 41 included studies in the Characteristics of included studies table; we have presented a summary of trial features and participant characteristics in Table 1.
| Author | Number of participants | Number in tourniquet group | Number in control group | Mean age in tourniquet group (SD) | Mean age in control group (SD) | Proportion of males in tourniquet group, % | Proportion of males in control group, % | BMI in tourniquet group (SD) | BMI in control group (SD) |
| Abdel‐Salem 1995 | 80 | 40 | 40 | 73 | 73 | ||||
| Aglietti 2000 | 20 | 10 | 10 | 70 (8) | 68 (4.5) | 30 | 40 | 27.9 | 27.3 |
| Alexandersson 2018 | 81 | 38 | 43 | 68 (7.4) | 69.7 (6.4) | 47 | 51 | 28.6 (3.4) | 27.9 (3.5) |
| Ayik 2020 | 65 | 32 | 33 | 65.39 (7.25) | 64.90 (6.58) | 44 | 42 | 31.38 (4.72) | 30.3 (7.1) |
| Clarke 2001 | 31 | 21 | 10 | ||||||
| Dong 2019 | 122 | 58 | 64 | 68.2 (17.1) | 69.5 (15.9) | 34 | 35 | ||
| Ejaz 2014 | 64 | 33 | 31 | 68 (8.4) | 68 (7.4) | 55 | 55 | 25 (2) | 25 (2.5) |
| Ejaz 2015 | 62 | 31 | 31 | 68 (6.3) | 68.2 (7.2) | 52 | 55 | 25.1 (2) | 25.2 (2.5) |
| Ejaz 2015 b | 57 | 29 | 28 | 68.3 (8.4) | 68.2 (7.8) | 45 | 54 | 25.1 (2) | 25.2 (2.5) |
| Goel 2019 | 199 | 100 | 99 | 66.0 (7.0) | 65.5 (7.8) | 50 | 48 | 30.9 (4.6) | 31.3 (4.5) |
| Harston 2015 | 64 | 32 | 32 | 68 (8) | 66 (8) | 27.4 | 28.4 | ||
| Huang 2017 | 100 | 50 | 50 | 66.2 (8.3) | 65.1 (8.1) | 36 | 32 | 25.1 (1.5) | 24.2 (1.5) |
| Jawhar 2015 | 34 | 17 | 17 | 70.6 (6) | 70.6 (6) | 53 | 53 | 32.1 (5) | 33.8 (5) |
| Jawhar 2019 | 99 | 50 | 49 | 69.3 (7.4) | 68.3 ± 7.8 | 34 | 39 | 31.9 (6) | 31.4 (5.5) |
| Juelsgaard 2001 | 30 | 16 | 14 | 69 | 64 | 44 | 29 | ||
| Kato 2002 | 46 | 22 | 24 | 65 | 63 | ||||
| Kiss 2015 | 100 | 51 | 49 | 72.6 (7.1) | 74.7 (7.4) | 20 | 27 | 28.8 (3.9) | 28.5 (3.3) |
| Kumar 2015 | 30 | 30 | 30 | 58 | 58 | 30 | 30 | ||
| Ledin 2012 | 50 | 25 | 25 | 70 (8) | 71 (6) | 67 | 39 | 29 (4.8) | 28 (4.8) |
| Li 2008 | 60 | 30 | 30 | 71 (7) | 70 (7) | 24 (5) | 24 (5) | ||
| Li 2009 | 80 | 40 | 40 | 71 (6) | 70 (7) | 28 | 33 | 27.3 (6.3) | 26.8 (5.1) |
| Liu 2014 | 20 | 10 | 10 | 67 | 60 | 70 | 90 | 25.5 | 28.7 |
| Liu 2017 | 52 | 52 | 52 | 67 (8) | 67 (8) | 28.1 (5.5) | 28.1 (5.5) | ||
| Liu 2017 b | 26 | 26 | 26 | 65.8 (9.2) | 65.8 (9.2) | 35 | 35 | 28.2 (5.6) | 28.2 (5.6) |
| Matziolis 2015 | 20 | 10 | 10 | 72.4 | 76.6 | 80 | 70 | 28.3 | 29.5 |
| Molt 2014 | 60 | 30 | 30 | 70 (7) | 67 (9) | 53 | 53 | 28 (3) | 28 (3) |
| Mori 2016 | 103 | 51 | 52 | 72.8 (7.3) | 74.6 (7.6) | 12 | 17 | 27.7 (3.4) | 29.2 (3.9) |
| Ozkunt 018 | 49 | 24 | 25 | 65.05 | 65.05 | ||||
| Pfitzner 2014 | 90 | 45 | 45 | 69.3 | 70.5 | 47 | 24 | 27.8 | 26 |
| Tai 2012 | 72 | 36 | 36 | 72.1 (6.9) | 71.5 (6.8) | 28.6 (4.5) | 27.9 (4.2) | ||
| Tetro 2001 | 63 | 33 | 30 | 69.8 (6.7) | 69.8 (9) | 45 | 37 | ||
| Vandenbussche 2001 | 80 | 40 | 40 | 72.5 | 68.5 | 22.5 | 40 | ||
| Vertullo 2017 | 40 | 20 | 20 | 67.85 (6.91) | 65.65 (8.54) | 50 | 55 | 30.43 (5.07) | 31 (5.31) |
| Wakankar 1999 | 77 | 37 | 40 | 72.5 | 71.8 | 30 | 35 | ||
| Wauke 2002 | 37 | 19 | 18 | 63.2 (8.7) | 61.4 (7.4) | ||||
| Wu 2018 | 100 | 50 | 50 | 68.06 (3.16) | 67.58 (4.61) | 38 | 44 | 23.87 (2.13) | 24.10 (2.16) |
| Yavarikia 2010 | 51 | 22 | 29 | 68 | 66 | 27 | 24 | ||
| Zhang 2010 | 60 | 30 | 30 | 72 (6) | 71 (6) | 27 | 37 | 25 (4) | 26 (4) |
| Zhang 2016 | 166 | 84 | 82 | 84 | 82 | ||||
| Zhou 2011 | 39 | 20 | 19 | 63.12 (6.79) | 61.89 (7.93) | 35 | 26 | ||
| Zhou 2017 | 140 | 72 | 68 | 72 | 68 | 18 | 10 | 26.1 (4.1) | 25.7 (3.4) |
Trial design, settings, and characteristics
The 41 included studies were randomised controlled trials (RCTs); no quasi‐randomised studies were identified or included. Thirty‐seven studies were two‐arm single‐centre RCTs comparing knee replacement performed with a tourniquet versus without a tourniquet (Abdel‐Salem 1995; Aglietti 2000; Alexandersson 2019; Ayik 2020; Dong 2019; Ejaz 2014; Ejaz 2015; Ejaz 2015 b; Goel 2019; Harston 2015; Jawhar 2015; Jawhar 2020; Juelsgaard 2001; Kato 2002; Kiss 2005; Kumar 2015; Ledin 2012; Li 2008; Li 2009; Liu 2014; Liu 2017; Liu 2017 b; Matziolis 2004; Molt 2014; Mori 2016; Pfitzner 2014; Tai 2012; Tetro 2001; Vandenbussche 2001; Vertullo 2017; Wakankar 1999; Wauke 2002; Wu 2018; Zhang 2010; Zhang 2016; Zhou 2011; Zhou 2017). Four studies included three arms in the study design. Clarke 2001 compared surgery performed without a tourniquet versus surgery performed with a tourniquet inflated at low pressure (225 mmHg) and surgery performed with a tourniquet inflated at high pressure (300 mmHg). Huang 2017 compared surgery performed with a tourniquet and multiple doses of tranexamic acid against surgery performed with a tourniquet only and surgery performed without multiple doses of tranexamic acid and with no tourniquet. Ozkunt 2018 and Yavarikia 2010 compared surgery performed without a tourniquet against surgery performed with a tourniquet inflated for the entire procedure and surgery performed with the tourniquet inflated only for implantation of the prosthesis.
With regards to anaesthetic protocol, 14 studies used general anaesthesia for all participants (Abdel‐Salem 1995; Clarke 2001; Dong 2019; Huang 2017; Kato 2002; Liu 2014; Liu 2017; Liu 2017 b; Ozkunt 2018; Vandenbussche 2001; Wakankar 1999; Wauke 2002; Zhou 2017; Wu 2018). Eight studies reported using spinal anaesthesia (Aglietti 2000; Ayik 2020; Ejaz 2014; Ejaz 2015; Ejaz 2015 b; Goel 2019; Ledin 2012; Mori 2016; one study reported using intrathecal anaesthesia (Harston 2015); one study reported using either general anaesthesia or regional anaesthesia with a block (Zhang 2016); and two studies reported using epidural anaesthesia (Kiss 2005; Kumar 2015). Two studies used different methods of anaesthesia between the two groups; one study compared hypotensive epidural anaesthesia in surgery without a tourniquet versus spinal anaesthesia in surgery with a tourniquet (Juelsgaard 2001), and one study compared epinephrine‐augmented hypotensive epidural anaesthesia in surgery without a tourniquet versus normotensive epidural anaesthesia in surgery with a tourniquet (Kiss 2005). Fourteen studies did not explicitly state the anaesthetic protocol used (Alexandersson 2019; Jawhar 2015; Jawhar 2020; Li 2008; Li 2009; Matziolis 2004; Molt 2014; Pfitzner 2014; Tai 2012; Tetro 2001; Vertullo 2017; Yavarikia 2010; Zhang 2010; Zhou 2011).
Chemical thromboprophylaxis regimens were started in 25 studies, 14 studies reported using heparin‐based anticoagulation (Abdel‐Salem 1995; Alexandersson 2019; Ayik 2020; Kiss 2005; Ledin 2012; Li 2009; Molt 2014; Ozkunt 2018; Tetro 2001; Vandenbussche 2001; Wauke 2002; Wu 2018; Yavarikia 2010; Zhang 2010), seven studies reported using rivaroxiban (Ejaz 2014; Ejaz 2015; Ejaz 2015 b; Liu 2017; Liu 2017 b; Zhang 2016; Zhou 2017), and one study used aspirin (Goel 2019). In three studies, the exact method was not clearly stated (Clarke 2001; Huang 2017; Wakankar 1999).
Follow‐up in the included studies ranged from within hours of the operation, in Aglietti 2000, Ejaz 2015, Jawhar 2015, and Kato 2002, to two years in Abdel‐Salem 1995, Dong 2019, Ejaz 2015 b, Ledin 2012, and Molt 2014.
Six studies reported sources of study funding. Two were supported by institutional grants (Harston 2015; Matziolis 2004), and one was supported by an industrial grant (Liu 2014), Ledin 2012 was supported by a grant from the Swedish Research Council, Wu 2018 was supported by a science and technology department of Sichaun Province Grant, and Zhou 2017 received funding from a health industry special scientific research projects of China grant. The remainder of the studies did not report a source of funding or did not receive any further financial support.
The included studies were carried out in 16 different countries: Australia (Liu 2014; Vertullo 2017), Austria (Kiss 2005), China (Dong 2019; Huang 2017; Li 2008; Li 2009; Liu 2017; Liu 2017 b; Zhang 2010; Zhang 2016; Zhou 2011; Zhou 2017), Denmark (Ejaz 2014; Ejaz 2015; Ejaz 2015 b; Jawhar 2015; Juelsgaard 2001), France (Vandenbussche 2001), Germany (Jawhar 2015; Jawhar 2020; Matziolis 2004; Pfitzner 2014), India (Kumar 2015), Iran (Yavarikia 2010), Italy (Aglietti 2000), Japan (Kato 2002; Mori 2016; Wauke 2002), Kingston (Tetro 2001), Sweden (Alexandersson 2019; Harston 2015; Ledin 2012; Molt 2014), Taiwan (Tai 2012), Turkey (Ayik 2020; Ozkunt 2018), the United Kingdom (Abdel‐Salem 1995; Clarke 2001; Wakankar 1999), and the USA (Goel 2019).
Participants
All participants were recruited from a secondary care hospital at which orthopaedic surgeons offered total knee replacement surgery. In total, 2819 participants were allocated to surgery without a tourniquet (n = 1466) or to surgery with a tourniquet (n = 1461). The number of participants per trial ranged from 20 to 199. When studies reported age and body mass index (BMI), mean age in the tourniquet group was 69.0 and mean age in the non‐tourniquet group was 68.2. Mean BMI in the tourniquet group was 27.7 and in the non‐tourniquet group 27.8. A total of 944 male participants and 1777 female participants were reported in the studies included in this review.
Inclusion criteria were comparable between groups when participants were listed for knee replacement surgery. In most cases, surgery was performed to treat end‐stage osteoarthritis; however, in five studies, patients with rheumatoid arthritis were also included (Li 2008; Li 2009; Tetro 2001; Zhang 2016; Zhou 2017).
The main exclusion criteria included a history of diabetes (Abdel‐Salem 1995; Ayik 2020; Ejaz 2014; Ejaz 2015; Ejaz 2015 b; Goel 2019; Li 2008; Li 2009; Liu 2017; Liu 2017 b; Matziolis 2004; Vandenbussche 2001; Wakankar 1999), neurovascular or peripheral vascular disease (Abdel‐Salem 1995; Ayik 2020; Ejaz 2014; Ejaz 2015; Ejaz 2015 b; Goel 2019; Jawhar 2020; Kumar 2015; Li 2008; Li 2009; Liu 2014; Liu 2017; Liu 2017 b; Matziolis 2004; Tai 2012; Tetro 2001; Vertullo 2017; Zhang 2010; Zhang 2016), previous open knee surgery (Aglietti 2000; Alexandersson 2019; Ayik 2020; Clarke 2001; Ejaz 2014; Ejaz 2015; Ejaz 2015 b; Goel 2019; Harston 2015; Huang 2017; Liu 2017 b; Molt 2014; Vandenbussche 2001; Zhou 2017), neoplastic disease or malignancy (Aglietti 2000; Jawhar 2015; Jawhar 2020; Ledin 2012; Li 2008; Li 2009; Liu 2017; Molt 2014; Wakankar 1999; Zhang 2010), treatment with anticoagulant medication (Aglietti 2000; Ayik 2020; Clarke 2001; Ejaz 2014; Ejaz 2015; Ejaz 2015 b; Huang 2017; Jawhar 2015; Jawhar 2020; Juelsgaard 2001; Liu 2017; Liu 2017 b; Mori 2016; Pfitzner 2014; Wu 2018; Zhou 2017), or coagulation disorder (Aglietti 2000; Jawhar 2015; Jawhar 2020; Kiss 2005; Li 2008; Li 2009; Liu 2017; Matziolis 2004; Mori 2016; Pfitzner 2014; Tai 2012; Tetro 2001; Vandenbussche 2001; Wakankar 1999; Yavarikia 2010; Zhang 2010; Zhang 2016; Zhou 2011; Zhou 2017). Patients were also excluded if they had BMI greater than 35 (Alexandersson 2019; Ejaz 2014; Ejaz 2015; Ejaz 2015 b; Molt 2014; Wu 2018), American Society of Anesthesiologists (ASA) grade greater than IV (Huang 2017), anaemia (defined as haemoglobin < 10) (Huang 2017; Li 2008; Li 2009; Zhang 2010), known infection within the knee (Jawhar 2020Liu 2014; Liu 2017; Molt 2014; Tetro 2001; Wu 2018; Zhang 2010), or a history of cardiovascular disease (Dong 2019; Jawhar 2015; Juelsgaard 2001; Kiss 2005; Kumar 2015; Ledin 2012; Li 2009; Liu 2017; Liu 2017 b; Ozkunt 2018; Tai 2012; Wu 2018; Zhou 2017). Fourteen studies excluded participants undergoing bilateral knee surgery (Alexandersson 2019; Dong 2019; Ejaz 2014; Ejaz 2015; Ejaz 2015 b; Goel 2019; Huang 2017; Ledin 2012; Li 2009; Tetro 2001; Wakankar 1999;Vandenbussche 2001;Zhang 2016;Zhou 2017).
A postoperative antibiotic regimen was clearly provided in 13 studies and regimens were comparable amongst studies (Abdel‐Salem 1995; Alexandersson 2019; Ejaz 2014; Ejaz 2015; Ejaz 2015 b; Goel 2019; Kumar 2015; Ledin 2012; Li 2008; Ozkunt 2018; Wakankar 1999; Yavarikia 2010; Zhang 2016). The duration of illness was unspecified in all studies included in this review. For further details on eligibility criteria and participant characteristics in the included studies, see Characteristics of included studies.
Mean preoperative pain scores were reported in six studies and were comparable between groups. Mean preoperative pain score in the tourniquet group was 6.53 (0.75) and in the non‐tourniquet group 6.54 (0.76) in a study by Liu 2017 b. Zhang 2016 reported mean preoperative pain score of 3.87 (1.19) in the tourniquet group and 3.62 (0.91) in the non‐tourniquet group; Alexandersson 2019 reported a mean preoperative pain score of 1.84 (2.44) in the tourniquet group and 1.71 (1.93) in the non‐tourniquet group; Ayik 2020 reported a mean preoperative pain score of 6 (0.8) in the tourniquet group and 7 (0.75) in the non‐tourniquet group; Dong 2019 reported a mean pain score of 2.14 (0.83) in the tourniquet group and 2.22 (0.81) in the non‐tourniquet group; and Goel 2019 reported a mean pain score of 5.19 (2.54) in the tourniquet group and 5.74 (2.48) in the non‐tourniquet group.
Mean preoperative knee function scores were reported in seven studies and were comparable between the two groups. Huang 2017 reported a mean preoperative Hospital for Special Surgery (HSS) score of 45.1 (11.8) in the surgery with a tourniquet group and 45.9 (11.2) in the surgery without a tourniquet group. This is similar to Zhou 2011, which reported preoperative figures of 47.7 (11.8) and 49.6 (12.3) for the two groups. Three studies reported KSS scores preoperatively: Liu 2014 reported a score of 51.2 (5) in the tourniquet group and 51.3 (4.8) in the non‐tourniquet group; Ozkunt 2018 reported a preoperative KSS score of 63 (5.68) in the surgery with a tourniquet group and 82 (6.21) in the non‐tourniquet group; and Ayik 2020 reported a mean KSS score of 42 (16) in the tourniquet group and 43 (15) in the non‐tourniquet group. Jawhar 2020 reported a mean preoperative OKS score of 39 in the tourniquet group and 40 in the non‐tourniquet group. Goel 2019 reported mean preoperative KOOS scores; the mean score for activities of daily living was 50.69 (19.70) in the tourniquet group and 50.59 (17.56) in the non‐tourniquet group.
Interventions
Details of interventions are provided in the Characteristics of included studies section.
Number of surgeons
Seventeen studies clearly stated that a single surgeon performed all procedures (Abdel‐Salem 1995; Aglietti 2000; Ayik 2020; Huang 2017; Kato 2002; Kumar 2015; Liu 2017; Liu 2017 b; Matziolis 2004; Ozkunt 2018; Pfitzner 2014; Vandenbussche 2001; Vertullo 2017; Zhang 2010; Zhang 2016; Zhou 2017; Wu 2018). In three studies, two surgeons performed all procedures (Goel 2019; Molt 2014; Mori 2016); in two studies, three surgeons performed all procedures (Juelsgaard 2001; Ledin 2012); in one study, four surgeons performed all procedures (Li 2009); and in one study, seven surgeons were responsible for performing all procedures (Alexandersson 2019).
Types of knee replacement
All procedures were primary total knee replacement surgery. None of the included studies reported outcomes in patients undergoing revision or partial knee replacement surgery. Although the types of total knee replacement components differed between studies, all prostheses were implanted following cementation; in most studies, a posterior cruciate retaining implant was used. When reported, seven studies resurfaced the patella in all cases and six studies did not resurface the patella in all cases. All surgery was open surgery performed predominantly via a para‐patellar approach.
Tourniquet pressures
Thirty‐six studies reported tourniquet pressure in the protocol. Seven studies reported tourniquet pressure of 250 mmHg (Clarke 2001; Ejaz 2014; Ejaz 2015; Ejaz 2015 b; Mori 2016; Wu 2018; Yavarikia 2010); ten studies reported tourniquet pressure of 100 mmHg above the patient's systolic blood pressure (Ayik 2020; Dong 2019; Harston 2015; Huang 2017; Kumar 2015; Li 2008; Li 2009; Tai 2012; Wauke 2002; Zhang 2010); three studies reported tourniquet pressure of 125 mmHg above systolic blood pressure (Liu 2017; Liu 2017 b; Tetro 2001; and nine studies reported tourniquet pressure of 300 to 350 mmHg (Alexandersson 2019; Juelsgaard 2001; Kato 2002; Kiss 2005; Liu 2014; Molt 2014; Vandenbussche 2001; Vertullo 2017; Pfitzner 2014). Studies reported tourniquet pressure of 0.8 bar (Aglietti 2000), 360 to 380 mmHg (Jawhar 2015; Jawhar 2020), 275 mmHg (Ledin 2012), 400 mmHg (Matziolis 2004), 13.3 kPa (Zhang 2016, 225 or 300 mmHg (dependent on surgeon preference) (Goel 2019), and twice the systolic blood pressure (Wakankar 1999).
Rehabilitation regimens
Postoperatively, when studies specifically reported rehabilitation regimens, participants were allowed to mobilise under supervision on day 2 in eight studies (Abdel‐Salem 1995; Ayik 2020; Clarke 2001; Kiss 2005; Kumar 2015; Li 2009; Liu 2017 b; Vandenbussche 2001) and on day 1 in six studies (Alexandersson 2019; Huang 2017; Tai 2012; Tetro 2001; Yavarikia 2010; Zhou 2011). Continuous passive motion was used in five studies (Abdel‐Salem 1995; Kiss 2005; Li 2008; Liu 2017; Vandenbussche 2001).
Outcomes
Major outcomes
Pain
Eighteen studies reported pain scores as an outcome measure. All studies reported pain using a 10‐point visual analogue scale (VAS), with higher scores indicating more pain. Eight studies reported pain on the first postoperative day (Abdel‐Salem 1995; Dong 2019; Kumar 2015; Li 2008; Liu 2014; Liu 2017; Tai 2012; Alexandersson 2019); six studies reported pain on day 2 (Dong 2019; Kumar 2015; Li 2008; Liu 2017; Pfitzner 2014; Tai 2012); 10 studies reported pain on day 3 (Alexandersson 2019; Dong 2019; Ejaz 2014; Kumar 2015; Ledin 2012; Liu 2014; Liu 2017; Pfitzner 2014; Tai 2012; Zhang 2016); six studies reported pain scores at two weeks (Dong 2019; Kumar 2015; Li 2008; Liu 2017; Tai 2012; Zhang 2016); and seven studies reported pain scores at four to six weeks postoperatively (Alexandersson 2019; Ayik 2020; Goel 2019; Kumar 2015; Liu 2017; Ozkunt 2018; Zhang 2016). One study reported a change in pain score at one and six weeks postoperatively (Wakankar 1999; however, these investigators did not report baseline values. One study reported that pain was collected as an outcome but did not include any data in the results section (Vandenbussche 2001). One study reported pain graphically without any raw values, and we were unable to extract the data (Zhou 2017).
Function
Ten studies reported function scores as an outcome measure (Abdel‐Salem 1995;Ayik 2020; Ejaz 2014; Goel 2019; Huang 2017; Jawhar 2020; Liu 2014; Liu 2017 b; Ozkunt 2018; Zhou 2017). One study reported HSS score at 12 months (Abdel‐Salem 1995), and two studies reported HSS score at six months (Huang 2017; Zhou 2017). Three studies reported KOOS: one at three months (Goel 2019), and two at 12 months postoperatively (Ejaz 2014; Goel 2019). Two studies reported in the methods that OKS scores will be collected for all participants (Jawhar 2020; Liu 2014; however, for one study, no data were provided in the results section (Liu 2014). Four studies reported KSS score: three at three months (Ayik 2020; Ozkunt 2018; Liu 2017 b), and one at 12 months postoperatively (Liu 2017 b).
Global assessment of success
One study with 100 participants reported global assessment of success in terms of patient satisfaction (Huang 2017). Investigators reported the satisfaction level of participants based on a six‐point Likert scale ranging from extremely satisfied to very dissatisfied at discharge and at one, three, and six months after surgery. Results were reported as the number of patients who selected each option at each time point. Goel 2019 reported participant satisfaction based on a VAS at three months and at six months; however, study authors did not report what a 'satisfactory' score was, and so the data were not included in the analysis.
Health‐related quality of life
One study with 122 participants reported SF‐12 scores at six weeks and at eight months postoperatively (Goel 2019). One study with 99 participants reported EQ‐5D index and VAS scores at six weeks, six months, and 12 months (Jawhar 2020; however, we did not pool these data with data from the other study because we could not access standard deviations of the mean scores despite contacting study authors.
Serious adverse events
In all, 21 studies reported serious adverse events as defined in the methods section (Abdel‐Salem 1995; Alexandersson 2019; Ejaz 2015 b; Goel 2019; Huang 2017; Jawhar 2020; Kato 2002; Li 2008; Liu 2017; Liu 2017 b; Matziolis 2004; Molt 2014; Mori 2016; Tetro 2001; Vandenbussche 2001; Wakankar 1999; Wauke 2002; Wu 2018; Zhang 2010; Zhang 2016; Zhou 2017). 17 studies reported deep vein thrombosis (DVT) as an SAE (Abdel‐Salem 1995; Ejaz 2015 b; Goel 2019; Huang 2017; Jawhar 2020; Li 2008; Liu 2017 b; Molt 2014; Mori 2016; Tetro 2001; Vandenbussche 2001; Wakankar 1999; Wauke 2002; Wu 2018; Zhang 2010; Zhang 2016; Zhou 2017); five reported pulmonary embolism (PE) (Huang 2017; Kato 2002; Mori 2016; Wauke 2002; Wu 2018); one reported incidence of stroke as an SAE (Molt 2014); two reported nerve damage (Matziolis 2004; Vandenbussche 2001); 12 reported infection (Abdel‐Salem 1995; Alexandersson 2019; Goel 2019; Huang 2017; Jawhar 2020; Liu 2017; Liu 2017 b; Matziolis 2004; Tetro 2001; Vandenbussche 2001; Wu 2018; Zhou 2017); four reported re‐operation for reasons other than revision surgery (Jawhar 2020; Li 2008; Matziolis 2004; Wakankar 1999); and two reported the number of deaths (Molt 2014; Wakankar 1999).
Cognitive function
One study with 129 participants reported MoCA scores at days 1, 2, 3, and 7 postoperatively (Dong 2019). However, investigators reported these data only graphically, and despite contacting them, we were unable to obtain mean and SD values.
Survival of implant
We could not estimate the risk of revision due to the small total number of events. Studies included in this review had follow‐up limited to between one day and two years. Two studies with 164 participants reported the risk of revision surgery up to one year (Liu 2017; Liu 2017 b). However, investigators reported only two revisions; all were performed in the group that had total knee replacement with a tourniquet. One study with 50 participants reported risk of revision surgery up to two years (Ledin 2012). However, only one revision was performed, and this took place in the group that had total knee replacement without a tourniquet.
Minor outcomes
Blood loss
Fifteen studies reported intraoperative blood loss (Aglietti 2000; Dong 2019; Ejaz 2015 b; Harston 2015; Huang 2017; Juelsgaard 2001; Kato 2002; Li 2008; Li 2009; Tai 2012; Tetro 2001; Wu 2018; Zhang 2010; Zhang 2016; Zhou 2017), which was measured by volume in the suction tubing and weight of the sponges. Twelve studies reported postoperative blood loss (Aglietti 2000; Huang 2017; Juelsgaard 2001; Li 2008; Li 2009; Liu 2014; Ozkunt 2018; Vandenbussche 2001; Wauke 2002; Wu 2018; Zhang 2010; Zhou 2017), which was measured through volume in the drains. Eighteen studies reported overall blood loss (Abdel‐Salem 1995; Aglietti 2000; Dong 2019; Goel 2019; Huang 2017; Juelsgaard 2001; Ledin 2012; Li 2008; Li 2009; Mori 2016; Pfitzner 2014; Tai 2012; Tetro 2001; Vandenbussche 2001; Wu 2018; Yavarikia 2010; Zhang 2010; Zhou 2017), which was measured as combined intraoperative and postoperative blood loss or by the formula described in Gross 1983. Seventeen studies reported the number of units of blood transfused to patients in each group (Alexandersson 2019; Clarke 2001; Ejaz 2015 b; Huang 2017; Kiss 2005; Ledin 2012; Li 2008; Liu 2014; Matziolis 2004; Molt 2014; Ozkunt 2018; Tai 2012; Tetro 2001; Vandenbussche 2001; Wu 2018; Zhang 2016; Zhou 2017); three reported the volume of blood transfused in each group (Juelsgaard 2001; Kato 2002; Yavarikia 2010); nine reported the change in haemoglobin concentration as the change in concentration between the postoperative blood test and the preoperative sample (Alexandersson 2019; Kiss 2005; Li 2008; Matziolis 2004; Tai 2012; Tetro 2001; Yavarikia 2010; Wu 2018; Zhang 2016); and three reported a change in haematocrit concentration between preoperative and postoperative blood samples (Tai 2012; Yavarikia 2010; Zhou 2011).
Economic outcomes
None of the included studies reported resource usage.
Twelve studies reported length of stay measured in days from the date of admission to the date of discharge (Abdel‐Salem 1995; Harston 2015; Huang 2017; Ledin 2012; Liu 2014; Molt 2014; Tai 2012; Tetro 2001; Vandenbussche 2001; Wu 2018; Zhang 2016; Zhou 2017). Twenty‐seven studies reported duration of surgery measured in minutes (Aglietti 2000; Ayik 2020; Dong 2019; Ejaz 2015 b; Goel 2019; Harston 2015; Huang 2017; Jawhar 2015; Kato 2002; Kiss 2005; Ledin 2012; Li 2008; Li 2009; Liu 2014; Liu 2017; Liu 2017 b; Matziolis 2004; Molt 2014; Mori 2016; Tai 2012; Tetro 2001; Vandenbussche 2001; Wauke 2002; Wu 2018; Yavarikia 2010; Zhang 2016; Zhou 2017).
Implant stability
Two studies measured implant stability using radiostereometric (RSA) analysis (Ejaz 2014; Molt 2014). These studies reported maximum total point motion (MTPM) at eight weeks, at six months, at one year, and at two years.
Excluded studies
Randomised studies
Twelve studies were excluded following full‐text screening.
Six studies used a study comparator that did not meet our inclusion criteria. Brin 2015 and Dennis 2016 used a tourniquet for a reduced duration as the comparator. Friedrich 1990 used different regimens of tourniquet inflation as a comparator. Husted 2005 compared surgery with a tourniquet inflated in a straight knee versus a tourniquet inflated in a fully flexed knee. Padala 2004 compared surgery with a tourniquet and drains versus surgery without a drain. Nielsen 2016 compared topical versus systemic tranexamic acid application.
Harvey 1997 Huang 2015 and Nicolaiciuc 2019b used a study design that did not meet our inclusion criteria.
Dorr 2014 was a commentary piece.
Mourikis 2009 was a supplementary piece for a study that did not meet our inclusion criteria.
Non‐randomised studies
Sixteen non‐randomised studies were excluded following full‐text screening because they had a sample size less than 1000 (Ajnin 2020; Bakker 2019; Barros 2017; Burg 2009; Fakuda 2007; Hasanain 2018; Jarolem 1995; Kheir 2018; Matziolis 2011; Mourikis 2009; Mutlu 2015; Nicolaiciuc 2019; Nishiguchi 2008; Schimizu 2016; Schnettler 2017; Stroh 2011; Zhang 2019). We also searched registry reports; however, no registry report included data specifically related to tourniquet use and the outcomes of interest in this review.
Further details can be seen in Characteristics of excluded studies.
Ongoing studies
Following our search of trial registries, we identified 12 ongoing studies; for further details on study design, interventions, and outcomes, please see the Characteristics of ongoing studies section.
Risk of bias in included studies
The summary of risk of bias is presented in Figure 3 and Figure 4. Three trials met all methodological criteria for low risk of bias (Alexandersson 2019; Ayik 2020; Huang 2017). The other trials had sources of bias including unclear risk of selection bias, performance bias, and detection bias as blinding was not clearly stated in the methods nor in the protocol. The assessment of each domain of risk of bias for the included studies is summarised in the Characteristics of included studies section.

Risk of bias graph: review authors' judgements about each risk of bias item presented as percentages across all included studies.

Risk of bias summary: review authors' judgements about each risk of bias item for each included study.
Allocation
Overall, 12 studies (29%) had low risk of selection bias due to both random sequence generation and allocation concealment (Alexandersson 2019; Ayik 2020; Ejaz 2014; Ejaz 2015; Ejaz 2015 b; Goel 2019; Harston 2015; Huang 2017; Ledin 2012; Wu 2018; Zhou 2011; Zhou 2017). The remainder of studies (29 studies (71%)) had either unclear or high risk of bias for one of the two domains (Abdel‐Salem 1995; Aglietti 2000; Clarke 2001; Dong 2019; Jawhar 2015; Jawhar 2020; Juelsgaard 2001; Kato 2002; Kiss 2005; Kumar 2015; Li 2008; Li 2009; Liu 2014; Liu 2017; Liu 2017 b; Matziolis 2004; Molt 2014; Mori 2016; Ozkunt 2018; Pfitzner 2014; Tai 2012; Tetro 2001; Vandenbussche 2001; Vertullo 2017; Wakankar 1999; Wauke 2002; Yavarikia 2010; Zhang 2010; Zhang 2016). Further details can be found below.
A total of 24 studies (59%) had low risk of selection bias as the random sequence generation was clearly stated as computer generated (Alexandersson 2019; Goel 2019; Harston 2015; Huang 2017; Jawhar 2015; Jawhar 2020; Liu 2014; Matziolis 2004; Vertullo 2017; Wu 2018; Zhou 2011; Zhou 2017) or block randomised (Ayik 2020; Ejaz 2014; Ejaz 2015; Ejaz 2015 b; Ledin 2012), or based on a random number list (Li 2009; Liu 2017; Liu 2017 b; Mori 2016; Wakankar 1999; Zhang 2010) or a coin toss (Kumar 2015). The remaining studies were deemed to have unclear risk due to failure to explicitly state their randomisation method (Abdel‐Salem 1995; Aglietti 2000; Clarke 2001; Dong 2019; Juelsgaard 2001; Kato 2002; Kiss 2005; Li 2008; Mori 2016; Ozkunt 2018; Pfitzner 2014; Tai 2012; Tetro 2001; Vandenbussche 2001; Wauke 2002; Yavarikia 2010; Zhang 2016).
Nineteen of 41 studies (46%) were deemed to have low risk of selection bias due to allocation concealment. These studies used sealed envelopes (Alexandersson 2019; Ayik 2020; Clarke 2001; Ejaz 2014; Ejaz 2015; Ejaz 2015 b; Goel 2019; Harston 2015; Huang 2017; Ledin 2012; Molt 2014; Pfitzner 2014; Tai 2012; Tetro 2001; Vandenbussche 2001; Wu 2018; Yavarikia 2010; Zhou 2011; Zhou 2017). Three studies were deemed at high risk due to an open random allocation schedule (Li 2009; Matziolis 2004; Zhang 2010); the remainder were deemed to have unclear risk due to failure to explicitly state allocation concealment methods (Abdel‐Salem 1995; Aglietti 2000; Dong 2019; Jawhar 2015; Jawhar 2020; Juelsgaard 2001; Kato 2002; Kiss 2005; Kumar 2015; Li 2008; Liu 2014; Liu 2017; Liu 2017 b; Mori 2016; Ozkunt 2018; Vertullo 2017; Wakankar 1999; Wauke 2002; Zhang 2016).
Blinding
Performance bias
Due to the nature of the intervention, it was not possible for studies to blind the surgeons delivering the intervention. Despite this, it is unlikely that surgeons would want or would be able to alter their performance in these studies for main outcomes of interest. Duration of surgery is the most vulnerable outcome in this context. Sixteen studies (39%) were deemed to have low risk of performance bias as participants were blinded to the intervention (Alexandersson 2019; Ayik 2020; Goel 2019; Ejaz 2014; Ejaz 2015; Ejaz 2015 b; Huang 2017; Juelsgaard 2001; Ledin 2012; Li 2008; Li 2009; Liu 2014; Tai 2012; Tetro 2001; Vandenbussche 2001; Wu 2018). One study (4%) was deemed to have high risk as participants were aware of their treatment intervention (Harston 2015). Remaining studies (57%) were deemed to have unclear risk as blinding was not explicitly stated in the methods (Abdel‐Salem 1995; Aglietti 2000; Clarke 2001; Dong 2019; Jawhar 2015; Jawhar 2020; Kato 2002; Kiss 2005; Kumar 2015; Liu 2017; Liu 2017 b; Matziolis 2004; Molt 2014; Mori 2016; Ozkunt 2018; Pfitzner 2014; Vertullo 2017; Wakankar 1999; Wauke 2002; Yavarikia 2010; Zhang 2010; Zhang 2016; Zhou 2011; Zhou 2017).
Detection bias
Detection bias was assessed for both self‐reported outcomes (e.g. pain, function, global assessment of success, SAEs) and assessor‐reported outcomes (e.g. implant stability, blood loss). Twenty‐three (56%) studies were deemed to have low risk of detection bias for self‐reported outcomes due to blinding of participants (Aglietti 2000; Alexandersson 2019; Ayik 2020; Clarke 2001; Ejaz 2014; Ejaz 2015; Ejaz 2015 b; Goel 2019; Huang 2017; Juelsgaard 2001; Kiss 2005; Ledin 2012; Li 2008; Li 2009; Liu 2014; Liu 2017 b; Matziolis 2004; Tai 2012; Tetro 2001; Vandenbussche 2001; Vertullo 2017; Wu 2018; Yavarikia 2010); one study (2%) was deemed to have high risk as participants were not blinded and were responsible for self‐reported outcomes (Harston 2015), Seventeen studies (42%) were deemed to have unclear risk of detection bias as how outcomes were reported was not explicitly stated in the methods (Abdel‐Salem 1995; Dong 2019; Jawhar 2015; Jawhar 2020; Kato 2002; Kumar 2015; Liu 2017; Molt 2014; Mori 2016; Ozkunt 2018; Pfitzner 2014; Wakankar 1999; Wauke 2002; Zhang 2010; Zhang 2016; Zhou 2011; Zhou 2017).
Sixteen studies (39%) had low risk of detection bias for assessor‐reported outcomes (e.g. duration of surgery, length of hospital stay, blood loss, RSA analysis) as the methods clearly stated that outcome assessors were blinded (Alexandersson 2019; Goel 2019; Harston 2015; Huang 2017; Kiss 2005; Kumar 2015; Ledin 2012; Li 2008; Li 2009; Liu 2014; Liu 2017; Liu 2017 b; Tai 2012; Vandenbussche 2001; Vertullo 2017; Zhou 2011). Twenty‐three studies (56%) had unclear risk of detection bias for assessor‐reported outcomes as it was not explicitly stated in the methods whether outcome assessors were blinded (Abdel‐Salem 1995; Aglietti 2000; Ayik 2020; Clarke 2001; Dong 2019; Ejaz 2014; Ejaz 2015; Ejaz 2015 b; Jawhar 2015; Jawhar 2020; Juelsgaard 2001; Kato 2002; Matziolis 2004; Molt 2014; Mori 2016; Ozkunt 2018; Pfitzner 2014; Wakankar 1999; Wauke 2002; Yavarikia 2010; Zhang 2010; Zhang 2016; Zhou 2017). Two studies (5%) were deemed to have high risk as outcome assessors were not blinded (Tetro 2001; Wu 2018).
Incomplete outcome data
Twelve (29%) studies were deemed to have unclear risk of attrition bias due to incomplete reporting of attrition (Abdel‐Salem 1995; Clarke 2001; Jawhar 2015; Juelsgaard 2001; Kato 2002; Kumar 2015; Li 2009; Liu 2017Liu 2017 b; Matziolis 2004; Yavarikia 2010; Zhang 2010). These studies did not include CONSORT diagrams and did not clearly state the reasons for missing outcome data. The remainder of studies were deemed as having low risk of attrition bias. In these studies, no outcome data were missing or the missing outcome data were balanced in number across intervention groups with similar reasons for missing data across groups.
Selective reporting
Fourteen (34%) studies were deemed to have low risk of reporting bias (Alexandersson 2019; Ayik 2020; Dong 2019; Ejaz 2014; Ejaz 2015; Ejaz 2015 b; Goel 2019; Harston 2015; Huang 2017; Jawhar 2020; Kiss 2005; Molt 2014; Wu 2018; Zhou 2017). These studies reported all outcomes clearly specified in the trial registration document, protocol, or methods. The remaining studies were deemed to have unclear risk due to insufficient information to permit judgement. These studies were not registered at a clinical trials registry and had no accessible protocol. One study (3%) was deemed to have high risk as outcomes clearly stated in the protocol were not reported in the final study report (Jawhar 2015).
Other potential sources of bias
Two studies (5%) were deemed to have an additional source of bias related to study design. In both these studies, the comparators were different methods of anaesthesia used in the group that had a tourniquet and in the group that did not. Measured outcomes therefore could have been biased by additional differences in interventions other than those of interest. Juelsgaard 2001 investigated surgery with epidural anaesthesia without a tourniquet versus spinal anaesthesia with a tourniquet; blood loss and transfusion rate were the outcomes of interest. Kiss 2005 compared epinephrine‐augmented hypotensive epidural anaesthesia without a tourniquet versus normotensive epidural anaesthesia with a tourniquet.
Effects of interventions
The results described were derived when knee replacement with a tourniquet was compared to knee replacement without a tourniquet. None of the included studies reported the effect of tourniquet use on unicondylar or revision knee replacement surgery. All studies reported the effects of an inflatable tourniquet; no studies reported effects of a non‐inflatable tourniquet.
Major outcomes
Pain
The primary endpoint for pain was day 1 postoperative pain scores, as this is the point at which the intervention is likely to have the greatest effect. Moderate‐quality evidence based on eight studies of 577 participants shows that postoperative pain scores were statistically significantly higher on day 1 postoperatively in the surgery with a tourniquet group compared to the surgery without a tourniquet group (Abdel‐Salem 1995; Alexandersson 2019; Dong 2019; Kumar 2015; Li 2008; Liu 2014; Liu 2017; Tai 2012). The mean pain score in the surgery without a tourniquet group was 4.56, and the mean pain score in the surgery with a tourniquet group was 5.81. The mean difference was 1.25 (95% confidence interval (CI) 0.32 to 2.19) (with higher pain scores in the surgery with a tourniquet group). The I² value was 94%; the most likely reason for this considerable heterogeneity is clinical diversity, which is explored in the discussion. Further details of the analysis can be seen in Analysis 1.1. Although the mean difference is above the threshold for clinical significance based on a minimum clinically important difference (MCID) for VAS for pain of one (Dworkin 2008; Kelly 2001; Wall 2017), the lower boundary of the confidence interval indicates that the results may or may not be clinical noticeable to the patient. The relative per cent change was 19% worse (3.4% worse to 49% worse) for pain scores in the surgery with a tourniquet group.
Postoperative pain levels can fluctuate and are likely to be higher in the the early postoperative phase; therefore, we analysed the data on different postoperative days.
Six studies involving 394 participants reported pain two days postoperatively (Dong 2019; Kumar 2015; Li 2008; Liu 2014; Pfitzner 2014; Tai 2012). Tourniquet use was associated with a mean difference of 0.37 (95% CI ‐0.03 to 0.76; I² = 48%) for higher pain scores compared to not using a tourniquet; however, this difference was not statistically significant.
Ten studies involving 807 participants reported postoperative pain at day 3 (Alexandersson 2019; Dong 2019; Ejaz 2014; Kumar 2015; Ledin 2012; Liu 2014; Liu 2017; Pfitzner 2014; Tai 2012; Zhang 2016). Using a tourniquet was associated with a significantly higher pain score when compared to not using a tourniquet. A mean difference of 0.78 (95% CI 0.34 to 1.23; I² = 87%) was noted for higher pain scores when a tourniquet was used compared to when a tourniquet was not used.
Six studies involving 562 participants reported postoperative pain at two weeks (Dong 2019; Kumar 2015; Li 2008; Liu 2017; Tai 2012; Zhang 2016). Using a tourniquet was associated with a statistically significantly higher postoperative mean pain score when compared to not using a tourniquet (mean difference (MD) 0.32, 95% CI 0.12 to 0.53; I² = 72%).
Six studies involving 637 participants reported postoperative pain at the six‐week stage (Alexandersson 2019; Goel 2019; Kumar 2015; Liu 2017; Ozkunt 2018; Zhang 2016). There was no significant difference in pain scores between the two groups (MD 0.38, 95% CI ‐0.48 to 1.23; I² = 98%).
Four other studies reported pain as an outcome; however, these data were not included in the pooled results as we could not accurately extract the data from graphical plots, or because raw data were not available despite contact with study authors. Vandenbussche 2001 and Zhou 2017 reported pain scores that were significantly lower in the group without a tourniquet compared to the group with a tourniquet. Wakankar 1999 reported no significant difference between treatment groups. Wu 2018 reported that surgery with a tourniquet was associated with significantly higher pain scores at days 1, 2, and 3 postoperatively. There was no significant difference between the two groups at one month and at six months postoperatively.
Function
Nine studies investigated the effects of tourniquet use on knee function scores (Abdel‐Salem 1995; Ayik 2020; Ejaz 2015 b; Goel 2019; Huang 2017; Jawhar 2015; Liu 2017 b; Ozkunt 2018; Zhou 2017). For all reported outcomes measuring function, higher score indicates better function.
Three studies reported change in HSS score. Abdel‐Salem 1995 found no difference between the tourniquet group and the control group in HSS at one year postoperatively (mean HHS 23 in the tourniquet group versus 26 in the control group). Huang 2017 reported change in HSS at six months postoperatively with no significant difference between the two groups (mean HSS 45 in the tourniquet group versus 44.7 in the group without a tourniquet). Zhou 2017 reported no significant difference in change in HSS score at six months (mean HSS 43 in the tourniquet group versus 40.2 in the group without a tourniquet).
Liu 2017 b reported 12‐month KSS scores and found no significant differences between the two groups. The mean KSS score in the surgery with a tourniquet group was 93.2, and it was 93.3 in the surgery without a tourniquet group. Investigators also found no significant differences in KSS score between the two groups at three months (90.3 in the tourniquet group and 90.2 in the no tourniquet group). Ozkunt 2018 found that using a tourniquet was associated with a significantly lower KSS score at three months compared to not using a tourniquet (mean KSS score in the surgery with a tourniquet group was 63, and it was 82 in the group without a tourniquet; P = 0.02). Ayik 2020 found no difference in KSS scores at three months between the two groups, with a mean KSS score of 79 in the tourniquet group and 76 in the group without a tourniquet.
Ejaz 2015 b reported the change in KOOS score up to 12 months postoperatively between the group with a tourniquet and the group without a tourniquet. These investigators found no significant difference between the two groups at 12 months postoperatively in any of the KOOS domains (pain, symptoms, activities of daily living, sports/recreation, and quality of life). However, at two months postoperatively, the group without a tourniquet was associated with significantly higher KOOS scores in all domains. Goel 2019 found no difference in KOOS scores between the two groups at three months postoperatively. In particular, the KOOS activities of daily living (ADL) mean score was 69.15 in the tourniquet group and 69.06 in the group without a tourniquet.
Four studies involving 425 participants reported three‐month patient‐reported functional outcome scores (Ayik 2020; Goel 2019; Liu 2017 b; Ozkunt 2018). There was no significant difference in these scores at three months between the two groups. The standardised mean difference between the two groups was a 0.64 lower function score in the tourniquet group (95% CI 1.52 lower to 0.25 higher) compared to the group without a tourniquet (standardised mean difference (SMD) ‐0.64, 95% CI ‐1.52 to 0.25; I² = 94%) (Analysis 1.2). The mean difference was calculated using a reference standard deviation (SD) from a selected study (Liu 2017 b); the mean difference was found to be 3.07 (95% CI 7.30 lower to 1.2 higher) lower function scores at three months (7.30 to 1.2) in the surgery with a tourniquet group. The absolute difference is 3.07% lower (7.3% lower to 1.2% higher) function scores at three months in the surgery with a tourniquet group. The relative difference is 5.98% (14.2% lower to 2.34% higher) lower function scores in the surgery with a tourniquet group.
Five studies involving 611 participants reported 12‐month patient‐reported functional outcome scores (Abdel‐Salem 1995; Goel 2019; Huang 2017; Liu 2017 b; Zhou 2017). There was no significant difference in these scores at 12 months. The mean score in the tourniquet group was 89.5, and the mean score in the group without a tourniquet was 90.0. The standardised mean difference was 0.06 lower (95% CI 0.22 lower to 0.10 higher; I² = 0%) in the surgery with a tourniquet group compared to the group without a tourniquet (Analysis 1.3). The mean difference was translated back from the baseline SD in the control group of a selected paper (Liu 2017 b). The mean difference was found to be 0.29 points worse (1.06 worse to 0.48 better) in the tourniquet group. The absolute difference between the two groups was 0.29% worse for scores in the tourniquet group (1.06% worse to 0.48% better) than for scores in the surgery with a tourniquet group. Relative changes were calculated relative to baseline in the surgery with a tourniquet group (i.e. absolute change (mean difference) divided by the mean at baseline in the surgery without a tourniquet group) from Liu 2017 b (values were 51.3 on a 0 to 100 point KSS score scale for function). The relative difference was 0.57% worse scores (2.07% worse to 0.94% better) in the surgery with a tourniquet group. The I² was reported as 0%, and the evidence was graded as low quality due to risk of bias and imprecision. All patient‐reported functional outcome scores included were measured on a 0 to 100 scale, with higher scores indicating better outcomes. Previous studies have demonstrated an MCID of 5.9 for KSS and 5.0 for OKS, respectively (Chean Lee 2017; Clement 2014). Therefore none of the differences in patient‐reported function were deemed to be clinically significant, as the minimum difference did not exceed the MCID.
We did not include Ejaz 2015 b in the meta‐analysis as no raw data were available despite contact with study authors. We did not include Jawhar 2020 in the meta‐analysis as study authors reported OKS and WOMAC scores. Both were different scales from those used for patient‐reported functional scores included in the meta‐analysis. Jawhar 2020 found no significant difference in OKS or WOMAC scores at six weeks or at six months.
Global assessment of success
Based on a single study, we found no evidence of clinically important between‐group differences in the proportion of participants who were satisfied with their treatment. Huang 2017 reported the number of patients satisfied with their procedure at discharge, at one month, at three months, and at six months. We grouped the patients reporting that they were 'very satisfied' or 'extremely satisfied' with their procedure for this review. At three months, 47 out of 50 participants were satisfied with their procedure in the surgery with a tourniquet group and 46 out of 50 participants were satisfied with their procedure in the group without a tourniquet. The risk ratio was 1.02 (95% CI 0.92 to 1.14) (Analysis 1.4).
At six months, there was no significant difference in the number of participants satisfied with their procedure. At six months, 47 out of 50 participants were satisfied with their procedure in the surgery with a tourniquet group and 47 out of 50 participants were satisfied with their procedure in the group without a tourniquet. The risk ratio was 1.0 (95% CI 0.91 to 1.10) (Analysis 1.5). The relative per cent change was 0% (95% CI 10 fewer to 9.4 more) fewer satisfied following surgery with a tourniquet. The evidence was graded as moderate quality and was downgraded due to the low total number of events.
Health‐related quality of life
Goel 2019 reported mean SF‐12 scores at six months postoperatively. There was no significant difference in SF‐12 scores between the two groups. The mean SF‐12 mental component score in the tourniquet group was 54.64 (9.33). The mean score in the non‐tourniquet group was 1.53 higher (95% CI 0.85 lower to 3.91 higher). This led to an absolute effect of 1.53% better (0.85% worse to 3.91% better) scores in the non‐tourniquet group. Evidence was graded as low quality due to risk of bias and imprecision (Analysis 1.7).
There was no significant difference in SF‐12 mental component scores at six weeks between the two groups. The mean difference was 2.58 (95% CI ‐0.09 to 5.25) higher scores in the non‐tourniquet group (Analysis 1.6).
Jawhar 2020 reported EQ‐5D at six weeks and at six months and found no significant differences between the two groups. The six‐week EQ‐5D score was 70 in both groups, and the six‐month EQ‐5D score was 74 in the surgery with a tourniquet group and 75 in the group without a tourniquet. We did not include this in the meta‐analysis, as we could not access the standard deviations of mean scores despite contact with authors.
Serious adverse events
Based upon moderate‐quality evidence from 21 studies involving 1799 participants, the risk of serious adverse events was significantly greater in the group that had surgery with a tourniquet compared to the group without a tourniquet (risk ratio (RR) 1.73, 95% CI 1.10 to 2.73) (Analysis 1.8) (Abdel‐Salem 1995; Alexandersson 2019; Ejaz 2015 b; Goel 2019; Huang 2017; Jawhar 2020; Kato 2002; Li 2008; Liu 2017; Liu 2017 b; Matziolis 2004; Molt 2014; Mori 2016; Tetro 2001; Vandenbussche 2001; Wakankar 1999; Wauke 2002; Wu 2018; Zhang 2010; Zhang 2016; Zhou 2011). The absolute difference was 2.99% (0.29% more to 5.00% more) more SAEs in the surgery with a tourniquet group with a relative difference of 73% (10% more to 173% more) greater risk of SAE in the tourniquet group. The number needed to treat for additional harm (NNTH) is 48 (20 to 345) participants to have surgery with a tourniquet for one SAE. Confidence intervals around absolute risk demonstrate an effect equal or greater than 0.29%, which was deemed to be highly clinically relevant given the seriousness of the outcome.
Study authors consulted with key stakeholders including patients, lay members of the public, and surgeons and concluded that an RR of 1.73 and the precision of this estimate (95% confidence interval 1.1 to 2.73) were highly clinically relevant given the seriousness of the outcome; therefore this evidence was deemed clinically significant. The serious adverse events reported included deep vein thrombosis, pulmonary embolism, infection, re‐operation, and mortality. When studies reported more than one SAE, we would include the results from only one SAE, as it is unclear whether one SAE led to the development of another. For example, Wauke 2002 reported two instances of DVT and one of PE in the surgery with tourniquet group. For the purposes of the meta‐analysis, we reported this as two SAEs.
Two studies reported mortality at 30 days postoperatively (Molt 2014; Wakankar 1999). Molt 2014 reported that there was one death in the group that had surgery without a tourniquet and no deaths in the group with a tourniquet. Wakankar 1999 reported two deaths in the group without a tourniquet and one death in the tourniquet group. In both these studies, study authors concluded that the cause of mortality was not related to the treatment interventions.
Seventeen studies involving 1575 participants reported the incidence of venous thromboembolic events (VTEs) (pulmonary embolism and deep vein thrombosis) following total knee replacement surgery (Abdel‐Salem 1995; Ejaz 2015 b; Goel 2019; Huang 2017; Jawhar 2015; Kato 2002; Li 2008; Liu 2017 b; Molt 2014; Tetro 2001; Vandenbussche 2001; Wakankar 1999; Wauke 2002; Wu 2018; Zhang 2016; Zhang 2010; Zhou 2011). Tourniquet use was associated with significantly higher risk of VTE compared to surgery without a tourniquet (RR 1.95, 95% CI 0.99 to 3.82; I² = 0%) (Analysis 1.9).
Sixteen studies involving 1499 participants reported incidences of symptomatic deep vein thrombosis following total knee replacement surgery (Abdel‐Salem 1995; Ejaz 2015 b; Goel 2019; Huang 2017; Jawhar 2020; Li 2008; Liu 2017 b; Molt 2014; Tetro 2001; Vandenbussche 2001; Wakankar 1999; Wauke 2002; Wu 2018; Zhang 2016; Zhang 2010; Zhou 2011). Tourniquet use was associated with higher risk of symptomatic DVT; however, this difference was not significant (RR 1.83, 95% CI 0.92 to 3.65; I² = 0%). Mori 2016 reported both symptomatic and asymptomatic DVTs. When data from Mori 2016 were combined with data from the sixteen studies reporting symptomatic DVT, a significantly increased risk of DVT was evident in the group having surgery with a tourniquet (RR 2.05, 95% CI 1.35 to 3.13; I² = 0%) (Analysis 1.10).
Five studies involving 416 participants reported the incidence of pulmonary embolism following total knee replacement surgery (Huang 2017; Kato 2002; Mori 2016; Wauke 2002; Wu 2018). There was no significant difference in risk of pulmonary embolism between the two groups (RR 4.51, 95% CI 0.49 to 41.81; I² = 0%) (Analysis 1.11).
Three studies involving 157 participants reported the incidence of re‐operation (without revision of components) following total knee replacement surgery (Li 2008; Matziolis 2004; Wakankar 1999). There was no significant difference in risk of re‐operation between the two groups. Reasons for re‐operation included revision of a superficial wound disorder and manipulation under anaesthesia to improve flexion and range of motion (RR 1.63, 95% CI 0.61 to 4.34; I² = 0%) (Analysis 1.13).
Nine studies involving 846 participants reported the incidence of wound infection following total knee replacement surgery (Abdel‐Salem 1995; Goel 2019; Huang 2017; Liu 2017; Liu 2017 b; Matziolis 2004; Tetro 2001; Vandenbussche 2001; Zhou 2011). Tourniquet use was associated with significantly higher risk of developing wound infection when compared to use of control. The authors of these studies did not state whether these were superficial or deep infections, nor did they present the criteria used to diagnose the infection (RR 2.72, 95% CI 1.15 to 6.42; I² = 0%) (Analysis 1.12).
Cognitive function
One study involving 122 participants reported MoCA scores at days 1, 2, 3, and 7 postoperatively (Dong 2019). However, data were visible only graphically. We were unable to extract data accurately or to obtain data by contacting study authors. Study authors reported no difference in MoCA scores at day 7 postoperatively between the two groups.
Survival of the implant
Two studies involving 164 participants reported the risk of revision surgery up to one year (Liu 2017; Liu 2017 b), and one study involving 50 participants reported the risk of revision surgery up to two years (Ledin 2012). It is uncertain if knee replacement with a tourniquet has an effect on survival of the implant up to two years (RR 1.44, 95% CI 0.23 to 8.92; I² = 0%) (Analysis 1.14). There was an absolute difference of 0.4% more (0.7% lower to 7% more). The relative difference was 44% higher (77% lower to 892% higher) in the surgery with a tourniquet group. This evidence was graded as low quality due to risk of bias and serious imprecision.
Minor outcomes
Blood loss
Intraoperative blood loss
Fifteen studies involving 1187 participants reported intraoperative blood loss in patients who underwent knee replacement surgery with and without a tourniquet (Aglietti 2000; Dong 2019; Ejaz 2015 b; Harston 2015; Huang 2017; Juelsgaard 2001; Kato 2002; Li 2008; Li 2009; Tai 2012; Tetro 2001; Wu 2018; Zhang 2010; Zhang 2016; Zhou 2011). Surgery with a tourniquet was associated with significantly less intraoperative blood loss when compared to the control. The mean difference between the two groups was 147.05 mL (95% CI ‐190.97 to ‐103.12; I² = 99%) (Analysis 1.16).
Postoperative blood loss
Twelve studies involving 776 participants reported postoperative blood loss in patients who underwent knee replacement surgery with and without a tourniquet (Aglietti 2000; Huang 2017; Juelsgaard 2001; Li 2008; Li 2009; Liu 2014; Ozkunt 2018; Vandenbussche 2001; Wauke 2002; Wu 2018; Zhang 2010; Zhou 2011). Surgery with a tourniquet was associated with significantly greater postoperative blood loss when compared to the control. The mean difference between the two groups was 57.72 mL (95% CI 13.58 to 101.87; I² = 93%) (Analysis 1.17).
Overall blood loss
Eighteen studies involving 1500 participants reported overall blood loss in the two treatment groups (Abdel‐Salem 1995; Aglietti 2000; Dong 2019; Goel 2019; Huang 2017; Juelsgaard 2001; Ledin 2012; Li 2008; Li 2009; Mori 2016; Pfitzner 2014; Tai 2012; Tetro 2001; Vandenbussche 2001; Wu 2018; Yavarikia 2010; Zhang 2010; Zhou 2011). There was no significant difference in overall blood loss among patients who underwent knee replacement surgery with a tourniquet and patients who underwent surgery without a tourniquet. The mean difference was 8.61 mL (95% CI ‐83.76 to 100.97; 18 studies; I² = 96%) (Analysis 1.18).
Blood transfusion risk
Eighteen studies involving 1285 participants reported blood transfusion risk in patients undergoing total knee replacement surgery with and without a tourniquet (Alexandersson 2019; Clarke 2001; Ejaz 2015 b; Huang 2017; Juelsgaard 2001; Kiss 2005; Ledin 2012; Li 2008; Liu 2014; Matziolis 2004; Molt 2014; Ozkunt 2018; Tai 2012; Tetro 2001; Vandenbussche 2001; Wu 2018; Zhang 2016; Zhou 2011). Although the risk of blood transfusion was higher in the tourniquet group compared to the control group, this difference was not significant (RR 1.20, 95% CI 0.86 to 1.67; I² = 29%) (Analysis 1.15).
Blood transfusion volume
Two studies reported blood transfusion volume rather than the number of patients receiving a blood transfusion (Kato 2002; Yavarikia 2010). Kato 2002 found that although the transfusion volume was greater in the control group, this difference was not significant (409 mL (150) versus 54 mL (151)). Yavarikia 2010 found no significant difference in blood transfusion volume between the two groups (248 mL (201) versus 239 mL (144 mL)).
Change in haemoglobin
Nine studies involving 713 participants reported change in haemoglobin among patients undergoing knee replacement surgery with and without a tourniquet (Alexandersson 2019; Kiss 2005; Li 2008; Matziolis 2004; Tai 2012; Tetro 2001; Wu 2018; Yavarikia 2010; Zhang 2016). There was no significant difference in change in haemoglobin (g/dL) between the two groups (MD ‐0.14, 95% CI ‐0.48 to 0.19; I² = 85%) (Analysis 1.19).
Economic outcomes
Duration of surgery
Twenty‐seven studies involving 2070 participants reported duration of surgery in patients undergoing knee replacement with a tourniquet and without a tourniquet (Aglietti 2000; Ayik 2020; Dong 2019; Ejaz 2015 b; Goel 2019; Harston 2015; Huang 2017; Jawhar 2015; Kato 2002; Kiss 2005; Ledin 2012; Li 2008; Li 2009; Liu 2014; Liu 2017; Liu 2017 b; Matziolis 2004; Molt 2014; Mori 2016; Tai 2012; Tetro 2001; Vandenbussche 2001; Wauke 2002; Wu 2018; Yavarikia 2010; Zhang 2016; Zhou 2011). Tourniquets were associated with significantly reduced length of surgery when compared to the control. The mean difference was 3.7 minutes less in the surgery with a tourniquet group (95% CI ‐5.53 to ‐1.87; I² = 82%) (Analysis 1.21).
Length of hospital stay
Twelve studies involving 995 participants reported length of stay for patients undergoing knee replacement surgery with and without a tourniquet (Abdel‐Salem 1995; Harston 2015; Huang 2017; Ledin 2012; Liu 2014; Molt 2014; Tai 2012; Tetro 2001; Vandenbussche 2001; Wu 2018; Zhang 2016; Zhou 2011). Surgery with a tourniquet was associated with significantly greater length of hospital stay when compared to surgery without a tourniquet. The mean difference was 0.34 days longer in the surgery with a tourniquet group (95% CI 0.03 to 0.64; I² = 78%) (Analysis 1.20).
Adverse events
None of the included studies reported any adverse events additional to those already described in the section on SAEs.
Implant stability
Two studies involving 130 participants assessed implant stability based on maximum total point motion (MTPM; higher values indicating greater implant movement and less stability) using radiostereometric analysis (RSA) (Ejaz 2014; Molt 2014). There was no significant difference in MTPM between the two groups at eight weeks (MD ‐0.06, 95% CI ‐0.13 to 0.01), at 12 months (MD 0.05, 95% CI ‐0.09 to 0.18) and at 24 months (MD 0.06, 95% CI ‐0.08 to 0.19) (Analysis 1.22; Analysis 1.23; Analysis 1.24).
Sensitivity analysis and assessment of heterogeneity
Heterogeneous study sensitivity analysis
Seven of the included studies were substantially different from the remainder. Huang 2017 compared the effects of tranexamic acid and tourniquet use in knee replacement. Both Juelsgaard 2001 and Kiss 2005 had different types of anaesthesia in in their comparator groups. Juelsgaard 2001 compared hypotensive epidural anaesthesia without a tourniquet versus spinal anaesthesia with a tourniquet. Kiss 2005 compared normotensive epidural anaesthesia with a tourniquet versus hypotensive epidural anaesthesia without a tourniquet. Kumar 2015, Liu 2017, and Liu 2017 b all included participants undergoing bilateral knee replacement surgery, with each knee acting as the unit of analysis. Mori 2016 reported the risk of deep vein thrombosis; however, these investigators performed an ultrasound on all participants, thereby potentially including patients with asymptomatic deep vein thrombosis.
A formal sensitivity analysis was performed by removing each of these studies from the outcomes included in this review.
Pain
With all studies included, the mean difference in day 1 pain scores was 1.25 (95% CI 0.32 to 2.19; I² = 94%).
After removal of Liu 2017, the difference between the two groups remained significant. Surgery with a tourniquet was associated with 1.32 (95% CI 0.20 to 2.43; I² = 95%) points higher on a 10‐point scale.
After removal of Kumar 2015, the difference between the two groups remained significant. Surgery with a tourniquet was associated with 1.18 (95% CI 0.16 to 2.19; I² = 95%) points higher on a 10‐point scale.
Function
With all studies included, the standardised mean difference for short‐term function scores was ‐0.64 (95% CI ‐1.52 to 0.25; I² = 94%).
Removal of Liu 2017 led to no significant change in the results for short‐term function scores. The SMD was ‐0.93 (95% CI ‐2.38 to 0.48; I² = 96%).
With all studies included, the standardised mean difference for medium‐term function scores was ‐0.06 (95% CI ‐0.22 to 0.10; I² = 0%).
Removal of Liu 2017 led to no significant change in results for medium‐term function scores. The SMD was ‐0.06 (95% CI ‐0.26 to 0.13; I² = 15%). Similarly, removal of Huang 2017 had no significant effect (SMD ‐0.03, 95% CI ‐0.2 to 0.14; I² = 0%).
Global assessment of success
Huang 2017 was the only study that reported global assessment of success.
Health‐related quality of life
None of the above studies reported health‐related quality of life.
Serious adverse events
With all studies included, the RR was 1.73 (95% CI 1.10 to 2.73; I² = 0%). When studies were removed, there remained a statistically significantly higher risk of SAEs in the group that had surgery with a tourniquet compared to the group that had surgery without a tourniquet. With removal of Huang 2017, the risk was 1.71 (95% CI 1.08 to 2.71; I² = 0%). Removal of Liu 2017 led to risk of 1.71 (95% CI 1.08 to 2.71; I² = 0%). Removal of Liu 2017 b led to risk of 1.86 (95% CI 1.14 to 3.02; I² = 0%). Finally, removal of Mori 2016 led to risk of 1.73 (95% CI 1.1 to 2.73; I² = 0%).
When the results of Mori 2016 (included asymptomatic DVTs) were included, the risk of developing a DVT was significantly higher in the tourniquet group compared to the control group (RR 2.11, 95% CI 1.37 to 3.23; I² = 0%) compared to 2.05 (95% CI 1.35 to 3.13; I² = 0%) when this study was not included.
Cognitive function
None of the studies above reported cognitive function.
Survival of the implant
With all studies included, the risk ratio was 1.44 (95% CI 0.23 to 8.92; I² = 0%). Removal of Liu 2017 and Liu 2017 b led to no change in the overall significance of the results. The risk was 0.99 (95% CI 0.11 to 9.30; I² = 0%) when Liu 2017 was removed and 1.00 (95% CI 0.11 to 9.30; I² = 0%) when Liu 2017 b was removed.
Outcome analysis, which had 'substantial' or 'considerable' heterogeneity, included 'postoperative pain: day 1', 'postoperative pain: week 2', 'postoperative pain: week 6', 'blood loss: intraoperative', 'blood loss: postoperative', 'blood loss: overall', 'blood loss: change in haemoglobin', 'economic: length of hospital stay', and 'economic: duration of surgery'. The reasons for this heterogeneity are explored in the discussion.
Risk of bias sensitivity analysis
Pain
Selection bias sensitivity analysis
With all studies included, the mean difference in pain scores was 1.25 points (95% CI 0.32 to 2.19; I² = 94%) higher for pain scores in the surgery with a tourniquet group. When the seven studies with unclear risk of selection bias were removed (Abdel‐Salem 1995; Dong 2019; Kumar 2015; Li 2008; Liu 2014; Liu 2017; Tai 2012), pain scores were still significantly higher in the surgery with a tourniquet group compared to the surgery without a tourniquet group (MD 1.65, 95% CI 0.93 to 2.37).
Performance bias sensitivity analysis
When four studies with unclear risk of performance bias were removed (Abdel‐Salem 1995; Dong 2019; Kumar 2015; Liu 2017), pain scores remained significantly higher in the surgery with a tourniquet group (MD 0.79, 95% CI 0.01 to 1.56; I² = 66%) compared to a mean difference of 1.25 (95% CI 0.32 to 2.19; I² = 94%) when all studies were included.
Detection bias sensitivity analysis
When four studies with unclear risk of detection bias were removed (Abdel‐Salem 1995; Dong 2019; Kumar 2015; Liu 2017), pain scores remained significantly higher in the surgery with a tourniquet group (MD 0.79, 95% CI 0.01 to 1.56; I² = 66%) compared to a mean difference of 1.25 (95% CI 0.32 to 2.19; I² = 94%) when all studies were included.
Function
Selection bias sensitivity analysis
When studies with unclear or high risk of selection bias at 12 months were removed (Abdel‐Salem 1995; Liu 2017), there was still no significant difference in function (SMD ‐0.02, 95% CI ‐0.24 to 0.2; I² = 22%) compared to an SMD of ‐0.06 (95% CI ‐0.22 to 0.10; I² = 0%) when no studies were excluded.
Performance bias sensitivity analysis
When studies with unclear or high risk of performance bias were removed (Abdel‐Salem 1995; Liu 2017; Zhou 2017), there was no significant difference in function at 12 months (SMD ‐0.13, 95% CI ‐0.36 to 0.11; I² = 0%) compared to an SMD of ‐0.06 (95% CI ‐0.22 to 0.10; I² = 0%) when no studies were excluded.
Detection bias sensitivity analysis
When studies with unclear or high risk of detection bias were removed (Abdel‐Salem 1995; Liu 2017; Zhou 2017), there was no significant difference in function at 12 months (SMD ‐0.13, 95% CI ‐0.36 to 0.11; I² = 0%) compared to an SMD of ‐0.06 (95% CI ‐0.22 to 0.10; I² = 0%) when no studies were excluded.
Global assessment of success
Huang 2017 was the only study that reported this outcome. This study did not have unclear or high risk of detection bias, performance bias, or selection bias.
Health‐related quality of life
Goel 2019 was the only study that reported this outcome. This study did not have unclear or high risk of detection bias, performance bias, or selection bias.
Serious adverse events
Selection bias sensitivity analysis
When 15 studies with unclear or high risk of selection bias were removed (Abdel‐Salem 1995; Jawhar 2020; Kato 2002; Li 2008; Liu 2017; Liu 2017 b; Matziolis 2004; Molt 2014; Mori 2016; Tetro 2001; Vandenbussche 2001; Wakankar 1999; Wauke 2002; Zhang 2010; Zhang 2016), the risk of SAEs between groups was no longer statistically significant (RR 1.64, 95% CI 0.68 to 3.92; I² = 0%). When all studies were included, the RR was 1.73 (95% CI 1.10 to 2.73; I² = 0%).
Performance bias sensitivity analysis
When 13 studies with unclear or high risk of performance bias were removed (Abdel‐Salem 1995; Jawhar 2020; Kato 2002; Liu 2017; Liu 2017 b; Matziolis 2004; Molt 2014; Mori 2016; Wakankar 1999; Wauke 2002; Zhang 2010; Zhang 2016; Zhou 2011), the difference in risk of SAEs between groups was no longer statistically significant (RR 1.78, 95% CI 0.74 to 4.26; I² = 0%). This differed from the results when all studies were included, which produced an RR of 1.73 (95% CI 1.10 to 2.73; I² = 0%).
Detection bias sensitivity analysis
When 13 studies with unclear or high risk of detection bias were removed (Abdel‐Salem 1995; Ejaz 2015 b; Jawhar 2020; Kato 2002; Matziolis 2004; Molt 2014; Mori 2016; Tetro 2001; Wakankar 1999; Wauke 2002; Wu 2018; Zhang 2010; Zhang 2016), the difference in risk between groups was no longer statistically significant (RR 1.40, 95% CI 0.70 to 2.79; I² = 0%). Again, this differed from the results when all studies were included, which produced an RR of 1.73 (95% CI 1.10 to 2.73; I² = 0%).
Cognitive function
No data for this outcome were collected.
Survival of implant
Selection bias sensitivity analysis
When studies at high or unclear risk of selection bias were removed (Liu 2017; Liu 2017 b), there remained no significant difference in risk of revision surgery between the two groups (RR 0.33, 95% CI 0.01 to 7.81; I² = 0%). When all studies were included, the risk of revision surgery was found to be 1.44 (95% CI 0.23 to 8.92; I² = 0%).
Performance bias sensitivity analysis
When studies at high or unclear risk of performance bias were removed (Liu 2017; Liu 2017 b), there remained no significant difference in risk of revision surgery between the two groups (RR 0.33, 95% CI 0.01 to 7.81; I² = 0%). When all studies were included, the risk of revision surgery was found to be 1.44 (95% CI 0.23 to 8.92; I² = 0%).
Detection bias sensitivity analysis
When all studies were included, the risk of revision surgery was found to be 1.44 (95% CI 0.23 to 8.92; I² = 0%). No included studies were at high or unclear risk of detection bias.
Publication bias
Publication bias was assessed with the aid of funnel plots for all major outcomes. Funnel plots were symmetrical for postoperative pain, function, and survival of the implant. Formal statistical tests were performed when more than 10 trials were pooled (SAEs, blood loss, duration of surgery, length of hospital stay). There was no statistically significant sign of publication bias for serious adverse events, length of stay, or postoperative and overall blood loss (P > 0.05). There was evidence of publication bias for studies reporting intraoperative blood loss and duration of surgery (P < 0.05). Table 2 shows the results of publication bias testing.
| Outcome | Bias estimate (standard error) | P value |
| Pain | 3.875 (2.168) | 0.097 |
| Intraoperative blood loss | ‐8.732 (2.596) | 0.005 |
| Overall blood loss | 5.585 (3.968) | 0.178 |
| Postoperative blood loss | ‐0.049 (3.420) | 0.989 |
| Transfusion rate | 0.47 (0.63) | 0.468 |
| Length of stay | 0.219 (2.182) | 0.922 |
| Duration of surgery | ‐2.947 (1.113) | 0.014 |
| Serious adverse events | 0.567 (0.552) | 0.318 |
Discussion
Summary of main results
This review includes 41 randomised controlled trials involving 2819 participants, which investigated the effects of tourniquet use on total knee replacement surgery.
Eight studies reporting day 1 postoperative pain scores were included in this review. Moderate‐quality evidence shows that surgery with a tourniquet was associated with statistically significantly higher pain scores when compared to surgery without a tourniquet. This difference may or may not be noticeable to patients, as the lower boundary of the confidence interval is below the minimum clinically important difference (MCID) for pain (Dworkin 2008). The evidence was downgraded due to risk of bias, as many studies had high or unclear risk of allocation concealment, blinding, and selection and detection bias. Five studies reported medium‐term function scores. Moderate‐quality evidence shows that surgery with a tourniquet confers little or no clinically important difference in knee function. Evidence was downgraded due to risk of bias, again because many studies had unclear or high risk of allocation concealment and blinding, leading to potential for selection and detection bias and likely overestimation of the effect. Low‐quality evidence suggests that surgery with a tourniquet was associated with little or no clinically important difference in global assessment of success and health‐related quality of life. The evidence was downgraded due to risk of bias and imprecision, as the studies included small numbers of participants.
Twenty‐one studies reported serious adverse events. Moderate‐quality evidence shows that surgery with a tourniquet was probably associated with higher risk of serious adverse events when compared to surgery without a tourniquet. Evidence was downgraded due to risk of bias. Serious adverse events included deep vein thrombosis, pulmonary embolism, infection, and re‐operation for reasons other than implant loosening. Surgery with a tourniquet was associated with a significantly higher risk of deep vein thrombosis and infection when compared to surgery without a tourniquet. Studies found that surgery with a tourniquet was not associated with increased risk of pulmonary embolism and re‐operation when compared to surgery without a tourniquet.
Very low‐quality evidence suggests an uncertain effect of surgery with a tourniquet on risk of revision surgery when compared to surgery without a tourniquet. Evidence was downgraded due to risk of bias and serious imprecision, as total numbers in each arm were low (only three revision surgeries across both arms over two years). No data on cognitive function were extracted.
We also reported minor outcomes in this review, which were not included in our 'Summary of findings' table. This review found that surgery with a tourniquet was not associated with a significant effect on overall blood loss when compared to surgery without a tourniquet. Surgery with a tourniquet was associated with significantly increased length of hospital stay and a reduced duration of surgery when compared to surgery without a tourniquet. Use of a tourniquet was not associated with any meaningful difference in implant stability at two years. Studies reported no difference on radiostereometric analysis (RSA) analysis at eight weeks, at one year, and at two years. RSA analysis was utilised as a surrogate marker of implant stability; all included studies reported implant stability in patients undergoing cemented total knee replacement (TKR). None of the included studies reported any additional adverse events.
A sensitivity analysis was performed when studies that were substantially different from other studies were removed. Removal of these studies led to no difference in overall results for the major outcomes included in this review. When studies with unclear or high risk of bias were removed, there were no differences in the results reported for pain, function, global assessment of success, health‐related quality of life, and survival of the implant. However, when these studies were removed, there was no longer a statistically significant difference in the risk of serious adverse events between the two groups.
Overall completeness and applicability of evidence
This review included 41 studies reporting outcomes for participants undergoing primary TKR surgery. Thirty‐seven of these studies were single‐centre studies that compared surgery with a tourniquet versus surgery without a tourniquet. More than 50% of the studies had high or unclear risk of bias. Reasons for increased risk of bias included unclear surgeon blinding and unclear allocation concealment and randomisation. Studies were conducted in 15 different countries, and all participants had features of osteoarthritis or rheumatoid arthritis requiring TKR. Participants in both groups were similar in terms of mean age, mean body mass index (BMI), gender distribution, and baseline pain and function scores. All included studies reported similar anticoagulation and anaesthetic regimens. Given that the inclusion criteria were similar across all studies, the results of this review are applicable to similar patients undergoing primary TKR in clinical practice.
Measurement of pain varied across trials, with studies reporting pain from day 1 through six weeks. Our primary endpoint for pain was postoperative day 1, as this was when the intervention had the greatest effect. We also reported pain scores up to six weeks postoperatively. Regarding function, studies used different outcome measures. Given that function scores used similar scales in the same direction, we reported the standardised mean difference between the two groups. No data for cognitive function could be accurately extracted from the studies included in this review; as a result, no conclusions could be reached for this outcome. None of the included studies reported outcomes for patients undergoing revision surgery or unicondylar knee replacement with a tourniquet; therefore these results are not directly applicable to patients in clinical practice.
Many of the included studies reported only the minor outcomes included in this review (e.g. blood loss, economic outcomes). As a result, these studies were included in this review but were not included in the 'Summary of findings' table. This explains why out of 41 studies, only 21 studies were included in the 'Summary of findings' table.
It would have been interesting to explore the relationship between duration of tourniquet use and outcomes; however, the studies included in this review provided insufficient details on duration of tourniquet use and were not designed to measure a dose‐response effect.
The included studies did not explore relationships between high‐ and low‐risk patients for deep vein thrombosis (DVT) and surgery with a tourniquet. Twenty‐five studies reported regimens for DVT prevention that included use of chemical thromboprophylaxis; however, the remaining studies did not. Therefore, an evidence gap is apparent when the association between DVT and surgery with a tourniquet in high‐ or low‐risk patients and the impact of DVT prevention are explored.
Quality of the evidence
The quality of evidence for the outcomes included in this review was graded ‘high’ to ‘low’ based on the GRADE criteria.
Moderate quality
Pain, function, and serious adverse events were graded as moderate‐quality evidence; they were downgraded due to risk of bias. Considerable heterogeneity was noted for pain scores at day 1; however this is likely to be due to differences in the types of anaesthetic and analgesic regimens used and in the exact timing of assessment, all of which led to clinical diversity. Furthermore, the direction of the clinical effect on pain was consistent across all studies and at other time points. We did not downgrade this outcome for inconsistency because the heterogeneity was expected. A random‐effects model was used to incorporate heterogeneity amongst studies (Deeks 2020).
Low quality
Health‐related quality of life and global assessment of success were graded as low‐quality evidence. The reasons for downgrading were risk of bias and imprecision due to low total study numbers.
Very low quality
Implant survival was graded as very low‐quality evidence. The reasons for downgrading were risk of bias and serious imprecision due to low total numbers of events in each arm. A total of three revision surgeries were reported across both arms over two years; as a result, the evidence was downgraded twice for imprecision.
Potential biases in the review process
Our review was based on an extensive electronic literature search and a search for unpublished trials; therefore it is unlikely that relevant trials were missing from this review, provided that they were published as full‐text articles or were accessible in trial registries (Egger 2003). Two review authors independently selected studies, extracted data, and assessed ‘risk of bias’ to reduce bias and transcription errors. As a result, we believe potential biases were minimised during the review process.
Limitations
Considerable statistical heterogeneity was observed for pain at day 1 (94%). Through consultation with the Cochrane Handbook for Systematic Reviews of Interventions, the review authors believe this was secondary to clinical diversity. Although all studies used the same scale to measure outcomes, participants could have experienced differences including in the amount and type of analgesia, the type of anaesthesia, or the duration of tourniquet use. The amount and type of analgesia were not clearly stated amongst the studies. In addition, pain measurements could have been taken at different times of the day, including before or after physiotherapy; this could explain the clinical heterogeneity. Considerable heterogeneity was also noted for knee function at three months; again this could be explained by clinical heterogeneity, as different tools were used to assess function. Medium‐term knee function scores presented in the 'Summary of findings' table showed no heterogeneity (Deeks 2020).
There was also heterogeneity in the following minor outcomes ‐ duration of surgery, length of hospital stay, and blood loss ‐ due to methodological differences in study design and in ways each outcome was measured. For example, intraoperative blood loss was measured through suction drainage or by the change in weight of swabs used during the operation. Both of these methods are surrogate measures of intraoperative blood loss, and heterogeneity could influence the final results. Many studies did not report the criteria used for diagnosis of wound infection; this may have differed across the included studies.
We included studies with small total numbers of participants and studies with small total numbers of events, which can cause problems with precision of estimated treatment effects. However, in the absence of large multi‐centre trials or registry data, meta‐analysis of data from multiple small trials may be the only way to obtain reliable evidence of an effect for rare but serious outcomes.
The impact of the duration of tourniquet use was not measured, as most studies provided insufficient detail to allow this. However, previous research has demonstrated comparable pain scores and knee function scores between surgery with a tourniquet for the whole procedure versus tourniquet used for part of the procedure (Viashya 2018), but findings show that longer duration of tourniquet use is associated with increased risk of complications.
No published registry data reported outcomes following tourniquet use, and we did not attempt to seek unpublished data from registries, as this was beyond the scope of the review.
Publication bias was formally tested using funnel plots and statistical tests. Statistical evidence of publication bias was noted for intraoperative blood loss and duration of surgery. However, a tourniquet by design restricts intraoperative blood flow and therefore intraoperative blood loss. As a result, there are unlikely to be studies that demonstrate a non‐significant result for this outcome. It is likely that even if studies reported non‐significant results, this would not affect the overall study findings.
Agreements and disagreements with other studies or reviews
Four previous non‐Cochrane reviews have been performed, most of which have focused on blood loss with little focus on risk of pain and complications.
Smith 2010 reviewed 15 studies (nine randomised controlled trials (RCTs) and six observational studies) with 991 participants and found that tourniquet use was associated with significantly greater intraoperative blood loss; however, review authors noted no difference in total blood loss or complications.
Tai 2011 included eight RCTs and three prospective studies with 634 participants. Review authors reported that tourniquet use was associated with significantly reduced intraoperative blood loss and increased risk of thromboembolic events (risk ratio (RR) 1.91, 95% confidence interval (CI) 1.05 to 3.49). There was no significant difference in postoperative blood loss or in total blood loss. Tourniquet use was associated with significantly reduced duration of surgery.
Alcelik 2012 reported on 10 RCTs with 493 participants. Review authors reported that tourniquet use was associated with significantly reduced intraoperative and postoperative blood loss. There was no difference in deep vein thrombosis (DVT) or in pulmonary embolism (PE); however, tourniquet use was associated with significantly greater numbers of complications.
Zhang 2014 performed a meta‐analysis of 13 RCTs involving 689 participants. Tourniquet use was associated with significantly reduced intraoperative blood loss (weighted mean difference ‐198.21 mL, 95% CI ‐279.82 to ‐116.60) and reduced duration of surgery (weighted mean difference ‐4.57 minutes, 95% CI ‐7.59 to ‐1.56). However there was no significant difference in total blood loss or in blood transfusion rate. Tourniquets were associated with significantly higher risk of thrombotic events (RR 5.0, 95% CI 1.31 to 19.10) and non‐thrombotic complications (RR 2.03, 95% CI 1.12 to 3.67).
Our review is the largest to date (41 RCTs; 2819 participants). Our findings are consistent with those of previous reviews for blood loss and duration of surgery. Previous reviews have alluded to greater risk of complications, which is consistent with our finding that risk of serious adverse events is significantly increased when a tourniquet is used. Previous reviews have not reported on pain, patient‐reported function, health‐reported quality of life, survival of the implant, length of hospital stay, and implant stability, making our review the most comprehensive review completed to date.
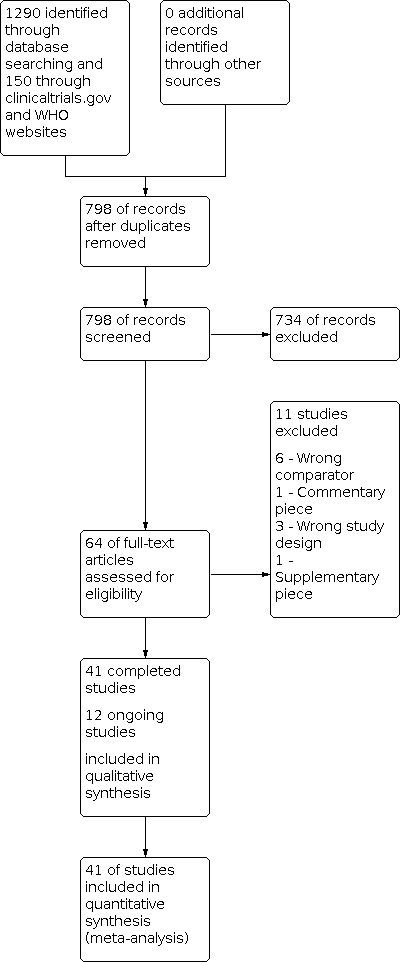
Study flow diagram: search for randomised controlled trials.

Study flow diagram: search for non‐randomised studies.

Risk of bias graph: review authors' judgements about each risk of bias item presented as percentages across all included studies.

Risk of bias summary: review authors' judgements about each risk of bias item for each included study.

Comparison 1: Surgery with a tourniquet vs surgery without a tourniquet, Outcome 1: Pain at different postoperative days (visual analogue scale 0 to 10, lower is better)

Comparison 1: Surgery with a tourniquet vs surgery without a tourniquet, Outcome 2: Function: patient‐reported knee function at 3 months (scale 0 to 100, higher is better)

Comparison 1: Surgery with a tourniquet vs surgery without a tourniquet, Outcome 3: Function: patient‐reported knee function at 12 months (scale 0 to 100, higher is better)

Comparison 1: Surgery with a tourniquet vs surgery without a tourniquet, Outcome 4: Global assessment of success: participant‐reported satisfaction at 3 months (based on number of participants, higher is better)

Comparison 1: Surgery with a tourniquet vs surgery without a tourniquet, Outcome 5: Global assessment of success: participant‐reported satisfaction at 6 months (based on number of participants, higher is better)

Comparison 1: Surgery with a tourniquet vs surgery without a tourniquet, Outcome 6: Health‐related quality of life: SF‐12 mental component at 6 weeks (0 to 100, higher is better)

Comparison 1: Surgery with a tourniquet vs surgery without a tourniquet, Outcome 7: Health‐related quality of life: SF‐12 mental component at 6 months (0 to 100, higher is better)

Comparison 1: Surgery with a tourniquet vs surgery without a tourniquet, Outcome 8: Serious adverse events

Comparison 1: Surgery with a tourniquet vs surgery without a tourniquet, Outcome 9: Serious adverse event: venous thromboembolic event (VTE)

Comparison 1: Surgery with a tourniquet vs surgery without a tourniquet, Outcome 10: Serious adverse event: deep vein thrombosis (DVT)

Comparison 1: Surgery with a tourniquet vs surgery without a tourniquet, Outcome 11: Serious adverse event: pulmonary embolism (PE)

Comparison 1: Surgery with a tourniquet vs surgery without a tourniquet, Outcome 12: Serious adverse event: infection

Comparison 1: Surgery with a tourniquet vs surgery without a tourniquet, Outcome 13: Serious adverse event: re‐operation

Comparison 1: Surgery with a tourniquet vs surgery without a tourniquet, Outcome 14: Survival of the implant: risk of revision up to 2 years

Comparison 1: Surgery with a tourniquet vs surgery without a tourniquet, Outcome 15: Blood loss: postoperative transfusion risk (lower is better)

Comparison 1: Surgery with a tourniquet vs surgery without a tourniquet, Outcome 16: Blood loss: intraoperative (mL, lower is better)

Comparison 1: Surgery with a tourniquet vs surgery without a tourniquet, Outcome 17: Blood loss: postoperative (mL, lower is better)

Comparison 1: Surgery with a tourniquet vs surgery without a tourniquet, Outcome 18: Blood loss: overall blood loss (mL, lower is better)

Comparison 1: Surgery with a tourniquet vs surgery without a tourniquet, Outcome 19: Blood loss: change in haemoglobin (g/dL, lower is better)

Comparison 1: Surgery with a tourniquet vs surgery without a tourniquet, Outcome 20: Economic: length of hospital stay (days, lower is better)

Comparison 1: Surgery with a tourniquet vs surgery without a tourniquet, Outcome 21: Economic: duration of surgery (minutes, lower is better)

Comparison 1: Surgery with a tourniquet vs surgery without a tourniquet, Outcome 22: Implant stability: maximum total point motion at 8 weeks (mm, lower is better)

Comparison 1: Surgery with a tourniquet vs surgery without a tourniquet, Outcome 23: Implant stability: maximum total point motion at 1 year (mm, lower is better)

Comparison 1: Surgery with a tourniquet vs surgery without a tourniquet, Outcome 24: Implant stability: maximum total point motion at 2 years (mm, lower is better)
| Participants: patients undergoing knee replacement surgery Settings: hospitals around the world performing knee replacement surgery Intervention: surgery performed with a tourniquet for all or part of the procedure Comparator: surgery performed without a tourniquet | ||||||
|---|---|---|---|---|---|---|
| Outcomes | Anticipated absolute effects* | Relative effect (95% CI) | No. of participants | Certainty of the evidence | Comments | |
| Risk without tourniquet | Risk with tourniquet | |||||
| Pain Visual analogue scale (VAS) for pain from zero to 10 (higher scores indicate more pain) Follow‐up day 1 postoperative pain scores | Mean pain was 4.56 | MD 1.25 worse pain | ‐ | 577 (8 RCTs) | ⊕⊕⊕⊝ | Knee replacement with a tourniquet led to higher postoperative pain scores at day 1, although this difference may or may not be noticeable to patients b Absolute difference 12.5% worse (3.2% worse to 21.9% worse) Relative difference 19% worse (3.4% worse to 49% worse)c |
| Function Similar 0 to 100 scales (100 is best) were used to measure the same conceptual functional outcome: Knee Injury and Osteoarthritis Outcome Score Activities of Daily Living (KOOS‐ADL); Knee Society Score (KSS); Hospital for Special Surgery Score (HSS) Follow‐up 12 months | Mean function was 90.03 | MD 0.29 worse function (1.06 worse to 0.48 better)d | ‐ | 611 (5 RCTs) | ⊕⊕⊕⊝ MODERATEa | Knee replacement with tourniquet probably has little or no meaningful effect on function b Absolute difference 0.29% worse (1.06% worse to 0.48% better) Relative difference 0.57% worse (2.07% worse to 0.94% better)c |
| Global assessment of success Participants reporting overall successful treatment and satisfactione Follow‐up 6 months | 940 per 1000 | 940 per 1000 (855 to 1034) | RR 1.0 (0.91 to 1.10) | 100 (1 RCT) | ⊕⊕⊝ LOWa,f | Number of participants reporting success may not differ Absolute difference 0% (8.5% worse to 9.4% better) Relative difference 0% (9% worse to 10% better) |
| Health‐related quality of life SF‐12 mental component from zero to 100 (100 is best) Follow‐up 6 months | Mean health‐related quality of life was 54.64 | MD 1.53 better (0.85 worse to 3.91 better) | 199 | ⊕⊕⊝ | Knee replacement with tourniquet may have little or no meaningful effect on health‐related quality of lifeb Absolute difference 1.53% better (0.85% worse to 3.91% better) Relative difference 3% better (2% worse to 7% better)c | |
| Serious adverse events | 29 per 1000 | 59 per 1000 (32 to 79) | RR 1.73 | 1799 | ⊕⊕⊕⊝ | Knee replacement with tourniquet probably has a meaningful effect on risk of serious adverse events Absolute difference 2.1% more (0.29% more to 5.00% more)g Relative difference 73% (10% more to 173% more) Number needed to harm (NNTH) is 48 (20 to 345) participants to have surgery with a tourniquet for 1 serious adverse event (venous thromboembolism, infection, or re‐operation) |
| Cognitive function | ‐ | ‐ | ‐ | ‐ | ‐ | No studies with adequate data |
| Survival of the implant Risk of revision At 1 year | 9 per 1000 | 13 per 1000 (2 to 83) | RR 1.44 (0.23 to 8.92) | 214 | ⊕⊕⊕⊝ | It is uncertain if knee replacement has an effect on survival of implant at 1 year Absolute difference 0.4% more (0.7% less to 7% more) in the surgery with a tourniquet group Relative difference 44% more (77% lower to 892% more) in the surgery with a tourniquet group |
| *The risk in the intervention group (and its 95% confidence interval) is based on the assumed risk in the comparison group and the relative effect of the intervention (and its 95% CI). | ||||||
| GRADE Working Group grades of evidence. | ||||||
| aDowngraded by one level due to risk of bias. Many studies had unclear risk of allocation concealment and unclear risk of participant blinding. bWe assumed that clinically important improvement was 1 point or 10% absolute improvement for pain on a VAS (0 to 10) (Dworkin 2008; Kelly 2001; Wall 2017); 5.3 points or 5.3% absolute improvement in KSS for function (Chean Lee 2017), and 10 points or 10% absolute improvement for health‐related quality of life. cRelative changes calculated relative to baseline in the surgery with a tourniquet group (i.e. absolute change (mean difference) divided by mean at baseline in the surgery without a tourniquet group from Liu 2017 b (values were 6.54 points on a 0 to 10 point VAS scale for pain and 51.3 on a 0 to 100 point KSS scale for function) and Goel 2019 (values were 54.64 on a 0 to 100 point SF‐12 mental component score for continuous outcomes). dThe mean difference was calculated by multiplying the SMD by the baseline SD (4.8) of the control group (Liu 2017 b). eParticipant satisfaction was derived from one study (Huang 2017). Satisfaction was defined as the number of participants who were 'extremely' or 'very' satisfied with their treatment. fDowngraded by one level due to imprecision. Small total number of participants. Not enough information to calculate effect estimate precisely. gConfidence intervals around absolute risk demonstrated an effect equal to or greater than 0.29%, which was deemed to be highly clinically relevant given the seriousness of the outcome. The total number of events was low; however, this was expected, and we did not downgrade for imprecision, as this was is in line with previous literature on SAEs (Benjamin 2016), which reported an incidence of VTE of 2.4% in patients undergoing TKR. Our results therefore do not indicate a 'low' total number of events for this outcome of interest. hDowngraded again due to very serious imprecision (only three events reported across the studies). | ||||||
| Author | Number of participants | Number in tourniquet group | Number in control group | Mean age in tourniquet group (SD) | Mean age in control group (SD) | Proportion of males in tourniquet group, % | Proportion of males in control group, % | BMI in tourniquet group (SD) | BMI in control group (SD) |
| Abdel‐Salem 1995 | 80 | 40 | 40 | 73 | 73 | ||||
| Aglietti 2000 | 20 | 10 | 10 | 70 (8) | 68 (4.5) | 30 | 40 | 27.9 | 27.3 |
| Alexandersson 2018 | 81 | 38 | 43 | 68 (7.4) | 69.7 (6.4) | 47 | 51 | 28.6 (3.4) | 27.9 (3.5) |
| Ayik 2020 | 65 | 32 | 33 | 65.39 (7.25) | 64.90 (6.58) | 44 | 42 | 31.38 (4.72) | 30.3 (7.1) |
| Clarke 2001 | 31 | 21 | 10 | ||||||
| Dong 2019 | 122 | 58 | 64 | 68.2 (17.1) | 69.5 (15.9) | 34 | 35 | ||
| Ejaz 2014 | 64 | 33 | 31 | 68 (8.4) | 68 (7.4) | 55 | 55 | 25 (2) | 25 (2.5) |
| Ejaz 2015 | 62 | 31 | 31 | 68 (6.3) | 68.2 (7.2) | 52 | 55 | 25.1 (2) | 25.2 (2.5) |
| Ejaz 2015 b | 57 | 29 | 28 | 68.3 (8.4) | 68.2 (7.8) | 45 | 54 | 25.1 (2) | 25.2 (2.5) |
| Goel 2019 | 199 | 100 | 99 | 66.0 (7.0) | 65.5 (7.8) | 50 | 48 | 30.9 (4.6) | 31.3 (4.5) |
| Harston 2015 | 64 | 32 | 32 | 68 (8) | 66 (8) | 27.4 | 28.4 | ||
| Huang 2017 | 100 | 50 | 50 | 66.2 (8.3) | 65.1 (8.1) | 36 | 32 | 25.1 (1.5) | 24.2 (1.5) |
| Jawhar 2015 | 34 | 17 | 17 | 70.6 (6) | 70.6 (6) | 53 | 53 | 32.1 (5) | 33.8 (5) |
| Jawhar 2019 | 99 | 50 | 49 | 69.3 (7.4) | 68.3 ± 7.8 | 34 | 39 | 31.9 (6) | 31.4 (5.5) |
| Juelsgaard 2001 | 30 | 16 | 14 | 69 | 64 | 44 | 29 | ||
| Kato 2002 | 46 | 22 | 24 | 65 | 63 | ||||
| Kiss 2015 | 100 | 51 | 49 | 72.6 (7.1) | 74.7 (7.4) | 20 | 27 | 28.8 (3.9) | 28.5 (3.3) |
| Kumar 2015 | 30 | 30 | 30 | 58 | 58 | 30 | 30 | ||
| Ledin 2012 | 50 | 25 | 25 | 70 (8) | 71 (6) | 67 | 39 | 29 (4.8) | 28 (4.8) |
| Li 2008 | 60 | 30 | 30 | 71 (7) | 70 (7) | 24 (5) | 24 (5) | ||
| Li 2009 | 80 | 40 | 40 | 71 (6) | 70 (7) | 28 | 33 | 27.3 (6.3) | 26.8 (5.1) |
| Liu 2014 | 20 | 10 | 10 | 67 | 60 | 70 | 90 | 25.5 | 28.7 |
| Liu 2017 | 52 | 52 | 52 | 67 (8) | 67 (8) | 28.1 (5.5) | 28.1 (5.5) | ||
| Liu 2017 b | 26 | 26 | 26 | 65.8 (9.2) | 65.8 (9.2) | 35 | 35 | 28.2 (5.6) | 28.2 (5.6) |
| Matziolis 2015 | 20 | 10 | 10 | 72.4 | 76.6 | 80 | 70 | 28.3 | 29.5 |
| Molt 2014 | 60 | 30 | 30 | 70 (7) | 67 (9) | 53 | 53 | 28 (3) | 28 (3) |
| Mori 2016 | 103 | 51 | 52 | 72.8 (7.3) | 74.6 (7.6) | 12 | 17 | 27.7 (3.4) | 29.2 (3.9) |
| Ozkunt 018 | 49 | 24 | 25 | 65.05 | 65.05 | ||||
| Pfitzner 2014 | 90 | 45 | 45 | 69.3 | 70.5 | 47 | 24 | 27.8 | 26 |
| Tai 2012 | 72 | 36 | 36 | 72.1 (6.9) | 71.5 (6.8) | 28.6 (4.5) | 27.9 (4.2) | ||
| Tetro 2001 | 63 | 33 | 30 | 69.8 (6.7) | 69.8 (9) | 45 | 37 | ||
| Vandenbussche 2001 | 80 | 40 | 40 | 72.5 | 68.5 | 22.5 | 40 | ||
| Vertullo 2017 | 40 | 20 | 20 | 67.85 (6.91) | 65.65 (8.54) | 50 | 55 | 30.43 (5.07) | 31 (5.31) |
| Wakankar 1999 | 77 | 37 | 40 | 72.5 | 71.8 | 30 | 35 | ||
| Wauke 2002 | 37 | 19 | 18 | 63.2 (8.7) | 61.4 (7.4) | ||||
| Wu 2018 | 100 | 50 | 50 | 68.06 (3.16) | 67.58 (4.61) | 38 | 44 | 23.87 (2.13) | 24.10 (2.16) |
| Yavarikia 2010 | 51 | 22 | 29 | 68 | 66 | 27 | 24 | ||
| Zhang 2010 | 60 | 30 | 30 | 72 (6) | 71 (6) | 27 | 37 | 25 (4) | 26 (4) |
| Zhang 2016 | 166 | 84 | 82 | 84 | 82 | ||||
| Zhou 2011 | 39 | 20 | 19 | 63.12 (6.79) | 61.89 (7.93) | 35 | 26 | ||
| Zhou 2017 | 140 | 72 | 68 | 72 | 68 | 18 | 10 | 26.1 (4.1) | 25.7 (3.4) |
| Outcome | Bias estimate (standard error) | P value |
| Pain | 3.875 (2.168) | 0.097 |
| Intraoperative blood loss | ‐8.732 (2.596) | 0.005 |
| Overall blood loss | 5.585 (3.968) | 0.178 |
| Postoperative blood loss | ‐0.049 (3.420) | 0.989 |
| Transfusion rate | 0.47 (0.63) | 0.468 |
| Length of stay | 0.219 (2.182) | 0.922 |
| Duration of surgery | ‐2.947 (1.113) | 0.014 |
| Serious adverse events | 0.567 (0.552) | 0.318 |
| Outcome or subgroup title | No. of studies | No. of participants | Statistical method | Effect size |
| 1.1 Pain at different postoperative days (visual analogue scale 0 to 10, lower is better) Show forest plot | 14 | Mean Difference (IV, Random, 95% CI) | Subtotals only | |
| 1.1.1 Pain: day 1 | 8 | 577 | Mean Difference (IV, Random, 95% CI) | 1.25 [0.32, 2.19] |
| 1.1.2 Pain: day 2 | 6 | 394 | Mean Difference (IV, Random, 95% CI) | 0.37 [‐0.03, 0.76] |
| 1.1.3 Pain: day 3 | 10 | 807 | Mean Difference (IV, Random, 95% CI) | 0.78 [0.34, 1.23] |
| 1.1.4 Pain: week 2 | 6 | 562 | Mean Difference (IV, Random, 95% CI) | 0.32 [0.12, 0.53] |
| 1.1.5 Pain: week 6 | 6 | 637 | Mean Difference (IV, Random, 95% CI) | 0.38 [‐0.48, 1.23] |
| 1.2 Function: patient‐reported knee function at 3 months (scale 0 to 100, higher is better) Show forest plot | 4 | 425 | Std. Mean Difference (IV, Random, 95% CI) | ‐0.64 [‐1.52, 0.25] |
| 1.3 Function: patient‐reported knee function at 12 months (scale 0 to 100, higher is better) Show forest plot | 5 | 611 | Std. Mean Difference (IV, Random, 95% CI) | ‐0.06 [‐0.22, 0.10] |
| 1.4 Global assessment of success: participant‐reported satisfaction at 3 months (based on number of participants, higher is better) Show forest plot | 1 | 100 | Risk Ratio (M‐H, Random, 95% CI) | 1.02 [0.92, 1.14] |
| 1.5 Global assessment of success: participant‐reported satisfaction at 6 months (based on number of participants, higher is better) Show forest plot | 1 | 100 | Risk Ratio (M‐H, Random, 95% CI) | 1.00 [0.91, 1.10] |
| 1.6 Health‐related quality of life: SF‐12 mental component at 6 weeks (0 to 100, higher is better) Show forest plot | 1 | 199 | Mean Difference (IV, Random, 95% CI) | 2.58 [‐0.09, 5.25] |
| 1.7 Health‐related quality of life: SF‐12 mental component at 6 months (0 to 100, higher is better) Show forest plot | 1 | 199 | Mean Difference (IV, Random, 95% CI) | 1.53 [‐0.85, 3.91] |
| 1.8 Serious adverse events Show forest plot | 21 | 1799 | Risk Ratio (M‐H, Random, 95% CI) | 1.73 [1.10, 2.73] |
| 1.9 Serious adverse event: venous thromboembolic event (VTE) Show forest plot | 17 | 1575 | Risk Ratio (M‐H, Random, 95% CI) | 1.95 [0.99, 3.82] |
| 1.10 Serious adverse event: deep vein thrombosis (DVT) Show forest plot | 17 | 1602 | Risk Ratio (M‐H, Random, 95% CI) | 2.05 [1.35, 3.13] |
| 1.10.1 Symptomatic DVT | 16 | 1499 | Risk Ratio (M‐H, Random, 95% CI) | 1.83 [0.92, 3.65] |
| 1.10.2 Asymptomatic DVT | 1 | 103 | Risk Ratio (M‐H, Random, 95% CI) | 2.20 [1.29, 3.74] |
| 1.11 Serious adverse event: pulmonary embolism (PE) Show forest plot | 5 | 416 | Risk Ratio (M‐H, Random, 95% CI) | 4.51 [0.49, 41.81] |
| 1.12 Serious adverse event: infection Show forest plot | 9 | 846 | Risk Ratio (M‐H, Random, 95% CI) | 2.72 [1.15, 6.42] |
| 1.13 Serious adverse event: re‐operation Show forest plot | 3 | 157 | Risk Ratio (M‐H, Random, 95% CI) | 1.63 [0.61, 4.34] |
| 1.14 Survival of the implant: risk of revision up to 2 years Show forest plot | 3 | 214 | Risk Ratio (M‐H, Random, 95% CI) | 1.44 [0.23, 8.92] |
| 1.15 Blood loss: postoperative transfusion risk (lower is better) Show forest plot | 18 | 1286 | Risk Ratio (M‐H, Random, 95% CI) | 1.20 [0.86, 1.67] |
| 1.16 Blood loss: intraoperative (mL, lower is better) Show forest plot | 15 | 1187 | Mean Difference (IV, Random, 95% CI) | ‐147.05 [‐190.97, ‐103.12] |
| 1.17 Blood loss: postoperative (mL, lower is better) Show forest plot | 12 | 776 | Mean Difference (IV, Random, 95% CI) | 57.72 [13.58, 101.87] |
| 1.18 Blood loss: overall blood loss (mL, lower is better) Show forest plot | 18 | 1500 | Mean Difference (IV, Random, 95% CI) | 8.61 [‐83.76, 100.97] |
| 1.19 Blood loss: change in haemoglobin (g/dL, lower is better) Show forest plot | 9 | 713 | Mean Difference (IV, Random, 95% CI) | ‐0.14 [‐0.48, 0.19] |
| 1.20 Economic: length of hospital stay (days, lower is better) Show forest plot | 12 | 995 | Mean Difference (IV, Random, 95% CI) | 0.34 [0.03, 0.64] |
| 1.21 Economic: duration of surgery (minutes, lower is better) Show forest plot | 27 | 2070 | Mean Difference (IV, Random, 95% CI) | ‐3.70 [‐5.53, ‐1.87] |
| 1.22 Implant stability: maximum total point motion at 8 weeks (mm, lower is better) Show forest plot | 2 | 130 | Mean Difference (IV, Random, 95% CI) | ‐0.06 [‐0.13, 0.01] |
| 1.23 Implant stability: maximum total point motion at 1 year (mm, lower is better) Show forest plot | 2 | 130 | Mean Difference (IV, Random, 95% CI) | 0.05 [‐0.09, 0.18] |
| 1.24 Implant stability: maximum total point motion at 2 years (mm, lower is better) Show forest plot | 2 | 130 | Mean Difference (IV, Random, 95% CI) | 0.06 [‐0.08, 0.19] |