Resultados obstétricos después del tratamiento conservador para las lesiones intraepiteliales cervicales y la enfermedad invasiva temprana
Referencias
Referencias de los estudios incluidos en esta revisión
Referencias de los estudios excluidos de esta revisión
Referencias de los estudios en espera de evaluación
Referencias adicionales
Referencias de otras versiones publicadas de esta revisión
Characteristics of studies
Characteristics of included studies [ordered by study ID]
| Methods | Retrospective cohort study Comparison group: A) External ‐ matching for age (+/‐ 3 years), parity, date of delivery, smoking (+/‐ 5 cigarettes per day) and previous obstetric history B) Internal (pre‐treatment pregnancies) Information source ‐ Hospital records of the University Hospital of Northern Norway | |
| Participants | A) Treated group: 79 women < 45 years who had a LLETZ (December 1995 to December 2000) and subsequently delivered (> 20 weeks) at the University Hospital of Northern Norway. Inclusion criteria: only first pregnancies (> 20 weeks) following LLETZ Exclusion criteria: Women with ectopic pregnancies, miscarriages, TOPs. Untreated group: 158 matched women who were identified using routinely entered data from the birth register. B) Of the 79 women of the treated group, 45 were parous. The last pregnancy before LLETZ of these 45 women can serve as an internal comparison group. | |
| Interventions | LLETZ | |
| Outcomes | PTB (< 37 weeks); threatened PTL; chorioamnionitis; induction of labour; LBW (< 2500 g); perinatal mortality | |
| Notes | Because all women included in this study have been also included in Albrechtsen 2008, we excluded it from the analyses in which Albrechtsen 2008 has been also included. A total of 428 women < 45 years had LLETZ performed during the study period and 89 of them had a pregnancy after the procedure. Ten women were excluded (three ectopic pregnancies, two TOPs and five miscarriages) from the study. Data from 79 women whose pregnancies progressed > 20 weeks and 158 matched controls were analysed. The histological diagnosis was normal in 3 (3.8%), CIN1 in 5 (6.3%), CIN2 in 18 (22.8%), and CIN3 in 53 (67.1%) of cases. | |
| Risk of bias | ||
| Bias | Authors' judgement | Support for judgement |
| Incomplete outcome data (attrition bias) | Low risk | The information was obtained from hospital records |
| Selective reporting (reporting bias) | Low risk | No reporting bias is obvious |
| Other bias | Low risk | No other obvious source of bias |
| Relevant assignment described? | Low risk | Yes, treatment performed on clinical grounds |
| Representative intervention group? | Low risk | All eligible for the study women having LLETZ and subsequently delivering in a single university hospital between December 1995 to December 2000 |
| Representative comparison group? | Low risk | The untreated group was drawn from the same source as the treated group |
| Comparability of treatment groups? | Low risk | Matching for date of delivery, age, parity, previous obstetric history and smoking habit |
| Methods | Retrospective cohort study Comparison groups: A) External B) Internal (pre‐treatment pregnancies) Both had regression analysis for age and birth order Information source ‐ Cancer Registry of Norway, Medical Birth Registry of Norway, Central Population Registry, Cause of Death Registry | |
| Participants | Treated group: all pregnancies proceeding beyond 24 weeks of gestation (n = 14,882) of all women in Norway who delivered during 1967 to 2003 after cervical conisation (CKC, LLETZ, LC) Untreated group: A) all pregnancies proceeding beyond 24 weeks of gestation (n = 2,155,505) of all women in Norway who delivered during 1967 to 2003 without previous cervical conisation B) all pregnancies proceeding beyond 24 weeks of gestation (n = 56,927) of all women in Norway who delivered during 1967 to 2003 before cervical conisation (CKC, LLETZ, LC) Exclusion criteria: women ≥ 45years at the time of cervical conization; women who had their CIN diagnosis during 1980 to 1985 because it is not known if they had a treatment (these women were included in the untreated group) | |
| Interventions | Excisional NOS (CKC, LC, LLETZ) | |
| Outcomes | PTB (< 37 weeks); PTB (< 33 weeks); PTB (< 28 weeks) | |
| Notes | Since 1953, the cancer registry has collected information on all cancer diagnoses as well as premalignant lesions, including intraepithelial neoplasia with staging. 226 pregnancies after treatment were late miscarriages (< 24 weeks). 209 pregnancies before treatment were late miscarriages. 8501 pregnancies of the untreated group were late miscarriages. In this meta‐analysis, these pregnancies were subtracted from the total number. | |
| Risk of bias | ||
| Bias | Authors' judgement | Support for judgement |
| Incomplete outcome data (attrition bias) | Low risk | The information was obtained from national registries; Cancer registry: includes all cancer diagnoses as well as premalignant lesions plus their treatment (during 1980 to 1985 did not include treatment); Birth registry: the proportion of women with missing data on gestational age amounted to 5.3%, while data on birth weight were almost complete. |
| Selective reporting (reporting bias) | Low risk | No reporting bias is obvious |
| Other bias | Unclear risk | During 1980 to 1985 the Cancer registry included only the grade of CIN and did not include the treatment. The researchers excluded those women from the treated group and included them in the untreated group, even though they might have had treatment before or after pregnancy. Because the population of this study is big enough, it is not estimated that this probable misclassification has affected the results of the study to a significant extent. |
| Relevant assignment described? | Low risk | Yes, treatment performed on clinical grounds |
| Representative intervention group? | Low risk | All eligible for the study women in Norway who delivered during 1967 to 2003, before or after cervical conisation (a population‐based study) |
| Representative comparison group? | Low risk | A) The untreated external comparison group was drawn from the same source as the treated group B) Internal matching (self‐matching) |
| Comparability of treatment groups? | Low risk | A) Regression analysis for age (at delivery or treatment) and birth order B) Internal matching (self‐matching) |
| Methods | Retrospective cohort study Comparison group: External ‐ matching for age and parity Information source ‐ Hospital records of the Aalborg Hospital | |
| Participants | Treated group ‐ 75 pregnancies (< 27 weeks) of 62 women who had undergone LA before the pregnancy at the Aalborg Hospital (LA during 1985 to 1989) Exclusion: 6 patients with TOP, 3 with miscarriage and 1 with ectopic pregnancy Untreated group ‐ 150 pregnancies of women without previous treatment (the next two women entering the delivery ward who were matched by age and parity) | |
| Interventions | LC | |
| Outcomes | PTB (≤ 37 weeks); PTB (≤ 37 weeks) (D < 15 mm); PTB (≤ 37 weeks) (D = 15 mm to 20 mm); PTB (≤ 37 weeks) (D > 20 mm); pPROM; CS; perinatal mortality; stillbirth; Apgar score (≤ 5) (1 min); | |
| Notes | From 1985 to 1989, combination LC was performed in 536 patients. After LC, 72 patients became pregnant. After the exclusion of the 10 ineligible women, the remaining 62 patients had 75 pregnancies (> 27 weeks) | |
| Risk of bias | ||
| Bias | Authors' judgement | Support for judgement |
| Incomplete outcome data (attrition bias) | Low risk | The information was obtained from hospital records |
| Selective reporting (reporting bias) | Low risk | No reporting bias is obvious |
| Other bias | Low risk | No other obvious source of bias |
| Relevant assignment described? | Low risk | Yes, treatment performed on clinical grounds |
| Representative intervention group? | Low risk | All women who had had LC in a single hospital (1985 to 1989) and subsequently had a pregnancy (> 27 weeks) |
| Representative comparison group? | Low risk | The control group was drawn from the same source as the treated group |
| Comparability of treatment groups? | Unclear risk | Matching for age and parity. No matching for smoking, although the intervention group had substantially higher rate of smoking (62.7% vs 27.3%). |
| Methods | Retrospective cohort study Comparison group: External ‐ matching for age, race, births and miscarriages/TOP Information source ‐ hospital records (for the ascertainment of the exposure) and postal questionnaires (for the ascertainment of the outcome); additional information from obstetricians who delivered other women | |
| Participants | Treated group ‐ 68 deliveries of women who had been treated by LA as their initial treatment for CIN at the Samaritan Hospital for women, London, between December 1978 and February 1984, and subsequently had a pregnancy. Women who were treated in the previous 3 months were excluded. Untreated group ‐ 70 deliveries of women without previous treatment who delivered at the St Mary's Hospital, London | |
| Interventions | LA | |
| Outcomes | PTB (< 37 weeks); PTB (< 37 weeks) (single cone); CS; instrumental deliveries (forceps); prolonged labour (> 12 hours); LBW (< 2500 g) | |
| Notes | 1013 patients were treated by LA as their initial therapy for CIN at the Samaritan Hospital for Women, London, between December 1978 and February 1984, and were followed up for at least 10 months thereafter. A questionnaire was sent to all the women, apart from those treated in the previous 3 months, asking for information about pregnancies before and after LA. About 25% of the questionnaires were returned by the Post Office as the women had moved away and could not be traced. This proportion is not surprising in a mobile, urban population. Additional information was obtained from obstetricians who delivered other women. In total, the researched found 118 pregnancies in 110 patients. Of these pregnancies, 68 ended to delivery and were included in the analysis. | |
| Risk of bias | ||
| Bias | Authors' judgement | Support for judgement |
| Incomplete outcome data (attrition bias) | High risk | 25% of the women did not reply to the postal questionnaire because they had moved away and could not be traced. There is a high risk of attrition bias, although this proportion is not surprising in a mobile, urban area. |
| Selective reporting (reporting bias) | Low risk | No reporting bias is obvious |
| Other bias | High risk | Recall bias because postal questionnaires were used for the ascertainment of the outcome |
| Relevant assignment described? | Low risk | Yes, treatment performed on clinical grounds |
| Representative intervention group? | High risk | 25% of the women did not reply to the questionnaire, because they had moved away. The women who replied are more likely to belong to a higher socioeconomic class. |
| Representative comparison group? | Low risk | The untreated group was drawn from the same source as the treated group |
| Comparability of treatment groups? | Low risk | Matching for age, race, births and miscarriages/TOP |
| Methods | Retrospective cohort study Comparison group: A) External B) Internal (pre‐treatment pregnancies) Both had regression analysis for age, parity and smoking Information source ‐ Databases of the Cervical Pathology Units of the 5 main hospitals of the Basque Country participating in this study (Basurto, Cruces, Donostia, Galdakao, and Txagorritxu); Basque Country Health Service databases | |
| Participants | Treated group ‐ 189 women who had undergone LLETZ during 1988 to 2007 at the 5 main hospitals of the Basque Country (Basurto, Cruces, Donostia, Galdakao, and Txagorritxu) and subsequently delivered Untreated group ‐ A) 189 women who delivered during 1988 to 2007 without previous treatment and were identified from the Basque Country Health Service databases B) Internal population of women that had pregnancies before LLETZ (n = 189) Inclusion criteria (for both groups): only singletons were included | |
| Interventions | LLETZ | |
| Outcomes | PTB (< 37 weeks); PTB (< 37 weeks) (nulliparous); PTB (< 37 weeks) (parous); PTB (< 37 weeks) (singleton pregnancies); PTB (< 35 weeks); PTB (< 32 weeks); CS; LBW (< 2500 g); LBW (1500 g) | |
| Notes | Adjusting for maternal age, parity, and maternal smoking did not affect the results. | |
| Risk of bias | ||
| Bias | Authors' judgement | Support for judgement |
| Incomplete outcome data (attrition bias) | Low risk | Information was obtained from hospital records |
| Selective reporting (reporting bias) | Low risk | No reporting bias is obvious |
| Other bias | Low risk | No other obvious source of bias |
| Relevant assignment described? | Low risk | Yes, treatment performed on clinical grounds |
| Representative intervention group? | Low risk | A stratified random sampling of the women having LLETZ during 1988 to 2007 at the five main hospitals of the Basque Country and subsequently delivering |
| Representative comparison group? | Low risk | The untreated group was drawn from the same source as the treated group |
| Comparability of treatment groups? | Low risk | Regression analysis for age, parity, smoking |
| Methods | Retrospective cohort study Comparison group: Internal (self‐matching) Information source ‐ Colposcopy Electronic Data Base (CYRIS) for identification of the treated women & Trust Electronic Pathology Data (WebV) for details of the cone biopsy treatment; Hospital Episode Statistics and electronic maternity data (CMIS) for identification of the women who subsequently achieved pregnancy & obstetric case notes by the local audit department for pregnancy details | |
| Participants | Treated group ‐ 15 women (23 pregnancies) who underwent electrosurgical cone biopsy using FCBE electrode at Diana Princess of Wales Hospital Grimsby between January 2000 and December 2011 and subsequently delivered at the same hospital before March 2013 Untreated group ‐ The 48 pregnancies of these 15 women before treatment | |
| Interventions | FCBE (Fischer Cone Biopsy Excisor) | |
| Outcomes | PTB (< 37 weeks) | |
| Notes | ||
| Risk of bias | ||
| Bias | Authors' judgement | Support for judgement |
| Incomplete outcome data (attrition bias) | Unclear risk | Small number of included treated women; there is possible bias due to unknown loss to follow‐up of women who delivered at units other than the host institution |
| Selective reporting (reporting bias) | Low risk | No reporting bias is obvious |
| Other bias | Low risk | No other obvious source of bias |
| Relevant assignment described? | Low risk | Yes, treatment performed on clinical grounds |
| Representative intervention group? | Low risk | All eligible for the study women undergoing treatment and delivering in a single hospital |
| Representative comparison group? | Low risk | Internal comparison group (self‐matching) |
| Comparability of treatment groups? | Low risk | Internal comparison group (self‐matching) |
| Methods | Retrospective cohort study Comparison group: External ‐ unmatched; regression analysis for age, birth order, year of delivery, smoking and cervical incompetence with cerclage Information source ‐ medical records in combination with a computerised perinatal database (Soroka University Medical Center, Israel) | |
| Participants | Treated group ‐ 53 deliveries of women who had undergone conisation and then delivered at the Soroka University Medical Centre Untreated group ‐ 104,617 deliveries of women who delivered at the Soroka University Medical Centre without previous conisation Exclusion criteria: multiple gestations; patients lacking prenatal care | |
| Interventions | Excision NOS (CKC, LC, LLETZ, other) | |
| Outcomes | PTB (< 34 weeks); CS; epidural use; cervical cerclage; perinatal mortality | |
| Notes | Using the delivery record database, 53 deliveries after conisation were found. Using the medical records, 57 deliveries after conisation were found. The discrepancy between these two databases is because the delivery record database had a recording gap. LLETZ was the most common treatment (LLETZ: 18; CKC: 7; LC: 2; other: 14; >1 conisation: 1) | |
| Risk of bias | ||
| Bias | Authors' judgement | Support for judgement |
| Incomplete outcome data (attrition bias) | Low risk | 4/57 women (7%) were not included in the analysis, because of a recording gap in the delivery record database |
| Selective reporting (reporting bias) | Low risk | No reporting bias is obvious |
| Other bias | Unclear risk | Table 1 in page 767: When we add the women according to the conisation type, the sum is 42. When we add the women according to the histology of cervical biopsy or the smoking status during pregnancy, the sum is 40. There is a difference of two women. |
| Relevant assignment described? | Low risk | Yes, treatment performed on clinical grounds |
| Representative intervention group? | Low risk | All eligible for the study women delivering in a single hospital |
| Representative comparison group? | Low risk | The untreated group was drawn from the same source as the treated group |
| Comparability of treatment groups? | Low risk | Regression analysis for age, birth order, year of delivery, smoking and cervical incompetence with cerclage |
| Methods | Retrospective cohort study Comparison group: A) External ‐ matching for age, parity and time of delivery B) Internal (self‐matching) Information source ‐ Anaesthetic records of University Hospital of Lund, Sweden, and National Medical Birth Registry at the National Board of Health and Welfare, Stockholm | |
| Participants | A) Treated group ‐ 250 women who had undergone LC at University Hospital of Lund, Sweden, and had a subsequent delivery, between January 1980 and June 1988 Untreated group ‐ 250 women selected from the National Medical Birth Registry B) Of the 250 women of the treated group, 148 were parous. For these women, self‐matching was also possible. | |
| Interventions | LC ('laser miniconisation') | |
| Outcomes | PTB (< 37 weeks); PTB (< 37 weeks) (nulliparous); PTB (< 37 weeks) (parous); PTB (< 37 weeks) (single cone); PTB (< 37 weeks) (repeat cones); CS; instrumental deliveries (ventouse/forceps); prolonged labour (> 12 hours); cervical stenosis; LBW (< 2500 g); perinatal mortality; stillbirth | |
| Notes | From January 1980 to June 1988, 1485 women between age 16 to 58 were treated by carbon dioxide laser miniconisation because of CIN at University Hospital of Lund. These women were identified retrospectively via certain operation code numbers in the Anaesthetic hospital records. Each woman had also a specific 10‐tailed patient identification number (PIN), which is also used by the National Medical Birth Registry to register births in Sweden. The information of these 1485 women was transferred to a magnetic tape which was then run against data held at the National Medical Birth registry and 250 women having a delivery after treatment (3 had twin pregnancies) were identified. Of these women, 245 delivered at the Department of Obstetrics and Gynaecology, University Hospital of Lund, and the other 45 at 21 different hospitals around Sweden. 20 women had LC twice before pregnancy. | |
| Risk of bias | ||
| Bias | Authors' judgement | Support for judgement |
| Incomplete outcome data (attrition bias) | Low risk | The information was obtained from hospital records and national registries |
| Selective reporting (reporting bias) | Low risk | No reporting bias is obvious |
| Other bias | Low risk | No other obvious source of bias |
| Relevant assignment described? | Low risk | Yes, treatment performed on clinical grounds |
| Representative intervention group? | Low risk | All eligible women having LC at the University Hospital of Lund between January 1980 to June 1988 |
| Representative comparison group? | Unclear risk | A) The untreated group was not drawn from the same source as the treated group B) Internal comparison group (self‐matching) |
| Comparability of treatment groups? | Low risk | A) Matching for age, parity and time of delivery B) Internal comparison group (self‐matching) |
| Methods | Retrospective cohort study Comparison group: External ‐ matching for age, parity and ethnic group Information source ‐ Computer database of Dudley Road hospital | |
| Participants | Treated group ‐ 40 women who had undergone LLETZ and were subsequently delivered at Dudley Road Hospital, between January 1989 and January 1992 Untreated group ‐ 80 women without previous treatment delivering immediately before and after the cases at Dudley Road Hospital | |
| Interventions | LLETZ | |
| Outcomes | PTB (< 37 weeks); sPTB (< 37 weeks); CS; instrumental deliveries (ventouse/forceps); induction of labour; oxytocin use; epidural use; LBW (< 2500 g); NICU admission; perinatal mortality | |
| Notes | ||
| Risk of bias | ||
| Bias | Authors' judgement | Support for judgement |
| Incomplete outcome data (attrition bias) | Low risk | The information was obtained from computerised hospital records |
| Selective reporting (reporting bias) | Low risk | No reporting bias is obvious |
| Other bias | Low risk | No other obvious source of bias |
| Relevant assignment described? | Low risk | Yes, treatment performed on clinical grounds |
| Representative intervention group? | Low risk | All eligible women that had LLETZ at Dudley Road Hospital between January 1982 to January 1992; low risk. However, more than 60% of the women delivering at Dudley Road Hospital are nonwhite |
| Representative comparison group? | Low risk | The untreated group was drawn from the same source as the treated group |
| Comparability of treatment groups? | Low risk | Matching for age, parity and ethnic group |
| Methods | Retrospective cohort study Comparison group: External ‐ matching for age (+/‐ 5 years), parity and smoking Information source ‐ Hospital records of Rotherham District General Hospital | |
| Participants | Treated group ‐ 78 women who had undergone LLETZ in Rotherham District General Hospital between 1 December 1998 and 15 October 1992 and had a viable pregnancy afterwards. Only the first pregnancy after treatment was included. Only singleton pregnancies were included. Untreated group ‐ 78 women who were the next following patients delivered in the same hospital. | |
| Interventions | LLETZ | |
| Outcomes | PTB (< 37 weeks); PTB (< 37 weeks) (singleton pregnancies); pPROM; CS; instrumental deliveries (ventouse/forceps); APH; LBW (< 2 500 g); perinatal mortality | |
| Notes | Between 1 December 1988 and 15 October 1992, a total of 1000 women had LLETZ in Rotherham District General Hospital. It was possible to identify 84 viable pregnancies in patients who had undergone the procedure before conception. Of the 84 pregnancies, 5 were second pregnancies after LLETZ and one was a twin pregnancy. The other 78 women were finally included in the treated group. | |
| Risk of bias | ||
| Bias | Authors' judgement | Support for judgement |
| Incomplete outcome data (attrition bias) | Low risk | The information was obtained from hospital records |
| Selective reporting (reporting bias) | Low risk | No reporting bias is obvious |
| Other bias | Low risk | No other obvious source of bias |
| Relevant assignment described? | Low risk | Yes, treatment performed on clinical grounds |
| Representative intervention group? | Low risk | All eligible for the study women that had LLETZ in a hospital between 1988 to 1992 |
| Representative comparison group? | Low risk | The untreated group was drawn from the same source as the treated group |
| Comparability of treatment groups? | Low risk | Patients from the same unit matched for age (+/‐ 5 years), parity and smoking |
| Methods | Retrospective cohort study Comparison groups: A) Women with colposcopy before pregnancy, but no treatment B) Women with colposcopy during pregnancy, but no treatment Both had regression analysis for age, illicit drug use during pregnancy, delivery at the RWH, marital status, maternal medical condition, previous TOP, previous miscarriage, previous PTB, previous treatment Information source ‐ Records of the Cervical Dysplasia Clinic of the Royal Women's Hospital (RWH) (for the ascertainment of the exposure); Victorian Perinatal Data Collection Unit (PDCU) (for the ascertainment of the outcomes) | |
| Participants | Treated group ‐ 1951 women who were referred to the Royal Women's Hospital (RWH) during 1982 to 2000, received treatment for CIN and thereafter had a pregnancy in the state of Victoria during 1983 to 2002. Women with hysterectomy or treatment during pregnancy were excluded. Untreated group ‐ 3597 women who were referred to the RWH during 1982 to 2000 and then delivered in the state of Victoria during 1983 to 2002 without receiving treatment (referral during the index pregnancy:1303; referral before the index pregnancy:2294) Inclusion criteria (for both groups): referral to the RWH either for assessment of an abnormality detected on a routine Pap smear or for evaluation of a cervix that appeared abnormal; only the first pregnancy after the referral/treatment Exclusion criteria (for both groups): missing date of birth; multiple pregnancies; referral to the RWH for assessment of a non‐cervical lesion; women recorded in their clinic record as having no previous children and were 45 years or older at time of initial visit or who indicated that they had children but were older than 40 years at initial visit in 1982 or 41 years in 1983, etc. | |
| Interventions | CKC, LLETZ, LA, RD | |
| Outcomes | PTB (< 37 weeks); PTB (< 37 weeks) (singleton pregnancies); PTB (< 32 weeks); PTB (< 28 weeks); sPTB; pPROM; CS; instrumental deliveries (ventouse/forceps); LBW (< 2500 g); perinatal mortality; stillbirth | |
| Notes | Since 1982, the Victorian Perinatal Data Collection Unit (PDCU) has collected data on all births in the state of Victoria greater than or equal to 20 weeks of gestation or 400 g. All women were followed up for at least 2 years (range 2 to 20 years), the median follow‐up time being 9 years for treated women and 10 years for untreated women. | |
| Risk of bias | ||
| Bias | Authors' judgement | Support for judgement |
| Incomplete outcome data (attrition bias) | Low risk | The information was obtained from hospital records |
| Selective reporting (reporting bias) | High risk | All outcomes, except for PTB (< 37 weeks), are presented only for the whole treated group and not separately according to the type of treatment |
| Other bias | Low risk | No other obvious source of bias |
| Relevant assignment described? | Low risk | Yes, treatment performed on clinical grounds |
| Representative intervention group? | Low risk | All eligible for the study women undergoing treatment for CIN during 1982 to 2000 in the largest treatment centre in Victoria |
| Representative comparison group? | Low risk | The untreated group was drawn from the same source as the treated group |
| Comparability of treatment groups? | Low risk | Regression analysis (for the outcome of PTB) for age, illicit drug use during pregnancy, delivery at the RWH, marital status, maternal medical condition, previous TOP, previous miscarriage, previous PTB, previous treatment |
| Methods | Retrospective cohort study Comparison group ‐ Internal (pre‐treatment pregnancies) Information source ‐ Hospital records of University of California Hospital, San Fransisco, and Kaiser Hospital, Honolulu | |
| Participants | Treated group ‐ 47 deliveries of women who had undergone diagnostic and/or therapeutic conization of the cervix at either the University of California Hospital, California, or Kaiser Hospital, Honolulu, between 1968 and 1978, and had a subsequent delivery. Inclusion criteria: Women of reproductive age (arbitrarily defined as age 39 or less) at the time of surgery. Exclusion criteria: Women with a hysterectomy or a sterilisation procedure and women who were lost to follow‐up. Untreated group ‐ 79 deliveries of the women of the treated group who had also a delivery before the treatment | |
| Interventions | CKC | |
| Outcomes | PTB (< 37 weeks); Threatened PTL; CS | |
| Notes | 503 underwent diagnostic and/or therapeutic conization of the cervix at either the University of California Hospital, San Fransisco, or Kaiser Hospital, Honolulu, between 1968 and 1978. Of these, 314 were of reproductive age, arbitrarily defined as age 39 or less, at the time of surgery. A hysterectomy or a sterilisation procedure was subsequently performed on 87 of these 314 patients. An additional 61 patients were lost to follow‐up within 12 months of the conisation. Of the remaining 166 patients, 61 patients achieved 88 pregnancies and the other 105 patients did not become pregnancies after conisation. Of the 88 pregnancies, 47 led to a labour. The same women before the treatment had 106 pregnancies (79 led to a labour). | |
| Risk of bias | ||
| Bias | Authors' judgement | Support for judgement |
| Incomplete outcome data (attrition bias) | High risk | 227 women were eligible for the study. Of these, 61 (26.9%) were lost to follow‐up. |
| Selective reporting (reporting bias) | Low risk | No reporting bias is obvious |
| Other bias | Low risk | No other obvious source of bias |
| Relevant assignment described? | Low risk | Yes, treatment performed on clinical grounds |
| Representative intervention group? | Low risk | All eligible women that had CKC in two hospitals between 1968 to1978 |
| Representative comparison group? | Low risk | Internal comparison group (pre‐treatment pregnancies) |
| Comparability of treatment groups? | Low risk | Internal comparison group (pre‐treatment pregnancies) |
| Methods | Castanon 2012 (this is the main study): Retrospective cohort study Comparison groups ‐ A) External (general population) B) Women with punch biopsy but no treatment C) Internal (pre‐treatment pregnancies) D) Internal (self‐matching: same women before and after treatment) Regression analysis for age, parity and study site for some comparison groups, but not for the ones that we used in our meta‐analysis (see "Notes") Information source ‐ Records of the 12 participating NHS hospitals (for the ascertainment of the exposure); hospital episode statistics of inpatient obstetric records for the whole of England (for the ascertainment of the outcomes) Castanon 2014: Case‐control study nested in a retrospective cohort study Matching for age, parity, study site and whether the birth occurred before or after the first colposcopy; regression analysis for age, parity, study site and index of multiple deprivation | |
| Participants | Study period for the treatment/biopsy: January 1987 to December 2009 Study period for the delivery: April 1998 to April 2010 Location for the treatment/biopsy: one of the 12 participating NHS hospitals Location for the delivery: any NHS hospital Treated group ‐ 4776 deliveries of women who had undergone excisional treatment and subsequently had a pregnancy Untreated group ‐ A) 510,660 deliveries (general population of England) B) 7263 deliveries of women who had undergone punch biopsy but no treatment and subsequently had a pregnancy C) The deliveries (1173) of the treated group before their treatment D) For 372 women who had at least one delivery both before and after the delivery, internal matching (self‐matching) was also possible: the first delivery after treatment was compared with the last delivery before treatment Exclusion criteria (for all groups): Pregnancies with no gestational age recorded, with gestational age > 43 weeks, with gestational age < 20 weeks or with no year of birth recorded as well as multiple pregnancies. Additional exclusion criteria (for the women with treatment or punch biopsy): Women for whom the date of histology was unknown Castanon 2014: Study period for the treatment/biopsy: April 1988 to December 2011 Study period for the delivery: April 1998 to March 2011 Location for the treatment/biopsy: one of the 12 participating NHS hospitals Location for the delivery: any NHS hospital Cases ‐ 768 women with a preterm birth after excisional treatment or punch biopsy. Only the earliest occurring singleton preterm birth (with any parity) in each woman was included Controls ‐ 830 matched women with a term birth after excisional treatment or punch biopsy Inclusion criteria: births at 37 weeks' gestational age, women with incomplete colposcopy records, women for whom the only pathology sample reported was non‐cervical, women who were recorded as being sterilised while pregnant, women with a diagnosis of cervical cancer at any time, women whose pregnancy was at high risk (diabetes mellitus, hypertension, placenta praevia with haemorrhage, supervision of high risk pregnancy, mental disorders, and diseases of the nervous system complicating pregnancy, childbirth, and the puerperium) | |
| Interventions | Excision NOS (CKC, LC, LLETZ, other) | |
| Outcomes | PTB (< 37 weeks); PTB (< 37 weeks) (D < 10 mm); PTB (< 37 weeks) (D ≥ 10 mm); PTB (< 37 weeks) (singleton pregnancies); PTB (< 33 weeks) | |
| Notes | Castanon 2012: In addition to the treated/comparison groups that we used in our meta‐analysis, the authors had a variant of those as well: only the first birth recorded in the dataset for each woman during the study period, after exclusion of antepartum stillbirths and stillbirths of indeterminate timing. For these groups there was regression analysis for age, parity and study site, but no regression analysis for the groups that we selected. However, we selected the latter, because the population is bigger and we had no reason to restrict to the first pregnancy of each woman during the study period. Castanon 2014: this was a case‐control study nested in this retrospective cohort study. The cases were 768 preterm births and the controls were 830 term births, all occurring after excisional treatment or punch biopsy. The main outcome of this study was the depth of the cone in the cases and controls stratified in the following categories: 1 mm to ‐9 mm, 10 mm to 14 mm, 15 mm to 19 mm, ≥ 20mm. The cases and the controls, as a case‐control study, were different from the cases and the controls of all the other studies. We have contacted the investigators of the study and also used the published data to extract the PTB (< 37 weeks) rate for women with excision of < 10 mm in depth and ≥10 mm in a treated group versus women who had punch biopsy but no treatment. | |
| Risk of bias | ||
| Bias | Authors' judgement | Support for judgement |
| Incomplete outcome data (attrition bias) | High risk | Of the total number of pregnancies (n = 26897) of the women with a pregnancy before or after treatment/punch biopsy, 8050 pregnancies (29.9%) had an unknown gestational age |
| Selective reporting (reporting bias) | Low risk | No reporting bias is obvious |
| Other bias | Unclear risk | The authors do not have information as to whether the punch biopsy group may have had a history of ablative treatment or whether the treatment group had antenatal interventions when pregnant. There is no evidence of the efficacy of these interventions so it is unclear whether this is a source of bias. |
| Relevant assignment described? | Low risk | Yes, treatment performed on clinical grounds |
| Representative intervention group? | Low risk | Women having treatment at one of the 12 participating NHS hospitals (representation from the whole England) and then delivering at any NHS hospital |
| Representative comparison group? | Low risk | A/B) The untreated group was drawn from the same source as the treated group C/D) Internal controls |
| Comparability of treatment groups? | Low risk | A) General population of the whole England B) Women with punch biopsy (it is considered that possible confounding factors are not different between this group and the treated group and thus, this is one of the best comparison groups, in general) C/D) Internal controls No regression analysis for the comparison groups that we used (see "Notes" above) |
| Methods | Retrospective cohort study Comparison groups: A) Untreated women without a history of sPTB (low risk); this is the control group we used for out meta‐analysis B) Untreated women with a history of sPTB (high risk) Both had regressional analysis for maternal age, gestational age at the time of transvaginal ultrasonography, parity, smoking, antepartum bleeding after 20 weeks of gestation and previous sPTB Information source ‐ Hospital records of the Women's Health Centre of the Health Care Corporation of St. John's | |
| Participants | Treated group ‐ 132 (LLETZ = 75, CKC = 21, CT = 36) pregnant women with singleton gestations from June 2001 to June 2004 at the Women's Health Centre of the Health Care Corporation of St. John's who previously had LLETZ , CKC or cryotherapy Untreated group ‐ A) 81 women without history of sPTB or treatment for cervical dysplasia (low‐risk control group) B) 63 women with a history of sPTB not having had treatment for cervical dysplasia | |
| Interventions | CKC; LLETZ; CT | |
| Outcomes | sPTB (< 37 weeks); sPTB (< 37 weeks) (singleton pregnancies); sPTB (< 34 weeks); CS; induction of labour; APH; LBW (< 2500 g); NICU admission; perinatal mortality; Apgar score (< 7) (5min) | |
| Notes | ||
| Risk of bias | ||
| Bias | Authors' judgement | Support for judgement |
| Incomplete outcome data (attrition bias) | Low risk | The information was obtained from hospital records |
| Selective reporting (reporting bias) | Low risk | No reporting bias is obvious |
| Other bias | Low risk | No other obvious source of bias |
| Relevant assignment described? | Low risk | Yes, treatment performed on clinical grounds |
| Representative intervention group? | Low risk | All eligible for the study women delivering in a single hospital during June 2001 to June 2004 |
| Representative comparison group? | Low risk | The untreated group was drawn from the same source as the treated group |
| Comparability of treatment groups? | Low risk | Regressional analysis for maternal age, gestational age at the time of transvaginal ultrasonography, parity, smoking, antepartum bleeding after 20 weeks of gestation, and sPTB |
| Methods | Retrespective cohort study Comparison group: A) External ‐ matching for age, parity, husband's or partner's social class, height and daily cigarette consumption B) Internal (pre‐treatment pregnancies) Information source ‐ Aberdeen Maternity and Neonatal Databank, postal questionnaires | |
| Participants | A) Treated group ‐ 149 women who had undergone LLETZ between 1989 and 1991. Only the first singleton pregnancies following treatment that progressed to 20 weeks of gestation were included. Multiple pregnancies were excluded. We also excluded 2 miscarriages, giving a total of 147 women. Untreated group ‐ 298 women without previous treatment (two controls for each case). We excluded 3 miscarriages, giving a total of 295 women B) The 147 deliveries of the treated group after LLETZ were compared with the 133 deliveries of the treated group before LLETZ | |
| Interventions | LLETZ | |
| Outcomes | PTB (< 37 weeks); PTB (< 37 weeks) (singleton pregnancies); PTB (< 28 weeks); CS; precipitous labour (< 2 hours); stillbirth | |
| Notes | 1000 women who had undergone LLETZ between 1989 and 1991 were identified via Aberdeen Maternity and Neonatal Databank. A postal questionnaire was sent to these women in 1993 and 653 replied. Of these, 149 had a singleton pregnancy after treatment and were included in the treated group. The control group was also pooled from Aberdeen Maternity and Neonatal Databank. | |
| Risk of bias | ||
| Bias | Authors' judgement | Support for judgement |
| Incomplete outcome data (attrition bias) | High risk | Postal questionnaires were used for the selection of the treated group and many women did not reply (347/1000 = 34.7%) |
| Selective reporting (reporting bias) | Low risk | No reporting bias is obvious |
| Other bias | Low risk | For the treated group, questionnaires were used for the ascertainment of the outcome; there is a risk of recall bias and misclassification of the outcome |
| Relevant assignment described? | Low risk | Yes, treatment performed on clinical grounds |
| Representative intervention group? | High risk | Postal questionnaires were used for the selection of the treated group and many women did not reply (34.7%). The women who replied are more likely to have a higher educational level. |
| Representative comparison group? | Low risk | A) The untreated group was drawn from the same source as the treated group B) Internal comparison group (pre‐treatment pregnancies) |
| Comparability of treatment groups? | Low risk | A) Matching for age, parity, husband's or partner's social class, height and daily cigarette consumption B) Internal comparison group (pre‐treatment pregnancies) |
| Methods | Retrospective cohort study Comparison group: External ‐ unmatched; regression analysis for age, parity, race, history of PTB, history of tobacco use, history of drug use and chorionicity Information source ‐ maternal prenatal records and impatient hospital charts from two community hospitals in California | |
| Participants | Treated group ‐ 110 women who had a twin pregnancy (≥ 24 weeks of gestation) at two community hospitals in California during 1998 to 2005 and had previously undergone treatment for CIN (CKC = 10, LLETZ = 36, LA/CT = 64) Exclusion:women with colposcopy or biopsy only, pregnancies with major fetal anomalies or intrauterine death, multi‐fetal pregnancy reduction, indicated delivery prior to 34 weeks, twin–twin transfusion syndrome, or cerclage placement Untreated group ‐ 766 women who had a twin pregnancy (≥ 24 weeks of gestation) at two community hospitals in California during 1998 to 2005 with no history of cervical procedures | |
| Interventions | CKC; LLETZ; Ablation NOS (LA, CT) | |
| Outcomes | PTB (< 37 weeks) (multiple pregnancies); PTB (< 34 weeks) (multiple pregnancies); PTB (< 28 weeks) (multiple pregnancies) | |
| Notes | No woman had more than one twin delivery during the time period specified. If a participant had undergone both an ablative and excisional procedure, she was included in the excisional group. A total of 110 (12.6%) women had undergone a prior procedure for cervical dysplasia. This included 10 with a CKC, 36 with a LEEP, 59 with cryotherapy and 5 had undergone CO2 laser ablation. One of the participants with a CKC also had cryotherapy. One participant had undergone cryotherapy twice and none of the women had more than one excisional procedure. | |
| Risk of bias | ||
| Bias | Authors' judgement | Support for judgement |
| Incomplete outcome data (attrition bias) | Low risk | Information was obtained from hospital records |
| Selective reporting (reporting bias) | Low risk | No reporting bias is obvious |
| Other bias | Low risk | No other obvious source of bias |
| Relevant assignment described? | Low risk | Yes, treatment performed on clinical grounds |
| Representative intervention group? | Low risk | All eligible for the study women having a twin pregnancy in two hospitals in California during 1998 to 2005 |
| Representative comparison group? | Low risk | The untreated group was drawn from the same source as the treated group |
| Comparability of treatment groups? | Low risk | Regression analysis for age, parity, race, history of PTB, history of tobacco use, history of drug use and chorionicity |
| Methods | Retrospective cohort study Comparison groups: A) External from general population ‐ matching for age and country of origin (foreign vs USA) B) Women with Carcinoma in situ (CIS) but no treatment ‐ unmatched Both had regressional analysis for parity, race, maternal smoking, marital status and history of TOPs. Information source ‐ Cancer Surveillance System (a population‐based cancer registry covering 13 counties of western Washington) at the Fred Hutchinson Cancer Research Center in Seattle, Washington, and Birth Certificates from the Department of Health in Washington state | |
| Participants | Treated group ‐ 1096 women who were less than 50 years old with CIS, were diagnosed between 1984 and 1992, were treated with excisional or ablative therapy and subsequently delivered live singletons between 1984 and 1995 (the women were identified by the Cancer Surveillance System) Untreated group ‐ A) 9201 women (random sample selected from birth certificates, but frequency‐matched for age and the country of origin) without cervical cancer who gave birth during the same years without previous treatment. B) 330 women with untreated CIS Only women (for both the treated and untreated group) residing in the 13 counties of western Washington covered by the Cancer Survellance system were included. Only women who indicated the same father of the index infant and previous children were included. | |
| Interventions | Excision NOS (CKC, LC, LLETZ); Ablation NOS (LA, CT) | |
| Outcomes | PTB (< 37 weeks); PTB (< 37 weeks) (singleton pregnancies); CS; LBW (< 2500 g) | |
| Notes | From the 1851 women with CIS, 1539 women had a pregnancy after the CIS diagnosis. Of these women, 212 had no surgical procedure before pregnancy, 227 had D&C or ECC before pregnancy, 85 had cryosurgery or LA before pregnancy, and 1011 had conisation before pregnancy. For 4 women, the procedure (if any) before pregnancy was unknown. From the 1851 women with CIS, 312 were pregnant at the time of the diagnosis. Of these women, 118 had no surgical procedure during pregnancy, 33 had D&C or ECC during pregnancy, 6 had cryosurgery or LA during pregnancy, and 142 had conisation during pregnancy. For 13 women, the procedure (if any) during pregnancy was unknown. It is possible to make the following comparisons in our meta‐analysis: a) Women with CIS and treatment before pregnancy versus women with CIS but no treatment (diagnosis of CIS before pregnancy) b) Women with CIS and treatment before pregnancy versus women with CIS but no treatment (diagnosis of CIS during pregnancy) c) Women with CIS and treatment before pregnancy versus women with CIS but no treatment (diagnosis of CIS before or during pregnancy) d) Women with CIS and treatment before pregnancy versus general population Women that had treatment during pregnancy were excluded according to the exclusion criteria of the systematic review. | |
| Risk of bias | ||
| Bias | Authors' judgement | Support for judgement |
| Incomplete outcome data (attrition bias) | Low risk | Information on birth weight, gestation length, and delivery method was complete for 98.8%, 83.2%, and 93.8% of women with CIS versus 99.7%, 86.7%, and 94.7% for comparison women, respectively. |
| Selective reporting (reporting bias) | Low risk | No reporting bias is obvious |
| Other bias | Low risk | No other obvious source of bias |
| Relevant assignment described? | Low risk | Yes, treatment performed on clinical grounds |
| Representative intervention group? | Low risk | All eligible for the study women from 13 counties of western Washington (a population‐based study) |
| Representative comparison group? | Low risk | Both untreated groups were drawn from the same source as the treated group |
| Comparability of treatment groups? | Low risk | Matching for age and country of origin (foreign vs USA). Regressional analysis for parity, race, maternal smoking, marital status and history of TOPs. |
| Methods | Prospective cohort study Comparison group: External ‐ matching for age (+/‐ 5 years), race, the number of prior vaginal deliveries at ≥ 20 weeks and gestational age at the time of cervical sonography (+/‐ 2 weeks) Information source ‐ medical records of one of the southern New Jersey maternal–fetal medicine offices | |
| Participants | Treated group ‐ 85 pregnant women presenting to one of the southern New Jersey maternal–fetal medicine offices (during 2001 to 2007) with a history of LLETZ (n = 68), CKC (n = 15), or both (n = 2) Unterated group ‐ 85 pregnant women referred from the referred obstetrical ultrasound population (during 2007 to 2008) without previous cervical surgery Exclusion criteria (for both groups): multiple gestations, a clinical history of cervical insufficiency (defined as a history of repeat midtrimester pregnancy loss associated with painless cervical dilatation), presence of a cerclage or planned cerclage, ruptured membranes, or a fetal aneuploidy or major anomaly recognized at the time of cervical sonography | |
| Interventions | Excision NOS (CKC; LLETZ) | |
| Outcomes | PTB (< 37 weeks); PTB (< 37 weeks) (singleton pregnancies); PTB (< 34 weeks); CS; cervical cerclage | |
| Notes | No enrolled patients were excluded from analysis after cervical sonography had been performed. The researchers had difficulty finding a matched control for one of the study participants, a 40‐year‐old Caucasian with four previous vaginal deliveries. They finally identified a Filipino gravida who otherwise matched the study patient. | |
| Risk of bias | ||
| Bias | Authors' judgement | Support for judgement |
| Incomplete outcome data (attrition bias) | Low risk | No enrolled patient was excluded from analysis after cervical sonography had been performed |
| Selective reporting (reporting bias) | Low risk | No reporting bias is obvious |
| Other bias | Low risk | No other source of bias is obvious |
| Relevant assignment described? | Low risk | Yes, treatment performed on clinical grounds |
| Representative intervention group? | Low risk | All eligible for the study women having a cervical sonography during 2001 to 2007 |
| Representative comparison group? | Low risk | The untreated group was drawn from the same source as the treated group |
| Comparability of treatment groups? | Low risk | Matching for age (+/‐ 5 years), race, the number of prior vaginal deliveries at ≥ 20 weeks, gestational age at the time of cervical sonography (+/‐ 2 weeks) |
| Methods | Retrospective cohort study Comparison group: External ‐ matching for age (+/‐ 3 years), parity and place of delivery (hospital with perinatal care unit, smaller hospital or local district maternity wards) Information source ‐ Medical records, postal questionnaires | |
| Participants | Treated group ‐ 71 women who were treated by LC or LA (LC = 51; LA = 20) in the Department of Obstetrics and Gynaecology, University Hospital of Tromso, Norway, during 1983‐88 and had subsequently a delivery (deliveries till June 1992 were included). Only first deliveries after treatment (delivery after 24th week) were included. Only singletons were reported by the women. Control group ‐ 174 women who delivered without previous treatment. | |
| Interventions | LC; LA | |
| Outcomes | LBW (< 2500 g); LBW (< 2000 g); LBW (< 1500 g); perinatal mortality; stillbirth | |
| Notes | During 1983 to 1988, 356 women were treated for CIN I‐III with laser conisation or ablation in the Department of Obstetrics and Gynecology, University Hospital of Thomso, Norway. Twelve women (3.4%) were lost afterwards. In June 1992, a postal questionnaire was sent to the other 344 women. 319 women (93%) replied. The short questionnaire comprised questions about pregnancy outcome after treatment, birth weights, complications in pregnancy or delivery, and place of delivery. A total of 87 women, all women, reported that they fell pregnant at least once after treatment. Of these women, 71 had a delivery after 24 weeks of gestation. Information about gestational length and verification of birth weight in women with ≤ 2500 g was collected from medical records. Data concerning treatment, diagnosis and parity before pregnancy were previously registered. | |
| Risk of bias | ||
| Bias | Authors' judgement | Support for judgement |
| Incomplete outcome data (attrition bias) | Low risk | Only 12 women (3.4%) did not receive a postal questionnaire, because they were lost after treatment. Of the other 344 eligible for the study women, 319 (93%) replied. |
| Selective reporting (reporting bias) | Low risk | No reporting bias is obvious |
| Other bias | High risk | There are some contradictions: in the table III where the LBW rates are presented, the authors have also included the women of the treated group with miscarriage (n = 11), TOP (n = 3) and ectopic pregnancy (n = 2). In these cases, there is no birth weight to be calculated. It is not clear if there are also miscarriages, ectopic pregnancies and TOPs in the total number of the controls. |
| Relevant assignment described? | Low risk | Yes, treatment performed on clinical grounds |
| Representative intervention group? | Low risk | All eligible for the study women that had LC or LA at the University Hospital of Tromso between 1983 to 1988 |
| Representative comparison group? | Low risk | The untreated group was drawn from the same area and period although not necessarily from the same hospital |
| Comparability of treatment groups? | Low risk | Matching for age (+/‐ 3 years), parity, place of delivery (hospital with perinatal care unit, smaller hospital or local district maternity wards) |
| Methods | Prospective cohort study Comparison group: External ‐ matching for parity (all women were nulliparous) and race (all women were white) Information source ‐ records of university teaching hospitals and country hospitals across Italy | |
| Participants | Study period ‐ January 2003 to January 2007 Treated group ‐ 475 pregnant women who had previously undergone LLETZ for CIN 2/3; Inclusion criteria: women with only one previous LLETZ, no repeated cervical excisional or ablative treatments and no relapse of CIN for at least 12 months after LLETZ Untreated group ‐ 441 pregnant women with no previous treatment for CIN Inclusion criteria (for both groups): women of age 42 years or younger, women who had spontaneous pregnancy, white women and nulliparous women Exclusion criteria (for both groups): twin pregnancies, any major disease (e.g. cardiovascular disease, diabetes, HIV infection, or hypertension) and alcohol, smoke or substance abuse. | |
| Interventions | LLETZ | |
| Outcomes | PTB (< 37 weeks); PTB (< 37 weeks) (nulliparous); PTB (< 37 weeks) (single cone); PTB (< 37 weeks) (singleton pregnancies) | |
| Notes | In the treated group, 69/475 women had a miscarriage (≤ 24 weeks of gestation). In the untreated group, 62/441 women had a miscarriage (≤ 24 weeks of gestation). These women were not in the denominator for the calculation of the PTB rate. | |
| Risk of bias | ||
| Bias | Authors' judgement | Support for judgement |
| Incomplete outcome data (attrition bias) | Low risk | 18/493 (3.7%) pregnant women in the treated group were lost to follow‐up; 21/462 (4.5%) pregnant women in the untreated group were lost to follow‐up |
| Selective reporting (reporting bias) | Low risk | No reporting bias is obvious |
| Other bias | Low risk | No other obvious source of bias |
| Relevant assignment described? | Low risk | Yes, treatment performed on clinical grounds |
| Representative intervention group? | Low risk | All eligible for the study women delivering at the participating hospitals across Italy during 2003 to January 2007 |
| Representative comparison group? | Low risk | The untreated group was drawn from the same source as the treated group |
| Comparability of treatment groups? | Low risk | Matching for parity (all women were nulliparous) and race (all women were white). The mean age in the treated group was 30.8 vs 31.9 in the untreated group |
| Methods | Retrospective cohort study Comparison groups: A) External from women that had cervical smear B) Women with punch biopsy but no treatment Both had matching for age and year of treatment/Pap test/punch biopsy, and regression analysis for age, parity, race, meternal diabetes, maternal BMI, neonate birth weight and prior CS Information source ‐ clinical databases of surgical pathology at the nine participating hospitals (for the ascertainment of the exposure); structured phone interviews and confirmation from medical files after informed consent (for the ascertainment of the outcomes) | |
| Participants | Treated group ‐ 598 women who had undergone LLETZ at one of the nine participating hospitals during 1996 to 2006 and then had a singleton pregnancy beyond 20 weeks of gestation Untreated group ‐ A) 588 women who had had Pap test only at one of the nine participating hospitals during 1996 to 2006 and then had a singleton pregnancy beyond 20 weeks of gestation B) 552 women who had had punch biopsy but no treatment at one of the nine participating hospitals during 1996 to 2006 and then had a singleton pregnancy beyond 20 weeks of gestation Inclusion criteria: only the first pregnancy after procedure (LLETZ, Pap test, punch biopsy) Exclusion criteria: women in the untreated groups who reported any history of LLETZ or other cervical excisional treatment; women with missing data (pregnancy history, mode of delivery, dates of the cervical procedure/delivery), women for whom medical records were unavailable | |
| Interventions | LLETZ | |
| Outcomes | PTB (< 37 weeks); CS; induction of labour | |
| Notes | ||
| Risk of bias | ||
| Bias | Authors' judgement | Support for judgement |
| Incomplete outcome data (attrition bias) | Unclear risk | Not specified how many women had missing data on the outcomes of the index pregnancy |
| Selective reporting (reporting bias) | Low risk | No reporting bias is obvious |
| Other bias | Low risk | No other obvious source of bias |
| Relevant assignment described? | Low risk | Yes, treatment performed on clinical grounds |
| Representative intervention group? | Low risk | All eligible for the study women having LLETZ at nine hospitals during 1996 to 2006 and then delivering |
| Representative comparison group? | Low risk | The untreated groups were drawn from the same source as the treated group |
| Comparability of treatment groups? | Low risk | Matching for age and year of treatment/Pap test/punch biopsy; regression analysis for age, parity, race, meternal diabetes, maternal BMI, neonate birth weight and prior CS |
| Methods | Retrospective cohort study Comparison group: External ‐ matching for age, parity, race, duration of pregnancy and smoking habit Information source ‐ Hospital records of the Department of Obstetrics and Gynaecology of Watford General Hospital, Hertfordshire | |
| Participants | Treated group ‐ 140 women who had undergone LA or LLETZ for CIN (LLETZ = 23; LA = 117) at Watford General Hospital and had a subsequent intra‐uterine pregnancy, whose outcome was known. The observation period was February 1987 to January 1991. Untreated group ‐ 140 matched women | |
| Interventions | LLETZ; LA | |
| Outcomes | PTB (< 37 weeks); CS; instrumental deliveries (forceps); prolonged labour (> 12 hours) | |
| Notes | The majority of patients had been treated with the laser because this method had been in use longer than LLETZ. 3 patients who had been treated with LC were too small a group to analyse. | |
| Risk of bias | ||
| Bias | Authors' judgement | Support for judgement |
| Incomplete outcome data (attrition bias) | Low risk | Information was obtained from hospital records |
| Selective reporting (reporting bias) | Low risk | No reporting bias is obvious |
| Other bias | Low risk | No other obvious source of bias |
| Relevant assignment described? | Low risk | Yes, treatment performed on clinical grounds |
| Representative intervention group? | Low risk | All eligible for the study women who were treated with LA or LLETZ in a single general hospital and had a subsequent pregnancy, between February 1987 to January 1991 |
| Representative comparison group? | Low risk | The untreated group was drawn from the same source as the treated group |
| Comparability of treatment groups? | Low risk | Matching for age, parity, race, duration of pregnancy and smoking habit |
| Methods | Prospective cohort study Comparison group: Women with colposcopic biopsy (CIN1 or less) but no treatment ‐ matching for smoking (all women were non‐smokers) Information source ‐ Records of the First Affiliated Hospital of Zhengzhou University, China | |
| Participants | Treated group ‐ 84 women who underwent LLETZ or CKC (CCK = 36, LLETZ = 48) at the University Hospital of Zhengzhou during January 2005 to January 2009, wanted thereafter to become pregnant and succeeded in becoming pregnant; Exclusion criteria: women with postoperative infertility, multiple‐time conisation or positive incisal edge Untreated group ‐ 68 women who became pregnant after exclusion of CIN II or above with colposcopic biopsy and did not receive any other surgical procedures Exclusion criteria (for both groups): history of infertility or recurrent miscarriages, evidence of premature delivery, smoking habits | |
| Interventions | CKC; LLETZ | |
| Outcomes | PTB (< 37 weeks); PTB (< 37 weeks) (single cone); PTB (< 34 weeks); pPROM; CS; precipitous labour; prolonged labour; LBW (< 2500 g); Aprgar score (< 7) (1min) | |
| Notes | The follow‐up lasted two years. | |
| Risk of bias | ||
| Bias | Authors' judgement | Support for judgement |
| Incomplete outcome data (attrition bias) | Unclear risk | Not specified how many women were lost to follow‐up |
| Selective reporting (reporting bias) | Low risk | No reporting bias is obvious |
| Other bias | Low risk | No other obvious source of bias |
| Relevant assignment described? | Low risk | Yes, treatment performed on clinical grounds |
| Representative intervention group? | Low risk | All eligible for the study women undergoing CKC or LLETZ in a single hospital during January 2005 to January 2009 |
| Representative comparison group? | Low risk | The untreated group was drawn from the same source as the treated group |
| Comparability of treatment groups? | Low risk | Women with colposcopic biopsy (CIN1 or less); matching for smoking (all women were non‐smokers). |
| Methods | Retrospective cohort study Comparison group: External ‐ matching for age and parity Information source ‐ Hospital records of Gloucestershire Royal Hospital | |
| Participants | Treated group ‐ 152 women who had undergone LLETZ at Gloucestershire Royal Hospital between April 1988 and December 1989 and had a subsequent delivery (delivery after 24 weeks) at the same hospital. Untreated group ‐ 152 women without previous treatment delivering at Gloucestershire Royal Hospital (the next following suitable woman after case). | |
| Interventions | LLETZ | |
| Outcomes | PTB (< 37 weeks); CS; instrumental deliveries (ventouse/forceps); precipitous labour (< 2 hours); prolonged labour (> 12 hours); induction of labour; oxytocin use; epidural use; LBW (2500 g) | |
| Notes | Between April 1988 and December 1989, 1000 women with cervical smears showing repeatedly borderline changes of dyskaryosis and who had satisfactory colposcopy underwent LLETZ at the Gloustershire Royal Hospital. Pregnancies in this study group which occurred since LLETZ and which resulted in referral to Gloucestershire Royal Hospital were identified. Deliveries after 24 weeks' gestation were matched against a control: the delivery of the next women of the same age and parity at Gloucestershire Royal Hospital. | |
| Risk of bias | ||
| Bias | Authors' judgement | Support for judgement |
| Incomplete outcome data (attrition bias) | Low risk | The information was obtained from hospital records |
| Selective reporting (reporting bias) | Low risk | No reporting bias is obvious |
| Other bias | Low risk | No other obvious source of bias |
| Relevant assignment described? | Low risk | Yes, treatment performed on clinical grounds |
| Representative intervention group? | Low risk | The treated group included all women that underwent LLETZ between 1988 and 1989 in a single hospital |
| Representative comparison group? | Low risk | The untreated group was drawn from the same source as the treated group |
| Comparability of treatment groups? | Unclear risk | Matching for age and parity. The intervention group had substantially higher rate of smoking (36% vs 14.4%) |
| Methods | Retrospective cohort study Comparison group: External ‐ matching for age (+/‐ 3 years) and parity (equal); regression analysis for maternal height, marital status, level of education, smoking, previous TOP, and, in the index pregnancy, occurrence of gestational hypertension or antepartum haemorrhage and the mode of delivery Information source ‐ Hospital records of University Hospital of Trondheim, Norway | |
| Participants | Treated group ‐ 56 women who had undergone LLETZ at the Department of Obstetrics and Gynaecology, University Hospital, Trondheim, Norway between 1983 and 1985, were 38 years of age or younger at the time of operation and had been delivered of live infants beyond 22 weeks gestation after the conisation and before 1991 (all infants were singletons). Only the first birth after treatment was included. Untreated group ‐ 112 women without previous treatment delivered at the same hospital (the first two women after each case) | |
| Interventions | LC | |
| Outcomes | PTB (≤ 37 weeks); PTB (≤ 37 weeks) (nulliparous); PTB (≤ 37 weeks) (parous); PTB (≤ 37 weeks) (singleton pregnancies); CS; instrumental deliveries (ventouse/forceps); APH | |
| Notes | During the three year period from a January 1983 to 31 December 1985, 351 women underwent LC of the cervix. 6 women were lost afterwards. 247 women who were 38 years of age or younger at the time of operation were studied for reproductive events. By 1 January 1991, 79 of these women had become pregnant. | |
| Risk of bias | ||
| Bias | Authors' judgement | Support for judgement |
| Incomplete outcome data (attrition bias) | Low risk | The information was obtained from hospital records. Of the 351 who had undergone LLETZ between 1983 to 1985, only 6 (1.71%) were lost after the treatment |
| Selective reporting (reporting bias) | Low risk | No reporting bias is obvious |
| Other bias | Unclear risk | No other obvious source of bias |
| Relevant assignment described? | Low risk | Yes, treatment performed on clinical grounds |
| Representative intervention group? | Low risk | All women that had LLETZ at the University Hospital of Trondheim between 1983 to 1985 |
| Representative comparison group? | Low risk | The untreated group was drawn from the same source as the treated group |
| Comparability of treatment groups? | Low risk | Matching for age and parity; regression analysis for maternal height, marital status, level of education, smoking, previous TOP, and, in the index pregnancy, occurrence of gestational hypertension or antepartum haemorrhage and the mode of delivery. |
| Methods | Retrospective cohort study Comparison group: External ‐ unmatched; regression analysis for maternal age, socioeconomic status, marital status, urbanism, time since LLETZ, previous PTBs Information source ‐ Hospital Discharge Register (for the ascertainment of the exposure); Medical Birth Register (for the ascertainment of the outcome) | |
| Participants | Treated group ‐ 7636 singleton deliveries of women of reproductive age (15 to 49 years) who had undergone LLETZ during 1997 to 2009 and delivered during 1998 to 2009 Untreated group ‐ 658,179 singleton deliveries (1998 to 2009) of women without previous LLETZ | |
| Interventions | LLETZ | |
| Outcomes | PTB (< 37 weeks); PTB (< 37 weeks) (single cone); PTB (< 37 weeks) (repeat cones); PTB (< 37 weeks) (singleton pregnancy) | |
| Notes | The 3 studies (Heinonen 2013, Jakobsson 2009, Jakobsson 2007) refer to overlapping populations from the Finnish Register. We considered as primary study the most recent (Heinonen 2013) that was a population‐based study assessing the impact of LLETZ from 1997 to 2009. From this study we extracted PTB (< 37 weeks) rates, overall as well as for single cones, repeat cones and singleton pregnancies. | |
| Risk of bias | ||
| Bias | Authors' judgement | Support for judgement |
| Incomplete outcome data (attrition bias) | Low risk | Information was obtained from national registers |
| Selective reporting (reporting bias) | Low risk | No reporting bias is obvious |
| Other bias | Low risk | No other obvious source of bias |
| Relevant assignment described? | Low risk | Yes, treatment performed on clinical grounds |
| Representative intervention group? | Low risk | All eligible for the study women in Finland undergoing LLETZ during 1997 to 2009 and subsequently delivering during 1998 to 2009 (a population‐based study) |
| Representative comparison group? | Low risk | The untreated group was drawn from the same source as the treated group |
| Comparability of treatment groups? | Low risk | Regression analysis for maternal age, socioeconomic status, marital status, urbanism, time since LLETZ, previous PTBs |
| Methods | Retrospective cohort study Comparison group: Internal (pre‐treatment pregnancies) Information source ‐ Hospital records of the University Hospital of Uppsala,Sweden | |
| Participants | Treated group ‐ 115 pregnancies of women who had undergone CT for CIN at the Department of Gynaecological Oncology of the University Hospital of Uppsala between 1973 to 1979 and had a subsequent pregnancy (≥ 28 weeks of gestation). Exclusion criteria: women > 40 years of age at the time of cryotherapy Untreated group ‐ 65 pregnancies before the cryotherapy of the same women | |
| Interventions | CT | |
| Outcomes | PTB (< 36 weeks); pPROM; CS; cervical stenosis; perinatal mortality | |
| Notes | Almost all women were delivered at the University Hospital of Uppsala. Most pre‐therapy pregnancies were completed during 1973 to 1975 (86%) in contrast with post‐therapy pregnancies, of which 76% occurred in 1976 to 1980. The only difference found in this study about the effect of cryosurgery was an increase in the number of CS in the post‐therapy group.However, the higher CS rate only reflects a general trend towards a higher CS rate in Sweden (in 1973 the CS rate at the department was 6% but rose to 13% in 1980). | |
| Risk of bias | ||
| Bias | Authors' judgement | Support for judgement |
| Incomplete outcome data (attrition bias) | Low risk | Information was obtained from hospital records |
| Selective reporting (reporting bias) | Low risk | No reporting bias is obvious |
| Other bias | High risk | The CS rate was six times higher in the treated group than in the untreated group. The higher CS rate probably reflects the general trend towards a higher CS rate in Sweden in the last 10 years before the publication. This is discussed by the authors. |
| Relevant assignment described? | Low risk | Yes, treatment performed on clinical grounds. |
| Representative intervention group? | Low risk | All eligible for the study women who had undergone cryotherapy for CIN in a single University Hospital between 1973 to 1979 and had a subsequent pregnancy |
| Representative comparison group? | Low risk | Internal comparison group (pre‐treatment pregnancies) |
| Comparability of treatment groups? | Low risk | Internal comparison group (pre‐treatment pregnancies) |
| Methods | Retrospective cohort study Comparison group: Women with colposcopic biopsy but no treatment ‐ unmatched; regression analysis for age, race, marital status, payor status, years of education, tobacco use, history of preterm delivery and height of the cone specimen Information source ‐ Hospital records (pathological and obstetric database) | |
| Participants | Treated group ‐ 114 women who had undergone LLETZ between November 2001 and December 2004 and subsequently delivered a singleton, non‐anomalous pregnancy of at least 20 weeks of gestation at Magee‐Womens Hospital. Exclusion criteria: Women with CKC, women with treatment during pregnancy, women with cervical cerclage Untreated group ‐ 962 women who had undergone colposcopic biopsy between November 2001 and December 2004 and subsequently delivered a singleton, non‐anomalous pregnancy of at least 20 weeks of gestation at Magee‐Womens Hospital. Exclusion criteria: Women with cervical cerclage | |
| Interventions | LLETZ | |
| Outcomes | PTB (< 37 weeks); PTB (< 37 weeks) (singleton pregnancies); sPTB (< 37 weeks); pPROM | |
| Notes | The numbers of patients with CKC was small and their exclusion did not change the results. 3 women had conisation during pregnancy and they were excluded. | |
| Risk of bias | ||
| Bias | Authors' judgement | Support for judgement |
| Incomplete outcome data (attrition bias) | Low risk | Information was obtained from hospital records (pathological and obstetric database) |
| Selective reporting (reporting bias) | Low risk | No reporting bias is obvious |
| Other bias | High risk | Table 2 in page 316 is wrong, but the correct data can be pooled from the text. |
| Relevant assignment described? | Low risk | Yes, treatment performed on clinical grounds |
| Representative intervention group? | Low risk | All eligible for the study women delivering in a single hospital |
| Representative comparison group? | Low risk | The untreated group was drawn from the same source as the treated group |
| Comparability of treatment groups? | Low risk | Regression analysis for age, race, marital status, payor status, years of education, tobacco use, history of preterm delivery and height of the cone specimen |
| Methods | Retrospective cohort study Comparison group: External ‐ unmatched; regression analysis for age, parity, smoking Information source ‐ Hospital Discharge Register (information on all inpatient episodes in health care facilities since 1967); Finnish Medical Birth Register | |
| Participants | Treated group ‐ 8422 singleton pregnancies of reproductive‐aged women (15 to 49 years) in Finland who had undergone treatment for CIN during 1986 to 2003 and had a subsequent delivery during 1987 to 2004 (excision:4846; ablation:3576). Exclusion criteria: Women with irrelevant cervical treatments (such as TOPs and excisions of polyps). Untreated group ‐ all singleton pregnancies (1,056,855) of women in Finland who did not have a history of treatment for CIN and delivered during 1987 to 2004. | |
| Interventions | Excision NOS (CKC, LC, LLETZ); Ablation NOS (LA, CT, electrocoagulation) | |
| Outcomes | PTB (< 37 weeks); PTB (< 28 weeks); LBW (< 2500 g); perinatal mortality | |
| Notes | The 3 studies (Heinonen 2013, Jakobsson 2009, Jakobsson 2007) refer to overlapping populations from the Finnish Register. We considered as primary study the most recent (Heinonen 2013) that was a population‐based study assessing the impact of LLETZ from 1997 to 2009. From Jakobsson 2007, we extracted data on the PTB (< 37 weeks) but after exclusion of all patients that were treated after 1997 because we wanted to avoid duplication with Heinonen 2013. We also proportionally adjusted the control population to avoid duplication. We further analysed PTB (< 28 weeks), LBW (< 2500 g) and perinatal mortality as this data are not provided in any other study. | |
| Risk of bias | ||
| Bias | Authors' judgement | Support for judgement |
| Incomplete outcome data (attrition bias) | Low risk | The information was obtained from national registers; It is estimated that 95% of all hospitalizations are registered in the Hospital Discharge Register; Less than 0.1% of all newborns are missing from the Medical Birth Register |
| Selective reporting (reporting bias) | Low risk | No reporting bias is obvious |
| Other bias | Low risk | No other obvious source of bias |
| Relevant assignment described? | Low risk | Yes, treatment performed on clinical grounds |
| Representative intervention group? | Low risk | All eligible for the study Finnish women having a singleton delivery between 1987 to 2004 (a population‐based study) |
| Representative comparison group? | Low risk | The control group was drawn from the same source as the treated group |
| Comparability of treatment groups? | Low risk | The women in the treated group were slightly older, were more often nulliparous (42.8% vs 30.9%), were twice as often smokers (26.6% vs 15.2%), and had lower socioeconomic status. However, adjusting for age, parity and smoking did not change the results of the study. The researchers were not able to adjust also for the socioeconomic status (they were unable to define the socioeconomic status for all women), but in Finland socioeconomic status and smoking are strongly correlated. |
| Methods | Retrospective cohort study Comparison groups: A) External: no matching B) Internal (self‐matching) Both had regression analysis for age, parity, or both Information source ‐ Hospital Discharge Register, Medical Birth Register and hospital records of the Helsinki University Hospital and the Maternity Hospital, Finland | |
| Participants | A) Treated group ‐ 624 women who had undergone LLETZ for CIN during 1997 to 2003 and subsequently delivered at the Helsinki University Hospital or the Maternity Hospital, Finland, until 2006. Inclusion criteria: only singleton pregnancies. Exclusion criteria: women who were treated during pregnancy; women with a delivery during the study year but before LLETZ; women with a previous CKC; multiple pregnancies. Untreated group ‐ 554,507 women having a singleton delivery during 1997 to 2006 (general population of Finland) B) 258 women of the treated group had also a delivery before LLETZ. For these women internal matching (self‐matching) was possible, in addition to the external comparison group. | |
| Interventions | LLETZ | |
| Outcomes | PTB (< 37 weeks); PTB (< 37 weeks) (nulliparous); PTB (< 37 weeks) (parous) | |
| Notes | The 3 studies (Heinonen 2013, Jakobsson 2009, Jakobsson 2007) refer to overlapping populations from the Finnish Register. We considered as primary study the most recent (Heinonen 2013) that was a population‐based study assessing the impact of LLETZ from 1997 to 2009. From Jakobsson 2009 that refers to two hospitals in Southern Finland, we have included as outcomes the PTB (< 37 weeks) for nulliparous as opposed to multiparous women that is not described in the other two cohorts. We also included data in the analysis from this paper on self‐matching (internal controls). These data are not presented in the other two references of the same population. In order to minimise overlap, we have only included data for the internal comparison in the separate forest plot for internal matching but not in the merged one, as it was impossible to discriminate the possible overlap with Heinonen 2013. | |
| Risk of bias | ||
| Bias | Authors' judgement | Support for judgement |
| Incomplete outcome data (attrition bias) | Low risk | Information was obtained from national registries and hospital records. For some parameters, there was incomplete data (e.g. for 45.5% of the women, the cone size was unknown and for 7.7% of the women, the CIN diagnosis was unknown). Complete data for the duration of pregnancy. |
| Selective reporting (reporting bias) | Low risk | No reporting bias is obvious |
| Other bias | Low risk | No other obvious source of bias |
| Relevant assignment described? | Low risk | Yes, treatment performed on clinical grounds |
| Representative intervention group? | Low risk | All eligible for the study women delivering in two hospitals during 1997 to 2006 |
| Representative comparison group? | Unclear risk | A) The external comparison group was not drawn from the same source as the treated group (it was drawn from the national Birth Register covering the whole of Finland, whereas the treated group was drawn from two specific hospitals) B) Internal (self‐matching) |
| Comparability of treatment groups? | Low risk | A) External: Regressional analysis for age, parity, or both. No conspicuous difference between the treated and the external comparison group, regarding socioeconomic class, smoking during pregnancy, alcohol consumption during pregnancy, or substance abuse during pregnancy. B) Internal (self‐matching) |
| Methods | Retrospective cohort study Comparison group: External ‐ matching for age (+/‐ 5 years), parity, social class, date of delivery (same month or immediately preceding or following month) and singleton birth Information source ‐ Clinical records available from the Cardiff Cervical Cytology Study (for cases), Cardiff Birth Survey (for controls) | |
| Participants | Treated group ‐ 66 pregnancies of all women from Cardiff who had undergone CKC between February 1965 and April 1974 and subsequently had a singleton pregnancy (up to April 1975) proceeding beyond 28 weeks' gestation. Untreated group ‐ 264 pregnancies of women from Cardiff having a singleton pregnancy without previous treatment. | |
| Interventions | CKC | |
| Outcomes | PTB (< 37 weeks); PTB (< 37 weeks) (singleton pregnancies); sPTB (< 37 weeks); CS; instrumental deliveries (ventouse/forceps); precipitous labour (< 2 hours); prolonged labour (> 12 hours); LBW (< 2500 g); perinatal mortality; stillbirth | |
| Notes | Between February 1965 and April 1974, 600 women from Cardiff had CKC. 372 of these women were potentially fertile and up to April 1975, 76 had 91 pregnancies after the CKC. 13 pregnancies aborted spontaneously, 11 were terminated and there was one twin pregnancy. The other 66 singleton pregnancies were included. 10 pregnancies were the second one after the treatment and one pregnancy was the third one after the treatment. | |
| Risk of bias | ||
| Bias | Authors' judgement | Support for judgement |
| Incomplete outcome data (attrition bias) | Low risk | The information was obtained from hospital records and registries |
| Selective reporting (reporting bias) | Low risk | No reporting bias is obvious |
| Other bias | Low risk | No other obvious source of bias |
| Relevant assignment described? | Low risk | Yes, treatment performed on clinical grounds |
| Representative intervention group? | Low risk | All eligible women from Cardiff that had CKC between February 1965 to April 1974 (a population‐based study) |
| Representative comparison group? | Low risk | The untreated group was drawn from the same source as the treated group |
| Comparability of treatment groups? | Low risk | Matching for age (+/‐ 5 years), parity, social class, date of delivery (same month or immediately preceding or following month) and singleton birth |
| Methods | Retrospective cohort study Comparison group: External ‐ matching for age, parity and smoking Information source ‐ University Hospital of the Ludwig‐Maximilians | |
| Participants | Treated group ‐ 135 patients who delivered at the University Hospital of the Ludwig‐Maximilians University between 2006 and 2012 and had undergone cervical conisation before giving birth; exclusion criteria: twin pregnancies Untreated group ‐ 135 women who had not undergone cervical conisation before giving birth | |
| Interventions | Excision NOS | |
| Outcomes | PTB (< 37 weeks); PTB (< 37 weeks) (singleton); CS | |
| Notes | At first, 144 patients with treatment before pregnancy were identified. However, 3 patients were excluded for having twin pregnancies and six women could not be matched and therefore were also excluded | |
| Risk of bias | ||
| Bias | Authors' judgement | Support for judgement |
| Incomplete outcome data (attrition bias) | Low risk | The information was obtained from hospital records |
| Selective reporting (reporting bias) | Low risk | No reporting bias is obvious |
| Other bias | Low risk | No other obvious source of bias |
| Relevant assignment described? | Low risk | Yes, treatment performed on clinical grounds |
| Representative intervention group? | Low risk | All eligible for the study women delivering in a single university hospital between 2006 to 2012 |
| Representative comparison group? | Low risk | The untreated group was drawn from the same source as the treated group |
| Comparability of treatment groups? | Low risk | Matching for age, parity and smoking |
| Methods | Retrospective cohort study Comparison group: Women with punch biopsy but no treatment ‐ matching for age, parity and smoking Information source ‐ maternity and colposcopy databases of a large tertiary unit in the North East of England | |
| Participants | Treated group ‐ 278 women who had undergone LLETZ during 2000 to 2010 and subsequently delivered in a large tertiary unit in the North East of England during 2008 to 2011. Only the first pregnancy after treatment was included. Untreated group ‐ 278 women who delivered in the same unit during the same time period and had had punch biopsy but no treatment before birth Inclusion criteria (for both groups): singleton pregnancies of at least 20 weeks of gestation | |
| Interventions | LLETZ | |
| Outcomes | PTB (< 37 weeks); PTB (< 37 weeks) (singleton pregnancies); PTB (< 34 weeks); sPTB; pPROM; CS; instrumental deliveries; LBW (< 2500 g); NICU admission | |
| Notes | 30 women underwent two or more LLETZ procedures. The mean gestational age of these women did not differ from the mean gestational age of the women who underwent only one LLETZ procedure. | |
| Risk of bias | ||
| Bias | Authors' judgement | Support for judgement |
| Incomplete outcome data (attrition bias) | Low risk | Information was obtained from hospital records |
| Selective reporting (reporting bias) | Low risk | No reporting bias is obvious |
| Other bias | Unclear risk | Excised cones were formalin fixed at the time of receipt in the pathology lab which is known to result in tissue retraction and hence a reduction in the measured dimensions |
| Relevant assignment described? | Low risk | Yes, treatment performed on clinical grounds |
| Representative intervention group? | Low risk | All eligible for the study women delivering in a large tertiary unit during 2008 to 2011 |
| Representative comparison group? | Low risk | The untreated group was drawn from the same source |
| Comparability of treatment groups? | Low risk | Matching for age, parity and smoking |
| Methods | Retrospective cohort study Comparison group: External ‐ no matching, no regression analysis Information source ‐ Hospital records | |
| Participants | Treated group ‐ 76 singleton deliveries of 65 women who delivered at the Department of Obstetrics & Gynaecology, Medical University of Graz, Austria, between 1992 to 2002 and had previously undergone CKC at the same hospital or other hospital. Exclusion criteria: Women with LLETZ, repeated conisation, previous PTB or multiple gestations. No woman had undergone CKC during pregnancy. Untreated group ‐ all singleton deliveries (29711) of the women who delivered at the Department of Obstetrics & Gynaecology, Medical University of Graz, Austria, between 1992 to 2002 and did not have a history of cervical conisation | |
| Interventions | CKC | |
| Outcomes | PTB (< 37 weeks); PTB (< 37 weeks) (single cone); PTB (< 37 weeks) (singleton pregnancies); PTB (< 34 weeks); pPROM; CS; chorioamnionitis; LBW (< 2500 g); perinatal mortality | |
| Notes | There were 29,809 singleton deliveries at the University Hospital of Graz between 1992 and 2002. 98 deliveries of 86 women with history of conisation were identified. The researchers excluded 21 women and their 22 deliveries. 16 of them had undergone LLETZ, 2 had had more than one conisation, 1 had had previous PTB, and 2 had multiple gestations. 65 women with a total of 76 deliveries had undergone CKC and were included in the conisation group. For controls the researchers took the remaining 29,711 singleton deliveries in the study period. 53 women had undergone CKC at the University Hospital of Graz, 12 at other hospitals. No woman had undergone CKC during pregnancy. | |
| Risk of bias | ||
| Bias | Authors' judgement | Support for judgement |
| Incomplete outcome data (attrition bias) | Low risk | Complete data in the control group; a small percentage of incomplete data for most outcomes in the untreated group |
| Selective reporting (reporting bias) | Low risk | No reporting bias is obvious |
| Other bias | Low risk | No other obvious source of bias |
| Relevant assignment described? | Low risk | Yes, treatment performed on clinical grounds |
| Representative intervention group? | Low risk | All eligible for the study women delivering in a single hospital between 1992 to 2002 |
| Representative comparison group? | Low risk | The untreated group was drawn from the same source as the treated group |
| Comparability of treatment groups? | High risk | Neither matching nor regression analysis; the median age at delivery was 30 years (range 21 to 43) in the treated group vs 28 years (range 14 to 61) in the untreated group; 73.7% multigravidas in the treated group vs 49.9% multigravidas in the untreated group; no significant difference in smoking habits |
| Methods | Retrospective cohort study Comparison group: External ‐ matching for age and parity Information source ‐ Records of the Data Processing Unit at Odense University Hospital/Questionnaires (treated group), Records of Odense University Hospital (untreated group) | |
| Participants | Treated group ‐ All women who had conisation performed in the county of Funen between April 1973 and December 1980 and had a subsequent pregnancy (before April 1982). 85 pregnancies (proceeding beyond 28 weeks) of 82 women were finally included in the analysis. Untreated group ‐ All singleton deliveries at Odense University Hospital between 1978 and 1982. (Odense University Hospital mainly serves the town of Ostense and the surrounding rural areas) | |
| Interventions | Treatment NOS | |
| Outcomes | PTB (< 37 weeks); PTB (< 37 weeks) (singleton pregnancies); LBW (< 2500 g) | |
| Notes | ||
| Risk of bias | ||
| Bias | Authors' judgement | Support for judgement |
| Incomplete outcome data (attrition bias) | Low risk | The needed information was obtained from hospital records. For women having left the county of Funen, a questionnaire was sent about the outcome of probable pregnancies after treatment; replies were received from all patients. |
| Selective reporting (reporting bias) | Low risk | No reporting bias is obvious |
| Other bias | Low risk | No other obvious source of bias |
| Relevant assignment described? | High risk | The type of conisation is not described |
| Representative intervention group? | Low risk | All eligible women from the county of Funen that had treatment for CIN between April 1973 to December 1980 (a population‐based study) |
| Representative comparison group? | Low risk | The untreated group was drawn from the same source as the treated group |
| Comparability of treatment groups? | Low risk | Matching for age and parity |
| Methods | Retrospective cohort study Comparison groups: A) External ‐ no matching, no regression analysis B) Internal (self‐matching) Information source ‐ Medical Birth Register, National Register of Hospital Discharges | |
| Participants | All women with a permanent address in Denmark with singleton pregnancies who gave birth to their first infant in 1982 and second infant during the time period 1982 to 1987. For treated group, treatment took place during 1977 to 1987. A) The first and second delivery of the women whose treatment took place before the first delivery (68 deliveries of 34 women) and the second delivery of the women whose treatment took place between the first and second delivery (62 deliveries of 62 women) were compared with the first and second delivery of the women with no treatment (28124 deliveries of 14062 women) B) For the 62 women whose treatment took place between the first and second delivery, the first delivery was compared with the second delivery (self‐matching) | |
| Interventions | Treatment NOS (CKC, laser, electrocautery) | |
| Outcomes | PTB (< 37 weeks); PTB (< 37 weeks) (nulliparous); PTB (< 37 weeks) (parous); PTB (<3 7 weeks) (singleton pregnancies) | |
| Notes | In the cohort of 14,233 women, 170 had cervical conisation: 34 before the first childbirth, 62 between the first and second childbirth, and 74 after the second childbirth. | |
| Risk of bias | ||
| Bias | Authors' judgement | Support for judgement |
| Incomplete outcome data (attrition bias) | Low risk | The information was obtained from national registers |
| Selective reporting (reporting bias) | Low risk | No reporting bias is obvious |
| Other bias | Low risk | No other obvious source of bias |
| Relevant assignment described? | Unclear risk | The type of conisation is not described as details are not included in the national registry. Treatment may include CKC, laser or electrocautery |
| Representative intervention group? | Low risk | This is a population‐based study and the treated group is representative of the average women who undergoes conisation |
| Representative comparison group? | Low risk | A) The external comparison group was drawn from the same source as the treated group B) Internal comparison group (self‐matching) |
| Comparability of treatment groups? | High risk | A) No matching, no regression analysis B) Internal comparison group (self‐matching) |
| Methods | Retrospective cohort study Comparison group: External ‐ matching for age, parity, date of delivery (generally same month) and singleton birth Information source ‐ Hospital records of University Central Hospital of Tampere | |
| Participants | Treated group ‐ Women who had CKC at the University Central Hospital of Tampere in 1962 to 1979 and had a subsequent pregnancy. Finally, 62 pregnancies lasting more than 28 weeks were included in the analysis. Untreated group ‐ 62 pregnancies (> 28 weeks) of women from the labour room register without previous treatment. | |
| Interventions | CKC | |
| Outcomes | PTB (< 37 weeks); CS; instrumental deliveries (ventouse); induction of labour; oxytocin use; analgesia use NOS; cervical cerclage; perinatal mortality; stillbirth | |
| Notes | The study comprised patients who had cervical conization at the University Central Hospital of Tampere in 1962 to 1979. A total of 317 women had cone biopsy: 77 between them had 98 pregnancies. Of these pregnancies, 36 lasted less than 28 weeks and 62 more than 28 weeks. | |
| Risk of bias | ||
| Bias | Authors' judgement | Support for judgement |
| Incomplete outcome data (attrition bias) | Low risk | The information was obtained from hospital records |
| Selective reporting (reporting bias) | Low risk | No reporting bias is obvious. |
| Other bias | Low risk | No other obvious source of bias |
| Relevant assignment described? | Low risk | Yes, treatment performed on clinical grounds |
| Representative intervention group? | Low risk | All eligible women that had CKC at the Univeristy Hospital of Tampere between 1962 to 1979 |
| Representative comparison group? | Low risk | The untreated group was pooled from the same source as the treated group |
| Comparability of treatment groups? | Low risk | Matching for age, parity, date of delivery and singleton birth |
| Methods | Retrospective cohort study Comparison group: Internal (pre‐treatment pregnancies) with matching for age, parity, socioeconomic status, smoking, surgical interventions and various diseases Information source ‐ South Swedish Regional Tumour Registry, hospital records | |
| Participants | Treated group ‐ 197 deliveries after CKC Untreated group ‐ 284 deliveries before CKC The CKC took place between 1962 and 1976 | |
| Interventions | CKC | |
| Outcomes | PTB (< 37 weeks); PTB (< 37 weeks) (singleton pregnancies); PTB (< 37 weeks) (multiple pregnancies); perinatal mortality; stillbirth | |
| Notes | 988 women had undergone conization because of dysplasia in varying degree or carcinoma in situ over the 15‐year period 1962 to 1976. 197 women became pregnant with a total of 635 pregnancies before and after conisation. 37 of the women had not been pregnant before the conisation. Number of pregnancies before conisation: 341 (284 deliveries). Number of pregnancies after conization: 294 (197 deliveries) | |
| Risk of bias | ||
| Bias | Authors' judgement | Support for judgement |
| Incomplete outcome data (attrition bias) | Low risk | The information was obtained from hospital records and registries |
| Selective reporting (reporting bias) | Low risk | No reporting bias is obvious |
| Other bias | Low risk | No other obvious source of bias |
| Relevant assignment described? | Low risk | Yes, treatment performed on clinical grounds |
| Representative intervention group? | Low risk | The treated group was pooled from the South Swedish Regional Tumour Registry. The treated group is in all likelihood representative of the average women who undergoes CKC (a population‐based study) |
| Representative comparison group? | Low risk | Internal comparison group (self‐matching) |
| Comparability of treatment groups? | Low risk | Internal comparison group (self‐matching) with matching for age, parity, socioeconomic status, smoking, surgical interventions and various diseases |
| Methods | Retrospective cohort study Comparison group: External ‐ no matching, no regression analysis Information source ‐ Hospital records of Dr Alfredo Da Costa Maternity, Lisbon | |
| Participants | Treated group ‐ 29 women who had undergone LLETZ or LC (LC = 11; LLETZ = 18) between 2000 to 2005 at Dr Alfredo da Costa Maternity and had a subsequent delivery at the same hospital. Untreated group ‐ 58 women without previous cervical treatment who delivered at the same hospital during 2000 to 2005 (the immediate matched delivery before and after each case) | |
| Interventions | LC; LLETZ | |
| Outcomes | PTB (< 37 weeks); PTB (< 37 weeks) (D≤ 10 mm); PTB (< 37 weeks) (D> 10 mm); CS; LBW (< 2500g); Apgar score (<7) (5min) | |
| Notes | ||
| Risk of bias | ||
| Bias | Authors' judgement | Support for judgement |
| Incomplete outcome data (attrition bias) | Low risk | Information was obtained from hospital records |
| Selective reporting (reporting bias) | Low risk | No reporting bias is obvious |
| Other bias | Low risk | No other obvious sources of bias |
| Relevant assignment described? | Low risk | Yes, treatment performed on clinical grounds |
| Representative intervention group? | Low risk | All eligible for the study women delivering in a single hospital during the study period |
| Representative comparison group? | Low risk | The untreated group was drawn from the same source as the treated group |
| Comparability of treatment groups? | High risk | No matching or regression analysis for possible confounders |
| Methods | Retrospective cohort study Comparison group: External ‐ matching for age, parity and time of delivery Information source ‐ Hospital records of the Regional Hospital of Orebro | |
| Participants | Treated group ‐ 83 deliveries of 75 women who were below 35 years of age, underwent a cone biopsy at the Regional Hospital of Orebro between 1964 and 1978 and had later a pregnancy ending in a delivery. Women who had an elective section were excluded. Untreated group ‐ 79 deliveries of 79 women without previous treatment. | |
| Interventions | CKC | |
| Outcomes | PTB (≤ 3 7weeks); PTB (≤ 33 weeks); PTB (< 30 weeks); PPH (> 600 mL); MOH (1000 mL) | |
| Notes | 780 women below 35 years of age underwent a cone biopsy at the Regional Hospital of Orebro between 1964 and 1978. Of these 780 women, 79 later had a pregnancy ending in a delivery. As elective section was performed in four cases of the conized group, the final number of women in this group was 75 with 83 deliveries, as opposed to 79 in the control group. The cone depth was almost 2 cm in most operations. | |
| Risk of bias | ||
| Bias | Authors' judgement | Support for judgement |
| Incomplete outcome data (attrition bias) | Low risk | The information was obtained from hospital records |
| Selective reporting (reporting bias) | Low risk | No reporting bias is obvious |
| Other bias | Low risk | No other obvious source of bias |
| Relevant assignment described? | Low risk | Yes, treatment performed on clinical grounds. |
| Representative intervention group? | Low risk | All women < 35 years that underwent CKC in a Regional Hospital between 1964 and 1978 |
| Representative comparison group? | Unclear risk | It is unclear how the control group was selected. |
| Comparability of treatment groups? | Low risk | Matching for age, parity and time of delivery |
| Methods | Retrospective cohort study Comparison group: Women with colposcopy but no treatment ‐ matching for age Information source ‐ Records of the National Maternity Hospital (Mediscan database, pathology records and other clinical records) and postal questionnaires | |
| Participants | Treated group ‐ 297 women who had undergone LLETZ or CKC at the National Maternity Hospital during 2001 to 2007 and subsequently had a pregnancy (≥ 24 weeks of gestation) Untreated group ‐ 204 women who had had colposcopy but no treatment at the National Maternity Hospital during 2001 to 2007 and subsequently had a pregnancy (≥ 24 weeks of gestation) Inclusion criteria (for both groups): women aged 24 to 40 years *This is only a subgroup of the study population. The main outcome of the study was the effect of CKC/LLETZ on subsequent fertility, but we are not studying infertility in this meta‐analysis. Therefore, we restricted the population to the pregnant women with a pregnancy of at least 24 weeks of gestation (see "Notes" below for more details) | |
| Interventions | LLETZ; Excision NOS (CKC, multiple LLETZ) | |
| Outcomes | PTB ( <37 weeks); PTB (< 37 weeks) (single cone) | |
| Notes | 3590 women aged 24 to 40 years, who had attended the colposcopy services in the National Maternity Hospital between 2001 and 2007, were sent a postal questionnaire about the fertility and the pregnancies, if any, after colposcopy/CKC/LLETZ (LLETZ:1729; CKC:66;colposcopy only:1795). 1355 women (37.7%) replied. Of those who responded, 759 had one LLETZ, 37 had CKC, 22 had more than one LLETZ (in total, 818 had surgery) and 537 women had colposcopy only. i) Of those with surgery, 321 became pregnant: 38 had a gestational age less than 14 weeks and 5 had a gestational age 14 weeks to < 24 weeks. We excluded from our meta‐analysis these women and we included the remaining 278. ii) Of those with colposcopy only, 228 became pregnant: 23 had a gestational age less than 14 weeks and 1 had a gestational age 14 weeks to < 24 weeks. We excluded from our meta‐analysis these women and we included the remaining 204. We included LLETZ and Excision NOS (CKC and multiple LLETZ) | |
| Risk of bias | ||
| Bias | Authors' judgement | Support for judgement |
| Incomplete outcome data (attrition bias) | High risk | Only 37.7% of the women responded to the postal questionnaire which was sent to them |
| Selective reporting (reporting bias) | Low risk | No reporting bias is obvious |
| Other bias | High risk | Questionnaires were used for the ascertainment of the outcomes; there is a risk of recall bias and misclassification of the outcomes |
| Relevant assignment described? | Low risk | Yes, treatment performed on clinical grounds |
| Representative intervention group? | High risk | Only a small percentage of the women responded to the questionnaire which was sent to them. The women who replied are more likely to belong to a higher socioeconomic class. |
| Representative comparison group? | Low risk | The untreated group was drawn from the same source as the treated group |
| Comparability of treatment groups? | Low risk | Matching for age; Both groups had colposcopy before pregnancy |
| Methods | Retrospective cohort study Comparison group: A) External B) Women with prior dysplasia but no treatment Both had regression analysis for age, parity, race/ethnicity, BMI and cervical length during pregnancy Information source ‐ Hospital records of Northwestern Memorial Hospital, Chicago | |
| Participants | Treated ‐ 1356 women with prior excisional procedure for cervical dysplasia who underwent routine cervical length assessment between 18 to 23 6/7 weeks of gestation from December 2010 through January 2014 at Northwestern Memorial Hospital in Chicago. Untreated ‐ A) 14,149 women with no prior dysplasia and no excisional procedure B) 3023 women with prior dysplasia but no excisional procedure Exclusion criteria: women younger than 18 years old, twin pregnancies, women with unavailable delivery records | |
| Interventions | Excision NOS | |
| Outcomes | PTB (< 37 weeks); PTB (< 37 weeks) (singleton) | |
| Notes | At first, 144 women with treatment before pregnancy were identified. However, 3 women were excluded for having twin pregnancies and six women could not be matched and therefore were also excluded | |
| Risk of bias | ||
| Bias | Authors' judgement | Support for judgement |
| Incomplete outcome data (attrition bias) | Low risk | The information was obtained from hospital records |
| Selective reporting (reporting bias) | Low risk | No reporting bias is obvious |
| Other bias | Low risk | No other obvious source of bias |
| Relevant assignment described? | Low risk | Yes, treatment performed on clinical grounds |
| Representative intervention group? | Low risk | All eligible for the study women undergoing routine cervical length assessment in a single hospital during December 2010 to January 2014 |
| Representative comparison group? | Low risk | Both comparison groups were drawn from the same source as the treated group |
| Comparability of treatment groups? | Low risk | Regression analysis for age, parity, race/ethnicity, BMI and cervical length during pregnancy |
| Methods | Retrospective cohort study Comparison group: Internal (pre‐treatment pregnancies) Information source ‐ Hospital records of the East Hospital, Gothenburg | |
| Participants | Treated group ‐ all viable pregnancies after CKC (103) of 90 women who had CKC at the East Hospital, Gothenburg, between 1968 and 1973 Untreated group ‐ all viable pregnancies before CKC (720) of the same women All miscarriages were excluded | |
| Interventions | CKC | |
| Outcomes | PTB (< 37 weeks); cervical cerclage | |
| Notes | Radical CKC procedure: if the endocervix was involved, the entire endocervical cancel was excised to the level of the internal os. Between 1968 and 1973, 414 women were treated by cone biopsy at the East Hospital, Gothenburg, Sweden. 324 women had been pregnant before conisation, with 801 pregnancies between them, and after cone biopsy 90 women became pregnant, with 122 pregnancies. | |
| Risk of bias | ||
| Bias | Authors' judgement | Support for judgement |
| Incomplete outcome data (attrition bias) | Low risk | The information was obtained from hospital records |
| Selective reporting (reporting bias) | Low risk | No reporting bias is obvious |
| Other bias | Low risk | No other obvious source of bias |
| Relevant assignment described? | High risk | Yes, but CKC described as more than usual radical |
| Representative intervention group? | Low risk | All eligible women that had CKC at East Hospital, Gothenburg, between 1968 and 1973 |
| Representative comparison group? | Low risk | Internal comparison group (pre‐treatment pregnancies) |
| Comparability of treatment groups? | Low risk | Internal comparison group (pre‐treatment pregnancies) |
| Methods | Retrospective cohort study Comparison groups: A) External B) Women with biopsy but no treatment Both were unmatched but had regression analysis for age, year of delivery, smoking during pregnancy and marital status during pregnancy Information source ‐ Medical Birth Registry, National Patient Registry, Danish Registry of Pathology, Danish IVF Registry | |
| Participants | Treated group ‐ 10,207 deliveries of women who had undergone LLETZ or ablation (LLETZ = 8180; Ablation = 2027) during 1997 to 2005 and had a subsequent singleton delivery (21 to 45 weeks of gestation) during 1997 to 2005. Exclusion criteria: women with previous CKC; deliveries with medical induction before 37 completed weeks of gestation; infants delivered by CS performed before 37 completed weeks of gestation; deliveries subsequent to a collum amputation. Untreated group ‐ A) 510,841 singleton deliveries (21 to 45 weeks of gestation during 1997 to 2005) of women without previous cervical procedure (treatment or biopsy) B) 31,630 singleton deliveries (21 to 45 weeks of gestation during 1997 to 2005) of women without previous treatment but with previous biopsy. | |
| Interventions | LLETZ; Ablation NOS | |
| Outcomes | sPTB (< 37 weeks); sPTB (< 37 weeks) (D ≤ 12 mm); sPTB (< 37 weeks) (D = 13 mm to 15mm); sPTB (< 37 weeks) (D = 16 mm to 19 mm); sPTB (< 37 weeks) (D ≥ 20 mm); sPTB (< 37 weeks) (single cone); sPTB (< 37 weeks) (repeat cones); sPTB (< 37 weeks) (singleton pregnancies); sPTB (< 32 weeks); sPTB (< 28 weeks) | |
| Notes | Of the 552,678 deliveries in the study, 8180 deliveries were subsequent to LLETZ (1 LLETZ: 7907; 2 LLETZ: 255; ≥ 3 LLETZ: 18). Of these 8180 deliveries, 162 were subsequent to both LLETZ and ablation. The addition of the number of deliveries subsequent to biopsy, ablation, LLETZ and no procedure (table 3 of the article) gives the total number of pregnancies (552,678), thus we concluded that the authors subtracted these 162 deliveries from the ablation group and left them only in the LLETZ group. In this way, we made sure that we will not make a duplicate extraction of the same deliveries. The Nordic Classification of Surgical Procedures has the same code for LLETZ and LC and the authors were not able to separate LLETZ from LC. However, LC has become rare in Denmark since the introduction of LLETZ and the authors included the pregnancies with this code in the LLETZ group. In our meta‐analysis, we made the same. In a second article, Noehr and colleagues 2009 investigated the association between cone depth of the LLETZ and the subsequent risk of sPTB (on the same singleton deliveries as above). Deliveries after LLETZ with no information on cone depth (n = 4302) and deliveries after two or more LLETZ (n = 273) were not included in the cone depth analysis. Nohr and colleagues 2007 is an overlapping study, but it was impossible to extract only the data that was not included in Noehr and colleagues 2009 and we excluded this study. | |
| Risk of bias | ||
| Bias | Authors' judgement | Support for judgement |
| Incomplete outcome data (attrition bias) | Low risk | Information was obtained from national registries |
| Selective reporting (reporting bias) | Low risk | No reporting bias is obvious |
| Other bias | Unclear risk | The Nordic Classification of Surgical Procedures has the same code for LLETZ and LC and the authors were not able to separate LLETZ from LC. However, LC has become rare in Denmark since the introduction of LLETZ and the authors included all these pregnancies in the LLETZ group. |
| Relevant assignment described? | Low risk | Yes, treatment performed on clinical grounds |
| Representative intervention group? | Low risk | All eligible for the study Danish women delivering during 1997 to 2005 (a population‐based study) |
| Representative comparison group? | Low risk | The 2 comparison groups were drawn from the same source as the treated group |
| Comparability of treatment groups? | Low risk | Regression analysis for age, year of delivery, smoking during pregnancy and marital status during pregnancy |
| Methods | Retrospective cohort study Comparison group: External ‐ unmatched; regression analysis for age, year of delivery, smoking during pregnancy, marital status during pregnancy and IVF Information source ‐ Medical Birth Registry, National Patient Registry, Danish Registry of Pathology, Danish IVF Registry | |
| Participants | Treated group ‐ 166 deliveries of women who had undergone LLETZ during 1997 to 2005 and had a subsequent twin delivery (21 to 45 weeks of gestation) during 1997 to 2005. Exclusion criteria: women with previous CKC; deliveries with medical induction before 37 completed weeks of gestation; infants delivered by CS performed before 37 completed weeks of gestation; deliveries subsequent to a collum amputation. Untreated group ‐ 9702 twin deliveries (21 to 45 weeks of gestation during 1997 to 2005) of women without previous LLETZ | |
| Interventions | LLETZ | |
| Outcomes | sPTB (< 37 weeks) (multiple pregnancies); sPTB (< 32 weeks) (multiple pregnancies); sPTB (< 28 weeks) (multiple pregnancies) | |
| Notes | Of the 9868 twin deliveries in the study, 166 were subsequent to LEEP (of which 11 were subsequent to both LEEP and ablation), 43 were subsequent to ablation, 766 were subsequent to biopsy with no additional cervical procedure, and the remaining 8893 deliveries were not preceded by any cervical procedure. Only 4 (2.4%) of the deliveries subsequent to LEEP were preceded by more than one LEEP. The Nordic Classification of Surgical Procedures has the same code for LLETZ and LC and the authors were not able to separate LLETZ from LC. However, LC has become rare in Denmark since the introduction of LLETZ and the authors included all these pregnancies in the LLETZ group. In our meta‐analysis, we made the same. In contrast to another article of Noehr and colleagues 2009 with the same study design but about singletons, this one does not give sPTB rate in the group with no cervical procedure or in the group with biopsy only (gives only adjusted ORs). Therefore, we used the no‐LLETZ group (which may have undergone ablation or biopsy before delivery) as the control group. Nohr 2007 is a duplicate study that includes a proportion of the population that is presented in Noehr 2009. As there is a possibility of substantial overlap the data from this study were not used. | |
| Risk of bias | ||
| Bias | Authors' judgement | Support for judgement |
| Incomplete outcome data (attrition bias) | Low risk | Information was obtained from national registries |
| Selective reporting (reporting bias) | High risk | Data are not shown for the group with ablation, for the group with biopsy only and for the group with no cervical procedure |
| Other bias | Unclear risk | The control group is not really untreated because 43 women in it (0.4%) have undergone ablation prior to delivery. The Nordic Classification of Surgical Procedures has the same code for LLETZ and LC and the authors were not able to separate LLETZ from LC. However, LC has become rare in Denmark since the introduction of LLETZ and the authors included the pregnancies with this code in the LLETZ group. |
| Relevant assignment described? | Low risk | Yes, treatment performed on clinical grounds |
| Representative intervention group? | Low risk | All eligible for the study Danish women delivering during 1997 to 2005 (a population‐based study) |
| Representative comparison group? | Low risk | The untreated group was drawn from the same source as the treated group |
| Comparability of treatment groups? | Low risk | Regression analysis for age, year of delivery, smoking during pregnancy, marital status during pregnancy and IVF |
| Methods | Retrospective cohort study Comparison Groups: A) External B) Women with HSIL but no treatment Both had regression analysis for age, parity, smoking status, educational level and marital status C) Internal (self‐matching) Information source ‐ the pathology database, hospital records, the Aarhus birth cohort and questionnaires | |
| Participants | Treated group ‐ 758 women who had a conisation between 1989 to 2007 (one conisation = 721; two conisations = 37) and were identified from the Danish nationwide pathology database and subsequently had a pregnancy at the University Hospital of Aarhus until March 2007. Only the first delivery after treatment was included. Untreated group ‐ A) 74,552 deliveries of women without history of conisation or dysplasia who delivered at the University Hospital of Aarhus during the study period B) 390 deliveries of women with CIN not treated with conisation who delivered at the University Hospital of Aarhus during the study period Inclusion criteria (for both groups): singleton deliveries. Exclusion criteria: missing gestational age or missing birth weight (0 in the treated group; 355 in the untreated group; women with preterm induced birth (4 in the treated group; 778 in the untreated group), preterm acute CS before labour (6 in the treated group; 534 in the untreated group) or preterm elective CS (2 in the treated group; 348 in the untreated group) were excluded from the Cox regression. C) Self‐matching for 170 women who had one conisation and had a delivery both before and after the conisation (last child born before versus first child born after the single conisation) | |
| Interventions | CKC; Electroknife; LLETZ | |
| Outcomes | sPTB (< 37 weeks); sPTB (< 37 weeks) (single cone); sPTB (< 37 weeks) (repeat cones); sPTB (< 37 weeks)(singleton pregnancies); sPTB (< 32 weeks); sPTB (< 28 weeks); pPROM (< 37 weeks); pPROM (< 32 weeks); pPROM (< 28 weeks); LBW (< 2500 g); LBW (< 2000 g); LBW (< 1500 g); perinatal mortality; perinatal mortality (<37 weeks); perinatal mortality (< 32 weeks); perinatal mortality (< 28 weeks) | |
| Notes | Approximately 8% of all Danish births take place at the University Hospital of Aarhus. Most conisation procedures were performed at the University Hospital of Aarhus, but a small number were performed at specialist clinics in Aarhus or at the County Hospital in Odder. From 1989 to 1992, all conisations were performed with the cold‐knife procedure, and from 1992 to 1995 the cold‐knife procedure was only used for high conisations and in pregnant women. After 1995, the cold‐knife procedure was omitted, and instead the electro knife was used when a high conus biopsy was warranted. Of the 710 women with one conisation (excluding preterm induced birth (n = 4), preterm acute CS before labour (n = 5) and preterm elective CS (n = 2)) prior to pregnancy, the conus procedures were distributed as follows: 572 women had LLETZ, 71 women had an electrosurgical needle procedure (electroknife), and 67 had CKC. 18 women had treatment during pregnancy. Because the percentage of the women with treatment during pregnancy was low (2.5%), we decided to include this study, because we estimated that these women would not change the results. | |
| Risk of bias | ||
| Bias | Authors' judgement | Support for judgement |
| Incomplete outcome data (attrition bias) | Low risk | In the untreated external/CIN group, 355 deliveries (0.5%) were excluded because of missing gestational age or missing birth weight. In the treated group, no delivery was excluded because of missing data. 14% of the study cohort did not reply to a questionnaire about, inter alia, previous pregnancies. These women were not excluded from the study, but more women might have been eligible for the internal comparison group. |
| Selective reporting (reporting bias) | Low risk | No reporting bias is obvious |
| Other bias | High risk | Questionnaires for the outcomes of previous pregnancies; there is a risk of recall bias and misclassification of the outcome when self‐matching was used |
| Relevant assignment described? | Low risk | Yes, treatment performed on clinical grounds |
| Representative intervention group? | Low risk | All eligible for the study women delivering in a single university hospital during 1989 to 2007 |
| Representative comparison group? | Low risk | A) External ‐ B) women with HSIL but no treatment: The untreated group was drawn from the same source as the treated group C) Internal comparison group (self‐matching) |
| Comparability of treatment groups? | Low risk | A) External B) Women with HSIL but no treatment Both had regression analysis for age, parity,smoking status, educational level and marital status C) Internal comparison group (self‐matching) |
| Methods | Retrospective cohort study Comparison group: External ‐ matching for age, parity, smoking, multiple pregnancies and history of previous PTBs Information source ‐ Hospital records of the University Hospital of Ioannina | |
| Participants | Treated group ‐ 28 women with stage IA1 cervical carcinoma without vascular or lymph space involvement who were treated with LLETZ between 1990 to 1998 at the University Hospital of Ioannina and had at least one pregnancy beyond 24 weeks following the treatment (by 2001) Untreated group ‐ 28 women who delivered at the same hospital during the same year without previous treatment of the cervix | |
| Interventions | LLETZ | |
| Outcomes | PTB (< 37 weeks); PTB (< 37 weeks) (single cone); PTB (< 37 weeks) (repeat cones); sPTB; CS; precipitous labour (< 2 hours); LBW (< 2500 g); NICU admission | |
| Notes | During the period 1990 to 1998, 47 women with microinvasive cervical carcinoma stage IA1 without vascular or lymph space involvement were managed exclusively with LLETZ and had clear excisional margins after a single or repeat cone. Of these women, 28 had at least one pregnancy beyond 24 weeks. Of the remaining 19 women, 12 did not become pregnant by 2001, 6 had first‐trimester miscarriage, and one had an elective TOP. 5 cases had LLETZ performed in two steps in a tophat configuration, because of an endocervically extended lesion. Three women had repeat LLETZ. | |
| Risk of bias | ||
| Bias | Authors' judgement | Support for judgement |
| Incomplete outcome data (attrition bias) | Low risk | The information was obtained from hospital records |
| Selective reporting (reporting bias) | Low risk | No reporting bias is obvious |
| Other bias | Low risk | No other obvious source of bias |
| Relevant assignment described? | Low risk | Yes, treatment performed on clinical grounds |
| Representative intervention group? | Low risk | All eligible for the study, women having LLETZ in a single university hospital between 1990 to 1998 |
| Representative comparison group? | Low risk | The untreated group was drawn from the same source as the treated group |
| Comparability of treatment groups? | Low risk | Matching for age, parity, smoking, multiple pregnancies and history of previous PTBs |
| Methods | Retrospective cohort study Comparison group: External ‐ no matching, no regression analysis Information source ‐ Hospital records of St. Luke’s Hospital and Health Network | |
| Participants | Treated women ‐ 87 women who had ≥1 LLETZ and then conceived, underwent cervical length screening by transvaginal ultrasound during 2001 to 2005 at St. Luke’s Hospital and Health Network and delivered at the same hospital. Exclusion criteria: women with other surgical procedures to the cervix (such as laser, CT, CKC, cerclage); other causes of PTB, such as multiple gestation, major fetal anomaly and preterm induction of labor resulting from maternal or fetal indication; women delivering in other hospitals Untreated group ‐ 18,042 singleton births of women without previous treatment who delivered at the same hospital during 2001 to 2005 | |
| Interventions | LLETZ | |
| Outcomes | PTB (≤ 34 weeks) | |
| Notes | A total of 97 patients who had undergone LLETZ were identified during the specified time period. Of these, 10 patients were lost to follow‐up because of delivery outside the St. Luke’s Hospital and Health Network. Thus 87 patients were included in the LLETZ group for analysis. | |
| Risk of bias | ||
| Bias | Authors' judgement | Support for judgement |
| Incomplete outcome data (attrition bias) | Low risk | Data were obtained from hospital records; 10 patients in the treated group (10.3%) were lost to follow‐up |
| Selective reporting (reporting bias) | Low risk | No reporting bias is obvious |
| Other bias | Low risk | No other obvious source of bias |
| Relevant assignment described? | Low risk | Yes, treatment performed on clinical grounds |
| Representative intervention group? | Low risk | All eligible for the study women delivering in a single hospital during 2001 to 2005 |
| Representative comparison group? | Low risk | The untreated group was drawn from the same source as the treated group |
| Comparability of treatment groups? | High risk | No matching, no regression analysis |
| Methods | Prospective cohort study Comparison group: External ‐ unmatched; regression analysis for parity, race, smoking, cervical length, previous delivery at term, previous PTB, previous miscarriage and previous LLETZ (for the prediction of sPTB) Information source ‐ questionnaires (for the ascertainment of the exposure); maternity records of the King's College Hospital and the University Hospital Lewisham/records of general practitioners (for the ascertainment of the outcomes) | |
| Participants | Treated group ‐ 473 pregnant women with a prior LLETZ who underwent routine antenatal care at King’s College Hospital or University Hospital Lewisham and had a transvaginal sonographic measurement of the cervical length at 20 to 24 weeks of gestation, during January 1998 to July 2006 Untreated group ‐ 25,722 pregnant women without previous LLETZ who underwent routine antenatal care at King’s College Hospital or University Hospital Lewisham and had a transvaginal sonographic measurement of the cervical length at 20 to 24 weeks of gestation, during January 1998 to July 2006 Inclusion criteria (for both groups): singleton pregnancies Exclusion criteria (for both groups): women with major fetal abnormalities, with painful regular uterine contractions, with a history of ruptured membranes or cervical cerclage in situ, with a cervical length at 20 to 24 weeks of gestation ≤ 15mm and because of this treated with a cervical cerclage or prophylactic progesterone | |
| Interventions | LLETZ | |
| Outcomes | sPTB (< 37 weeks); sPTB (< 34 weeks) | |
| Notes | ||
| Risk of bias | ||
| Bias | Authors' judgement | Support for judgement |
| Incomplete outcome data (attrition bias) | Low risk | Information was obtained from medical records and from questionnaires which were completed by all patients |
| Selective reporting (reporting bias) | Low risk | No reporting bias is obvious |
| Other bias | High risk | Questionnaires were used for the ascertainment of the exposure; there is a risk of recall bias and misclassification of the exposure |
| Relevant assignment described? | Low risk | Yes, treatment performed on clinical grounds |
| Representative intervention group? | Low risk | All eligible for the study women with antenatal care at two hospitals during January 1998 to July 2006 |
| Representative comparison group? | Low risk | The untreated group was drawn from the same source as the treated group |
| Comparability of treatment groups? | Low risk | Regression analysis for parity, race, smoking, cervical length, previous delivery at term, previous PTB, previous miscarriage and previous LLETZ (for the prediction of sPTB) |
| Methods | Retrospective cohort study Comparison groups: A) External ‐ matching for age (+/‐ 1 year), parity, marital status, social class, smoking habits and previous PTB B) Internal (self‐matching) Information source ‐ Hospital records of the Department of Obstetrics and Gynecology of Munsterlingen, Kantonsspital, Switzerland | |
| Participants | A) Treated group ‐ 64 women younger than 35 years of age who had undergone LC at the Department of Obstetrics and Gynecology of Munsterlingen, Kantonsspital, Switzerland, from August 1, 1986, to December 31, 1994, and subsequently had a pregnancy by December 31, 1996. Only the first pregnancy after treatment was included. Exclusion criteria: voluntary termination of pregnancy, twin gestation, first‐trimester miscarriage, fetal death, ectopic pregnancy, second‐trimester termination of pregnancy for fetal structural abnormalities, blighted ovum, and cervical incompetence for previous pregnancy. Untreated group ‐ 64 women who were delivered at the same hospital during the study period and had not had any surgical procedure of the cervix. B) 26 women of the treated group were parous. For these women, self‐matching was also possible. | |
| Interventions | LC | |
| Outcomes | PTB (< 37 weeks); PTB (< 37 weeks) (singleton pregnancies); PTB (< 37 weeks) (D < 10 mm); PTB (< 37 weeks) (D ≥ 10 mm); pPROM | |
| Notes | The study was conducted at the Department of Obstetrics and Gynecology of Munsterlingen, Kantonsspital, Switzerland, from August 1, 1986, to December 31, 1994. Laser conisation was performed in 228 women younger than 35 years of age with CIN. 26 women were lost after treatment. By December 31, 1996, 117 pregnancies occurred in 78 patients who had undergone laser conisation. If women conceived more than once, only the first subsequent gestation was included in the analysis. 14 women were excluded because of the following reasons: voluntary termination of pregnancy (n = 4), twin gestation (n = 3), first‐trimester miscarriage (n = 2), fetal death (n = 1), ectopic pregnancy (n=1), second‐trimester termination of pregnancy for fetal structural abnormalities (n = 1), blighted ovum (n = 1), and cervical incompetence for previous pregnancy (n = 1). The remaining 64 women with singleton pregnancies were included in the treated group. CIN 3 = 33/64 (51.6%); CIN 2 = 22/64 (34.4%); CIN 1 = 9/64 (14%). Regression analysis for history of PTB, advanced maternal age, smoking, multiparity and cone height: cone height was the only covariate that remained significant. | |
| Risk of bias | ||
| Bias | Authors' judgement | Support for judgement |
| Incomplete outcome data (attrition bias) | Low risk | Of the 228 women who had undergone LC from August 1, 1986, to December 31, 1994, 26 women (11.4%) were lost after treatment. |
| Selective reporting (reporting bias) | Low risk | No reporting bias is obvious. |
| Other bias | Low risk | No other obvious source of bias |
| Relevant assignment described? | Low risk | Yes, treatment performed on clinical grounds. |
| Representative intervention group? | Low risk | All eligible women that had LC in a single Swiss canton hospital between August 1986 to December 1994 |
| Representative comparison group? | Low risk | A) The untreated group was pooled from the same source as the treated group B) Internal comparison group (self‐matching) |
| Comparability of treatment groups? | Low risk | A) Matching for age (+/‐ 1 year), parity, marital status, social class, smoking habits and previous PTB B) Internal comparison group (self‐matching) |
| Methods | Retrospective cohort study Comparison groups: A) External B) Women with colposcopy +/‐ punch biopsy but no treatment Both were unmatched but had regression analysis for maternal age at birth, social deprivation, smoking status, time interval between screening/colposcopy/treatment and conception, any history of a previous adverse pregnancy outcome (and gestational age for LBW outcome) Information source ‐ the Cervical Screening Wales programme database, the National Community Child Health Database and All Wales Perinatal Survey | |
| Participants | Treated group ‐ all women in Wales aged 20 to 39 years who had a first referral to colposcopy and received cervical treatment for CIN between April 2001 ‐ March 2004, and then had a singleton pregnancy of at least 24 weeks until January 2009; n=2202 (single excision:1546; single ablation:534; multiple treatments:82; other:40) Untreated group ‐ A) all women in Waled aged 20 to 39 years who had a negative cervical smear between April 2001to March 2004 with no history of abnormal smears, and then had a singleton pregnancy of at least 24 weeks of gestation until January 2009; n=38983 B) all women in Wales aged 20 to 39 years who had a first referral to colposcopy +/‐ punch biopsy (but no cervical treatment) between April 2001 to March 2004, and then had a singleton pregnancy of at least 24 weeks of gestation until January 2009; n = 2534 Inclusion criteria: only the first pregnancy following the smear, colposcopy, or treatment Exclusion criteria: women who were pregnant at the time of screening/colposcopy/treatment during the study period; women in the | |
| Interventions | Single excision NOS (LLETZ, CKC); single ablation NOS (LA, CC, CT); multiple treatments (either multiple excisions, either multiple ablations, or both); other | |
| Outcomes | PTB (< 37 weeks); PTB (< 37 weeks) (single cone); PTB (< 37 weeks) (repeat cones); PTB (< 37 weeks) (singleton pregnancies); PTB (< 32 weeks); PTB (< 28 weeks); LBW (< 2500 g) | |
| Notes | At the bottom of the table 2 (page 240) it is stated that the percentages are based on the babies for whom the gestational age and the birth weight was known. However, the authors do not give more information about how many babies in each category had a known gestational age and a known birth weight. Thus, i) we calculated the total number of babies with a known gestational age in each category according to the rate of PTB < 37 weeks ii) we calculated the total number of babies with a known birth weight in each category according to the rate of LBW < 2500 g. Because the percentages were rounded, this calculation was not very precise. The addition of the numbers of babies with a known gestational age of all categories diverged from the known number of babies with a known gestational age given at the bottom of the table. The same for the babies with a known birth weight. Because the divergence was small, we decided not to make any other correction. Women that had 'other treatments' were not included in our meta‐analysis. | |
| Risk of bias | ||
| Bias | Authors' judgement | Support for judgement |
| Incomplete outcome data (attrition bias) | Low risk | For 225 women (0.1% of the total initial study population) no unique identifier (such as NHS number or date of birth) was available and these women were excluded. 18,512 women (10.6% of the eligible for data linkage women) died in the follow‐up period or were no longer Welsh residents. 2.6% of the babies had an unknown gestational age and 0.4% of the babies had an unknown birth weight. |
| Selective reporting (reporting bias) | Low risk | No reporting bias is obvious |
| Other bias | Low risk | No other obvious source of bias |
| Relevant assignment described? | Low risk | Yes, treatment performed on clinical grounds |
| Representative intervention group? | Low risk | All eligible for the study women having cervical treatment in Wales (April 2001 to March 2004) and then delivering in Wales (till January 2009) (a population‐based study) |
| Representative comparison group? | Low risk | Both untreated groups were drawn from the same source as the treated group |
| Comparability of treatment groups? | Low risk | Regression analysis for maternal age at birth, social deprivation, smoking status, time interval between screening/colposcopy/treatment and conception, any history of a previous adverse pregnancy outcome (and gestational age for LBW outcome |
| Methods | Retrospective cohort study Comparison group: Women with colposcopy but no treatment ‐ unmatched; regressional analysis for age, ethnicity, socioeconomic status, smoking in pregnancy, previous obstetric history, transfer to the National Women's Hospital and antepartum haemorrhage Information source ‐ linking the colposcopy service database at National Women’s Hospital (NWH), Auckland, for the years 1988 through 1999 with the obstetric database at the same hospital for deliveries from 1989 through 2000. | |
| Participants | Treated group ‐ 652 women whose pregnancy occurred after treatment with LA, LC, or LLETZ. Inclusion criteria: Women who were seen and/or treated at the colposcopy clinic (1988 to 1999), subsequently carried a singleton pregnancy to at least 20 completed weeks' gestation, and delivered or had postpartum care at the study hospital (1989 to 2000). Only the first qualifying pregnancy per woman was included in the study. Exclusion criteria: Women whose prior treatment status was unknown. Women treated by modes other than LA, LC and LLETZ, and women who had cervical treatments before 1988 Untreated group ‐ 426 women who had a pregnancy following a visit to the colposcopy service but before no cervical treatments that may have been administered. A pregnancy was included only if the visit to the colposcopy clinic or treatment occurred before the first menstrual period was missed (i.e. last menstrual period + 30 days) | |
| Interventions | LC; LLETZ; LA | |
| Outcomes | PTB (< 37 weeks); PTB (< 37 weeks) (single cone); PTB (< 37 weeks) (repeat cones); PTB (< 37 weeks) (singleton pregnancies); PTB (< 37 weeks) (D ≤ 10 mm); PTB (< 37 weeks) (D = 11 mm to 16 mm); PTB (< 37 weeks) (D ≥ 17 mm); PTB (< 32 weeks); sPTB (< 37 weeks); pPROM | |
| Notes | From the colposcopy database of 9226 women, 1208 women were found to have had a singleton live birth of at least 20 weeks’ gestation, by linkage with the obstetric records. Of these, 27 were excluded for invalid treatments (13 cryotherapy, 8 Cartier biopsies, and 6 coldknife conisations), 10 for unknown previous treatment status, and 93 because of previous treatment, leaving a cohort of 1078 women who had given birth following treatment or their first encounter at the colposcopy clinic. The clinical records of 1020 women (95%) were abstracted in full. Data were obtained from the database for women whose colposcopy or obstetric records could not be located (4%). In the treated group, 606 women had one treatment before pregnancy, 44 two treatments and two three treatments. The proportion of women in treated vs untreated group with histology: HPV/CIN1 (32.1% vs 46.6%); CIN2/3/AIS (61.7% vs 5.2%); Microinvasion (0.9% vs 0%); No dysplasia/other diagnosis (2% vs 21.1%); none (3.4% vs 27%) | |
| Risk of bias | ||
| Bias | Authors' judgement | Support for judgement |
| Incomplete outcome data (attrition bias) | Low risk | The information was obtained from hospital records; small number of incomplete data |
| Selective reporting (reporting bias) | Low risk | No reporting bias is obvious |
| Other bias | Low risk | No other obvious source of bias |
| Relevant assignment described? | Low risk | Yes, treatment performed on clinical grounds |
| Representative intervention group? | Low risk | All eligible for the study women that had LA, LC or LLETZ at the National Women's Hospital (NWH); NWH is the principal provider of public colposcopy services and inpatient obstetric care to women in the central Auckland area |
| Representative comparison group? | Low risk | The untreated group was drawn from the same source as the treated group |
| Comparability of treatment groups? | Low risk | Regressional analysis for age, ethnicity, socioeconomic status, smoking in pregnancy, previous obstetric history, transfer to the National Women's Hospital and antepartum haemorrhage. |
| Methods | Retrospectice cohort study Comparison group: Internal (pre‐treatment pregnancies) Information source ‐ Hospital records of the Hospital Mere‐Enfant, Nantes, France | |
| Participants | Treated group ‐ 54 women (53 pregnancies) under 39 years of age who had undergone LC between 1 July 1982 and 30 June 1992 and had one or more pregnancies after their operation. Untreated group: 38 women of the treated group (59 pregnancies) who had also a pregnancy before treatment Inclusion criteria: Only pregnancies leading to the birth of a child were included. | |
| Interventions | LC ‐ two different techniques: Before 1986, hand‐held laser (10/54) under GA with 2 stitches, cone‐shaped 1 cm to 2 cm deep, radius 1 cm to 1.5 cm, LA for haemostasis ‐ After 1986, micromanipulator (44/54), less radical, cylinder, 0.8 cm to 1.8 cm deep, radius 0.6 cm to 0.8 cm. | |
| Outcomes | PTB (< 37 weeks); Threatened PTL; pPROM; CS; chorioamnionitis; cervical cerclage | |
| Notes | Between 1 July 1982 and 30 June 1992, 222 women under 39 years of age underwent CO2 laser conisation for CIN. 27 had subsequent hysterectomy or tubal sterilisation, and 48 others could not be recontacted. Thus, 147 women were available for study. Of these 147 women, 54 had a total of 71 pregnancies after the operation. Of these 71 pregnancies, 53 led to the birth of a live child (two sets of twins). These 53 pregnancies were included in the treated group. Of the 54 women which made out the treated group, 38 had also a pregnancy before the operation. These 38 women had a total of 82 pregnancies before the operation. Of these 82 pregnancies, 59 (all monofetal) led to the birth of a live child. These 59 pregnancies were included in the control group. | |
| Risk of bias | ||
| Bias | Authors' judgement | Support for judgement |
| Incomplete outcome data (attrition bias) | High risk | Of the 222 women who underwent LC between 1 July 1982 and 30 June 1992, 48 (21.6%) could not be recontacted. |
| Selective reporting (reporting bias) | Low risk | No reporting bias is obvious |
| Other bias | Low risk | No other obvious source of bias |
| Relevant assignment described? | Low risk | Yes, treatment performed on clinical grounds. |
| Representative intervention group? | Low risk | All women that had LC in a single university hospital in France between July 1982 to June 1992 |
| Representative comparison group? | Low risk | Internal comparison group (pre‐treatment pregnancies) |
| Comparability of treatment groups? | Low risk | Internal comparison group (pre‐treatment pregnancies) |
| Methods | Retrospective cohort study Comparison group: External ‐ matching for age (+/‐ 1 year), parity (nulliparous/parous), smoking status (yes/no/unknown), year of delivery (+/‐ 1 year) Information source ‐ the Provincial Cytology/Colposcopy Registry (information about all women who have had colposcopy and treatment for CIN in Nova Scotia since 1992) and the Nova Scotia Atlee Perinatal Database (information about all pregnancies and deliveries in Nova Scotia carried beyond 20 weeks of gestation since 1988) | |
| Participants | Treated group ‐ 571 women who had LLETZ in Halifax County between 1992 and 1999 and then had a subsequent singleton pregnancy of greater than 20 weeks of gestation with delivery at the IWK Health Centre in Halifax, Nova Scotia. Only the first delivery after treatment was included. Untreated group ‐ 571 women from Halifax County with no history of cervical surgery who delivered at the IWK Health Centre beyond 20 weeks of gestation. Each control was randomly selected from a pool that included all who matched to a specific case. Exclusion criteria (for both groups): Women who had known major risk factors for PTB, including previous PTB and multiple gestations. Multiple gestations were analysed separately. Women who had an indicated PTB for maternal or fetal reasons. | |
| Interventions | LLETZ | |
| Outcomes | PTB (< 37 weeks); PTB (< 37 weeks) (single cone); PTB (< 37 weeks) (repeat cones); PTB (< 37 weeks) (singleton pregnancies); PTB (< 37 weeks) (multiple pregnancies); PTB (< 34 weeks); PTB (< 34 weeks) (multiple pregnancies); pPROM; CS; induction of labour; oxytocin use; LBW (< 2500 g); NICU admission; perinatal mortality; stillbirth | |
| Notes | Using the Provincial Cytology/Colposcopy Registry database, the authors found that 3056 women had a total of 3315 LLETZ in Halifax County between 1992 and 1999. When the Provincial Cytology/Colposcopy Registry database was linked with the Atlee Database, 1629 women were matched, indicating that they had a pregnancy and delivery at some time in their lives. Of the 1629 matches, 876 (54%) had deliveries only before their LEEP. Of the 753 women with deliveries after their LEEP, 122 (16%) were excluded because they were not Halifax County residents. Additional exclusions were made for indicated preterm delivery, previous preterm delivery, and missing matching variables (parity, age, delivery date), constituting another 50 cases in total. Thus, after appropriate exclusions, there were 581 women who had at least one delivery after their LEEP, 571 singleton, and 10 twin pregnancies. The multiple gestations were excluded from the primary analysis, leaving 571 women in the study group. The authors then retrieved a matched comparison group, consisting of 571 women. In a separate analysis, for the 10 twin pregnancies a matched comparison group was selected in a 5:1 ratio. 5 appropriate matches could not be found for each study patient, resulting in 35 women in the comparison group. | |
| Risk of bias | ||
| Bias | Authors' judgement | Support for judgement |
| Incomplete outcome data (attrition bias) | Low risk | The information was obtained from official databases; small number of incomplete data |
| Selective reporting (reporting bias) | Low risk | No reporting bias is obvious |
| Other bias | Low risk | No other obvious source of bias |
| Relevant assignment described? | Low risk | Yes, treatment performed on clinical grounds |
| Representative intervention group? | Low risk | All eligible for the study women having LLETZ in Halifax County and then delivering at the IWK Health Centre |
| Representative comparison group? | Low risk | The untreated group was drawn from the same source as the treated group |
| Comparability of treatment groups? | Low risk | Matching for age (+/‐ 1 year), parity (nulliparous/parous), smoking status (yes/no/unknown), year of delivery (+/‐ 1 year) |
| Methods | Retrospective cohort study Comparison group: External ‐ matching for age (+/‐5 years), parity, race, year of delivery and singleton pregnancy Information source ‐ Hospital case notes and contact with local general practitioners | |
| Participants | Treated group ‐ 97 pregnancies of 96 women who had previously undergone LA Exclusion criteria: pregnancies ending in the 1st trimester (miscarriage or TOP); women having CKC before LA Untreated group ‐ 97 pregnancies of women booking around 13 to 16 weeks' gestation, with no history of treatment and with recorded pregnancy outcomes | |
| Interventions | LA | |
| Outcomes | PTB (< 37 weeks); PTB (< 37 weeks) (single cone); PTB (< 37 weeks) (repeat cones); pPROM; CS; instrumental deliveries (forceps); LBW (< 2500 g); perinatal mortality | |
| Notes | By consulting hospital case notes and contacting local general practitioners, it was possible to identify 100 pregnancies which had progressed beyond the first trimester in a group of 99 women previously treated with by laser vaporisation cone for CIN. Of the 99 patients, 3 had knife cut cone biopsy followed by laser vaporisation employed at a subsequent date because of recurrent CIN, and because of this were excluded from the main analysis. Thus, 96 patients with 97 pregnancies were included (1 patient had two consecutive normal term deliveries). | |
| Risk of bias | ||
| Bias | Authors' judgement | Support for judgement |
| Incomplete outcome data (attrition bias) | High risk | A part of the data were obtained from contact with local general practitioners (a non‐systematic approach) |
| Selective reporting (reporting bias) | Low risk | No reporting bias is obvious |
| Other bias | Low risk | No other obvious source of bias |
| Relevant assignment described? | Low risk | Yes, treatment performed on clinical grounds |
| Representative intervention group? | Low risk | Women were selected if they had LA and subsequent fell pregnant at Sheffield |
| Representative comparison group? | Low risk | The untreated population was drawn from the same source as the treated group |
| Comparability of treatment groups? | Unclear risk | Matching for age (+/‐5 years), parity, race, year of delivery and singleton pregnancy. Even though it was found that the percentage of smokers was much higher in the treated that the control group (48% vs 26%), the researchers did not match for smoking. |
| Methods | Retrospective cohort study Comparison groups: A) External B) Women with CIN 3 but no treatment Both were unmatched but had regression analysis for maternal age at delivery, smoking, socioeconomic status, year of delivery, birth weight, malpresentation, sPTB and pPROM Information source ‐ Scottish Cancer Registry, Scottish Morbidity Record, National Health Service Scotland Information and Statistics Division | |
| Participants | Treated group ‐ 1388 women (from the whole Scotland) with CIN 3 diagnosed by histology, treated with excisional (CKC = 2; LC = 4; LLETZ = 1097) or ablative treatment (LA = 84, cold coagulation = 181, diathermy coagulation = 20) and subsequently having a first pregnancy that ended between 1980 to 2005 Untreated group ‐ A) 119216 women (from the whole Scotland) without a record of CIN, whose first pregnancies ended between 1980 to 2005; B) 87 women (from the whole Scotland) with CIN3 diagnosed by histology who had a first pregnancy (that ended between 1980 to 2005) without previously receiving treatment for the CIN 3 Inclusion criteria (for all groups): women who delivered between the ages of 20 and 45 years inclusive, at a gestational age of 24 to 43 weeks, neonatal birth weight more than 350 g, and, in case of CIN 3, women who were diagnosed at the age of 20 or older | |
| Interventions | Excision NOS (CKC, LC, LLETZ); Ablation (LA, CC, diathermy coagulation) | |
| Outcomes | PTB (< 37 weeks); sPTB (< 37 weeks); pPROM; CS; LBW (< 2500 g); perinatal mortality | |
| Notes | For 1638 women (1638/3113 = 52.6%) with CIN 3, the type of therapy (if any) was not known. | |
| Risk of bias | ||
| Bias | Authors' judgement | Support for judgement |
| Incomplete outcome data (attrition bias) | High risk | Information was obtained from national registries. For 52.6% of the treated population, the treatment methods (if any) were not known and these were not included in the analysis. |
| Selective reporting (reporting bias) | Low risk | No reporting bias is obvious |
| Other bias | Low risk | No other obvious source of bias |
| Relevant assignment described? | Low risk | Yes, treatment performed on clinical grounds |
| Representative intervention group? | Low risk | All eligible for the study women in Scotland having a delivery during 1980 to 2005 (a population‐based study) |
| Representative comparison group? | Low risk | Both untreated groups were drawn from the same source as the treated group |
| Comparability of treatment groups? | Low risk | Regression analysis for maternal age at delivery, smoking, socioeconomic status, year of delivery, birth weight, malpresentation, sPTB, pPROM |
| Methods | Prospective cohort study Comparison group: External ‐ matching for admittance in the same maternity ward; regression analysis for age, parity, ethnicity, smoking, education, HIV status Information source ‐ a centralised web‐based database of the four participating Belgian academic hospitals ("Hopital de la Citadelle" and "Centre Hospitalier du Bois de l’Abbaye (CHBAH)" in Liege, "Hopital St. Pierre" and "Hopital Erasme" in Brussels); questionnaires in combination with checking of obstetrical medical files | |
| Participants | Treated group ‐ 97 women who had undergone excisional or ablative treatment for CIN and then delivered at one of the four participating Belgian academic hospitals during September 2008 to November 2010 Untreated group ‐ 194 women who delivered at one of the four participating Belgian academic hospitals during September 2008 to November 2010 and who never had treatment for CIN or a history of CIN (the next two women after each case meeting these criteria and who delivered in the same maternity ward) Inclusion criteria: only women with a singleton pregnancy Exclusion criteria: women with insufficient data on previous treatment, without a nonexposed cluster, lacking pregnancy outcome data and unexposed women in excess | |
| Interventions | LC, LLETZ, Excision NOS (CKC, LC, LLETZ) +/‐ Ablation NOS (LA, CC, CT) | |
| Outcomes | PTB (< 37 weeks); PTB (< 37 weeks) (D ≤ 10 mm); PTB (< 37 weeks) (D> 10 mm); PTB (< 37 weeks) (singleton pregnancies); PTB (< 32 weeks); sPTB (< 37 weeks); sPTB (< 32 weeks); CS; LBW (< 2500 g) | |
| Notes | Of the 97 treated women, 81 received an excisional treatment, eight an ablative treatment and eight an excisional treatment followed by ablation (mixed) | |
| Risk of bias | ||
| Bias | Authors' judgement | Support for judgement |
| Incomplete outcome data (attrition bias) | Low risk | Information was obtained from hospital records and questionnaires in combination with checking of medical files |
| Selective reporting (reporting bias) | Unclear risk | The results are presented analytically only for the following 3 treatment categories: i) only excision or excision in combination with ablation ii) LLETZ iii) LC; the remaining treatments only had a small number of patients and were not presented |
| Other bias | Low risk | No other obvious source of bias |
| Relevant assignment described? | Low risk | Yes, treatment performed on clinical grounds |
| Representative intervention group? | Low risk | All eligible for the study women delivering at 4 university hospitals during September 2008 to November 2010 |
| Representative comparison group? | Low risk | The untreated group was drawn from the same source as the treated group |
| Comparability of treatment groups? | Low risk | Matching for admittance in the same maternity ward; regression analysis for age, parity, ethnicity, smoking, education, HIV status |
| Methods | Retrospective cohort study Comparison groups: A) External ‐ matching for age (+/‐ 2 years), parity and plurality B) Internal (self‐matching) Both had regression analysis for smoking, marital status and education Information source ‐ Records of the eight hospitals that participated in this regional multicentre study (Oestfold Hospital Trust, Soerlandet Hospital Trust, Vestfold Hospital Trust, Telemark Hospital Trust, Baerum Hospital, Buskerud Hospital Trust, Ringerike Hospital, Rikshospitalet University Hospital) | |
| Participants | Treated group ‐ 742 women who had undergone LC or LLETZ (LC: 609; LLETZ: 133) during 1990 to 1999 at one of the eight participating hospitals, were 40 years or younger at the time of operation, subsequently had a pregnancy progressing beyond 16 weeks, and gave their permission to the researchers to collect information about their pregnancy from their medical records in the hospital where they delivered. Only the first pregnancy after treatment was included Untreated group ‐ A) 742 women without previous treatment who delivered at one of the eight participating hospitals (the first subsequent after case delivering woman matched by age, parity and plurality) B) In the treated group, 419 women had delivered before the treatment as well. Thus, it is also possible to compare their first pregnancy after treatment with their first pregnancy before treatment. | |
| Interventions | Excision NOS (LC, LLETZ) | |
| Outcomes | PTB (< 37 weeks); PTB (< 32 weeks); PTB (< 28 weeks); pPROM; LBW (< 2500 g); LBW (< 1500 g); LBW (< 1000 g); perinatal mortality | |
| Notes | Because all women included in this study have been also included in Albrechtsen 2008, we excluded it from the analyses in which Albrechtsen 2008 has been also included. A regional, multi‐centre, retrospective case‐control study was designed to investigate pregnancy outcome after LC or LLETZ compared to a control group of pregnant women without such a procedure. Women who underwent either LC or LLETZ in the period from January 1, 1990 to December 31, 1999, were investigated for reproductive events. Those who were 40 years of age or younger at the time of operation were contacted in writing with information about the study and a request for permission to collect relevant information from their medical records in the hospitals where they had given birth. A total of 2,393 women were contacted, and 742 women (31%) answered our request. The non‐responding group consisted of both true non‐responders who had given birth after conisation, and patients who had not given birth after conisation. Written consent was not collected for the controls, since their data were extracted anonymously from the birth registries of the participating hospitals. In the external treated group, 7 women had a second‐trimester miscarriage. In the article, in the tables with the results, these women were not included. | |
| Risk of bias | ||
| Bias | Authors' judgement | Support for judgement |
| Incomplete outcome data (attrition bias) | High risk | The women who had undergone LLETZ or LC were contacted in writing so that the researchers would obtain their consent to collect information about their probable future pregnancies. Only 742 (31%) responded and gave their consent. The non‐responding group consisted of both true non‐responders who had given birth after conisation, and patients who had not given birth after conisation. |
| Selective reporting (reporting bias) | Low risk | No reporting bias is obvious |
| Other bias | Low risk | No other obvious source of bias |
| Relevant assignment described? | Low risk | Yes, treatment performed on clinical grounds |
| Representative intervention group? | High risk | The women who had undergone LLETZ or LC were contacted in writing so that the researchers would obtain their consent to collect information about their probable future pregnancies. Only 742 (31%) responded and gave their consent. The non‐responding group consisted of both true non‐responders who had given birth after conisation, and patients who had not given birth after conisation. The women who replied are more likely to have a higher level of education. |
| Representative comparison group? | Low risk | A) The untreated group was drawn from the same source as the treated group B) Internal comparison group (self‐matching) |
| Comparability of treatment groups? | Low risk | A) Matching for age (+/‐2 years), parity and plurality B) Internal comparison group (self‐matching) Both comparison groups had regression analysis for smoking, marital status and education |
| Methods | Retrospective cohort study Comparison group: External ‐ matching for age, parity and obstetric history Information source ‐ Records of the Zeynep Kamil Women's Hospital, Istanbul | |
| Participants | Treated group ‐ 15 women who had undergone CKC at the Zeynep Kamil Women's Hospital during 2005 to 2010 and subsequently had a pregnancy (beyond 20 weeks of gestation) Inclusion ‐ 24 women who had a pregnancy (beyond 20 weeks of gestation) without a history of cervical intervention Exclusion criteria (for both group) ‐ miscarriages | |
| Interventions | CKC | |
| Outcomes | PTB (< 37 weeks); pPROM; NICU admission | |
| Notes | Among 392 patients who had CKC at Zeynep Kamil Women's Hospital (a tertiary referral teaching institution in Istanbul, Turkey) between the years 2005 to 2010, 22 had a subsequent pregnancy. 7 of those pregnancies resulted in miscarriage and were excluded. | |
| Risk of bias | ||
| Bias | Authors' judgement | Support for judgement |
| Incomplete outcome data (attrition bias) | Low risk | Information was obtained from hospital records |
| Selective reporting (reporting bias) | Low risk | No reporting bias is obvious |
| Other bias | Low risk | No other obvious source of bias |
| Relevant assignment described? | Low risk | Yes, treatment performed on clinical grounds |
| Representative intervention group? | High risk | Very small number of the treated group (n = 15) |
| Representative comparison group? | Low risk | The untreated group was drawn from the same source as the treated group |
| Comparability of treatment groups? | Low risk | Matching for age, parity and obstetric history |
| Methods | Retrospective cohort study Comparison group: Internal (pre‐treatment pregnancies) with matching for age and parity Information source ‐ Hospital records of the Colposcopy Clinic at Queens Hospital Centre and every record from the private practice of the authors (for the ascertainment of the exposure); questionnaires by mail, telephone or in person (for the ascertainment of the outcomes) | |
| Participants | Treated group ‐ 163 livebirths after LC or LA (34 after LC, 129 after LA) Control group ‐ 112 livebirths before LC or LA (15 before LC, 97 before LA) Inclusion criteria: Laser surgery during 1979‐1989. Women under the age of 40 at the time of delivery Exclusion criteria: Pre‐treatment or after‐treatment intervals, during which women were not at risk for pregnancy (e.g. they had tubal ligation or hysterectomy, or their husbands had vasectomies). Pregnancies that were ongoing at the time the women responded to the questionnaire. After‐treatment intervals for which no appropriate pre‐treatment interval was found. | |
| Interventions | LC; LA | |
| Outcomes | PTB (< 37 weeks) | |
| Notes | ||
| Risk of bias | ||
| Bias | Authors' judgement | Support for judgement |
| Incomplete outcome data (attrition bias) | High risk | The researchers used questionnaires to acquire information about previous pregnancies. Of the initial 1069 women fulfilling the inclusion criteria, only 512 (47.9%) responded. |
| Selective reporting (reporting bias) | Low risk | No reporting bias is obvious |
| Other bias | High risk | Questionnaires were used for the ascertainment of the outcomes of previous pregnancies. There is a risk of recall bias and misclassification of the outcome. |
| Relevant assignment described? | Low risk | Yes, treatment performed on clinical grounds |
| Representative intervention group? | High risk | Almost half of the women did not reply to the questionnaires. The women that replied are more likely to have a higher educational level. |
| Representative comparison group? | Low risk | Internal comparison group (pre‐treatment pregnancies) with matching for age and parity |
| Comparability of treatment groups? | Low risk | Internal comparison group (pre‐treatment pregnancies) with matching for age and parity |
| Methods | Retrospective cohort study Comparison groups: A) Women with cervical cytology/punch biopsy ‐ matching for age, hospital site and calendar year of cervical procedure (LLETZ, cervical cytology, punch biopsy) B) Internal (pre‐treatment pregnancies) Information source ‐ electronic pathology databases of several tertiary and community hospitals; structured phone interviews in combination with checking of medical records | |
| Participants | Treated group ‐ 598 women who had undergone LLETZ at the participating tertiary and community hospitals between 1996 and 2006 and subsequently had a pregnancy Untreated group ‐ A) 1129 women who had undergone cervical cytology (580) or cervical punch biopsy (549) at the participating hospitals during the same period and subsequently had a pregnancy B) Internal (pre‐treatment pregnancies of the women with LLETZ) Inclusion criteria (for all groups):only the first singleton pregnancy beyond 20 weeks of delivery following the cervical procedure Exclusion criteria (for all groups): women with a history of CKC; women without gestational age of delivery recorded; women with a cervical procedure outside the participating hospitals; women with medically indicated PTB (e.g. pre‐eclampsia, intrauterine growth restriction, non‐reassuring fetal testing) | |
| Interventions | LLETZ | |
| Outcomes | sPTB (< 37 weeks); sPTB (< 37 weeks) (singleton pregnancies); sPTB (< 34 weeks) | |
| Notes | ||
| Risk of bias | ||
| Bias | Authors' judgement | Support for judgement |
| Incomplete outcome data (attrition bias) | Low risk | The gestation age at delivery was unknown for < 6% of the population |
| Selective reporting (reporting bias) | Low risk | No reporting bias is obvious |
| Other bias | Low risk | No other obvious source of bias |
| Relevant assignment described? | Low risk | Yes, treatment performed on clinical grounds |
| Representative intervention group? | Low risk | All eligible for the study women having LLETZ at several hospitals during 1996 to 2006 |
| Representative comparison group? | Low risk | A) The untreated group was drawn from the same source as the treated group B) Internal comparison group (pre‐treatment pregnancies) |
| Comparability of treatment groups? | Low risk | A) The untreated group was women with cervical cytology/punch biopsy matched for age, hospital site and calendar year of cervical procedure B) Internal comparison group (pre‐treatment pregnancies) |
| Methods | Retrospective cohort study Comparison group: External ‐ matching for age and parity Information source ‐ Hospital records of Basildon District Hospital | |
| Participants | Treated group ‐ 119 women 35 years old or younger who had undergone LLETZ and delivered in Basildon District Hospital, between 1995 and 1998. Only first pregnancies following treatment were included. Control group ‐ 119 women who had not had colposcopy/LLETZ and delivered in Basildon District Hospital between 1995 and 1998. | |
| Interventions | LLETZ | |
| Outcomes | PTB (< 37 weeks); CS; instrumental deliveries (ventouse/forceps); prolonged labour (> 12 hours); induction of labour; oxytocin use; epidural use; pethidine use | |
| Notes | 168 women 35 years old or younger had undergone LLETZ and delivered in Basildon District Hospital, between 1995 and 1998. Of these, 119 women were included in the treated group and the others were excluded, because their notes could not be retrieved. | |
| Risk of bias | ||
| Bias | Authors' judgement | Support for judgement |
| Incomplete outcome data (attrition bias) | High risk | 168 women were eligible for the study. Of these, 49 (29.2%) were excluded because their notes could not be retrieved, with no further details given by the authors. |
| Selective reporting (reporting bias) | Low risk | No reporting bias is obvious. |
| Other bias | High risk | There are some contradictions in the presented data; e.g. although it is stated that there are 14/119 and 11/119 miscarriages in the treated and untreated group, respectively, it later presents the mode of delivery in 119 women in each group |
| Relevant assignment described? | Low risk | Yes, treatment performed on clinical grounds. |
| Representative intervention group? | Low risk | All eligible women delivering in a single hospital between 1995 and 1998. |
| Representative comparison group? | Low risk | The untreated group was drawn from the same source as the treated group |
| Comparability of treatment groups? | Unclear risk | Matching for age and parity. Smoking was higher in the treated group (52.3%) than in the untreated group (24.4%). |
| Methods | Retrospective cohort study Comparison group: Women with colposcopically directed biopsy but no treatment ‐ regression analysis for age Information source ‐ Hospital records of New Havover Regional Medical Center, telephone interviews/mail‐in questionnaires (for reproductive history since their visit to the colposcopy clinic) | |
| Participants | Treated group ‐ 15 women between the ages of 16 and 40 who were treated with LEEP for CIN at New Havover Regional Medical Center, Wilmington, North Carolina, between 1991 and 1992, and then had a pregnancy which led to delivery Untreated group ‐ 15 women of the same range of age who had been seen in the colposcopy clinic during the same period for abnormal smear but who did not receive excisional or ablative therapy, and then had a pregnancy which led to delivery Exclusion criteria: Women who were anatomically unable to become pregnant as a result of permanent sterilization or hysterectomy. | |
| Interventions | LLETZ | |
| Outcomes | Stillbirth | |
| Notes | Between January 1991 and December 1992, 647 women were evaluated and treated for abnormal cervical cytologic smears in the colposcopy clinic at New Hanover Regional Medical Centerm a 630‐bed hospital in Wilmington, North Carolina, that serves as a referral centre for southeastern North Carolina. Using telephone interviews and mail‐in questionnaires, 158 women between the ages of 16 and 40 who had undergone colposcopy for abnormal smears were contacted and questioned about their reproductive history since their visit to the colposcopy clinic (79 destined for the treated group and 79 destined for the control group). In the treated group, 54 women replied and were included in the analysis. In the control group, 57 women replied and were included in the analysis. | |
| Risk of bias | ||
| Bias | Authors' judgement | Support for judgement |
| Incomplete outcome data (attrition bias) | High risk | Of the 158 women surveyed, 111 (70.3%) responded to the questionnaire or telephone interview; 29.7% did not reply. |
| Selective reporting (reporting bias) | Low risk | No reporting bias is obvious |
| Other bias | High risk | Questionnaires and telephone interviews were used for the ascertainment of the outcome; there is a risk of recall bias and misclassification of the outcome |
| Relevant assignment described? | Low risk | Yes, treatment performed on clinical grounds |
| Representative intervention group? | High risk | Questionnaires or telephone interviews were used for the selection of the treated group; the women who replied are more likely to belong to a higher socioeconomic class |
| Representative comparison group? | Low risk | The untreated group was drawn from the same source as the treated group |
| Comparability of treatment groups? | Low risk | The untreated group was taken from women that were seen in the colposcopy clinic; regression analysis for age |
| Methods | Retrospective cohort study Comparison group: External ‐ matching for age (+/‐2 years), parity and year of delivery (+/‐2 years) Information source ‐ electronic and paper patient files at the University Hospital of Leuven and questionnaires | |
| Participants | Treated group ‐ 55 pregnancies (beyond 22 weeks of gestation) of 43 women who had undergone LLETZ (40 patients; 50 pregnancies) or LC (3 patients, 5 pregnancies) during 1999 to 2003 at the University Hospital of Leuven and subsequently delivered before 2007. Exclusion criteria: pregnancies that resulted in a miscarriage Untreated group ‐ 55 pregnancies of 54 women who had no intervention on the cervix or were never diagnosed with CIN | |
| Interventions | Excision NOS (LC, LLETZ) | |
| Outcomes | PTB (< 37 weeks); PTB (< 37 weeks) (single cone); PTB (< 37 weeks) (repeat cones); PTB (< 37 weeks) (singleton pregnancies); PTB (< 37 weeks) (multiple pregnancies); PTB (< 34 weeks); threatened PTL; pPROM; CS; instrumental delivery (ventouse/forceps); induction of labour; oxytocin use; LBW (< 2500 g); NICU admission; perinatal mortality; stillbirth | |
| Notes | 599 women underwent a conisation of the cervix (LLETZ, laser or cold knife) between 1 January 1999 and 31 December 2003 in the University Hospital in Leuven. In this group, 47 women could be identified who became pregnant after the intervention and delivered before 1 January 2007. The study concerned 72 pregnancies. Seventeen (23.6%) resulted in a miscarriage and were excluded. Finally, the treated group consisted of 55 evolutive pregnancies (delivery after 22 weeks of gestation) in 43 women. There were nine women with two and two women with three subsequent pregnancies. 2 women in the treated group had two conisations (4 pregnancies). In the control group there were 3 twin pregnancies. In the control group there was one twin pregnancy. | |
| Risk of bias | ||
| Bias | Authors' judgement | Support for judgement |
| Incomplete outcome data (attrition bias) | Unclear risk | Questionnaires were sent to 599 women to identify who of them became pregnant after the intervention. The authors do not give information about how many replied; they just write that 47 of them fell pregnant. |
| Selective reporting (reporting bias) | Low risk | No reporting bias is obvious |
| Other bias | High risk | In some outcomes the population increases and there is no description where these additional pregnancies come from (e.g. NICU admission 15/58 in the treated group vs 9/58 in the untreated group, although the treated group consists of 55 pregnancies and so does the untreated group). The use of questionnaires for the outcomes increases the risk of recall and misclassification bias. |
| Relevant assignment described? | Low risk | Yes, treatment performed on clinical grounds |
| Representative intervention group? | Unclear risk | There may be women that did not reply to the questionnaire. This information is not provided by the authors. |
| Representative comparison group? | Low risk | The untreated group was drawn from the same source as the treated group |
| Comparability of treatment groups? | Unclear risk | Matching for age (+/‐2 years), parity and year of delivery (+/‐2 years). The treated group, in comparison with the untreated group, had more sexual partners (4.6 vs 2.5) and smoked more before pregnancy (50% vs 20.4%). Differences in smoking during pregnancy, socioeconomic status and education level were not statistically significant. |
| Methods | Retrospective cohort study Comparison group: External ‐ matching for age at delivery, parity, smoking, history of gestation and HIV status Information source ‐ the electronic databases of the Gynecopathologic and Obstetrics Departments of Erasme University Hospital, Belgium | |
| Participants | Treated group ‐ 106 deliveries of 88 women who had undergone excisional treatment for CIN at the Erasme University Hospital between 1999 to 2010 and then delivered at the same hospital between 2000 to 2010 (CKC = 14; LC = 33; LLETZ = 40; unknown = 1) Untreated group ‐ 212 deliveries of 176 women who delivered at the Erasme University Hospital between 2000 to 2010 without previous excision (the first preceding and following women after each case fulfilling the matching criteria) | |
| Interventions | Excision NOC (CKC, LC, LLETZ) | |
| Outcomes | PTB (< 37 weeks); PTB (< 34 weeks); threatened PTL; pPROM; chorioamnionitis; CS; instrumental deliveries (ventouse); induction of labour; LBW (< 2500 g); NICU admission | |
| Notes | ||
| Risk of bias | ||
| Bias | Authors' judgement | Support for judgement |
| Incomplete outcome data (attrition bias) | Low risk | Information was obtained from hospital records |
| Selective reporting (reporting bias) | Low risk | No reporting bias is obvious |
| Other bias | High risk | There were inconsistencies in the numbers reported in the tables and the text |
| Relevant assignment described? | Low risk | Yes, treatment performed on clinical grounds |
| Representative intervention group? | Low risk | All eligible for the study women undergoing excisional treatment (1999 to 2010) and delivering (2000 to 2010) at a single university hospital |
| Representative comparison group? | Low risk | The untreated group was drawn from the same source as the treated group |
| Comparability of treatment groups? | Low risk | Matching for age at delivery, parity, smoking, history of gestation, HIV status |
| Methods | Retrospective cohort study Comparison group: External ‐ matching for age (+/‐ 3 years), parity and year of delivery (same year) Information source ‐ Hospital records of Karolinska Hospital in Stockholm | |
| Participants | Treated group ‐ 236 women who had undergone LA and delivered in Karolinska Hospital in Stockholm, between 1982 and 1992. Only first delivery after treatment was included. Women who had undergone previous conisation (8) or reoperation with cervical conisation before pregnancy (11) were excluded. Untreated group ‐ 472 women (2 controls for each case) without previous treatment who delivered in the same hospital during the same period. The controls were selected from the birth registry of the hospital. | |
| Interventions | LA | |
| Outcomes | PTB (< 37 weeks); PTB (< 37 weeks) (single cone); CS; APH; LBW (< 2500 g); LBW (< 2000 g); LBW (< 1500 g); LBW (< 1000 g) | |
| Notes | During the 11‐year period 1982 to 1992 a total of 1828 women underwent laser vaporization of the uterine cervix at the Department of Obstetrics and Gynaecology, Karolinska Hospital in Stockholm. Until the end of 1992, 298 of these women gave birth to at least one child after operation. 62 of them were excluded from the study because of previous conisation (8), reoperation with cervical conization before pregnancy (11) or because of incomplete data in their charts (43). The remaining 236 women were included in the treated group. | |
| Risk of bias | ||
| Bias | Authors' judgement | Support for judgement |
| Incomplete outcome data (attrition bias) | Low risk | 279 women were eligible for the study. Of these, 46 (16.5%) were excluded because of incomplete data in their charts |
| Selective reporting (reporting bias) | Low risk | No reporting bias is obvious |
| Other bias | Low risk | No other obvious source of bias |
| Relevant assignment described? | Low risk | Yes, treatment performed on clinical grounds |
| Representative intervention group? | Low risk | All eligible for the study women delivering in a single hospital between 1982 to 1992 |
| Representative comparison group? | Low risk | The untreated group was drawn from the same source as the treated group |
| Comparability of treatment groups? | Low risk | Matching for age (+/‐ 3 years), parity, year of delivery (same year) |
| Methods | Retrospective cohort study Comparison group: External ‐ matching for age Information source ‐ interview (about previous CKC, age, previous pregnancies, education, employment and smoking habits), hospital records (about current pregnancy) | |
| Participants | Treated group ‐ 44 women with CKC in the past were delivered at Fredriksberg Hospital and Rigshospitalet during March 1974 and December 1975. All pregnancies (48) of these women after CKC were included in the treated group (even if these were not the current ones). Untreated group ‐ All pregnancies (48) of the age‐matched women after the date of the CKC of the cases (even if these were not the current ones). The age‐matched women were delivered at the same hospital and had not had treatment for CIN in the past. | |
| Interventions | CKC | |
| Outcomes | LBW (<2500g) | |
| Notes | During March 1974 and December 1975, 7327 women were delivered at Fredriksberg Hospital and Rigshospitalet. At their first contact with the antenatal clinics all patients were interviewed by specially employed and trained staff. 44 stated a previous conisation. 17 of the 44 women had had one or more pregnancies between the CKC and the current pregnancy. In total, 5 different treated‐control groups were chosen and five different comparisons were described. We decided to include in our analysis only one of them (described above), in order to avoid a duplicate extraction and analysis of the same participants (patients). | |
| Risk of bias | ||
| Bias | Authors' judgement | Support for judgement |
| Incomplete outcome data (attrition bias) | Low risk | All eligible for the study women were interviewed; the information about the outcome was obtained from hospital records |
| Selective reporting (reporting bias) | Low risk | No reporting bias is obvious |
| Other bias | High risk | Interviews were used to pool information about previous CKC. There is a risk of recall bias and misclassification of exposure. |
| Relevant assignment described? | Low risk | Yes, treatment performed on clinical grounds |
| Representative intervention group? | Low risk | All eligible for the study women delivering in two hospitals during March 1974 to December 1975 |
| Representative comparison group? | Low risk | The untreated group was drawn from the same source as the treated group |
| Comparability of treatment groups? | Low risk | Matching for age |
| Methods | Retrospective cohort study Comparison groups: A) External B) Internal (pre‐treatment pregnancies) Both had regression analysis for age, parity and race Information source ‐ records of Parkland Health & Hospital System | |
| Participants | Treated group ‐ 511 women who had undergone LLETZ at the Parkland Hospital during January 1992‐May 2008 and subsequently had a pregnancy at the same hospital Untreated group ‐ A) 240,348 women who delivered at the Parkland Hospital without previous LLETZ B) Internal population of women that had pregnancies before LLETZ (n = 842) Inclusion criteria (for all groups): Only singletons were included | |
| Interventions | LLETZ | |
| Outcomes | PTB (< 37 weeks); PTB (< 37 weeks) (singleton pregnancies); sPTB (< 37 weeks); pPROM; perinatal mortality; stillbirth | |
| Notes | Perinatal mortality was defined as the addition of stillbirths and neonatal deaths up to 28 days of life | |
| Risk of bias | ||
| Bias | Authors' judgement | Support for judgement |
| Incomplete outcome data (attrition bias) | Low risk | Information was obtained from hospital records |
| Selective reporting (reporting bias) | Low risk | No reporting bias is obvious |
| Other bias | Low risk | No other obvious source of bias |
| Relevant assignment described? | Low risk | Yes, treatment performed on clinical grounds |
| Representative intervention group? | Low risk | All eligible for the study women having LLETZ and then delivering in a single hospital during January 1992 to May 2008 |
| Representative comparison group? | Low risk | A) The untreated group was drawn from the same source as the treated group B) Internal comparison group (pre‐treatment pregnancies) |
| Comparability of treatment groups? | Low risk | A) Regression analysis for age, parity and race B) Internal comparison group (pre‐treatment pregnancies) |
| Methods | Retrospective cohort study Comparison groups: A) Women with punch biopsy but no treatment B) Internal (pre‐treatment pregnancies) Both had regression analysis for parity, ethnicity and deprivation Information source ‐ the Pathology and Obstetric databases of the Whipps Cross University Hospital | |
| Participants | Treated group ‐ 261 deliveries of women who had undergone excisional treatment for CIN (LLETZ, LC, CKC) during 1995 to 2009 at the Whipps Cross University Hospital and subsequently delivered at the same hospital Untreated group ‐ A) 257 deliveries of women who had only punch biopsy before delivery B) The treated group had 181 deliveries before the treatment. These deliveries can be compared with the deliveries after the treatment Inclusion criteria (for all groups): singleton pregnancies with a gestational age of 26 to 42 weeks of gestation. Exclusion criteria: antepartum stillbirths | |
| Interventions | Excision NOS (CKC, LC, LLETZ) | |
| Outcomes | PTB (< 37 weeks); PTB (< 37 weeks) (single cone); PTB (< 37 weeks) (repeat cones); PTB (< 33 weeks); pPROM; CS; instrumental deliveries (ventouse/forceps); LBW (< 2500 g) | |
| Notes | The patients of this study are also included in the paper by Castanon and colleagues BMJ 2012. As this is a duplicate study we only included in the analysis the outcomes that were not presented in Castanon 2012. The outcomes on PTB < 37 weeks and PTB < 33 weeks were not included in the analysis. | |
| Risk of bias | ||
| Bias | Authors' judgement | Support for judgement |
| Incomplete outcome data (attrition bias) | Low risk | Information was obtained from hospital records |
| Selective reporting (reporting bias) | Low risk | No reporting bias is obvious |
| Other bias | Low risk | No other obvious source of bias |
| Relevant assignment described? | Low risk | Yes, treatment performed on clinical grounds |
| Representative intervention group? | Low risk | All eligible for the study women having treatment and delivering in a single university hospital during 1995 to 2009 |
| Representative comparison group? | Low risk | A) The untreated group was drawn from the same source as the treated group B) Internal comparison group (pre‐treatment pregnancies) |
| Comparability of treatment groups? | Low risk | A) Women with punch biopsy only B) Internal comparison group (pre‐treatment pregnancies) Both had regression analysis for parity, ethnicity and deprivation |
APH: antepartum haemorrhage; BMI: body mass index; CIN: cervical intra‐epithelial neoplasia; CKC: cold knife conisation; CS: caesarean Section; CT: cryotherapy; FCBE: Fischer cone biopsy excisor; LA: laser ablation; LBW: low birth weight; LC: laser conisation; LLETZ: large loop excision of the transformation zone; MOH: major obstetric haemorrhage;NICU: neonatal intensive care unit; NOS: not otherwise specified; PPH: Postpartum haemorrhage; pPROM: preterm premature rupture of membranes; PTB: preterm birth; PTL: preterm labour; RD: radical diathermy; sPTB: spontaneous preterm birth; TOP: termination of pregnancy
Characteristics of excluded studies [ordered by study ID]
| Study | Reason for exclusion |
| Comparison of women with CIN (+/‐treatment) versus general population. We could not include this in any comparison as we had no information as to whether women with CIN had or not treatment and the increase in the PTB could be attributed to either. | |
| No untreated comparison group | |
| No untreated comparison group | |
| No untreated comparison group | |
| No untreated comparison group | |
| No untreated comparison group | |
| Both the treated and untreated group consisted of a high‐risk population (women that conceived via assisted reproductive technology (ART)) | |
| This study reports the miscarriage rates in the treated and untreated group but none of the outcomes that we are studying | |
| No untreated comparison group | |
| No untreated comparison group | |
| This study reports the cervical length before and after LLETZ (self‐matching), but we do not study this outcome | |
| No untreated comparison group | |
| No untreated comparison group | |
| This study reports the Incidence of any pregnancy, livebirths, miscarriages, extrauterine pregnancies, molar pregnancies, and | |
| No untreated comparison group | |
| No untreated comparison group | |
| No untreated comparison group | |
| No untreated comparison group | |
| No untreated comparison group | |
| No untreated comparison group | |
| No untreated comparison group | |
| No untreated comparison group | |
| No untreated comparison group | |
| No untreated comparison group | |
| No untreated comparison group | |
| 1) Treatment during pregnancy 2) No untreated comparison group | |
| No untreated comparison group | |
| This study reports the percentage of the women that fell pregnant in the treated and untreated group but not the pregnancy outcomes | |
| No untreated comparison group | |
| No untreated comparison group | |
| No untreated comparison group | |
| The untreated comparison group was high risk: consisted only of women with a history of second‐trimester miscarriage | |
| Both treated and untreated groups consisted of a high‐risk population (women that conceived via assisted reproductive technology (ART)) | |
| No untreated comparison group | |
| No untreated comparison group (treated women with cerclage versus treated women without cerclage) | |
| This study reports the cervical length before and after LLETZ (self‐matching), but we are not studying this outcome | |
| Treatment during pregnancy | |
| No untreated comparison group | |
| 1) Treatment during pregnancy 2) No untreated comparison group | |
| No untreated comparison group (treated women with cerclage versus treated women without cerclage) | |
| Treatment during pregnancy | |
| Comparison of women with CIN (+/‐treatment) versus general population. We could not include this in any comparison as we had no information as to whether women with CIN had or not treatment and the increase in the PTB could be attributed to either. | |
| Data only on fertility | |
| No untreated comparison group | |
| Case‐control study | |
| No untreated comparison group | |
| Comparison of women with CIN (+/‐treatment) versus general population. We could not include this in any comparison as we had no information as to whether women with CIN had or not treatment and the increase in the PTB could be attributed to either. |
CIN: cervical intra‐epithelial neoplasia; LLETZ: large loop excision of the transformation zone; PTB: preterm birth
Characteristics of studies awaiting assessment [ordered by study ID]
| Methods | Retrospective cohort study |
| Participants | Women who had undergone conisation at Antwerp University Hospital and subsequently delivered + control group |
| Interventions | Conisation |
| Outcomes | Rates of adverse obstetric outcomes (such as LBW and CS) after conisation and comparison to the control group |
| Notes | Identified after April 2016, week 2; it will be included in the next version of this meta‐analysis |
| Methods | Population‐based retrospective cohort study |
| Participants | Women from whole of Norway who had undergone treatment for CIN/early invasive cervical cancer during 1998 to 2014 and subsequently had singleton pregnancy + control group |
| Interventions | Treatment for CIN/early invasive cervical cancer |
| Outcomes | Rates of adverse obstetric outcomes (such as PTB) after treatment and comparison to the control group |
| Notes | Identified after April 2016, week 2; it will be included in the next version of this meta‐analysis |
| Methods | Retrospective case‐control study |
| Participants | Women who had undergone conisation in a university hospital between January 2002 to January 2012 and subsequently delivered + control group |
| Interventions | Conisation |
| Outcomes | Rates of adverse obstetric outcomes (such as PTB < 37 weeks, PTB < 32 weeks, PTB < 28 weeks and PROM) after treatment and comparison to the control group |
| Notes | Identified after April 2016, week 2; it will be included in the next version of this meta‐analysis |
| Methods | Retrospective study |
| Participants | Women who underwent conisation from 1999 to 2005 in Peking Union Medical College Hospital |
| Interventions | Conisation |
| Outcomes | Fertility and pregnancy |
| Notes | Article in Chinese ‐ pending translation for inclusion in the next update of this meta‐analysis |
| Methods | Population‐based retrospective cohort study |
| Participants | Women from whole Slovenia who had a singleton pregnancy during 2003 to 2012 and had previously undergone CKC or LLETZ + control group |
| Interventions | CKC, LLETZ |
| Outcomes | Rates of adverse obstetric outcomes (sPTB < 37 weeks, < 34 weeks, < 32 weeks, < 28 weeks) after treatment and comparison to the control group |
| Notes | Identified after April 2016, week 2; it will be included in the next version of this meta‐analysis |
| Methods | Retrospective study |
| Participants | Women who underwent conisation from 1967 to 1989 |
| Interventions | Conisation |
| Outcomes | Percentage of attested postoperative pregnancies |
| Notes | Article in Italian ‐ pending translation for inclusion in the next update of this meta‐analysis |
| Methods | Retrospective |
| Participants | Women with previously made conisation of the uterine cervix |
| Interventions | Conisation |
| Outcomes | Term, deliveries, preterm deliveries and spontaneous abortions |
| Notes | Article in Yogoslavian ‐ pending translation for inclusion in the next update of this meta‐analysis |
| Methods | |
| Participants | |
| Interventions | |
| Outcomes | |
| Notes | Article in Norwegian ‐ pending translation for inclusion in the next update of this meta‐analysis |
| Methods | |
| Participants | |
| Interventions | |
| Outcomes | |
| Notes | Article in Danish ‐ pending translation for inclusion in the next update of this meta‐analysis |
| Methods | Retrospective study |
| Participants | Women followed at our colpolaparotomy surgery clinic |
| Interventions | Laser CO2 therapy |
| Outcomes | Pregnancy and delivery |
| Notes | Article in French ‐ pending translation for inclusion in the next update of this meta‐analysis |
| Methods | Population‐based multicentric trial |
| Participants | Turkish women with singleton pregnancy during 2007 to 2013 who had previously undergone CKC + control group |
| Interventions | CKC |
| Outcomes | Rates of PTB after CKC and comparison to the control group; data about removed volume and height of the removed cone and correlation to PTB |
| Notes | Identified after April 2016, week 2; it will be included in the next version of this meta‐analysis |
| Methods | Retrospective cohort study |
| Participants | Women treated at the Leon Hospital in Spain, between 1999 and 2007 |
| Interventions | Conisation |
| Outcomes | Conception and pregnancy |
| Notes | Article in Spanish ‐ pending translation for inclusion in the next update of this meta‐analysis |
CIN: cervical intra‐epithelial neoplasia; CKC: cold knife conisation; CS: caesarean section; LBW: low birth weight; LLETZ: large loop excision of the transformation zone; PTB: preterm birth; sPTB: spontaneous preterm birth.
Data and analyses
| Outcome or subgroup title | No. of studies | No. of participants | Statistical method | Effect size |
| 1 PTB (<37w) Show forest plot | 59 | 5.242917E6 | Risk Ratio (IV, Random, 95% CI) | 1.75 [1.57, 1.96] |
| Analysis 1.1 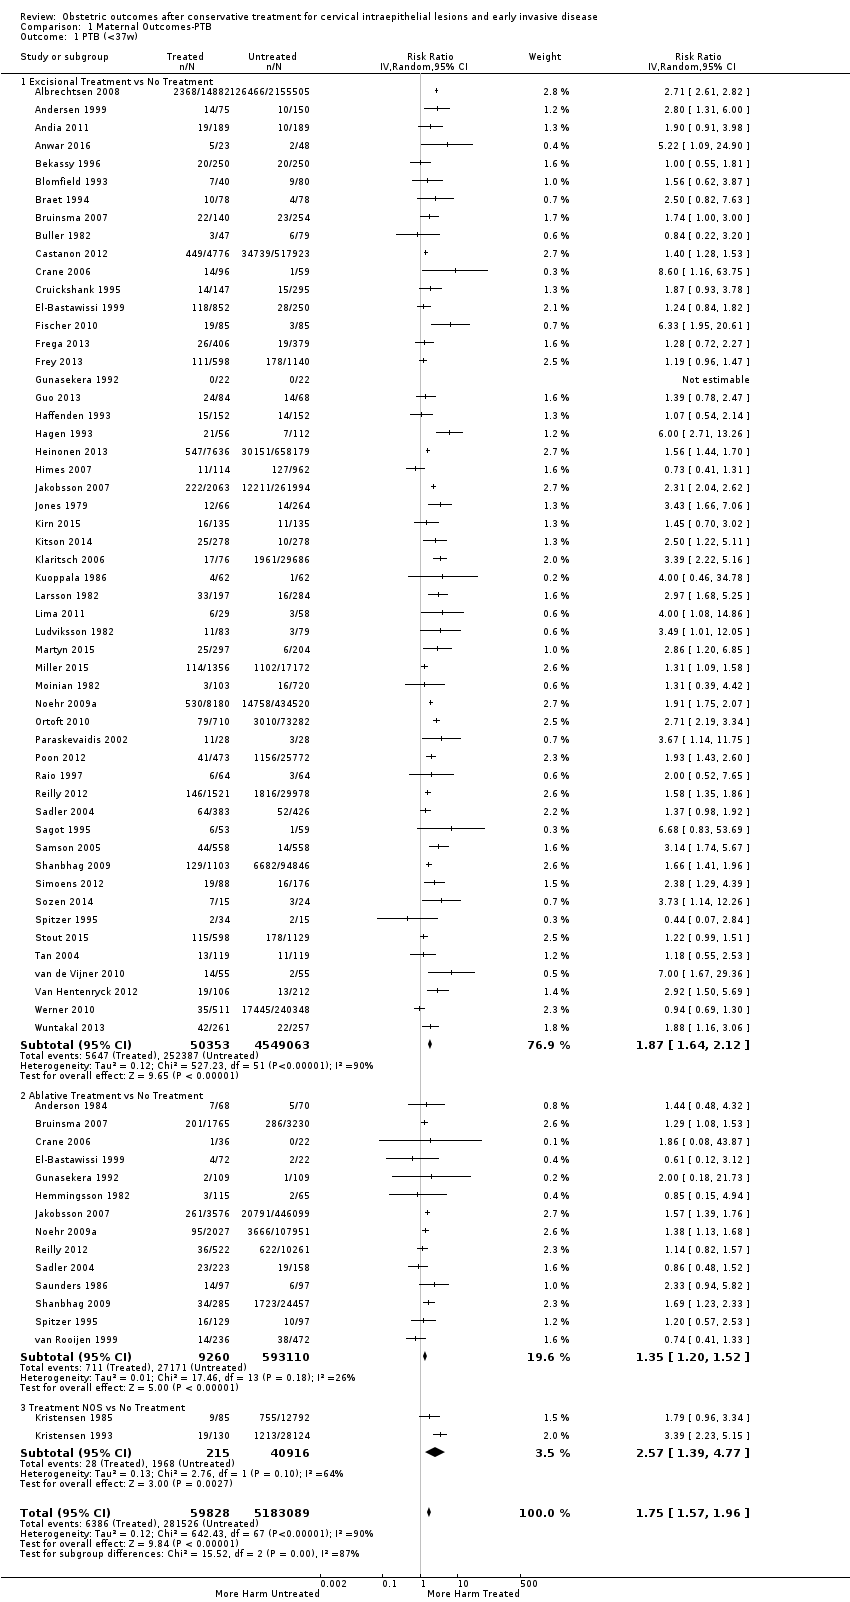 Comparison 1 Maternal Outcomes‐PTB, Outcome 1 PTB (<37w). | ||||
| 1.1 Excisional Treatment vs No Treatment | 53 | 4.599416E6 | Risk Ratio (IV, Random, 95% CI) | 1.87 [1.64, 2.12] |
| 1.2 Ablative Treatment vs No Treatment | 14 | 602370 | Risk Ratio (IV, Random, 95% CI) | 1.35 [1.20, 1.52] |
| 1.3 Treatment NOS vs No Treatment | 2 | 41131 | Risk Ratio (IV, Random, 95% CI) | 2.57 [1.39, 4.77] |
| 2 PTB (<37w)‐Analysis by treatment modality Show forest plot | 59 | 5.242917E6 | Risk Ratio (IV, Random, 95% CI) | 1.78 [1.60, 1.98] |
| Analysis 1.2  Comparison 1 Maternal Outcomes‐PTB, Outcome 2 PTB (<37w)‐Analysis by treatment modality. | ||||
| 2.1 CKC vs No Treatment | 12 | 39102 | Risk Ratio (IV, Random, 95% CI) | 2.70 [2.14, 3.40] |
| 2.2 LC vs No Treatment | 9 | 1509 | Risk Ratio (IV, Random, 95% CI) | 2.11 [1.26, 3.54] |
| 2.3 NETZ vs No Treatment | 1 | 7399 | Risk Ratio (IV, Random, 95% CI) | 5.83 [3.80, 8.95] |
| 2.4 LLETZ vs No Treatment | 25 | 1.445104E6 | Risk Ratio (IV, Random, 95% CI) | 1.58 [1.37, 1.81] |
| 2.5 FCBE vs No Treatment | 1 | 71 | Risk Ratio (IV, Random, 95% CI) | 5.22 [1.09, 24.90] |
| 2.6 LA vs No Treatment | 7 | 4710 | Risk Ratio (IV, Random, 95% CI) | 1.04 [0.86, 1.26] |
| 2.7 CT vs No Treatment | 2 | 238 | Risk Ratio (IV, Random, 95% CI) | 1.02 [0.22, 4.77] |
| 2.8 RD vs No Treatment | 1 | 2150 | Risk Ratio (IV, Random, 95% CI) | 1.62 [1.27, 2.06] |
| 2.9 Excisional Treatment NOS vs No Treatment | 15 | 3.106231E6 | Risk Ratio (IV, Random, 95% CI) | 1.90 [1.50, 2.41] |
| 2.10 Ablative Treatment NOS vs No Treatment | 5 | 595272 | Risk Ratio (IV, Random, 95% CI) | 1.46 [1.27, 1.66] |
| 2.11 Treatment NOS vs No Treatment | 2 | 41131 | Risk Ratio (IV, Random, 95% CI) | 2.57 [1.39, 4.77] |
| 3 PTB (<32‐34w) Show forest plot | 24 | 3.793874E6 | Risk Ratio (IV, Random, 95% CI) | 2.25 [1.79, 2.82] |
| Analysis 1.3 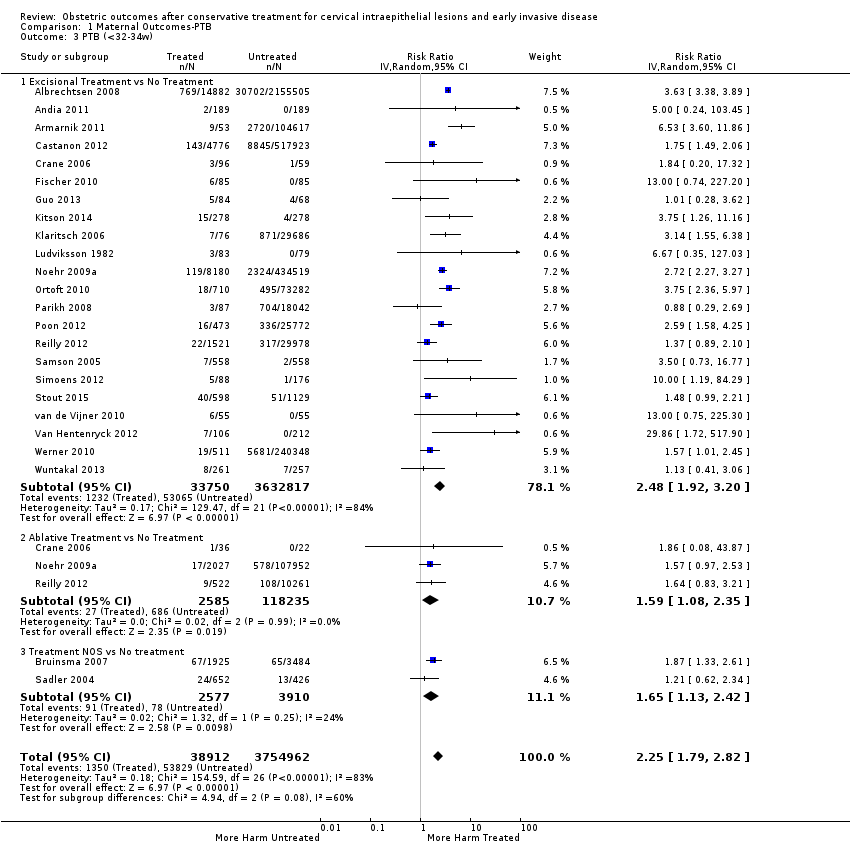 Comparison 1 Maternal Outcomes‐PTB, Outcome 3 PTB (<32‐34w). | ||||
| 3.1 Excisional Treatment vs No Treatment | 22 | 3.666567E6 | Risk Ratio (IV, Random, 95% CI) | 2.48 [1.92, 3.20] |
| 3.2 Ablative Treatment vs No Treatment | 3 | 120820 | Risk Ratio (IV, Random, 95% CI) | 1.59 [1.08, 2.35] |
| 3.3 Treatment NOS vs No treatment | 2 | 6487 | Risk Ratio (IV, Random, 95% CI) | 1.65 [1.13, 2.42] |
| 4 PTB (<32‐34w)‐Analysis by treatment modality Show forest plot | 24 | 3.793874E6 | Risk Ratio (IV, Random, 95% CI) | 2.35 [1.88, 2.95] |
| Analysis 1.4  Comparison 1 Maternal Outcomes‐PTB, Outcome 4 PTB (<32‐34w)‐Analysis by treatment modality. | ||||
| 4.1 CKC vs No Treatment | 5 | 36979 | Risk Ratio (IV, Random, 95% CI) | 3.07 [1.72, 5.49] |
| 4.2 NETZ vs No Treatment | 1 | 7399 | Risk Ratio (IV, Random, 95% CI) | 10.53 [4.33, 25.65] |
| 4.3 LLETZ vs No Treatment | 11 | 791554 | Risk Ratio (IV, Random, 95% CI) | 2.13 [1.66, 2.75] |
| 4.4 CT vs No Treatment | 1 | 58 | Risk Ratio (IV, Random, 95% CI) | 1.86 [0.08, 43.87] |
| 4.5 Excisional Treatment NOS vs No Treatment | 9 | 2.830635E6 | Risk Ratio (IV, Random, 95% CI) | 2.94 [1.82, 4.77] |
| 4.6 Ablative Treatment NOS vs No Treatment | 2 | 120762 | Risk Ratio (IV, Random, 95% CI) | 1.59 [1.08, 2.35] |
| 4.7 Treatment NOS vs No treatment | 2 | 6487 | Risk Ratio (IV, Random, 95% CI) | 1.65 [1.13, 2.42] |
| 5 PTB (<28‐30w) Show forest plot | 8 | 3.910629E6 | Risk Ratio (IV, Random, 95% CI) | 2.23 [1.55, 3.22] |
| Analysis 1.5 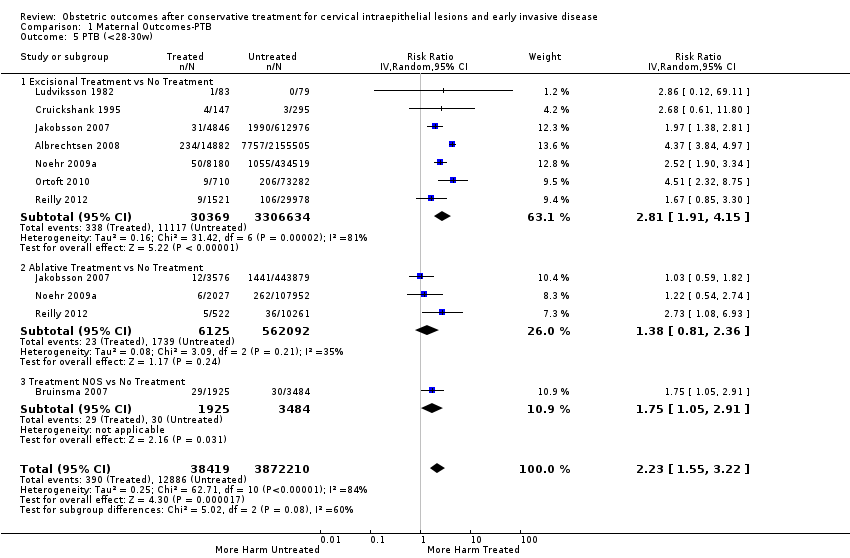 Comparison 1 Maternal Outcomes‐PTB, Outcome 5 PTB (<28‐30w). | ||||
| 5.1 Excisional Treatment vs No Treatment | 7 | 3.337003E6 | Risk Ratio (IV, Random, 95% CI) | 2.81 [1.91, 4.15] |
| 5.2 Ablative Treatment vs No Treatment | 3 | 568217 | Risk Ratio (IV, Random, 95% CI) | 1.38 [0.81, 2.36] |
| 5.3 Treatment NOS vs No Treatment | 1 | 5409 | Risk Ratio (IV, Random, 95% CI) | 1.75 [1.05, 2.91] |
| 6 PTB (<28‐30w)‐Analysis by treatment modality Show forest plot | 8 | 3.910629E6 | Risk Ratio (IV, Random, 95% CI) | 2.43 [1.69, 3.49] |
| Analysis 1.6 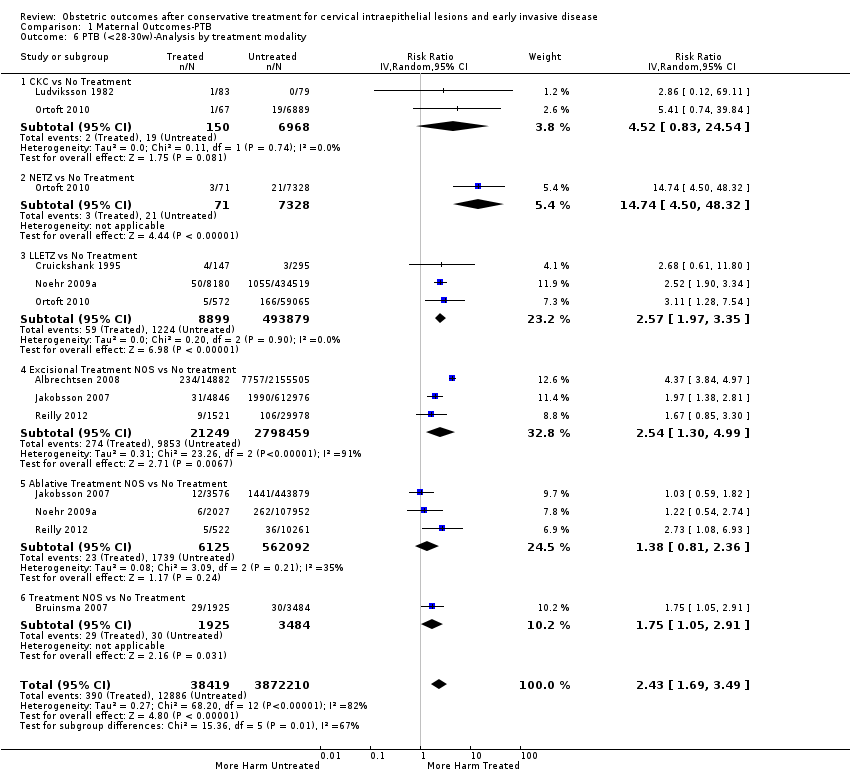 Comparison 1 Maternal Outcomes‐PTB, Outcome 6 PTB (<28‐30w)‐Analysis by treatment modality. | ||||
| 6.1 CKC vs No Treatment | 2 | 7118 | Risk Ratio (IV, Random, 95% CI) | 4.52 [0.83, 24.54] |
| 6.2 NETZ vs No Treatment | 1 | 7399 | Risk Ratio (IV, Random, 95% CI) | 14.74 [4.50, 48.32] |
| 6.3 LLETZ vs No Treatment | 3 | 502778 | Risk Ratio (IV, Random, 95% CI) | 2.57 [1.97, 3.35] |
| 6.4 Excisional Treatment NOS vs No treatment | 3 | 2.819708E6 | Risk Ratio (IV, Random, 95% CI) | 2.54 [1.30, 4.99] |
| 6.5 Ablative Treatment NOS vs No Treatment | 3 | 568217 | Risk Ratio (IV, Random, 95% CI) | 1.38 [0.81, 2.36] |
| 6.6 Treatment NOS vs No Treatment | 1 | 5409 | Risk Ratio (IV, Random, 95% CI) | 1.75 [1.05, 2.91] |
| 7 PTB (≤34w) Show forest plot | 15 | 424567 | Risk Ratio (IV, Random, 95% CI) | 2.59 [1.78, 3.77] |
| Analysis 1.7  Comparison 1 Maternal Outcomes‐PTB, Outcome 7 PTB (≤34w). | ||||
| 7.1 Excisional Treatment vs No Treatment | 15 | 424509 | Risk Ratio (IV, Random, 95% CI) | 2.61 [1.78, 3.83] |
| 7.2 Ablative Treatment vs No Treatment | 1 | 58 | Risk Ratio (IV, Random, 95% CI) | 1.86 [0.08, 43.87] |
| 8 PTB (≤34w)‐Analysis by treatment modality Show forest plot | 15 | 424567 | Risk Ratio (IV, Random, 95% CI) | 2.56 [1.78, 3.69] |
| Analysis 1.8  Comparison 1 Maternal Outcomes‐PTB, Outcome 8 PTB (≤34w)‐Analysis by treatment modality. | ||||
| 8.1 CKC vs No Treatment | 4 | 30023 | Risk Ratio (IV, Random, 95% CI) | 2.85 [1.50, 5.41] |
| 8.2 LLETZ vs No Treatment | 9 | 289218 | Risk Ratio (IV, Random, 95% CI) | 1.83 [1.41, 2.39] |
| 8.3 CT vs No Treatment | 1 | 58 | Risk Ratio (IV, Random, 95% CI) | 1.86 [0.08, 43.87] |
| 8.4 Excisional Treatment NOS vs No Treatment | 4 | 105268 | Risk Ratio (IV, Random, 95% CI) | 7.30 [4.17, 12.80] |
| 9 PTB (<32‐33w) Show forest plot | 10 | 3.369685E6 | Risk Ratio (IV, Random, 95% CI) | 2.08 [1.55, 2.79] |
| Analysis 1.9 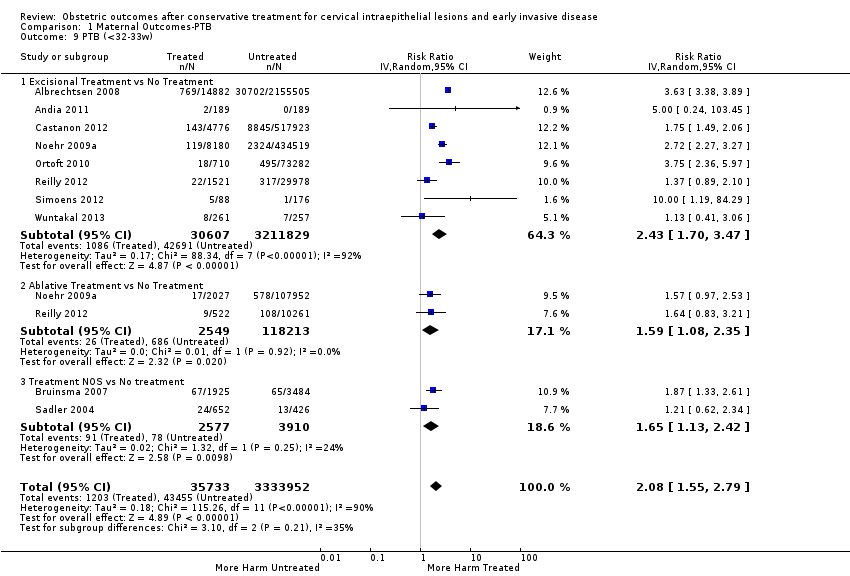 Comparison 1 Maternal Outcomes‐PTB, Outcome 9 PTB (<32‐33w). | ||||
| 9.1 Excisional Treatment vs No Treatment | 8 | 3.242436E6 | Risk Ratio (IV, Random, 95% CI) | 2.43 [1.70, 3.47] |
| 9.2 Ablative Treatment vs No Treatment | 2 | 120762 | Risk Ratio (IV, Random, 95% CI) | 1.59 [1.08, 2.35] |
| 9.3 Treatment NOS vs No treatment | 2 | 6487 | Risk Ratio (IV, Random, 95% CI) | 1.65 [1.13, 2.42] |
| 10 PTB (<32‐33w)‐Analysis by treatment modality Show forest plot | 10 | 3.369685E6 | Risk Ratio (IV, Random, 95% CI) | 2.26 [1.70, 3.01] |
| Analysis 1.10  Comparison 1 Maternal Outcomes‐PTB, Outcome 10 PTB (<32‐33w)‐Analysis by treatment modality. | ||||
| 10.1 CKC vs No Treatment | 1 | 6956 | Risk Ratio (IV, Random, 95% CI) | 4.38 [1.08, 17.65] |
| 10.2 NETZ vs No Treatment | 1 | 7399 | Risk Ratio (IV, Random, 95% CI) | 10.53 [4.33, 25.65] |
| 10.3 LLETZ vs No Treatment | 3 | 502714 | Risk Ratio (IV, Random, 95% CI) | 2.74 [2.30, 3.26] |
| 10.4 Excisional Treatment NOS vs No Treatment | 5 | 2.725367E6 | Risk Ratio (IV, Random, 95% CI) | 2.09 [1.20, 3.63] |
| 10.5 Ablative Treatment NOS vs No Treatment | 2 | 120762 | Risk Ratio (IV, Random, 95% CI) | 1.59 [1.08, 2.35] |
| 10.6 Treatment NOS vs No treatment | 2 | 6487 | Risk Ratio (IV, Random, 95% CI) | 1.65 [1.13, 2.42] |
| 11 PTB (<30w) Show forest plot | 1 | 162 | Risk Ratio (IV, Random, 95% CI) | 2.86 [0.12, 69.11] |
| Analysis 1.11 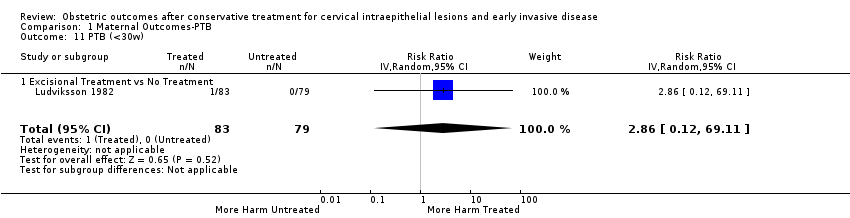 Comparison 1 Maternal Outcomes‐PTB, Outcome 11 PTB (<30w). | ||||
| 11.1 Excisional Treatment vs No Treatment | 1 | 162 | Risk Ratio (IV, Random, 95% CI) | 2.86 [0.12, 69.11] |
| 12 PTB (<30w)‐Analysis by treatment modality Show forest plot | 1 | 162 | Risk Ratio (IV, Random, 95% CI) | 2.86 [0.12, 69.11] |
| Analysis 1.12  Comparison 1 Maternal Outcomes‐PTB, Outcome 12 PTB (<30w)‐Analysis by treatment modality. | ||||
| 12.1 CKC vs No Treatment | 1 | 162 | Risk Ratio (IV, Random, 95% CI) | 2.86 [0.12, 69.11] |
| 13 PTB (<28w) Show forest plot | 7 | 3.910467E6 | Risk Ratio (IV, Random, 95% CI) | 2.22 [1.54, 3.22] |
| Analysis 1.13 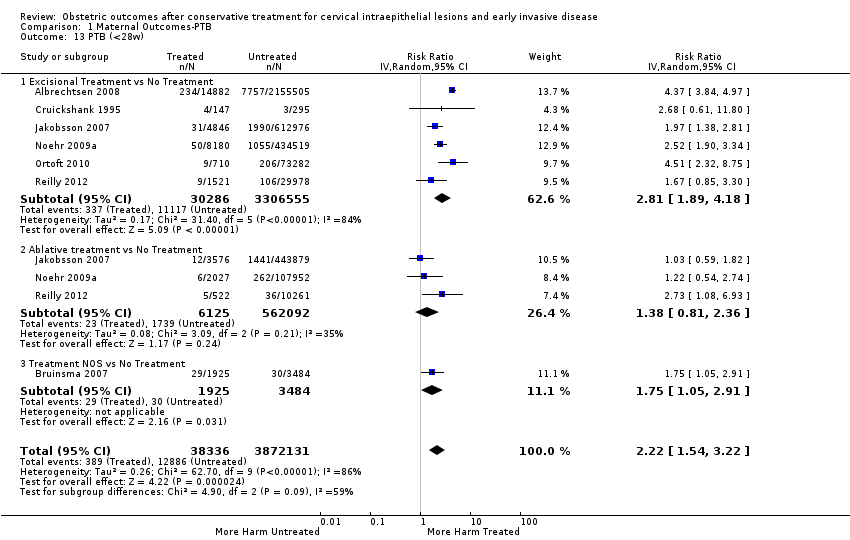 Comparison 1 Maternal Outcomes‐PTB, Outcome 13 PTB (<28w). | ||||
| 13.1 Excisional Treatment vs No Treatment | 6 | 3.336841E6 | Risk Ratio (IV, Random, 95% CI) | 2.81 [1.89, 4.18] |
| 13.2 Ablative treatment vs No Treatment | 3 | 568217 | Risk Ratio (IV, Random, 95% CI) | 1.38 [0.81, 2.36] |
| 13.3 Treatment NOS vs No Treatment | 1 | 5409 | Risk Ratio (IV, Random, 95% CI) | 1.75 [1.05, 2.91] |
| 14 PTB (<28w)‐Analysis by treatment modality Show forest plot | 6 | 3.905058E6 | Risk Ratio (IV, Random, 95% CI) | 2.52 [1.71, 3.72] |
| Analysis 1.14 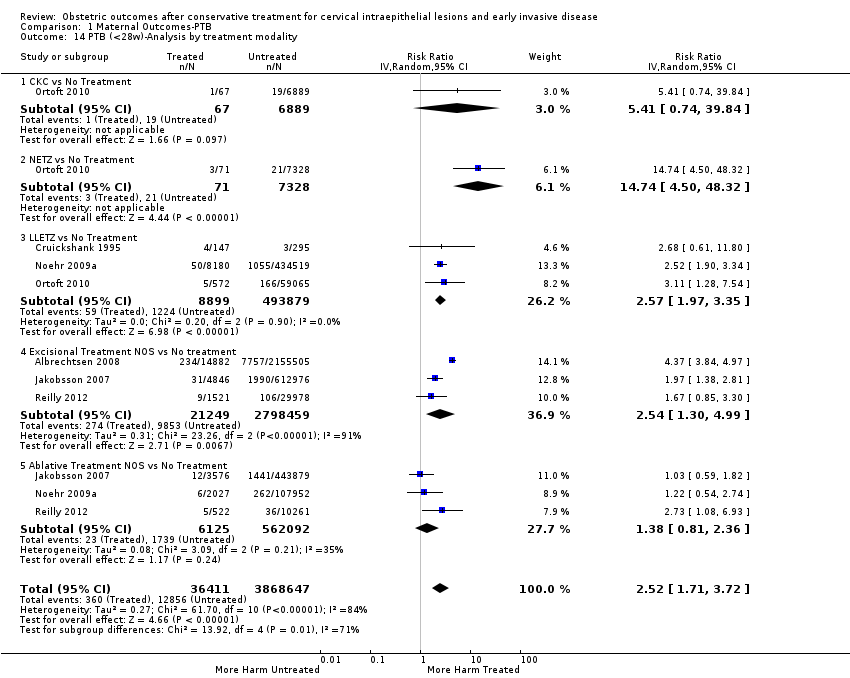 Comparison 1 Maternal Outcomes‐PTB, Outcome 14 PTB (<28w)‐Analysis by treatment modality. | ||||
| 14.1 CKC vs No Treatment | 1 | 6956 | Risk Ratio (IV, Random, 95% CI) | 5.41 [0.74, 39.84] |
| 14.2 NETZ vs No Treatment | 1 | 7399 | Risk Ratio (IV, Random, 95% CI) | 14.74 [4.50, 48.32] |
| 14.3 LLETZ vs No Treatment | 3 | 502778 | Risk Ratio (IV, Random, 95% CI) | 2.57 [1.97, 3.35] |
| 14.4 Excisional Treatment NOS vs No treatment | 3 | 2.819708E6 | Risk Ratio (IV, Random, 95% CI) | 2.54 [1.30, 4.99] |
| 14.5 Ablative Treatment NOS vs No Treatment | 3 | 568217 | Risk Ratio (IV, Random, 95% CI) | 1.38 [0.81, 2.36] |
| 15 PTB (<37w)‐Nulliparous women Show forest plot | 6 | 245707 | Risk Ratio (IV, Random, 95% CI) | 1.92 [1.23, 2.98] |
| Analysis 1.15 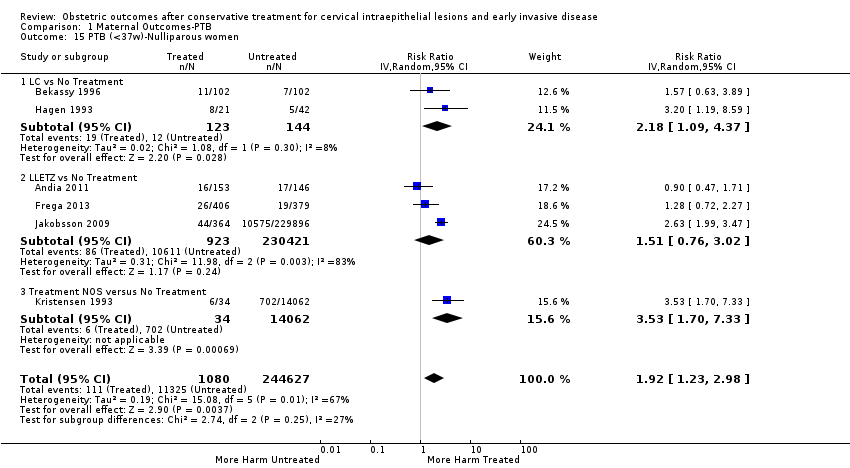 Comparison 1 Maternal Outcomes‐PTB, Outcome 15 PTB (<37w)‐Nulliparous women. | ||||
| 15.1 LC vs No Treatment | 2 | 267 | Risk Ratio (IV, Random, 95% CI) | 2.18 [1.09, 4.37] |
| 15.2 LLETZ vs No Treatment | 3 | 231344 | Risk Ratio (IV, Random, 95% CI) | 1.51 [0.76, 3.02] |
| 15.3 Treatment NOS versus No Treatment | 1 | 14096 | Risk Ratio (IV, Random, 95% CI) | 3.53 [1.70, 7.33] |
| 16 PTB (<37w)‐Parous women Show forest plot | 5 | 339507 | Risk Ratio (IV, Random, 95% CI) | 2.05 [0.95, 4.43] |
| Analysis 1.16  Comparison 1 Maternal Outcomes‐PTB, Outcome 16 PTB (<37w)‐Parous women. | ||||
| 16.1 LC vs No Treatment | 2 | 401 | Risk Ratio (IV, Random, 95% CI) | 2.82 [0.16, 49.84] |
| 16.2 LLETZ vs No Treatment | 2 | 324948 | Risk Ratio (IV, Random, 95% CI) | 1.20 [0.22, 6.65] |
| 16.3 Treatment NOS vs No Treatment | 1 | 14158 | Risk Ratio (IV, Random, 95% CI) | 3.73 [2.23, 6.22] |
| 17 PTB (<37w)‐Single cone Show forest plot | 17 | 1.367023E6 | Risk Ratio (IV, Random, 95% CI) | 1.75 [1.49, 2.06] |
| Analysis 1.17  Comparison 1 Maternal Outcomes‐PTB, Outcome 17 PTB (<37w)‐Single cone. | ||||
| 17.1 CKC vs No Treatment | 3 | 36783 | Risk Ratio (IV, Random, 95% CI) | 2.89 [2.08, 4.03] |
| 17.2 LC vs No Treatment | 2 | 657 | Risk Ratio (IV, Random, 95% CI) | 1.06 [0.54, 2.09] |
| 17.3 NETZ vs No Treatment | 1 | 7399 | Risk Ratio (IV, Random, 95% CI) | 5.83 [3.80, 8.95] |
| 17.4 LLETZ vs No Treatment | 9 | 1.277874E6 | Risk Ratio (IV, Random, 95% CI) | 1.74 [1.45, 2.10] |
| 17.5 LA vs No Treatment | 4 | 1421 | Risk Ratio (IV, Random, 95% CI) | 1.07 [0.66, 1.74] |
| 17.6 Excisional Treatment NOS vs No Treatment | 3 | 32106 | Risk Ratio (IV, Random, 95% CI) | 1.88 [1.20, 2.93] |
| 17.7 Ablative Treatment NOS vs No Treatment | 1 | 10783 | Risk Ratio (IV, Random, 95% CI) | 1.14 [0.82, 1.57] |
| 18 PTB (<37w)‐Repeat cones Show forest plot | 11 | 1.317284E6 | Risk Ratio (IV, Random, 95% CI) | 3.78 [2.65, 5.39] |
| Analysis 1.18  Comparison 1 Maternal Outcomes‐PTB, Outcome 18 PTB (<37w)‐Repeat cones. | ||||
| 18.1 CKC/LA vs No Treatment | 1 | 99 | Risk Ratio (IV, Random, 95% CI) | 12.56 [5.11, 30.87] |
| 18.2 LC/LC vs No Treatment | 1 | 270 | Risk Ratio (IV, Random, 95% CI) | 3.75 [1.70, 8.27] |
| 18.3 LLETZ/LLETZ vs No Treatment | 4 | 1.202174E6 | Risk Ratio (IV, Random, 95% CI) | 2.81 [2.33, 3.39] |
| 18.4 LLETZ/Treatment NOS vs No Treatment | 1 | 298 | Risk Ratio (IV, Random, 95% CI) | 9.40 [3.53, 25.03] |
| 18.5 Excisional Treatment NOS/Excisional Treatment NOS vs No Treatment | 3 | 73651 | Risk Ratio (IV, Random, 95% CI) | 5.48 [2.68, 11.24] |
| 18.6 Treatment NOS/Treatment NOS vs No Treatment | 2 | 40792 | Risk Ratio (IV, Random, 95% CI) | 1.71 [1.10, 2.67] |
| 19 PTB (<37w)‐Singleton pregnancies Show forest plot | 32 | 2.18962E6 | Risk Ratio (IV, Random, 95% CI) | 1.76 [1.57, 1.98] |
| Analysis 1.19  Comparison 1 Maternal Outcomes‐PTB, Outcome 19 PTB (<37w)‐Singleton pregnancies. | ||||
| 19.1 CKC vs No Treatment | 6 | 37759 | Risk Ratio (IV, Random, 95% CI) | 2.89 [2.22, 3.77] |
| 19.2 LC vs No Treatment | 4 | 545 | Risk Ratio (IV, Random, 95% CI) | 2.54 [1.24, 5.20] |
| 19.3 NETZ vs No Treatment | 1 | 7399 | Risk Ratio (IV, Random, 95% CI) | 5.83 [3.80, 8.95] |
| 19.4 LLETZ vs No Treatment | 18 | 1.444175E6 | Risk Ratio (IV, Random, 95% CI) | 1.61 [1.39, 1.87] |
| 19.5 LA vs No Treatment | 3 | 3420 | Risk Ratio (IV, Random, 95% CI) | 1.10 [0.75, 1.62] |
| 19.6 CT vs No Treatment | 1 | 58 | Risk Ratio (IV, Random, 95% CI) | 1.86 [0.08, 43.87] |
| 19.7 RD vs No Treatment | 1 | 2150 | Risk Ratio (IV, Random, 95% CI) | 1.62 [1.27, 2.06] |
| 19.8 Excisional Treatment NOS vs No Treatment | 7 | 542892 | Risk Ratio (IV, Random, 95% CI) | 1.42 [1.17, 1.72] |
| 19.9 Ablative Treatment NOS vs No Treatment | 2 | 110091 | Risk Ratio (IV, Random, 95% CI) | 1.14 [0.56, 2.32] |
| 19.10 Treatment NOS vs No Treatment | 2 | 41131 | Risk Ratio (IV, Random, 95% CI) | 2.57 [1.39, 4.77] |
| 20 PTB (<37w)‐Multiple pregnancies Show forest plot | 5 | 10797 | Risk Ratio (IV, Random, 95% CI) | 1.14 [0.95, 1.35] |
| Analysis 1.20 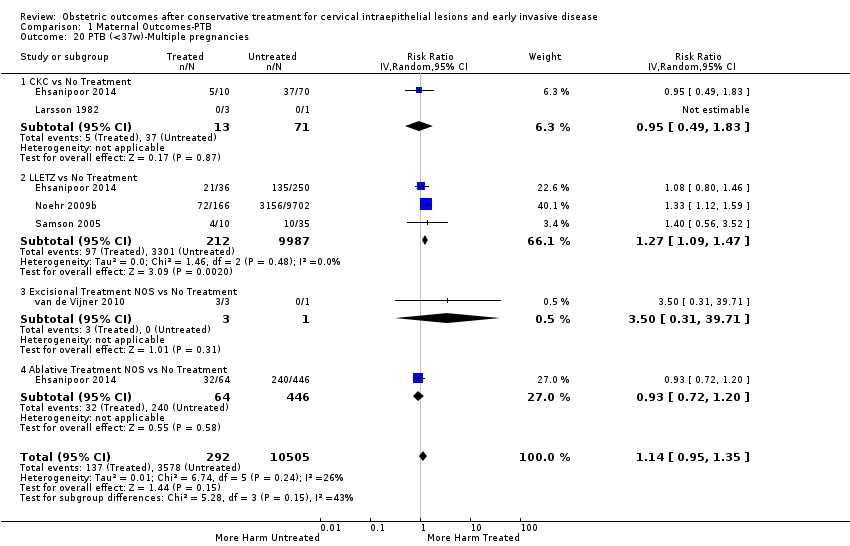 Comparison 1 Maternal Outcomes‐PTB, Outcome 20 PTB (<37w)‐Multiple pregnancies. | ||||
| 20.1 CKC vs No Treatment | 2 | 84 | Risk Ratio (IV, Random, 95% CI) | 0.95 [0.49, 1.83] |
| 20.2 LLETZ vs No Treatment | 3 | 10199 | Risk Ratio (IV, Random, 95% CI) | 1.27 [1.09, 1.47] |
| 20.3 Excisional Treatment NOS vs No Treatment | 1 | 4 | Risk Ratio (IV, Random, 95% CI) | 3.5 [0.31, 39.71] |
| 20.4 Ablative Treatment NOS vs No Treatment | 1 | 510 | Risk Ratio (IV, Random, 95% CI) | 0.93 [0.72, 1.20] |
| 21 PTB (<32‐34w)‐Multiple pregnancies Show forest plot | 3 | 10789 | Risk Ratio (IV, Random, 95% CI) | 1.68 [0.95, 2.98] |
| Analysis 1.21  Comparison 1 Maternal Outcomes‐PTB, Outcome 21 PTB (<32‐34w)‐Multiple pregnancies. | ||||
| 21.1 CKC vs No Treatment | 1 | 80 | Risk Ratio (IV, Random, 95% CI) | 3.5 [1.29, 9.52] |
| 21.2 LLETZ vs No Treatment | 3 | 10199 | Risk Ratio (IV, Random, 95% CI) | 1.76 [0.88, 3.50] |
| 21.3 Ablative Treatment NOS vs No Treatment | 1 | 510 | Risk Ratio (IV, Random, 95% CI) | 0.85 [0.38, 1.91] |
| 22 PTB (<28w)‐Multiple pregnancies Show forest plot | 2 | 10744 | Risk Ratio (IV, Random, 95% CI) | 2.43 [1.40, 4.22] |
| Analysis 1.22  Comparison 1 Maternal Outcomes‐PTB, Outcome 22 PTB (<28w)‐Multiple pregnancies. | ||||
| 22.1 CKC vs No Treatment | 1 | 80 | Risk Ratio (IV, Random, 95% CI) | 2.15 [0.09, 49.56] |
| 22.2 LLETZ vs No Treatment | 2 | 10154 | Risk Ratio (IV, Random, 95% CI) | 2.45 [1.34, 4.47] |
| 22.3 Ablative Treatment NOS vs No Treatment | 1 | 510 | Risk Ratio (IV, Random, 95% CI) | 2.32 [0.48, 11.26] |
| 23 PTB (<37w)‐Depth≤10‐12mm Show forest plot | 8 | 550929 | Risk Ratio (IV, Random, 95% CI) | 1.54 [1.09, 2.18] |
| Analysis 1.23  Comparison 1 Maternal Outcomes‐PTB, Outcome 23 PTB (<37w)‐Depth≤10‐12mm. | ||||
| 23.1 LC vs No Treatment | 1 | 105 | Risk Ratio (IV, Random, 95% CI) | 0.52 [0.06, 4.83] |
| 23.2 LLETZ vs No Treatment | 3 | 544907 | Risk Ratio (IV, Random, 95% CI) | 2.01 [1.28, 3.15] |
| 23.3 Excisional Treatment NOS vs No Treatment | 4 | 5917 | Risk Ratio (IV, Random, 95% CI) | 1.20 [0.78, 1.85] |
| 24 PTB (<37w)‐Depth≥10‐12mm Show forest plot | 8 | 552711 | Risk Ratio (IV, Random, 95% CI) | 1.93 [1.62, 2.31] |
| Analysis 1.24  Comparison 1 Maternal Outcomes‐PTB, Outcome 24 PTB (<37w)‐Depth≥10‐12mm. | ||||
| 24.1 LC vs No Treatment | 1 | 87 | Risk Ratio (IV, Random, 95% CI) | 4.64 [1.20, 17.88] |
| 24.2 LLETZ vs No Treatment | 3 | 546134 | Risk Ratio (IV, Random, 95% CI) | 2.29 [1.57, 3.34] |
| 24.3 Excisional Treatment NOS vs No Treatment | 4 | 6490 | Risk Ratio (IV, Random, 95% CI) | 1.68 [1.41, 1.99] |
| 25 PTB (<37w)‐Depth≥15‐17mm Show forest plot | 4 | 544986 | Risk Ratio (IV, Random, 95% CI) | 2.77 [1.95, 3.93] |
| Analysis 1.25  Comparison 1 Maternal Outcomes‐PTB, Outcome 25 PTB (<37w)‐Depth≥15‐17mm. | ||||
| 25.1 LC vs No Treatment | 1 | 211 | Risk Ratio (IV, Random, 95% CI) | 4.92 [2.09, 11.59] |
| 25.2 LLETZ vs No Treatment | 2 | 544248 | Risk Ratio (IV, Random, 95% CI) | 3.16 [1.54, 6.48] |
| 25.3 Excisional Treatment NOS vs No Treatment | 1 | 527 | Risk Ratio (IV, Random, 95% CI) | 2.03 [1.33, 3.10] |
| 26 PTB (<37w)‐Depth≥20mm Show forest plot | 3 | 543750 | Risk Ratio (IV, Random, 95% CI) | 4.91 [2.06, 11.68] |
| Analysis 1.26  Comparison 1 Maternal Outcomes‐PTB, Outcome 26 PTB (<37w)‐Depth≥20mm. | ||||
| 26.1 LC vs No Treatment | 1 | 192 | Risk Ratio (IV, Random, 95% CI) | 6.12 [2.57, 14.57] |
| 26.2 LLETZ vs No Treatment | 2 | 543558 | Risk Ratio (IV, Random, 95% CI) | 4.72 [1.25, 17.80] |
| 27 PTB (<37w)‐Volume<6cc Show forest plot | 1 | 550 | Risk Ratio (IV, Random, 95% CI) | 2.25 [1.09, 4.66] |
| Analysis 1.27  Comparison 1 Maternal Outcomes‐PTB, Outcome 27 PTB (<37w)‐Volume<6cc. | ||||
| 27.1 LLETZ vs No Treatment | 1 | 550 | Risk Ratio (IV, Random, 95% CI) | 2.25 [1.09, 4.66] |
| 28 PTB (<37w)‐Volume>6cc Show forest plot | 1 | 284 | Risk Ratio (IV, Random, 95% CI) | 13.90 [5.09, 37.98] |
| Analysis 1.28 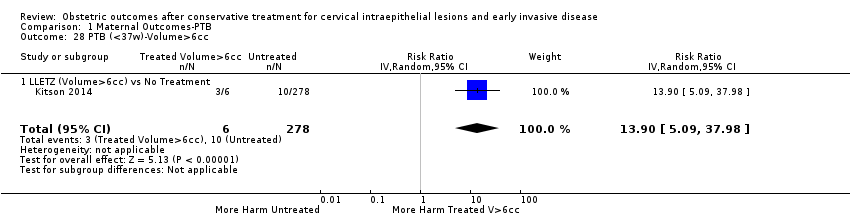 Comparison 1 Maternal Outcomes‐PTB, Outcome 28 PTB (<37w)‐Volume>6cc. | ||||
| 28.1 LLETZ (Volume>6cc) vs No Treatment | 1 | 284 | Risk Ratio (IV, Random, 95% CI) | 13.90 [5.09, 37.98] |
| 29 PTB (<37w)‐Depth≤10mm Show forest plot | 7 | 7436 | Risk Ratio (IV, Random, 95% CI) | 1.60 [0.99, 2.59] |
| Analysis 1.29 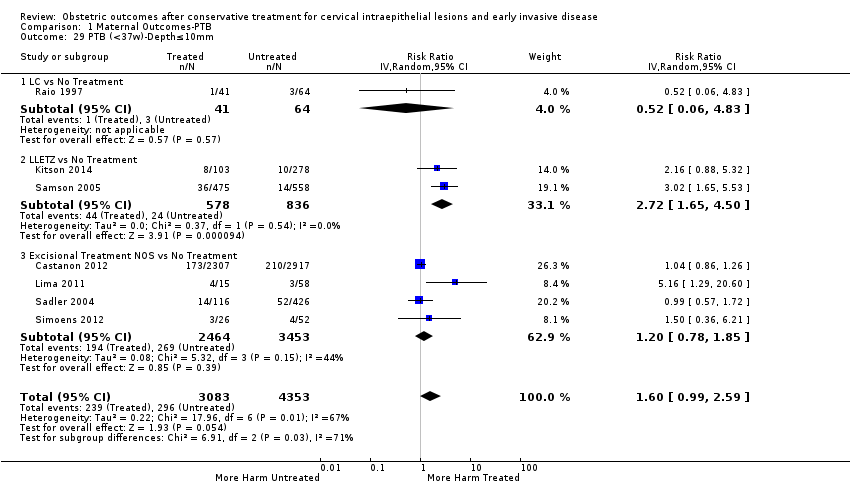 Comparison 1 Maternal Outcomes‐PTB, Outcome 29 PTB (<37w)‐Depth≤10mm. | ||||
| 29.1 LC vs No Treatment | 1 | 105 | Risk Ratio (IV, Random, 95% CI) | 0.52 [0.06, 4.83] |
| 29.2 LLETZ vs No Treatment | 2 | 1414 | Risk Ratio (IV, Random, 95% CI) | 2.72 [1.65, 4.50] |
| 29.3 Excisional Treatment NOS vs No Treatment | 4 | 5917 | Risk Ratio (IV, Random, 95% CI) | 1.20 [0.78, 1.85] |
| 30 PTB (<37w)‐Depth≤12mm Show forest plot | 1 | 543493 | Risk Ratio (IV, Random, 95% CI) | 1.56 [1.20, 2.02] |
| Analysis 1.30 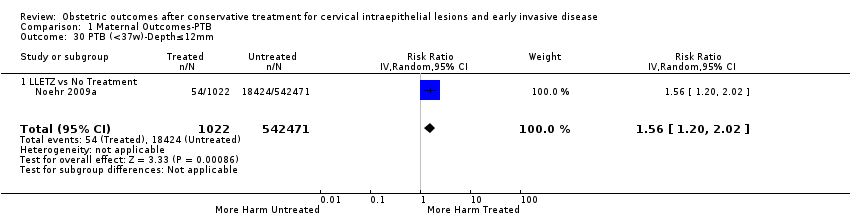 Comparison 1 Maternal Outcomes‐PTB, Outcome 30 PTB (<37w)‐Depth≤12mm. | ||||
| 30.1 LLETZ vs No Treatment | 1 | 543493 | Risk Ratio (IV, Random, 95% CI) | 1.56 [1.20, 2.02] |
| 31 PTB (<37w)‐Depth≤15mm Show forest plot | 3 | 545283 | Risk Ratio (IV, Random, 95% CI) | 1.44 [1.20, 1.73] |
| Analysis 1.31  Comparison 1 Maternal Outcomes‐PTB, Outcome 31 PTB (<37w)‐Depth≤15mm. | ||||
| 31.1 LC vs No Treatment | 1 | 164 | Risk Ratio (IV, Random, 95% CI) | 0.67 [0.04, 11.18] |
| 31.2 LLETZ vs No Treatment | 2 | 545119 | Risk Ratio (IV, Random, 95% CI) | 1.44 [1.20, 1.73] |
| 32 PTB (<37w)‐Depth≤17mm Show forest plot | 1 | 656 | Risk Ratio (IV, Random, 95% CI) | 1.14 [0.76, 1.72] |
| Analysis 1.32  Comparison 1 Maternal Outcomes‐PTB, Outcome 32 PTB (<37w)‐Depth≤17mm. | ||||
| 32.1 Excisional Treatment NOS vs No Treatment | 1 | 656 | Risk Ratio (IV, Random, 95% CI) | 1.14 [0.76, 1.72] |
| 33 PTB (<37w)‐Depth≤15‐17mm Show forest plot | 4 | 545939 | Risk Ratio (IV, Random, 95% CI) | 1.38 [1.17, 1.64] |
| Analysis 1.33  Comparison 1 Maternal Outcomes‐PTB, Outcome 33 PTB (<37w)‐Depth≤15‐17mm. | ||||
| 33.1 LC vs No Treatment | 1 | 164 | Risk Ratio (IV, Random, 95% CI) | 0.67 [0.04, 11.18] |
| 33.2 LLETZ vs No Treatment | 2 | 545119 | Risk Ratio (IV, Random, 95% CI) | 1.44 [1.20, 1.73] |
| 33.3 Excisional Treatment NOS vs No Treatment | 1 | 656 | Risk Ratio (IV, Random, 95% CI) | 1.14 [0.76, 1.72] |
| 34 PTB (<37w)‐Depth≤20mm Show forest plot | 3 | 545992 | Risk Ratio (IV, Random, 95% CI) | 1.60 [1.38, 1.87] |
| Analysis 1.34 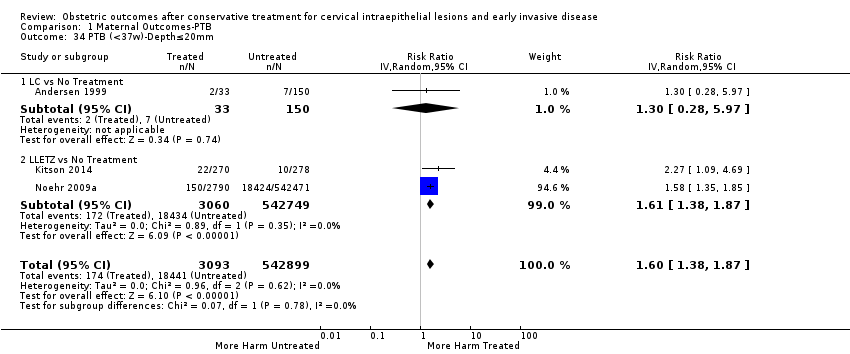 Comparison 1 Maternal Outcomes‐PTB, Outcome 34 PTB (<37w)‐Depth≤20mm. | ||||
| 34.1 LC vs No Treatment | 1 | 183 | Risk Ratio (IV, Random, 95% CI) | 1.30 [0.28, 5.97] |
| 34.2 LLETZ vs No Treatment | 2 | 545809 | Risk Ratio (IV, Random, 95% CI) | 1.61 [1.38, 1.87] |
| 35 PTB (<37w)‐Depth≥10mm Show forest plot | 7 | 7671 | Risk Ratio (IV, Random, 95% CI) | 2.12 [1.58, 2.85] |
| Analysis 1.35  Comparison 1 Maternal Outcomes‐PTB, Outcome 35 PTB (<37w)‐Depth≥10mm. | ||||
| 35.1 LC vs No Treatment | 1 | 87 | Risk Ratio (IV, Random, 95% CI) | 4.64 [1.20, 17.88] |
| 35.2 LLETZ vs No Treatment | 2 | 1094 | Risk Ratio (IV, Random, 95% CI) | 3.16 [1.80, 5.55] |
| 35.3 Excisional Treatment NOS vs No Treatment | 4 | 6490 | Risk Ratio (IV, Random, 95% CI) | 1.68 [1.41, 1.99] |
| 36 PTB (<37w)‐Depth≥12mm Show forest plot | 1 | 545040 | Risk Ratio (IV, Random, 95% CI) | 1.93 [1.66, 2.23] |
| Analysis 1.36 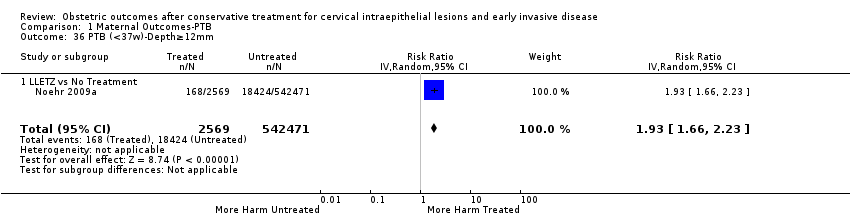 Comparison 1 Maternal Outcomes‐PTB, Outcome 36 PTB (<37w)‐Depth≥12mm. | ||||
| 36.1 LLETZ vs No Treatment | 1 | 545040 | Risk Ratio (IV, Random, 95% CI) | 1.93 [1.66, 2.23] |
| 37 PTB (<37w)‐Depth≥15mm Show forest plot | 3 | 544459 | Risk Ratio (IV, Random, 95% CI) | 3.49 [1.94, 6.26] |
| Analysis 1.37  Comparison 1 Maternal Outcomes‐PTB, Outcome 37 PTB (<37w)‐Depth≥15mm. | ||||
| 37.1 LC vs No Treatment | 1 | 211 | Risk Ratio (IV, Random, 95% CI) | 4.92 [2.09, 11.59] |
| 37.2 LLETZ vs No Treatment | 2 | 544248 | Risk Ratio (IV, Random, 95% CI) | 3.16 [1.54, 6.48] |
| 38 PTB (<37w)‐Depth≥17mm Show forest plot | 1 | 527 | Risk Ratio (IV, Random, 95% CI) | 2.03 [1.33, 3.10] |
| Analysis 1.38  Comparison 1 Maternal Outcomes‐PTB, Outcome 38 PTB (<37w)‐Depth≥17mm. | ||||
| 38.1 Excisional Treatment NOS vs No Treatment | 1 | 527 | Risk Ratio (IV, Random, 95% CI) | 2.03 [1.33, 3.10] |
| 39 PTB (<37w)‐Depth 10/13‐15/16mm Show forest plot | 3 | 544534 | Risk Ratio (IV, Random, 95% CI) | 1.32 [1.04, 1.66] |
| Analysis 1.39 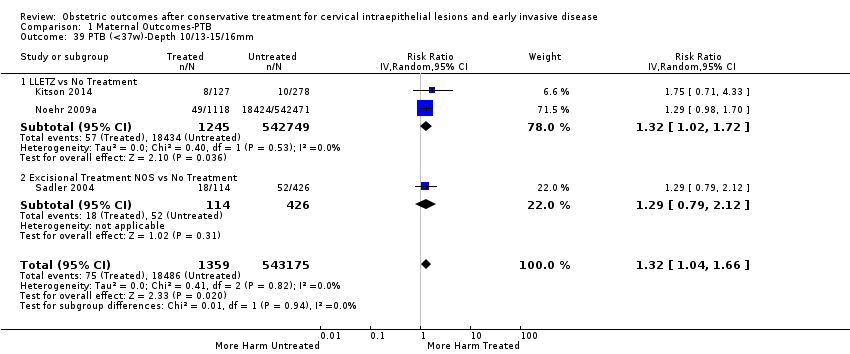 Comparison 1 Maternal Outcomes‐PTB, Outcome 39 PTB (<37w)‐Depth 10/13‐15/16mm. | ||||
| 39.1 LLETZ vs No Treatment | 2 | 543994 | Risk Ratio (IV, Random, 95% CI) | 1.32 [1.02, 1.72] |
| 39.2 Excisional Treatment NOS vs No Treatment | 1 | 540 | Risk Ratio (IV, Random, 95% CI) | 1.29 [0.79, 2.12] |
| 40 PTB (<37w)‐Depth 15/16‐19/20mm Show forest plot | 3 | 543608 | Risk Ratio (IV, Random, 95% CI) | 2.24 [1.73, 2.91] |
| Analysis 1.40  Comparison 1 Maternal Outcomes‐PTB, Outcome 40 PTB (<37w)‐Depth 15/16‐19/20mm. | ||||
| 40.1 LC vs No Treatment | 1 | 169 | Risk Ratio (IV, Random, 95% CI) | 2.26 [0.50, 10.08] |
| 40.2 LLETZ vs No Treatment | 2 | 543439 | Risk Ratio (IV, Random, 95% CI) | 2.53 [1.42, 4.51] |
| 41 PTB (<37w)‐Volume<3cc Show forest plot | 1 | 496 | Risk Ratio (IV, Random, 95% CI) | 2.04 [0.94, 4.41] |
| Analysis 1.41  Comparison 1 Maternal Outcomes‐PTB, Outcome 41 PTB (<37w)‐Volume<3cc. | ||||
| 41.1 LLETZ vs No Treatment | 1 | 496 | Risk Ratio (IV, Random, 95% CI) | 2.04 [0.94, 4.41] |
| 42 PTB (<37w)‐Volume>3cc Show forest plot | 1 | 338 | Risk Ratio (IV, Random, 95% CI) | 4.17 [1.77, 9.82] |
| Analysis 1.42 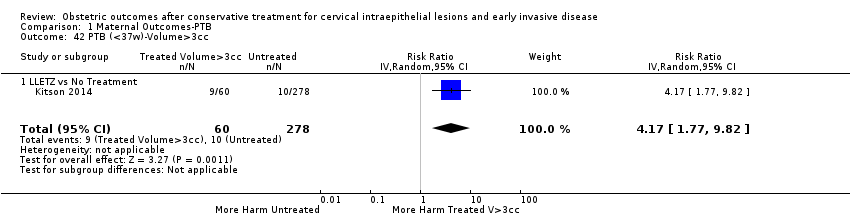 Comparison 1 Maternal Outcomes‐PTB, Outcome 42 PTB (<37w)‐Volume>3cc. | ||||
| 42.1 LLETZ vs No Treatment | 1 | 338 | Risk Ratio (IV, Random, 95% CI) | 4.17 [1.77, 9.82] |
| 43 PTB (<37w)‐Depth≥10‐12mm vs ≤10‐12mm Show forest plot | 7 | 6359 | Risk Ratio (IV, Random, 95% CI) | 1.54 [1.31, 1.80] |
| Analysis 1.43  Comparison 1 Maternal Outcomes‐PTB, Outcome 43 PTB (<37w)‐Depth≥10‐12mm vs ≤10‐12mm. | ||||
| 43.1 LC | 1 | 64 | Risk Ratio (IV, Random, 95% CI) | 8.91 [1.11, 71.73] |
| 43.2 LLETZ | 2 | 836 | Risk Ratio (IV, Random, 95% CI) | 1.26 [0.74, 2.17] |
| 43.3 Excision NOS | 4 | 5459 | Risk Ratio (IV, Random, 95% CI) | 1.55 [1.31, 1.83] |
| 44 PTB (<37w)‐Depth≥15‐17mm vs ≤15‐17mm Show forest plot | 4 | 4275 | Risk Ratio (IV, Random, 95% CI) | 1.82 [1.47, 2.26] |
| Analysis 1.44 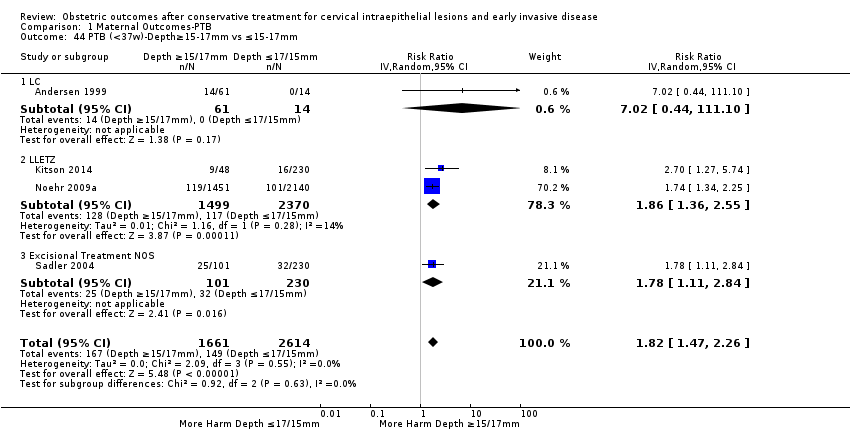 Comparison 1 Maternal Outcomes‐PTB, Outcome 44 PTB (<37w)‐Depth≥15‐17mm vs ≤15‐17mm. | ||||
| 44.1 LC | 1 | 75 | Risk Ratio (IV, Random, 95% CI) | 7.02 [0.44, 111.10] |
| 44.2 LLETZ | 2 | 3869 | Risk Ratio (IV, Random, 95% CI) | 1.86 [1.36, 2.55] |
| 44.3 Excisional Treatment NOS | 1 | 331 | Risk Ratio (IV, Random, 95% CI) | 1.78 [1.11, 2.84] |
| 45 PTB (<37w)‐Depth≥20mm vs ≤20mm Show forest plot | 3 | 3944 | Risk Ratio (IV, Random, 95% CI) | 2.79 [1.24, 6.27] |
| Analysis 1.45  Comparison 1 Maternal Outcomes‐PTB, Outcome 45 PTB (<37w)‐Depth≥20mm vs ≤20mm. | ||||
| 45.1 LC | 1 | 75 | Risk Ratio (IV, Random, 95% CI) | 4.71 [1.13, 19.62] |
| 45.2 LLETZ | 2 | 3869 | Risk Ratio (IV, Random, 95% CI) | 2.47 [0.94, 6.51] |
| 46 PTB (<37w)‐Volume>3cc vs <3cc Show forest plot | 1 | 278 | Risk Ratio (IV, Random, 95% CI) | 2.04 [0.95, 4.39] |
| Analysis 1.46  Comparison 1 Maternal Outcomes‐PTB, Outcome 46 PTB (<37w)‐Volume>3cc vs <3cc. | ||||
| 46.1 LLETZ | 1 | 278 | Risk Ratio (IV, Random, 95% CI) | 2.04 [0.95, 4.39] |
| 47 PTB (<37w)‐Volume>6cc vs <6cc Show forest plot | 1 | 278 | Risk Ratio (IV, Random, 95% CI) | 6.18 [2.53, 15.13] |
| Analysis 1.47  Comparison 1 Maternal Outcomes‐PTB, Outcome 47 PTB (<37w)‐Volume>6cc vs <6cc. | ||||
| 47.1 LLETZ | 1 | 278 | Risk Ratio (IV, Random, 95% CI) | 6.18 [2.53, 15.13] |
| 48 PTB (<37w)‐Depth 11/13‐15/16mm vs ≤10‐12mm Show forest plot | 3 | 2600 | Risk Ratio (IV, Random, 95% CI) | 0.92 [0.67, 1.25] |
| Analysis 1.48  Comparison 1 Maternal Outcomes‐PTB, Outcome 48 PTB (<37w)‐Depth 11/13‐15/16mm vs ≤10‐12mm. | ||||
| 48.1 LLETZ | 2 | 2370 | Risk Ratio (IV, Random, 95% CI) | 0.83 [0.58, 1.17] |
| 48.2 Excisional Treatment NOS | 1 | 230 | Risk Ratio (IV, Random, 95% CI) | 1.31 [0.68, 2.50] |
| 49 PTB (<37w)‐Depth 16‐19mm vs 13‐15mm Show forest plot | 1 | 1768 | Risk Ratio (IV, Random, 95% CI) | 1.65 [1.12, 2.43] |
| Analysis 1.49  Comparison 1 Maternal Outcomes‐PTB, Outcome 49 PTB (<37w)‐Depth 16‐19mm vs 13‐15mm. | ||||
| 49.1 LLETZ | 1 | 1768 | Risk Ratio (IV, Random, 95% CI) | 1.65 [1.12, 2.43] |
| 50 PTB (<37w)‐Depth≥20mm vs 15/16‐19/20mm Show forest plot | 3 | 1560 | Risk Ratio (IV, Random, 95% CI) | 1.46 [0.95, 2.23] |
| Analysis 1.50  Comparison 1 Maternal Outcomes‐PTB, Outcome 50 PTB (<37w)‐Depth≥20mm vs 15/16‐19/20mm. | ||||
| 50.1 LC | 1 | 61 | Risk Ratio (IV, Random, 95% CI) | 2.71 [0.67, 10.96] |
| 50.2 LLETZ | 2 | 1499 | Risk Ratio (IV, Random, 95% CI) | 1.40 [0.84, 2.36] |
| 51 PTB (<37w)‐Untreated External Comparison Group Show forest plot | 44 | 5.192047E6 | Risk Ratio (IV, Random, 95% CI) | 1.92 [1.70, 2.16] |
| Analysis 1.51  Comparison 1 Maternal Outcomes‐PTB, Outcome 51 PTB (<37w)‐Untreated External Comparison Group. | ||||
| 51.1 CKC | 7 | 37370 | Risk Ratio (IV, Random, 95% CI) | 3.28 [2.44, 4.42] |
| 51.2 LC | 6 | 1126 | Risk Ratio (IV, Random, 95% CI) | 2.39 [1.24, 4.61] |
| 51.3 NETZ | 1 | 7361 | Risk Ratio (IV, Random, 95% CI) | 5.82 [3.79, 8.94] |
| 51.4 LLETZ | 19 | 1.414769E6 | Risk Ratio (IV, Random, 95% CI) | 1.72 [1.48, 2.00] |
| 51.5 LA] | 4 | 1258 | Risk Ratio (IV, Random, 95% CI) | 1.27 [0.67, 2.40] |
| 51.6 CT | 1 | 58 | Risk Ratio (IV, Random, 95% CI) | 1.86 [0.08, 43.87] |
| 51.7 Excisional Treatment NOS | 12 | 3.100025E6 | Risk Ratio (IV, Random, 95% CI) | 1.91 [1.50, 2.44] |
| 51.8 Ablative Treatment NOS | 5 | 588949 | Risk Ratio (IV, Random, 95% CI) | 1.45 [1.26, 1.67] |
| 51.9 Treatment NOS | 2 | 41131 | Risk Ratio (IV, Random, 95% CI) | 2.57 [1.39, 4.77] |
| 52 PTB (<37w)‐Untreated Internal Comparison Group (self‐matching) Show forest plot | 8 | 2987 | Risk Ratio (IV, Random, 95% CI) | 1.59 [1.19, 2.13] |
| Analysis 1.52  Comparison 1 Maternal Outcomes‐PTB, Outcome 52 PTB (<37w)‐Untreated Internal Comparison Group (self‐matching). | ||||
| 52.1 LC | 2 | 354 | Risk Ratio (IV, Random, 95% CI) | 1.30 [0.56, 3.06] |
| 52.2 LLETZ | 1 | 516 | Risk Ratio (IV, Random, 95% CI) | 1.82 [1.04, 3.21] |
| 52.3 FCBE | 1 | 71 | Risk Ratio (IV, Random, 95% CI) | 5.22 [1.09, 24.90] |
| 52.4 Excisional Treatment NOS | 3 | 1922 | Risk Ratio (IV, Random, 95% CI) | 1.46 [0.89, 2.39] |
| 52.5 Treatment NOS | 1 | 124 | Risk Ratio (IV, Random, 95% CI) | 2.0 [0.73, 5.51] |
| 53 PTB (<37w)‐Untreated Internal Comparison Group (pre‐treatment pregnancies) Show forest plot | 13 | 83404 | Risk Ratio (IV, Random, 95% CI) | 1.39 [0.98, 1.96] |
| Analysis 1.53 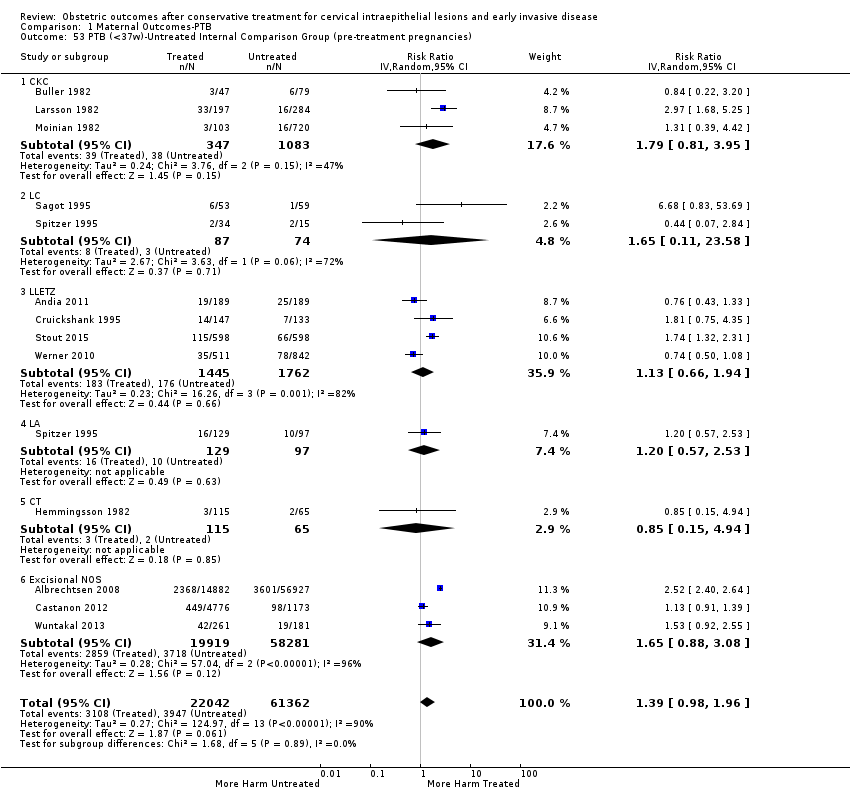 Comparison 1 Maternal Outcomes‐PTB, Outcome 53 PTB (<37w)‐Untreated Internal Comparison Group (pre‐treatment pregnancies). | ||||
| 53.1 CKC | 3 | 1430 | Risk Ratio (IV, Random, 95% CI) | 1.79 [0.81, 3.95] |
| 53.2 LC | 2 | 161 | Risk Ratio (IV, Random, 95% CI) | 1.65 [0.11, 23.58] |
| 53.3 LLETZ | 4 | 3207 | Risk Ratio (IV, Random, 95% CI) | 1.13 [0.66, 1.94] |
| 53.4 LA | 1 | 226 | Risk Ratio (IV, Random, 95% CI) | 1.20 [0.57, 2.53] |
| 53.5 CT | 1 | 180 | Risk Ratio (IV, Random, 95% CI) | 0.85 [0.15, 4.94] |
| 53.6 Excisional NOS | 3 | 78200 | Risk Ratio (IV, Random, 95% CI) | 1.65 [0.88, 3.08] |
| 54 PTB (<37w)‐Untreated Colposcopy+/‐CIN+/‐Biopsy Comparison Group Show forest plot | 13 | 74958 | Risk Ratio (IV, Random, 95% CI) | 1.27 [1.14, 1.41] |
| Analysis 1.54  Comparison 1 Maternal Outcomes‐PTB, Outcome 54 PTB (<37w)‐Untreated Colposcopy+/‐CIN+/‐Biopsy Comparison Group. | ||||
| 54.1 CKC | 2 | 265 | Risk Ratio (IV, Random, 95% CI) | 1.76 [1.01, 3.08] |
| 54.2 LC | 1 | 177 | Risk Ratio (IV, Random, 95% CI) | 1.52 [0.74, 3.15] |
| 54.3 LLETZ | 9 | 39249 | Risk Ratio (IV, Random, 95% CI) | 1.33 [1.11, 1.60] |
| 54.4 LA | 2 | 3326 | Risk Ratio (IV, Random, 95% CI) | 1.05 [0.84, 1.31] |
| 54.5 RD | 1 | 2150 | Risk Ratio (IV, Random, 95% CI) | 1.62 [1.27, 2.06] |
| 54.6 Excisional Treatment NOS | 5 | 20321 | Risk Ratio (IV, Random, 95% CI) | 1.23 [1.07, 1.41] |
| 54.7 Ablative Treatment NOS | 2 | 9470 | Risk Ratio (IV, Random, 95% CI) | 1.00 [0.74, 1.36] |
| 55 PTB (<37w)‐Untreated HSIL Comparison Group Show forest plot | 3 | 3764 | Risk Ratio (IV, Random, 95% CI) | 1.37 [0.85, 2.19] |
| Analysis 1.55  Comparison 1 Maternal Outcomes‐PTB, Outcome 55 PTB (<37w)‐Untreated HSIL Comparison Group. | ||||
| 55.1 CKC | 1 | 103 | Risk Ratio (IV, Random, 95% CI) | 3.76 [0.48, 29.39] |
| 55.2 NETZ | 1 | 109 | Risk Ratio (IV, Random, 95% CI) | 4.55 [1.11, 18.66] |
| 55.3 LLETZ | 1 | 881 | Risk Ratio (IV, Random, 95% CI) | 2.48 [1.35, 4.55] |
| 55.4 Excisional Treatment NOS | 2 | 2274 | Risk Ratio (IV, Random, 95% CI) | 1.06 [0.71, 1.59] |
| 55.5 Ablative Treatment NOS | 2 | 397 | Risk Ratio (IV, Random, 95% CI) | 0.68 [0.28, 1.68] |
| 56 PTB (<37w)‐All Comparison Groups Show forest plot | 58 | 5.292724E6 | Risk Ratio (IV, Random, 95% CI) | 1.76 [1.58, 1.97] |
| Analysis 1.56  Comparison 1 Maternal Outcomes‐PTB, Outcome 56 PTB (<37w)‐All Comparison Groups. | ||||
| 56.1 Treatment vs Untreated External Comparison Group | 43 | 5.165466E6 | Risk Ratio (IV, Random, 95% CI) | 1.97 [1.71, 2.26] |
| 56.2 Treatment vs Untreated Internal Comparison Group (pre‐treatment pregnancies) | 13 | 62519 | Risk Ratio (IV, Random, 95% CI) | 1.66 [1.24, 2.22] |
| 56.3 Treatment vs Untreated Internal Comparison Group (self‐matching) | 6 | 1263 | Risk Ratio (IV, Random, 95% CI) | 1.91 [1.19, 3.08] |
| 56.4 Treatment vs Untreated Colposcopy+/‐CIN+/‐Biopsy Comparison Group | 12 | 62702 | Risk Ratio (IV, Random, 95% CI) | 1.33 [1.17, 1.50] |
| 56.5 Treatment vs Untreated HSIL Comparison Group | 3 | 774 | Risk Ratio (IV, Random, 95% CI) | 1.46 [0.62, 3.42] |
| 57 PTB (<37w)‐Untreated High‐risk Population vs General Population Show forest plot | 15 | 4.357998E6 | Risk Ratio (IV, Random, 95% CI) | 1.24 [1.14, 1.34] |
| Analysis 1.57  Comparison 1 Maternal Outcomes‐PTB, Outcome 57 PTB (<37w)‐Untreated High‐risk Population vs General Population. | ||||
| 57.1 Pre‐treatment pregnancies vs General Population | 10 | 3.132723E6 | Risk Ratio (IV, Random, 95% CI) | 1.23 [1.07, 1.42] |
| 57.2 Untreated Colposcopy+/‐CIN+/‐Biopsy vs General Population | 4 | 1.046823E6 | Risk Ratio (IV, Random, 95% CI) | 1.22 [1.11, 1.34] |
| 57.3 Untreated HSIL vs General Population | 3 | 178452 | Risk Ratio (IV, Random, 95% CI) | 1.40 [0.94, 2.10] |
| 58 PTB (<37w)‐Depth≤10‐12mm vs Untreated External Comparison Group Show forest plot | 6 | 1.026243E6 | Risk Ratio (IV, Random, 95% CI) | 1.64 [1.11, 2.42] |
| Analysis 1.58 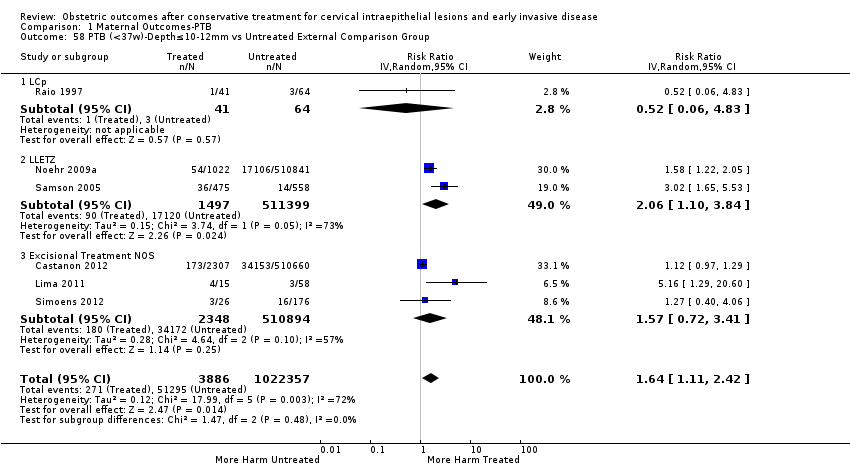 Comparison 1 Maternal Outcomes‐PTB, Outcome 58 PTB (<37w)‐Depth≤10‐12mm vs Untreated External Comparison Group. | ||||
| 58.1 LCp | 1 | 105 | Risk Ratio (IV, Random, 95% CI) | 0.52 [0.06, 4.83] |
| 58.2 LLETZ | 2 | 512896 | Risk Ratio (IV, Random, 95% CI) | 2.06 [1.10, 3.84] |
| 58.3 Excisional Treatment NOS | 3 | 513242 | Risk Ratio (IV, Random, 95% CI) | 1.57 [0.72, 3.41] |
| 59 PTB (<37w)‐Depth≤10‐12mm vs Untreated Internal Comparison Group Show forest plot | 2 | 3550 | Risk Ratio (IV, Random, 95% CI) | 0.90 [0.71, 1.14] |
| Analysis 1.59  Comparison 1 Maternal Outcomes‐PTB, Outcome 59 PTB (<37w)‐Depth≤10‐12mm vs Untreated Internal Comparison Group. | ||||
| 59.1 LC | 1 | 70 | Risk Ratio (IV, Random, 95% CI) | 0.71 [0.05, 10.85] |
| 59.2 Excisional Treatment NOS | 1 | 3480 | Risk Ratio (IV, Random, 95% CI) | 0.90 [0.71, 1.14] |
| 60 PTB (<37w)‐Depth≤10‐12mm vs Untreated Colposcopy+/‐CIN+/‐Biopsy Show forest plot | 4 | 43145 | Risk Ratio (IV, Random, 95% CI) | 1.11 [0.85, 1.43] |
| Analysis 1.60  Comparison 1 Maternal Outcomes‐PTB, Outcome 60 PTB (<37w)‐Depth≤10‐12mm vs Untreated Colposcopy+/‐CIN+/‐Biopsy. | ||||
| 60.1 LLETZ | 2 | 33033 | Risk Ratio (IV, Random, 95% CI) | 1.38 [0.94, 2.02] |
| 60.2 Excisional Treatment NOS | 2 | 10112 | Risk Ratio (IV, Random, 95% CI) | 0.93 [0.80, 1.09] |
| 61 PTB (<37w)‐Depth≤15‐17mm vs Untreated External Comparison Group Show forest plot | 2 | 513145 | Risk Ratio (IV, Random, 95% CI) | 1.43 [1.19, 1.73] |
| Analysis 1.61  Comparison 1 Maternal Outcomes‐PTB, Outcome 61 PTB (<37w)‐Depth≤15‐17mm vs Untreated External Comparison Group. | ||||
| 61.1 LC | 1 | 164 | Risk Ratio (IV, Random, 95% CI) | 0.67 [0.04, 11.18] |
| 61.2 LLETZ | 1 | 512981 | Risk Ratio (IV, Random, 95% CI) | 1.44 [1.19, 1.74] |
| 62 PTB (<37w)‐Depth≤15‐17mm vs Untreated Colposcopy+/‐CIN+/‐Biopsy Show forest plot | 3 | 34934 | Risk Ratio (IV, Random, 95% CI) | 1.18 [1.00, 1.40] |
| Analysis 1.62 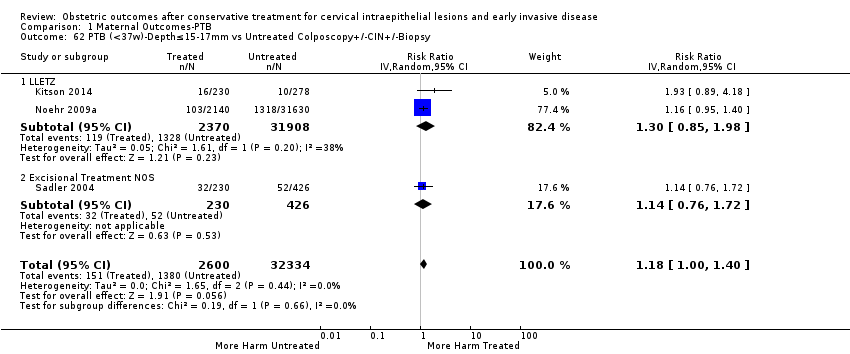 Comparison 1 Maternal Outcomes‐PTB, Outcome 62 PTB (<37w)‐Depth≤15‐17mm vs Untreated Colposcopy+/‐CIN+/‐Biopsy. | ||||
| 62.1 LLETZ | 2 | 34278 | Risk Ratio (IV, Random, 95% CI) | 1.30 [0.85, 1.98] |
| 62.2 Excisional Treatment NOS | 1 | 656 | Risk Ratio (IV, Random, 95% CI) | 1.14 [0.76, 1.72] |
| 63 PTB (<37w)‐Depth≤20mm vs Untreated External Comparison Group Show forest plot | 2 | 513814 | Risk Ratio (IV, Random, 95% CI) | 1.60 [1.37, 1.87] |
| Analysis 1.63  Comparison 1 Maternal Outcomes‐PTB, Outcome 63 PTB (<37w)‐Depth≤20mm vs Untreated External Comparison Group. | ||||
| 63.1 LC | 1 | 183 | Risk Ratio (IV, Random, 95% CI) | 1.30 [0.28, 5.97] |
| 63.2 LLETZ | 1 | 513631 | Risk Ratio (IV, Random, 95% CI) | 1.61 [1.37, 1.88] |
| 64 PTB (<37w)‐Depth≤20mm vs Untreated Colposcopy+/‐CIN+/‐Biopsy Show forest plot | 2 | 34968 | Risk Ratio (IV, Random, 95% CI) | 1.52 [0.92, 2.51] |
| Analysis 1.64  Comparison 1 Maternal Outcomes‐PTB, Outcome 64 PTB (<37w)‐Depth≤20mm vs Untreated Colposcopy+/‐CIN+/‐Biopsy. | ||||
| 64.1 LLETZ | 2 | 34968 | Risk Ratio (IV, Random, 95% CI) | 1.52 [0.92, 2.51] |
| 65 PTB (<37w)‐Depth≥10‐12mm vs Untreated External Comparison Group Show forest plot | 6 | 1.027812E6 | Risk Ratio (IV, Random, 95% CI) | 1.96 [1.66, 2.32] |
| Analysis 1.65 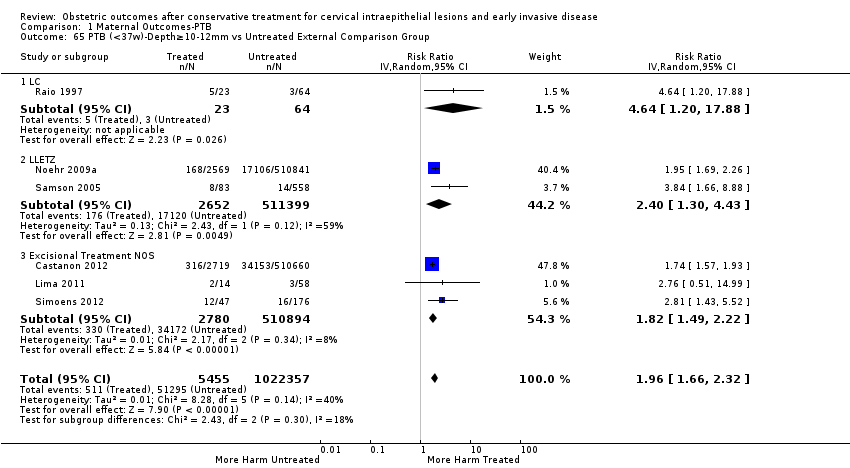 Comparison 1 Maternal Outcomes‐PTB, Outcome 65 PTB (<37w)‐Depth≥10‐12mm vs Untreated External Comparison Group. | ||||
| 65.1 LC | 1 | 87 | Risk Ratio (IV, Random, 95% CI) | 4.64 [1.20, 17.88] |
| 65.2 LLETZ | 2 | 514051 | Risk Ratio (IV, Random, 95% CI) | 2.40 [1.30, 4.43] |
| 65.3 Excisional Treatment NOS | 3 | 513674 | Risk Ratio (IV, Random, 95% CI) | 1.82 [1.49, 2.22] |
| 66 PTB (<37w)‐Depth≥10‐12mm vs Untreated Internal Comparison Group Show forest plot | 2 | 3944 | Risk Ratio (IV, Random, 95% CI) | 2.05 [0.56, 7.48] |
| Analysis 1.66 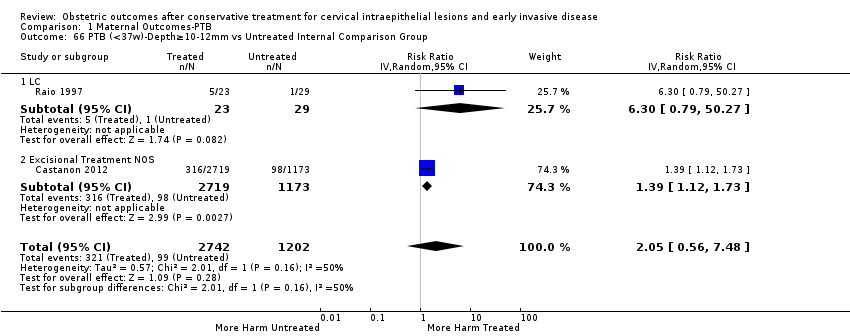 Comparison 1 Maternal Outcomes‐PTB, Outcome 66 PTB (<37w)‐Depth≥10‐12mm vs Untreated Internal Comparison Group. | ||||
| 66.1 LC | 1 | 52 | Risk Ratio (IV, Random, 95% CI) | 6.30 [0.79, 50.27] |
| 66.2 Excisional Treatment NOS | 1 | 3892 | Risk Ratio (IV, Random, 95% CI) | 1.39 [1.12, 1.73] |
| 67 PTB (<37w)‐Depth≥10‐12mm vs Untreated Colposcopy+/‐CIN+/‐Biopsy Show forest plot | 4 | 45275 | Risk Ratio (IV, Random, 95% CI) | 1.52 [1.37, 1.68] |
| Analysis 1.67 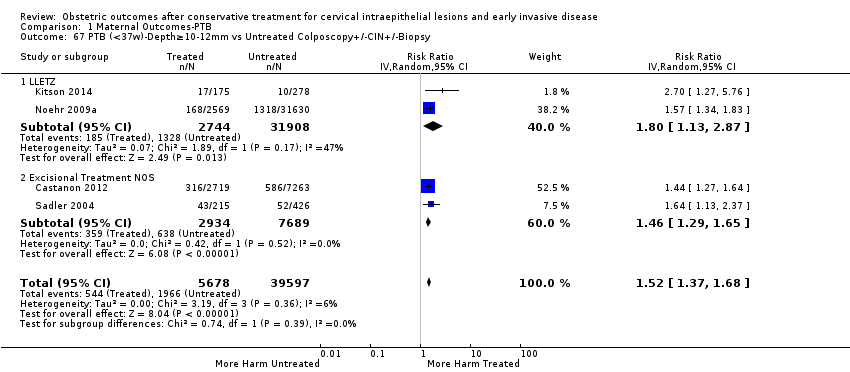 Comparison 1 Maternal Outcomes‐PTB, Outcome 67 PTB (<37w)‐Depth≥10‐12mm vs Untreated Colposcopy+/‐CIN+/‐Biopsy. | ||||
| 67.1 LLETZ | 2 | 34652 | Risk Ratio (IV, Random, 95% CI) | 1.80 [1.13, 2.87] |
| 67.2 Excisional Treatment NOS | 2 | 10623 | Risk Ratio (IV, Random, 95% CI) | 1.46 [1.29, 1.65] |
| 68 PTB (<37w)‐Depth≥15‐17mm vs Untreated External Comparison Group Show forest plot | 2 | 512503 | Risk Ratio (IV, Random, 95% CI) | 3.04 [1.62, 5.73] |
| Analysis 1.68  Comparison 1 Maternal Outcomes‐PTB, Outcome 68 PTB (<37w)‐Depth≥15‐17mm vs Untreated External Comparison Group. | ||||
| 68.1 LC | 1 | 211 | Risk Ratio (IV, Random, 95% CI) | 4.92 [2.09, 11.59] |
| 68.2 LLETZ | 1 | 512292 | Risk Ratio (IV, Random, 95% CI) | 2.45 [2.06, 2.91] |
| 69 PTB (<37w)‐Depth≥15‐17mm vs Untreated Colposcopy+/‐CIN+/‐Biopsy Show forest plot | 3 | 33934 | Risk Ratio (IV, Random, 95% CI) | 2.30 [1.57, 3.35] |
| Analysis 1.69  Comparison 1 Maternal Outcomes‐PTB, Outcome 69 PTB (<37w)‐Depth≥15‐17mm vs Untreated Colposcopy+/‐CIN+/‐Biopsy. | ||||
| 69.1 LLETZ | 2 | 33407 | Risk Ratio (IV, Random, 95% CI) | 2.92 [1.14, 7.46] |
| 69.2 Excisional Treatment NOS | 1 | 527 | Risk Ratio (IV, Random, 95% CI) | 2.03 [1.33, 3.10] |
| 70 PTB (<37w)‐Depth≥20mm vs Untreated External Comparison Group Show forest plot | 2 | 511834 | Risk Ratio (IV, Random, 95% CI) | 3.63 [1.67, 7.90] |
| Analysis 1.70  Comparison 1 Maternal Outcomes‐PTB, Outcome 70 PTB (<37w)‐Depth≥20mm vs Untreated External Comparison Group. | ||||
| 70.1 LC | 1 | 192 | Risk Ratio (IV, Random, 95% CI) | 6.12 [2.57, 14.57] |
| 70.2 LLETZ | 1 | 511642 | Risk Ratio (IV, Random, 95% CI) | 2.68 [2.15, 3.35] |
| 71 PTB (<37w)‐Depth≥20mm vs Untreated Colposcopy+/‐CIN+/‐Biopsy Show forest plot | 2 | 32717 | Risk Ratio (IV, Random, 95% CI) | 4.32 [0.93, 20.03] |
| Analysis 1.71  Comparison 1 Maternal Outcomes‐PTB, Outcome 71 PTB (<37w)‐Depth≥20mm vs Untreated Colposcopy+/‐CIN+/‐Biopsy. | ||||
| 71.1 LLETZ | 2 | 32717 | Risk Ratio (IV, Random, 95% CI) | 4.32 [0.93, 20.03] |
| 72 PTB (<37w)‐Depth 10/13‐15/16mm vs Untreated External Comparison Group Show forest plot | 1 | 511959 | Risk Ratio (IV, Random, 95% CI) | 1.31 [0.99, 1.72] |
| Analysis 1.72 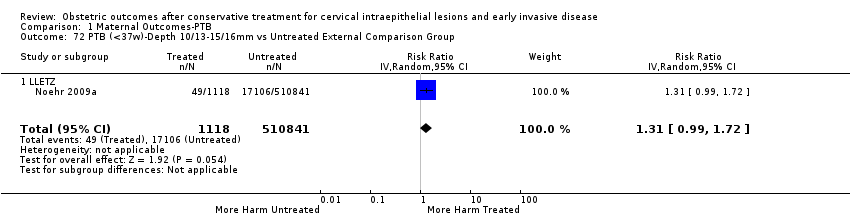 Comparison 1 Maternal Outcomes‐PTB, Outcome 72 PTB (<37w)‐Depth 10/13‐15/16mm vs Untreated External Comparison Group. | ||||
| 72.1 LLETZ | 1 | 511959 | Risk Ratio (IV, Random, 95% CI) | 1.31 [0.99, 1.72] |
| 73 PTB (<37w)‐Depth 10/13‐15/16mm vs Untreated Colposcopy+/‐CIN+/‐Biopsy Show forest plot | 3 | 33693 | Risk Ratio (IV, Random, 95% CI) | 1.14 [0.90, 1.44] |
| Analysis 1.73 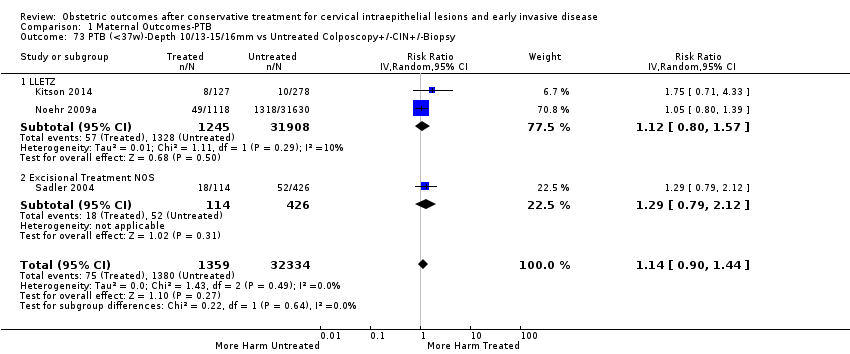 Comparison 1 Maternal Outcomes‐PTB, Outcome 73 PTB (<37w)‐Depth 10/13‐15/16mm vs Untreated Colposcopy+/‐CIN+/‐Biopsy. | ||||
| 73.1 LLETZ | 2 | 33153 | Risk Ratio (IV, Random, 95% CI) | 1.12 [0.80, 1.57] |
| 73.2 Excisional Treatment NOS | 1 | 540 | Risk Ratio (IV, Random, 95% CI) | 1.29 [0.79, 2.12] |
| 74 PTB (<37w)‐Depth 15/16‐19/20mm vs Untreated External Comparison Group Show forest plot | 2 | 511660 | Risk Ratio (IV, Random, 95% CI) | 2.16 [1.65, 2.84] |
| Analysis 1.74 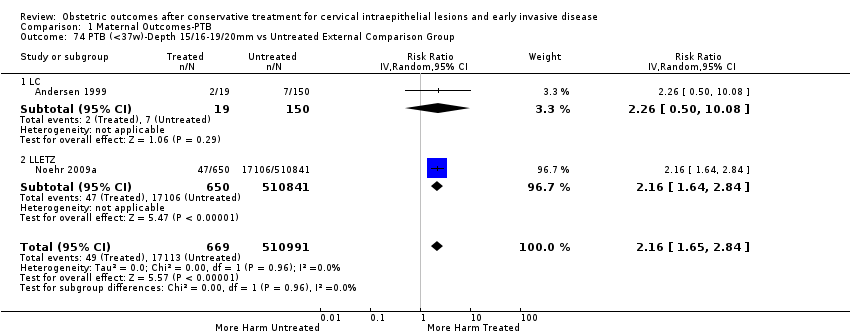 Comparison 1 Maternal Outcomes‐PTB, Outcome 74 PTB (<37w)‐Depth 15/16‐19/20mm vs Untreated External Comparison Group. | ||||
| 74.1 LC | 1 | 169 | Risk Ratio (IV, Random, 95% CI) | 2.26 [0.50, 10.08] |
| 74.2 LLETZ | 1 | 511491 | Risk Ratio (IV, Random, 95% CI) | 2.16 [1.64, 2.84] |
| 75 PTB (<37w)‐Depth 15/16‐19/20mm vs Untreated Colposcopy+/‐CIN+/‐Biopsy Show forest plot | 2 | 32598 | Risk Ratio (IV, Random, 95% CI) | 2.38 [1.04, 5.42] |
| Analysis 1.75 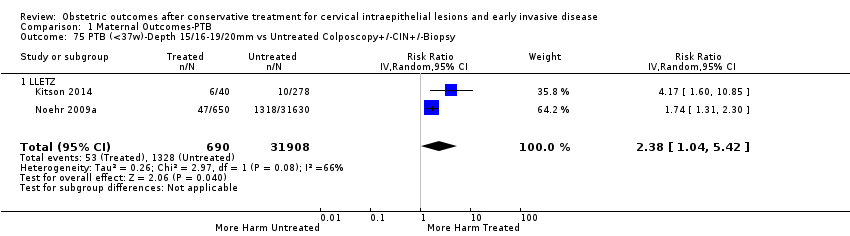 Comparison 1 Maternal Outcomes‐PTB, Outcome 75 PTB (<37w)‐Depth 15/16‐19/20mm vs Untreated Colposcopy+/‐CIN+/‐Biopsy. | ||||
| 75.1 LLETZ | 2 | 32598 | Risk Ratio (IV, Random, 95% CI) | 2.38 [1.04, 5.42] |
| Outcome or subgroup title | No. of studies | No. of participants | Statistical method | Effect size |
| 1 sPTB (<37w) Show forest plot | 14 | 1.024731E6 | Risk Ratio (IV, Random, 95% CI) | 1.76 [1.47, 2.11] |
| Analysis 2.1  Comparison 2 Other maternal Outcomes, Outcome 1 sPTB (<37w). | ||||
| 1.1 CKC vs No Treatment | 3 | 7320 | Risk Ratio (IV, Random, 95% CI) | 3.53 [2.05, 6.05] |
| 1.2 LC vs No Treatment | 2 | 222 | Risk Ratio (IV, Random, 95% CI) | 1.40 [0.51, 3.81] |
| 1.3 NETZ vs No Treatment | 1 | 7399 | Risk Ratio (IV, Random, 95% CI) | 5.83 [3.80, 8.95] |
| 1.4 LLETZ vs No Treatment | 11 | 773123 | Risk Ratio (IV, Random, 95% CI) | 1.60 [1.22, 2.08] |
| 1.5 LA vs No Treatment | 1 | 356 | Risk Ratio (IV, Random, 95% CI) | 0.95 [0.34, 2.68] |
| 1.6 CT vs No Treatment | 1 | 58 | Risk Ratio (IV, Random, 95% CI) | 1.86 [0.08, 43.87] |
| 1.7 Excisional Treatment NOS vs No Treatment | 2 | 95985 | Risk Ratio (IV, Random, 95% CI) | 1.70 [1.17, 2.46] |
| 1.8 Ablative Treatment NOS vs No Treatment | 2 | 134720 | Risk Ratio (IV, Random, 95% CI) | 1.42 [1.20, 1.70] |
| 1.9 Treatment NOS vs No Treatment | 1 | 5548 | Risk Ratio (IV, Random, 95% CI) | 1.30 [1.00, 1.69] |
| 2 sPTB (<32‐34w) Show forest plot | 7 | 655675 | Risk Ratio (IV, Random, 95% CI) | 2.63 [1.91, 3.62] |
| Analysis 2.2  Comparison 2 Other maternal Outcomes, Outcome 2 sPTB (<32‐34w). | ||||
| 2.1 CKC vs No Treatment | 2 | 6990 | Risk Ratio (IV, Random, 95% CI) | 4.38 [1.08, 17.65] |
| 2.2 NETZ vs No Treatment | 1 | 7399 | Risk Ratio (IV, Random, 95% CI) | 10.53 [4.33, 25.65] |
| 2.3 LLETZ vs No Treatment | 6 | 530985 | Risk Ratio (IV, Random, 95% CI) | 2.37 [1.82, 3.08] |
| 2.4 CT vs No Treatment | 1 | 58 | Risk Ratio (IV, Random, 95% CI) | 1.86 [0.08, 43.87] |
| 2.5 Excisional Treatment NOS vs No Treatment | 1 | 264 | Risk Ratio (IV, Random, 95% CI) | 13.92 [0.73, 266.57] |
| 2.6 Ablative Treatment NOS vs No Treatment | 1 | 109979 | Risk Ratio (IV, Random, 95% CI) | 1.57 [0.97, 2.53] |
| 3 sPTB (<28w) Show forest plot | 2 | 626670 | Risk Ratio (IV, Random, 95% CI) | 3.18 [1.64, 6.16] |
| Analysis 2.3 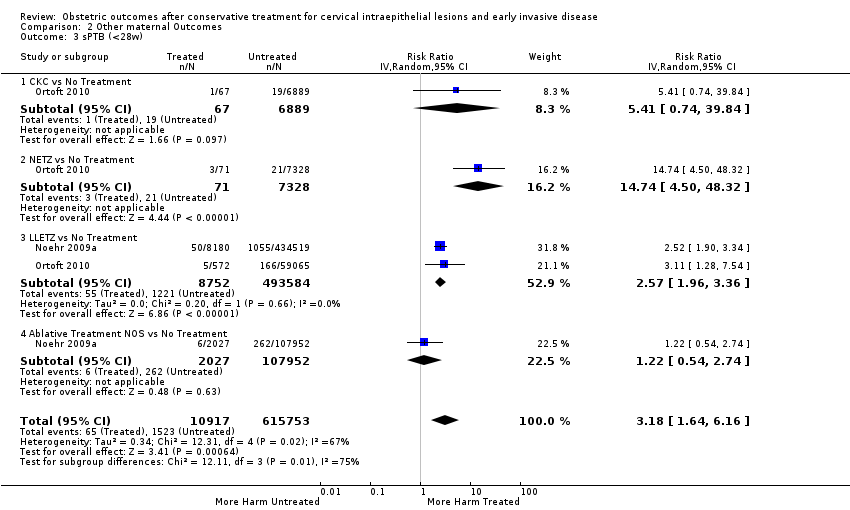 Comparison 2 Other maternal Outcomes, Outcome 3 sPTB (<28w). | ||||
| 3.1 CKC vs No Treatment | 1 | 6956 | Risk Ratio (IV, Random, 95% CI) | 5.41 [0.74, 39.84] |
| 3.2 NETZ vs No Treatment | 1 | 7399 | Risk Ratio (IV, Random, 95% CI) | 14.74 [4.50, 48.32] |
| 3.3 LLETZ vs No Treatment | 2 | 502336 | Risk Ratio (IV, Random, 95% CI) | 2.57 [1.96, 3.36] |
| 3.4 Ablative Treatment NOS vs No Treatment | 1 | 109979 | Risk Ratio (IV, Random, 95% CI) | 1.22 [0.54, 2.74] |
| 4 pPROM (<37w) Show forest plot | 21 | 477011 | Risk Ratio (IV, Random, 95% CI) | 2.36 [1.76, 3.17] |
| Analysis 2.4  Comparison 2 Other maternal Outcomes, Outcome 4 pPROM (<37w). | ||||
| 4.1 CKC vs No Treatment | 4 | 36733 | Risk Ratio (IV, Random, 95% CI) | 4.11 [2.05, 8.25] |
| 4.2 LC vs No Treatment | 4 | 635 | Risk Ratio (IV, Random, 95% CI) | 1.89 [0.97, 3.66] |
| 4.3 NETZ vs No Treatment | 1 | 7279 | Risk Ratio (IV, Random, 95% CI) | 8.83 [5.39, 14.46] |
| 4.4 LLETZ vs No Treatment | 8 | 302974 | Risk Ratio (IV, Random, 95% CI) | 2.15 [1.48, 3.12] |
| 4.5 LA vs No Treatment | 2 | 548 | Risk Ratio (IV, Random, 95% CI) | 1.62 [0.74, 3.55] |
| 4.6 CT vs No Treatment | 1 | 180 | Risk Ratio (IV, Random, 95% CI) | 1.13 [0.21, 6.00] |
| 4.7 Excisional Treatment NOS vs No Treatment | 5 | 98372 | Risk Ratio (IV, Random, 95% CI) | 2.66 [1.13, 6.24] |
| 4.8 Ablative Treatment NOS vs No Treatment | 1 | 24742 | Risk Ratio (IV, Random, 95% CI) | 1.47 [1.01, 2.15] |
| 4.9 Treatment NOS vs No Treatment | 1 | 5548 | Risk Ratio (IV, Random, 95% CI) | 1.44 [1.05, 1.97] |
| 5 pPROM (<32w) Show forest plot | 1 | 72788 | Risk Ratio (IV, Random, 95% CI) | 8.30 [2.03, 33.98] |
| Analysis 2.5  Comparison 2 Other maternal Outcomes, Outcome 5 pPROM (<32w). | ||||
| 5.1 CKC vs No Treatment | 1 | 6842 | Risk Ratio (IV, Random, 95% CI) | 5.32 [0.72, 39.19] |
| 5.2 NETZ vs No Treatment | 1 | 7279 | Risk Ratio (IV, Random, 95% CI) | 25.38 [9.80, 65.74] |
| 5.3 LLETZ vs No Treatment | 1 | 58667 | Risk Ratio (IV, Random, 95% CI) | 3.74 [1.66, 8.41] |
| 6 pPROM (<28w) Show forest plot | 1 | 72788 | Risk Ratio (IV, Random, 95% CI) | 9.09 [1.04, 79.18] |
| Analysis 2.6  Comparison 2 Other maternal Outcomes, Outcome 6 pPROM (<28w). | ||||
| 6.1 CKC vs No Treatment | 1 | 6842 | Risk Ratio (IV, Random, 95% CI) | 6.64 [0.38, 115.16] |
| 6.2 NETZ vs No Treatment | 1 | 7279 | Risk Ratio (IV, Random, 95% CI) | 43.51 [11.48, 164.86] |
| 6.3 LLETZ vs No Treatment | 1 | 58667 | Risk Ratio (IV, Random, 95% CI) | 1.81 [0.25, 13.08] |
| 7 Threatened PTB Show forest plot | 5 | 903 | Risk Ratio (IV, Random, 95% CI) | 2.44 [1.37, 4.33] |
| Analysis 2.7 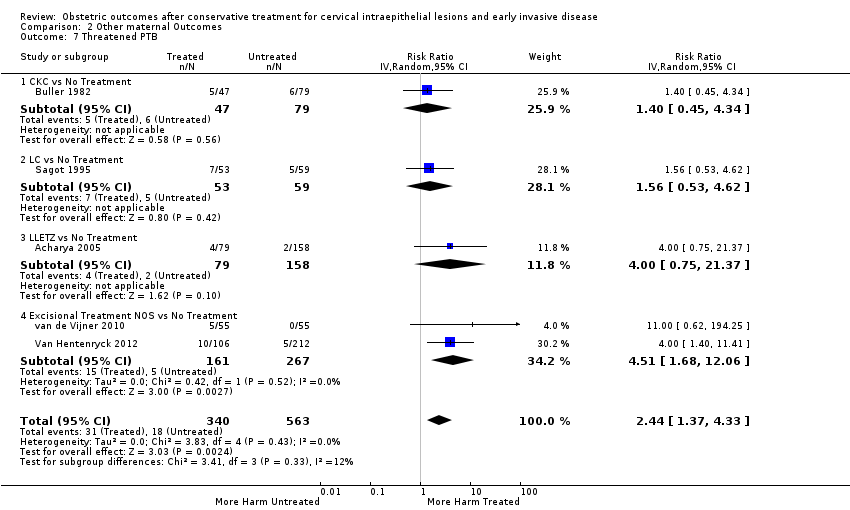 Comparison 2 Other maternal Outcomes, Outcome 7 Threatened PTB. | ||||
| 7.1 CKC vs No Treatment | 1 | 126 | Risk Ratio (IV, Random, 95% CI) | 1.40 [0.45, 4.34] |
| 7.2 LC vs No Treatment | 1 | 112 | Risk Ratio (IV, Random, 95% CI) | 1.56 [0.53, 4.62] |
| 7.3 LLETZ vs No Treatment | 1 | 237 | Risk Ratio (IV, Random, 95% CI) | 4.0 [0.75, 21.37] |
| 7.4 Excisional Treatment NOS vs No Treatment | 2 | 428 | Risk Ratio (IV, Random, 95% CI) | 4.51 [1.68, 12.06] |
| 8 Chorioamnionitis Show forest plot | 4 | 29198 | Risk Ratio (IV, Random, 95% CI) | 3.43 [1.36, 8.64] |
| Analysis 2.8  Comparison 2 Other maternal Outcomes, Outcome 8 Chorioamnionitis. | ||||
| 8.1 CKC vs No Treatment | 1 | 28531 | Risk Ratio (IV, Random, 95% CI) | 2.39 [0.61, 9.43] |
| 8.2 LC vs No Treatment | 1 | 112 | Risk Ratio (IV, Random, 95% CI) | 3.33 [0.14, 80.11] |
| 8.3 LLETZ vs No Treatment | 1 | 237 | Risk Ratio (IV, Random, 95% CI) | 10.00 [1.19, 84.15] |
| 8.4 Excisional Treatment NOS vs No Treatment | 1 | 318 | Risk Ratio (IV, Random, 95% CI) | 3.0 [0.51, 17.68] |
| 9 Caeserean Section Show forest plot | 36 | 272360 | Risk Ratio (IV, Random, 95% CI) | 1.06 [0.98, 1.14] |
| Analysis 2.9 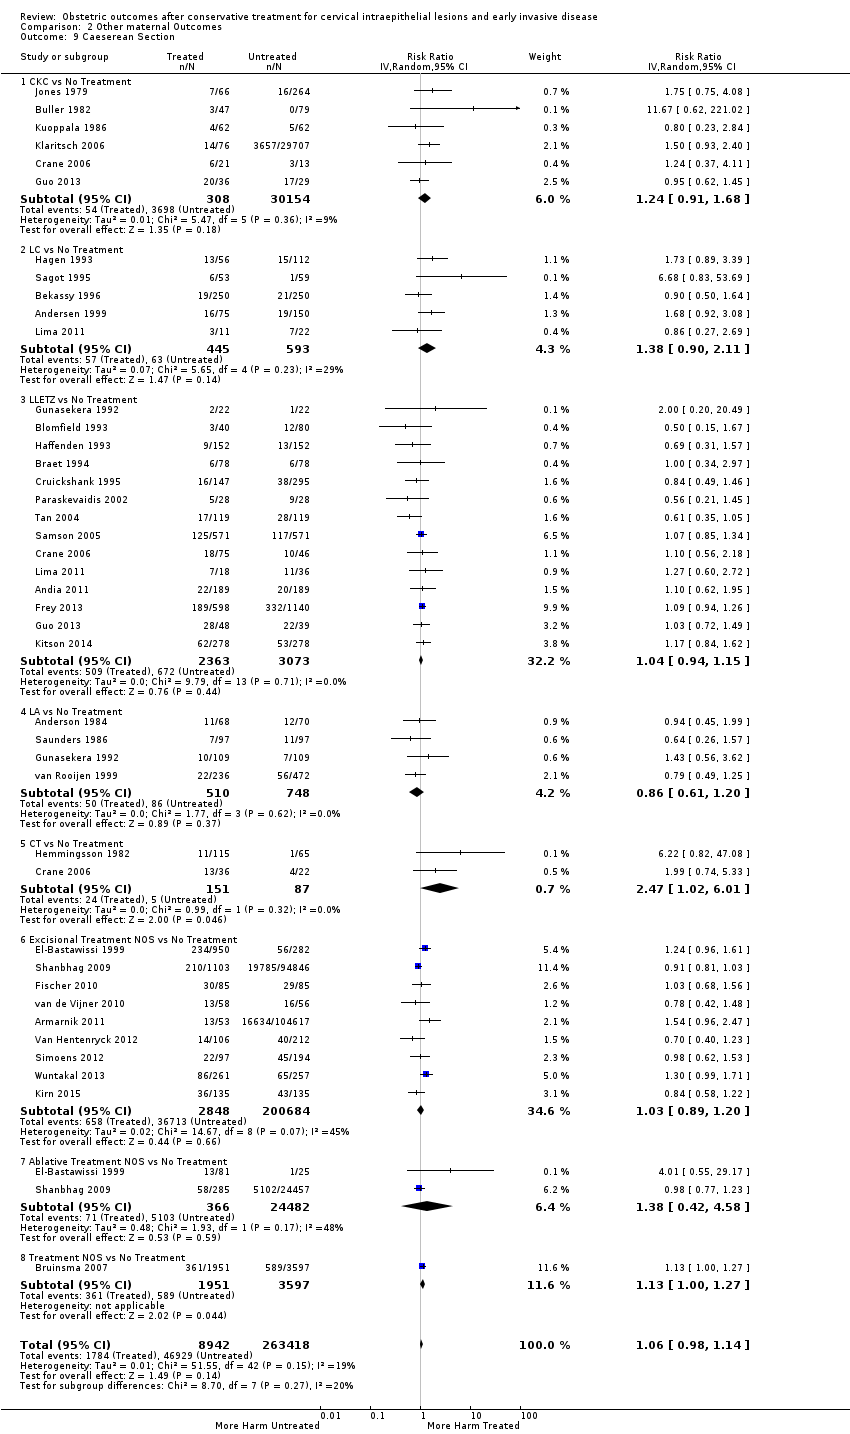 Comparison 2 Other maternal Outcomes, Outcome 9 Caeserean Section. | ||||
| 9.1 CKC vs No Treatment | 6 | 30462 | Risk Ratio (IV, Random, 95% CI) | 1.24 [0.91, 1.68] |
| 9.2 LC vs No Treatment | 5 | 1038 | Risk Ratio (IV, Random, 95% CI) | 1.38 [0.90, 2.11] |
| 9.3 LLETZ vs No Treatment | 14 | 5436 | Risk Ratio (IV, Random, 95% CI) | 1.04 [0.94, 1.15] |
| 9.4 LA vs No Treatment | 4 | 1258 | Risk Ratio (IV, Random, 95% CI) | 0.86 [0.61, 1.20] |
| 9.5 CT vs No Treatment | 2 | 238 | Risk Ratio (IV, Random, 95% CI) | 2.47 [1.02, 6.01] |
| 9.6 Excisional Treatment NOS vs No Treatment | 9 | 203532 | Risk Ratio (IV, Random, 95% CI) | 1.03 [0.89, 1.20] |
| 9.7 Ablative Treatment NOS vs No Treatment | 2 | 24848 | Risk Ratio (IV, Random, 95% CI) | 1.38 [0.42, 4.58] |
| 9.8 Treatment NOS vs No Treatment | 1 | 5548 | Risk Ratio (IV, Random, 95% CI) | 1.13 [1.00, 1.27] |
| 10 Instrumental Deliveries (ventouse/forceps) Show forest plot | 16 | 9588 | Risk Ratio (IV, Random, 95% CI) | 0.97 [0.88, 1.08] |
| Analysis 2.10 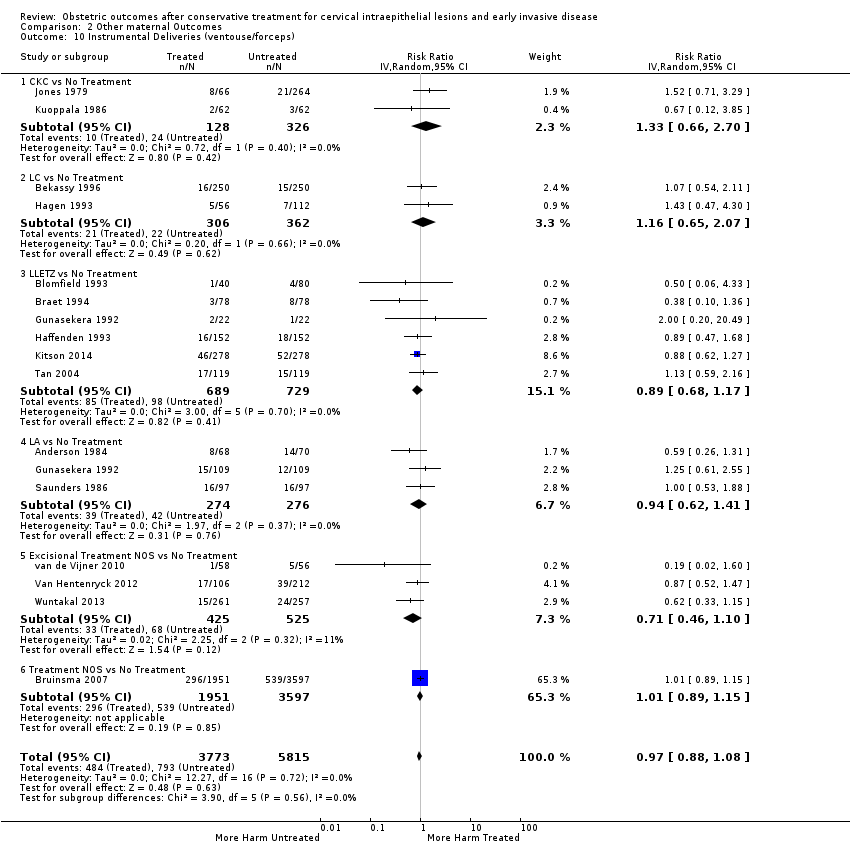 Comparison 2 Other maternal Outcomes, Outcome 10 Instrumental Deliveries (ventouse/forceps). | ||||
| 10.1 CKC vs No Treatment | 2 | 454 | Risk Ratio (IV, Random, 95% CI) | 1.33 [0.66, 2.70] |
| 10.2 LC vs No Treatment | 2 | 668 | Risk Ratio (IV, Random, 95% CI) | 1.16 [0.65, 2.07] |
| 10.3 LLETZ vs No Treatment | 6 | 1418 | Risk Ratio (IV, Random, 95% CI) | 0.89 [0.68, 1.17] |
| 10.4 LA vs No Treatment | 3 | 550 | Risk Ratio (IV, Random, 95% CI) | 0.94 [0.62, 1.41] |
| 10.5 Excisional Treatment NOS vs No Treatment | 3 | 950 | Risk Ratio (IV, Random, 95% CI) | 0.71 [0.46, 1.10] |
| 10.6 Treatment NOS vs No Treatment | 1 | 5548 | Risk Ratio (IV, Random, 95% CI) | 1.01 [0.89, 1.15] |
| 11 Precipitous Labour (<2hours) Show forest plot | 5 | 1059 | Risk Ratio (IV, Random, 95% CI) | 1.26 [0.80, 1.96] |
| Analysis 2.11  Comparison 2 Other maternal Outcomes, Outcome 11 Precipitous Labour (<2hours). | ||||
| 11.1 CKC vs No Treatment | 2 | 289 | Risk Ratio (IV, Random, 95% CI) | 1.24 [0.47, 3.27] |
| 11.2 LLETZ vs No Treatment | 4 | 770 | Risk Ratio (IV, Random, 95% CI) | 1.26 [0.76, 2.08] |
| 12 Prolonged labour (>12hours) Show forest plot | 7 | 1854 | Risk Ratio (IV, Random, 95% CI) | 1.25 [0.92, 1.69] |
| Analysis 2.12 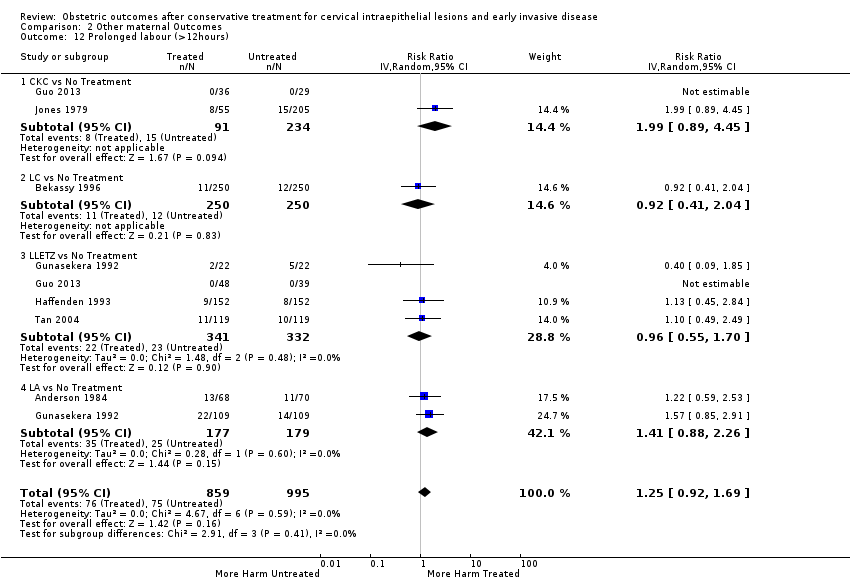 Comparison 2 Other maternal Outcomes, Outcome 12 Prolonged labour (>12hours). | ||||
| 12.1 CKC vs No Treatment | 2 | 325 | Risk Ratio (IV, Random, 95% CI) | 1.99 [0.89, 4.45] |
| 12.2 LC vs No Treatment | 1 | 500 | Risk Ratio (IV, Random, 95% CI) | 0.92 [0.41, 2.04] |
| 12.3 LLETZ vs No Treatment | 4 | 673 | Risk Ratio (IV, Random, 95% CI) | 0.96 [0.55, 1.70] |
| 12.4 LA vs No Treatment | 2 | 356 | Risk Ratio (IV, Random, 95% CI) | 1.41 [0.88, 2.26] |
| 13 Induction of Labour Show forest plot | 11 | 4668 | Risk Ratio (IV, Random, 95% CI) | 1.01 [0.89, 1.15] |
| Analysis 2.13 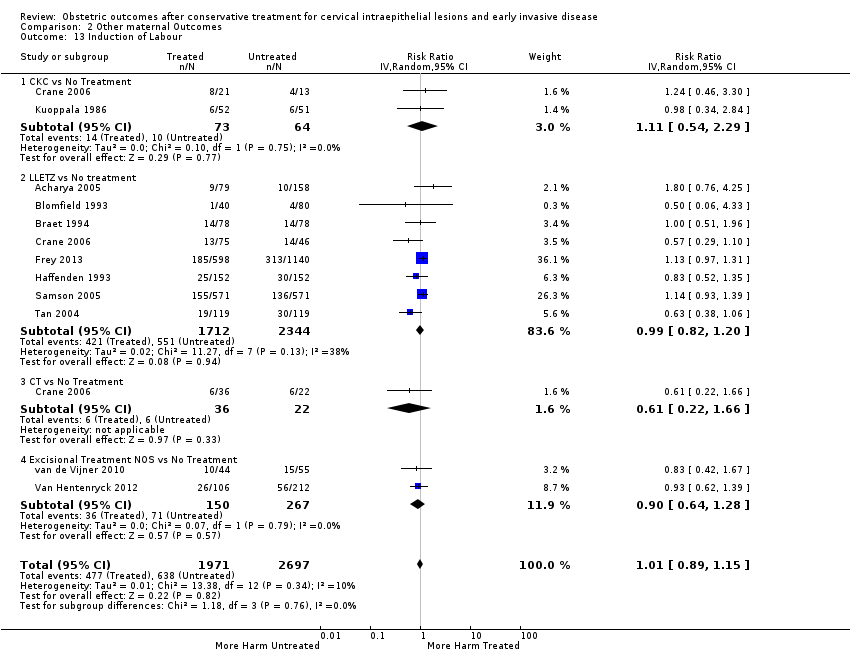 Comparison 2 Other maternal Outcomes, Outcome 13 Induction of Labour. | ||||
| 13.1 CKC vs No Treatment | 2 | 137 | Risk Ratio (IV, Random, 95% CI) | 1.11 [0.54, 2.29] |
| 13.2 LLETZ vs No treatment | 8 | 4056 | Risk Ratio (IV, Random, 95% CI) | 0.99 [0.82, 1.20] |
| 13.3 CT vs No Treatment | 1 | 58 | Risk Ratio (IV, Random, 95% CI) | 0.61 [0.22, 1.66] |
| 13.4 Excisional Treatment NOS vs No Treatment | 2 | 417 | Risk Ratio (IV, Random, 95% CI) | 0.90 [0.64, 1.28] |
| 14 Oxytocin Use Show forest plot | 6 | 2006 | Risk Ratio (IV, Random, 95% CI) | 0.90 [0.64, 1.26] |
| Analysis 2.14  Comparison 2 Other maternal Outcomes, Outcome 14 Oxytocin Use. | ||||
| 14.1 CKC vs No Treatment | 1 | 103 | Risk Ratio (IV, Random, 95% CI) | 0.98 [0.59, 1.63] |
| 14.2 LLETZ vs No Treatment | 4 | 1804 | Risk Ratio (IV, Random, 95% CI) | 0.76 [0.43, 1.34] |
| 14.3 Excisional Treatment NOS vs No Treatment | 1 | 99 | Risk Ratio (IV, Random, 95% CI) | 1.18 [0.67, 2.05] |
| 15 Epidural Use Show forest plot | 5 | 105488 | Risk Ratio (IV, Random, 95% CI) | 1.02 [0.68, 1.53] |
| Analysis 2.15  Comparison 2 Other maternal Outcomes, Outcome 15 Epidural Use. | ||||
| 15.1 LLETZ vs No Treatment | 4 | 818 | Risk Ratio (IV, Random, 95% CI) | 0.86 [0.64, 1.16] |
| 15.2 Excisional Treatment NOS vs No Treatment | 1 | 104670 | Risk Ratio (IV, Random, 95% CI) | 1.79 [1.29, 2.50] |
| 16 Pethidine Use Show forest plot | 2 | 394 | Risk Ratio (IV, Random, 95% CI) | 0.94 [0.72, 1.24] |
| Analysis 2.16  Comparison 2 Other maternal Outcomes, Outcome 16 Pethidine Use. | ||||
| 16.1 LLETZ vs No treatment | 2 | 394 | Risk Ratio (IV, Random, 95% CI) | 0.94 [0.72, 1.24] |
| 17 Analgesia Use NOS Show forest plot | 1 | 103 | Risk Ratio (IV, Random, 95% CI) | 1.11 [0.62, 1.98] |
| Analysis 2.17  Comparison 2 Other maternal Outcomes, Outcome 17 Analgesia Use NOS. | ||||
| 17.1 CKC vs No Treatment | 1 | 103 | Risk Ratio (IV, Random, 95% CI) | 1.11 [0.62, 1.98] |
| 18 Cervical stenosis Show forest plot | 2 | 680 | Risk Ratio (IV, Random, 95% CI) | 2.26 [0.24, 21.59] |
| Analysis 2.18  Comparison 2 Other maternal Outcomes, Outcome 18 Cervical stenosis. | ||||
| 18.1 LC vs No Treatment | 1 | 500 | Risk Ratio (IV, Random, 95% CI) | 3.0 [0.12, 73.29] |
| 18.2 CT vs No Treatment | 1 | 180 | Risk Ratio (IV, Random, 95% CI) | 1.71 [0.07, 41.31] |
| 19 Antepartum Haemorrhage Show forest plot | 4 | 1245 | Risk Ratio (IV, Random, 95% CI) | 1.11 [0.40, 3.12] |
| Analysis 2.19 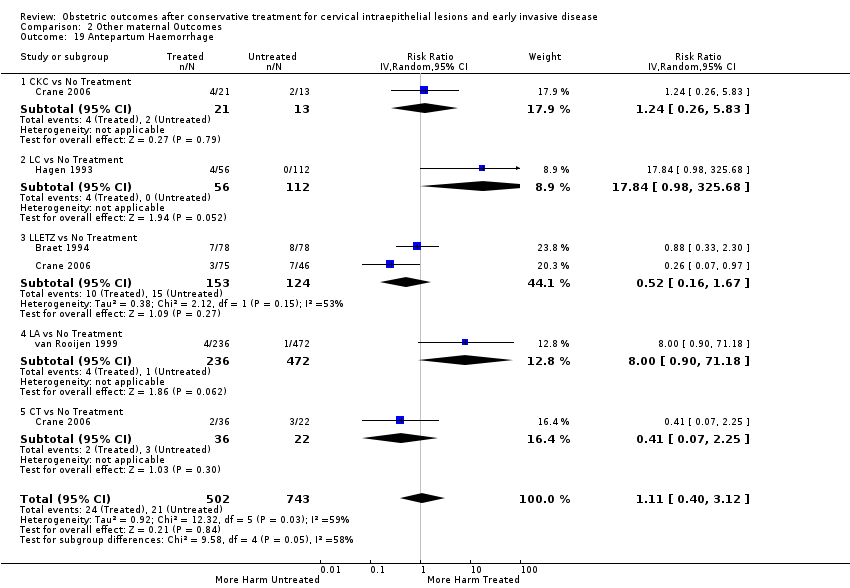 Comparison 2 Other maternal Outcomes, Outcome 19 Antepartum Haemorrhage. | ||||
| 19.1 CKC vs No Treatment | 1 | 34 | Risk Ratio (IV, Random, 95% CI) | 1.24 [0.26, 5.83] |
| 19.2 LC vs No Treatment | 1 | 168 | Risk Ratio (IV, Random, 95% CI) | 17.84 [0.98, 325.68] |
| 19.3 LLETZ vs No Treatment | 2 | 277 | Risk Ratio (IV, Random, 95% CI) | 0.52 [0.16, 1.67] |
| 19.4 LA vs No Treatment | 1 | 708 | Risk Ratio (IV, Random, 95% CI) | 8.00 [0.90, 71.18] |
| 19.5 CT vs No Treatment | 1 | 58 | Risk Ratio (IV, Random, 95% CI) | 0.41 [0.07, 2.25] |
| 20 Postpartum Haemorrhage (>600ml) Show forest plot | 1 | 149 | Risk Ratio (IV, Random, 95% CI) | 4.60 [1.38, 15.36] |
| Analysis 2.20  Comparison 2 Other maternal Outcomes, Outcome 20 Postpartum Haemorrhage (>600ml). | ||||
| 20.1 CKC vs No Treatment | 1 | 149 | Risk Ratio (IV, Random, 95% CI) | 4.60 [1.38, 15.36] |
| 21 Massive Obstetric Haemorrhage (>1000ml) Show forest plot | 1 | 149 | Risk Ratio (IV, Random, 95% CI) | 3.95 [0.45, 34.48] |
| Analysis 2.21  Comparison 2 Other maternal Outcomes, Outcome 21 Massive Obstetric Haemorrhage (>1000ml). | ||||
| 21.1 CKC vs No Treatment | 1 | 149 | Risk Ratio (IV, Random, 95% CI) | 3.95 [0.45, 34.48] |
| 22 Cervical cerclage Show forest plot | 8 | 141300 | Risk Ratio (IV, Random, 95% CI) | 14.29 [2.85, 71.65] |
| Analysis 2.22  Comparison 2 Other maternal Outcomes, Outcome 22 Cervical cerclage. | ||||
| 22.1 CKC vs No Treatment | 3 | 30744 | Risk Ratio (IV, Random, 95% CI) | 31.42 [2.32, 426.22] |
| 22.2 LC vs No Treatment | 1 | 112 | Risk Ratio (IV, Random, 95% CI) | 6.68 [0.83, 53.69] |
| 22.3 LLETZ vs No Treatment | 1 | 56 | Risk Ratio (IV, Random, 95% CI) | 11.00 [0.64, 189.96] |
| 22.4 Excisional Treatment NOS vs No Treatment | 2 | 104840 | Risk Ratio (IV, Random, 95% CI) | 42.45 [28.99, 62.16] |
| 22.5 Treatment NOS vs No Treatment | 1 | 5548 | Risk Ratio (IV, Random, 95% CI) | 2.16 [1.24, 3.76] |
| Outcome or subgroup title | No. of studies | No. of participants | Statistical method | Effect size |
| 1 LBW (<2500g) Show forest plot | 30 | 1.348206E6 | Risk Ratio (IV, Random, 95% CI) | 1.81 [1.58, 2.07] |
| Analysis 3.1  Comparison 3 Neonatal Outcomes, Outcome 1 LBW (<2500g). | ||||
| 1.1 CKC vs No Treatment | 5 | 30304 | Risk Ratio (IV, Random, 95% CI) | 2.51 [1.78, 3.53] |
| 1.2 LC vs No Treatment | 4 | 786 | Risk Ratio (IV, Random, 95% CI) | 1.76 [0.72, 4.35] |
| 1.3 LLETZ vs No Treatment | 12 | 3357 | Risk Ratio (IV, Random, 95% CI) | 2.11 [1.51, 2.94] |
| 1.4 LA vs No Treatment | 4 | 1104 | Risk Ratio (IV, Random, 95% CI) | 1.07 [0.59, 1.92] |
| 1.5 CT vs No Treatment | 1 | 58 | Risk Ratio (IV, Random, 95% CI) | 3.67 [0.47, 28.47] |
| 1.6 Excisional Treatment NOS vs No Treatment | 10 | 823648 | Risk Ratio (IV, Random, 95% CI) | 2.01 [1.62, 2.49] |
| 1.7 Ablative Treatment NOS vs No Treatment | 4 | 483402 | Risk Ratio (IV, Random, 95% CI) | 1.36 [1.19, 1.55] |
| 1.8 Treatment NOS vs No Treatment | 1 | 5547 | Risk Ratio (IV, Random, 95% CI) | 1.35 [1.14, 1.60] |
| 2 LBW (<2000g) Show forest plot | 3 | 74981 | Risk Ratio (IV, Random, 95% CI) | 2.49 [0.97, 6.36] |
| Analysis 3.2 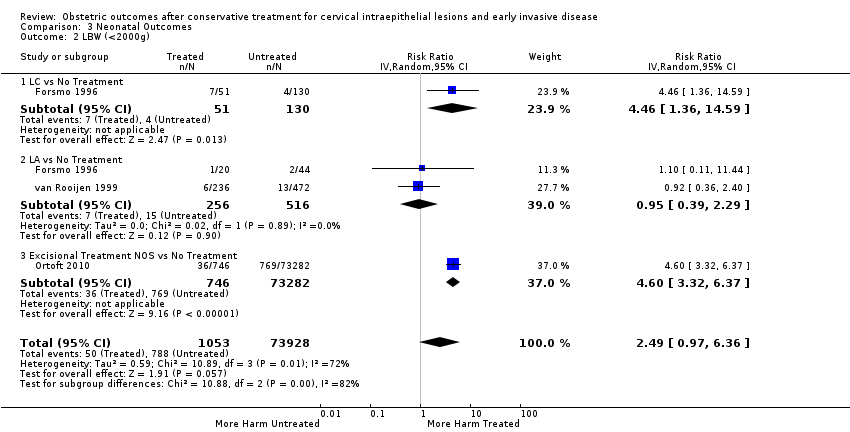 Comparison 3 Neonatal Outcomes, Outcome 2 LBW (<2000g). | ||||
| 2.1 LC vs No Treatment | 1 | 181 | Risk Ratio (IV, Random, 95% CI) | 4.46 [1.36, 14.59] |
| 2.2 LA vs No Treatment | 2 | 772 | Risk Ratio (IV, Random, 95% CI) | 0.95 [0.39, 2.29] |
| 2.3 Excisional Treatment NOS vs No Treatment | 1 | 74028 | Risk Ratio (IV, Random, 95% CI) | 4.60 [3.32, 6.37] |
| 3 LBW (<1500g) Show forest plot | 5 | 76836 | Risk Ratio (IV, Random, 95% CI) | 3.00 [1.54, 5.85] |
| Analysis 3.3  Comparison 3 Neonatal Outcomes, Outcome 3 LBW (<1500g). | ||||
| 3.1 LC vs No Treatment | 1 | 181 | Risk Ratio (IV, Random, 95% CI) | 12.75 [1.53, 106.44] |
| 3.2 LLETZ vs No Treatment | 1 | 378 | Risk Ratio (IV, Random, 95% CI) | 7.0 [0.36, 134.59] |
| 3.3 LA vs No Treatment | 2 | 772 | Risk Ratio (IV, Random, 95% CI) | 0.68 [0.16, 2.80] |
| 3.4 Excisional Treatment NOS vs No Treatment | 2 | 75505 | Risk Ratio (IV, Random, 95% CI) | 3.34 [2.02, 5.54] |
| 4 LBW (<1000g) Show forest plot | 2 | 2185 | Risk Ratio (IV, Random, 95% CI) | 2.09 [0.06, 74.71] |
| Analysis 3.4 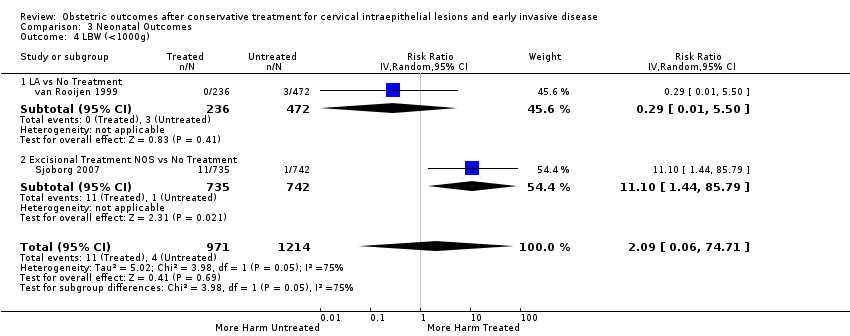 Comparison 3 Neonatal Outcomes, Outcome 4 LBW (<1000g). | ||||
| 4.1 LA vs No Treatment | 1 | 708 | Risk Ratio (IV, Random, 95% CI) | 0.29 [0.01, 5.50] |
| 4.2 Excisional Treatment NOS vs No Treatment | 1 | 1477 | Risk Ratio (IV, Random, 95% CI) | 11.10 [1.44, 85.79] |
| 5 NICU Admission Show forest plot | 8 | 2557 | Risk Ratio (IV, Random, 95% CI) | 1.45 [1.16, 1.81] |
| Analysis 3.5 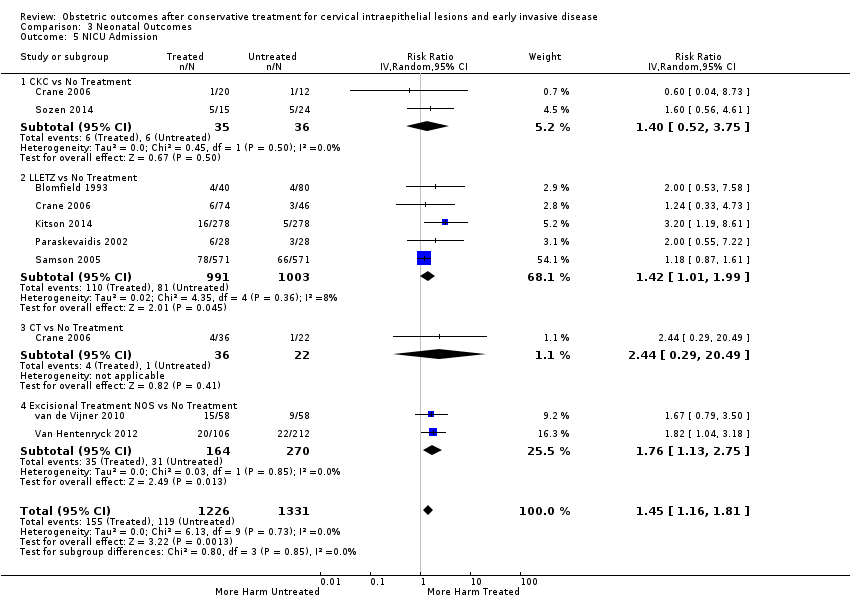 Comparison 3 Neonatal Outcomes, Outcome 5 NICU Admission. | ||||
| 5.1 CKC vs No Treatment | 2 | 71 | Risk Ratio (IV, Random, 95% CI) | 1.40 [0.52, 3.75] |
| 5.2 LLETZ vs No Treatment | 5 | 1994 | Risk Ratio (IV, Random, 95% CI) | 1.42 [1.01, 1.99] |
| 5.3 CT vs No Treatment | 1 | 58 | Risk Ratio (IV, Random, 95% CI) | 2.44 [0.29, 20.49] |
| 5.4 Excisional Treatment NOS vs No Treatment | 2 | 434 | Risk Ratio (IV, Random, 95% CI) | 1.76 [1.13, 2.75] |
| 6 Perinatal Mortality Show forest plot | 23 | 1.659433E6 | Risk Ratio (IV, Random, 95% CI) | 1.51 [1.13, 2.03] |
| Analysis 3.6 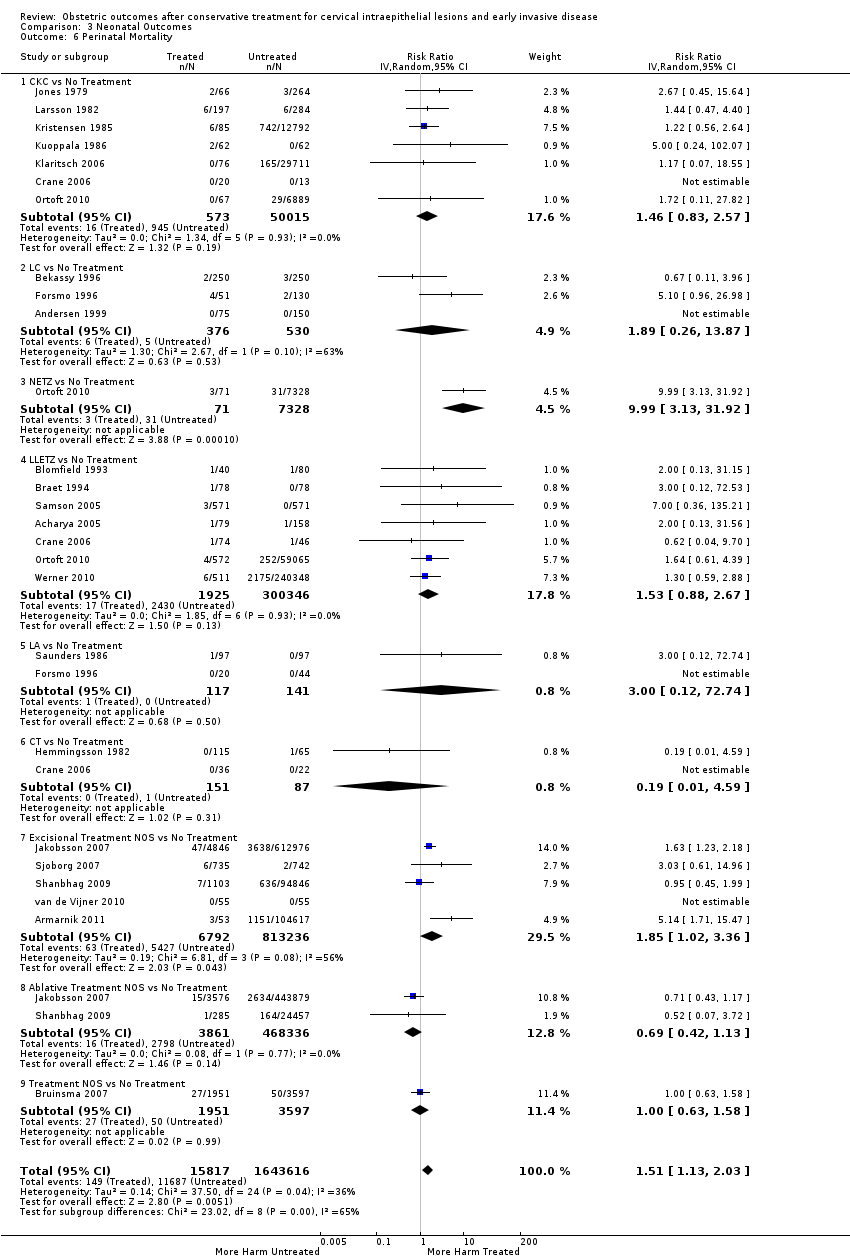 Comparison 3 Neonatal Outcomes, Outcome 6 Perinatal Mortality. | ||||
| 6.1 CKC vs No Treatment | 7 | 50588 | Risk Ratio (IV, Random, 95% CI) | 1.46 [0.83, 2.57] |
| 6.2 LC vs No Treatment | 3 | 906 | Risk Ratio (IV, Random, 95% CI) | 1.89 [0.26, 13.87] |
| 6.3 NETZ vs No Treatment | 1 | 7399 | Risk Ratio (IV, Random, 95% CI) | 9.99 [3.13, 31.92] |
| 6.4 LLETZ vs No Treatment | 7 | 302271 | Risk Ratio (IV, Random, 95% CI) | 1.53 [0.88, 2.67] |
| 6.5 LA vs No Treatment | 2 | 258 | Risk Ratio (IV, Random, 95% CI) | 3.0 [0.12, 72.74] |
| 6.6 CT vs No Treatment | 2 | 238 | Risk Ratio (IV, Random, 95% CI) | 0.19 [0.01, 4.59] |
| 6.7 Excisional Treatment NOS vs No Treatment | 5 | 820028 | Risk Ratio (IV, Random, 95% CI) | 1.85 [1.02, 3.36] |
| 6.8 Ablative Treatment NOS vs No Treatment | 2 | 472197 | Risk Ratio (IV, Random, 95% CI) | 0.69 [0.42, 1.13] |
| 6.9 Treatment NOS vs No Treatment | 1 | 5548 | Risk Ratio (IV, Random, 95% CI) | 1.00 [0.63, 1.58] |
| 7 Perinatal Mortality (<37w) Show forest plot | 1 | 73992 | Risk Ratio (IV, Random, 95% CI) | 9.40 [2.01, 43.89] |
| Analysis 3.7  Comparison 3 Neonatal Outcomes, Outcome 7 Perinatal Mortality (<37w). | ||||
| 7.1 CKC vs No Treatment | 1 | 6956 | Risk Ratio (IV, Random, 95% CI) | 5.33 [0.31, 90.71] |
| 7.2 NETZ vs No Treatment | 1 | 7399 | Risk Ratio (IV, Random, 95% CI) | 30.96 [8.71, 110.13] |
| 7.3 LLETZ vs No Treatment | 1 | 59637 | Risk Ratio (IV, Random, 95% CI) | 3.92 [1.24, 12.38] |
| 8 Perinatal Mortality (<32w) Show forest plot | 1 | 73992 | Risk Ratio (IV, Random, 95% CI) | 12.81 [2.70, 60.87] |
| Analysis 3.8  Comparison 3 Neonatal Outcomes, Outcome 8 Perinatal Mortality (<32w). | ||||
| 8.1 CKC vs No Treatment | 1 | 6956 | Risk Ratio (IV, Random, 95% CI) | 6.75 [0.39, 117.10] |
| 8.2 NETZ vs No Treatment | 1 | 7399 | Risk Ratio (IV, Random, 95% CI) | 44.23 [11.67, 167.61] |
| 8.3 LLETZ vs No Treatment | 1 | 59637 | Risk Ratio (IV, Random, 95% CI) | 5.43 [1.71, 17.30] |
| 9 Perinatal Mortality (<28w) Show forest plot | 1 | 73992 | Risk Ratio (IV, Random, 95% CI) | 13.76 [2.37, 79.89] |
| Analysis 3.9  Comparison 3 Neonatal Outcomes, Outcome 9 Perinatal Mortality (<28w). | ||||
| 9.1 CKC vs No Treatment | 1 | 6956 | Risk Ratio (IV, Random, 95% CI) | 9.21 [0.51, 164.95] |
| 9.2 NETZ vs No Treatment | 1 | 7399 | Risk Ratio (IV, Random, 95% CI) | 51.61 [13.17, 202.29] |
| 9.3 LLETZ vs No Treatment | 1 | 59637 | Risk Ratio (IV, Random, 95% CI) | 4.49 [1.09, 18.45] |
| 10 Stillbirth Show forest plot | 12 | 249855 | Risk Ratio (IV, Random, 95% CI) | 0.98 [0.63, 1.52] |
| Analysis 3.10  Comparison 3 Neonatal Outcomes, Outcome 10 Stillbirth. | ||||
| 10.1 CKC vs No Treatment | 3 | 935 | Risk Ratio (IV, Random, 95% CI) | 1.61 [0.48, 5.40] |
| 10.2 LC vs No Treatment | 2 | 725 | Risk Ratio (IV, Random, 95% CI) | 0.33 [0.03, 3.18] |
| 10.3 LLETZ vs No Treatment | 4 | 242473 | Risk Ratio (IV, Random, 95% CI) | 1.42 [0.62, 3.26] |
| 10.4 LA vs No Treatment | 1 | 64 | Risk Ratio (IV, Random, 95% CI) | 0.0 [0.0, 0.0] |
| 10.5 Excisional Treatment NOS vs No Treatment | 1 | 110 | Risk Ratio (IV, Random, 95% CI) | 0.0 [0.0, 0.0] |
| 10.6 Treatment NOS vs No Treatment | 1 | 5548 | Risk Ratio (IV, Random, 95% CI) | 0.77 [0.42, 1.40] |
| 11 Apgar score (≤5)(1min) Show forest plot | 1 | 225 | Risk Ratio (IV, Random, 95% CI) | 0.57 [0.12, 2.68] |
| Analysis 3.11  Comparison 3 Neonatal Outcomes, Outcome 11 Apgar score (≤5)(1min). | ||||
| 11.1 LC vs No Treatment | 1 | 225 | Risk Ratio (IV, Random, 95% CI) | 0.57 [0.12, 2.68] |
| 12 Apgar score (<7)(1min) Show forest plot | 1 | 152 | Risk Ratio (IV, Random, 95% CI) | 0.63 [0.07, 5.71] |
| Analysis 3.12  Comparison 3 Neonatal Outcomes, Outcome 12 Apgar score (<7)(1min). | ||||
| 12.1 LLETZ vs No Treatment | 1 | 87 | Risk Ratio (IV, Random, 95% CI) | 0.16 [0.01, 3.30] |
| 12.2 CKC vs No Treatment | 1 | 65 | Risk Ratio (IV, Random, 95% CI) | 1.61 [0.15, 16.90] |
| 13 Apgar score (<7)(5min) Show forest plot | 2 | 297 | Risk Ratio (IV, Random, 95% CI) | 0.82 [0.19, 3.59] |
| Analysis 3.13 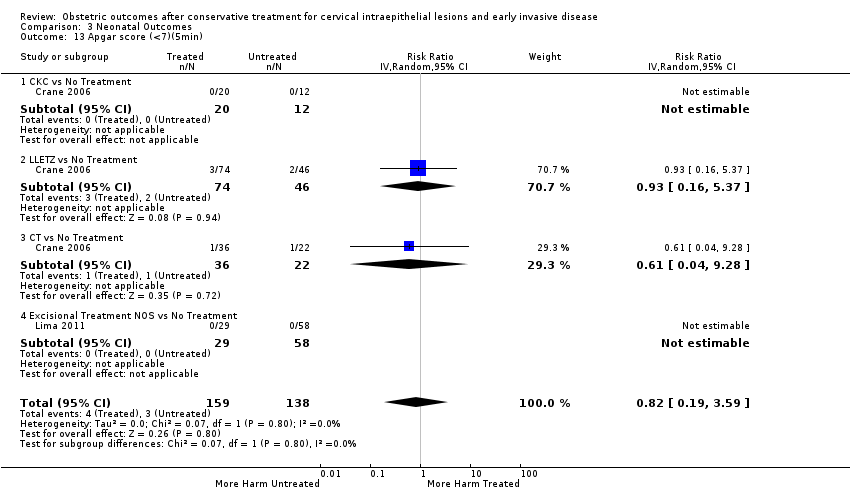 Comparison 3 Neonatal Outcomes, Outcome 13 Apgar score (<7)(5min). | ||||
| 13.1 CKC vs No Treatment | 1 | 32 | Risk Ratio (IV, Random, 95% CI) | 0.0 [0.0, 0.0] |
| 13.2 LLETZ vs No Treatment | 1 | 120 | Risk Ratio (IV, Random, 95% CI) | 0.93 [0.16, 5.37] |
| 13.3 CT vs No Treatment | 1 | 58 | Risk Ratio (IV, Random, 95% CI) | 0.61 [0.04, 9.28] |
| 13.4 Excisional Treatment NOS vs No Treatment | 1 | 87 | Risk Ratio (IV, Random, 95% CI) | 0.0 [0.0, 0.0] |

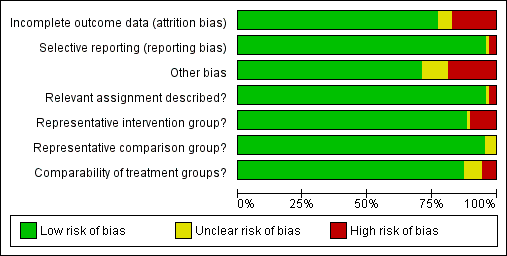
'Risk of bias' graph: review authors' judgements about each risk of bias item presented as percentages across all included studies.

'Risk of bias' summary: review authors' judgements about each risk of bias item for each included study.

Comparison 1 Maternal Outcomes‐PTB, Outcome 1 PTB (<37w).

Comparison 1 Maternal Outcomes‐PTB, Outcome 2 PTB (<37w)‐Analysis by treatment modality.

Comparison 1 Maternal Outcomes‐PTB, Outcome 3 PTB (<32‐34w).

Comparison 1 Maternal Outcomes‐PTB, Outcome 4 PTB (<32‐34w)‐Analysis by treatment modality.

Comparison 1 Maternal Outcomes‐PTB, Outcome 5 PTB (<28‐30w).

Comparison 1 Maternal Outcomes‐PTB, Outcome 6 PTB (<28‐30w)‐Analysis by treatment modality.
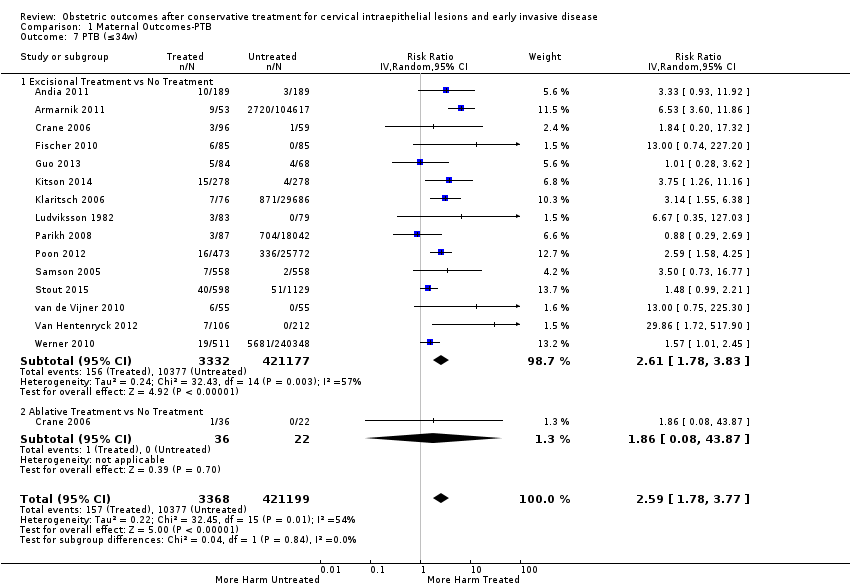
Comparison 1 Maternal Outcomes‐PTB, Outcome 7 PTB (≤34w).
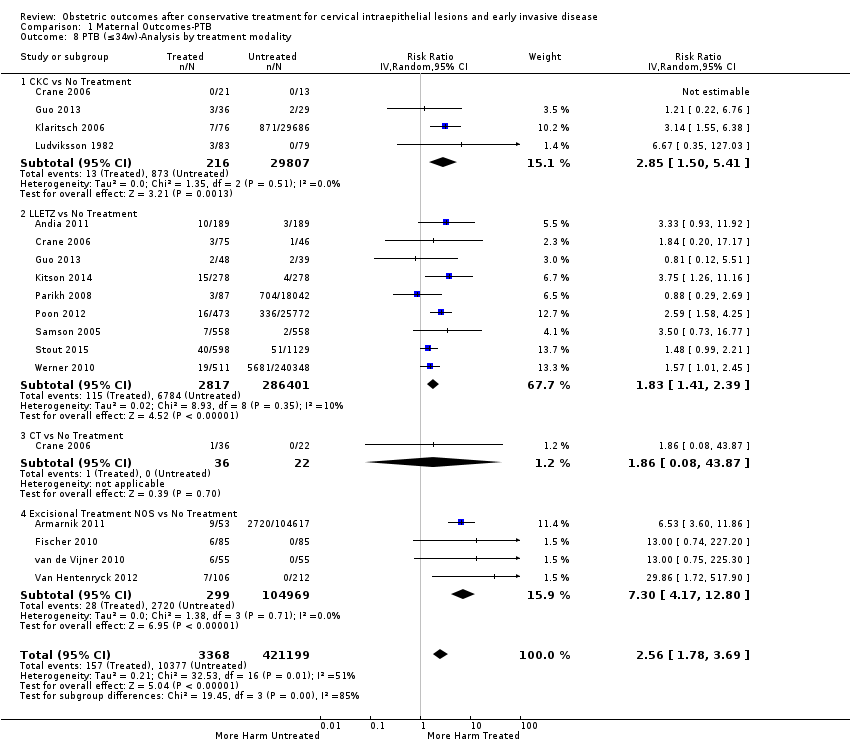
Comparison 1 Maternal Outcomes‐PTB, Outcome 8 PTB (≤34w)‐Analysis by treatment modality.

Comparison 1 Maternal Outcomes‐PTB, Outcome 9 PTB (<32‐33w).

Comparison 1 Maternal Outcomes‐PTB, Outcome 10 PTB (<32‐33w)‐Analysis by treatment modality.

Comparison 1 Maternal Outcomes‐PTB, Outcome 11 PTB (<30w).
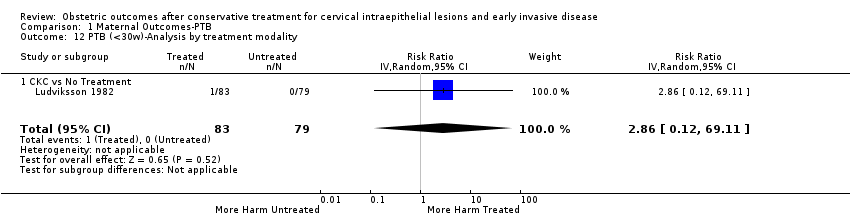
Comparison 1 Maternal Outcomes‐PTB, Outcome 12 PTB (<30w)‐Analysis by treatment modality.

Comparison 1 Maternal Outcomes‐PTB, Outcome 13 PTB (<28w).

Comparison 1 Maternal Outcomes‐PTB, Outcome 14 PTB (<28w)‐Analysis by treatment modality.

Comparison 1 Maternal Outcomes‐PTB, Outcome 15 PTB (<37w)‐Nulliparous women.

Comparison 1 Maternal Outcomes‐PTB, Outcome 16 PTB (<37w)‐Parous women.
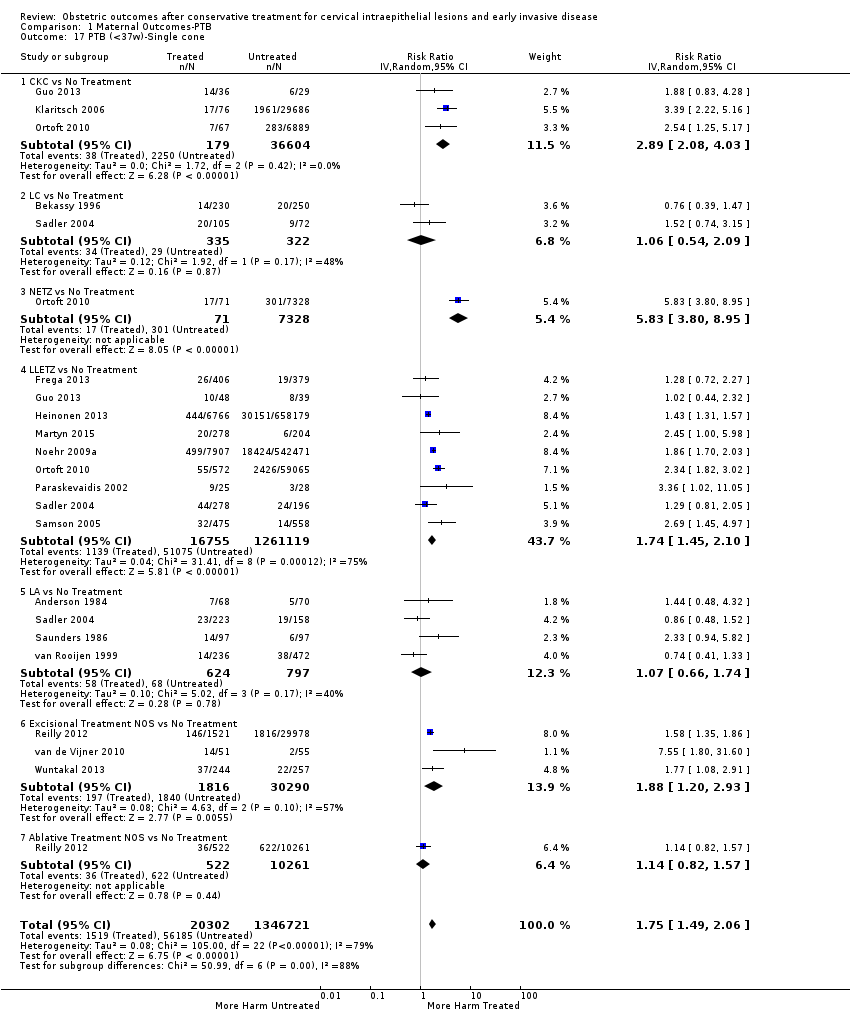
Comparison 1 Maternal Outcomes‐PTB, Outcome 17 PTB (<37w)‐Single cone.

Comparison 1 Maternal Outcomes‐PTB, Outcome 18 PTB (<37w)‐Repeat cones.

Comparison 1 Maternal Outcomes‐PTB, Outcome 19 PTB (<37w)‐Singleton pregnancies.

Comparison 1 Maternal Outcomes‐PTB, Outcome 20 PTB (<37w)‐Multiple pregnancies.
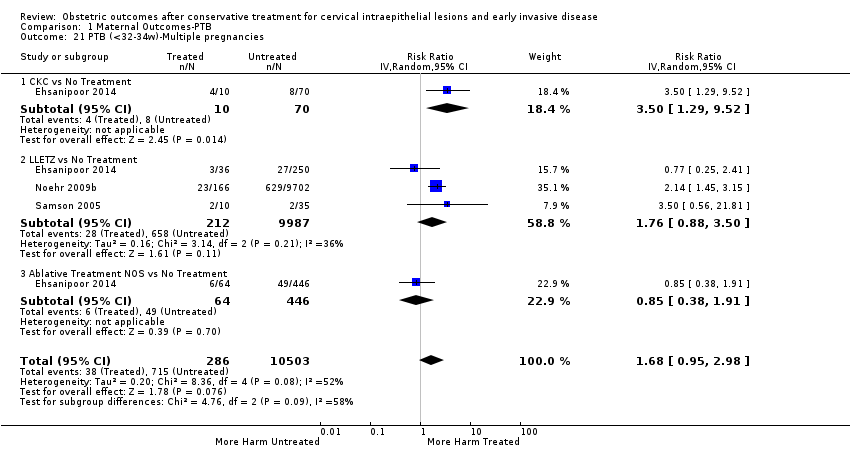
Comparison 1 Maternal Outcomes‐PTB, Outcome 21 PTB (<32‐34w)‐Multiple pregnancies.
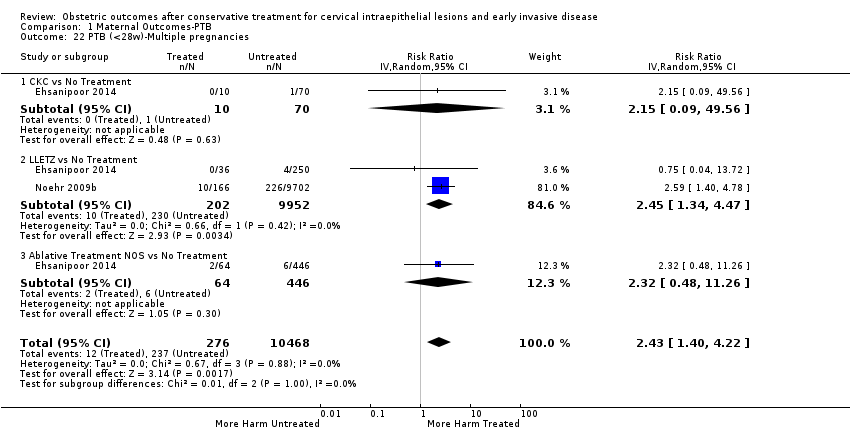
Comparison 1 Maternal Outcomes‐PTB, Outcome 22 PTB (<28w)‐Multiple pregnancies.

Comparison 1 Maternal Outcomes‐PTB, Outcome 23 PTB (<37w)‐Depth≤10‐12mm.

Comparison 1 Maternal Outcomes‐PTB, Outcome 24 PTB (<37w)‐Depth≥10‐12mm.

Comparison 1 Maternal Outcomes‐PTB, Outcome 25 PTB (<37w)‐Depth≥15‐17mm.

Comparison 1 Maternal Outcomes‐PTB, Outcome 26 PTB (<37w)‐Depth≥20mm.
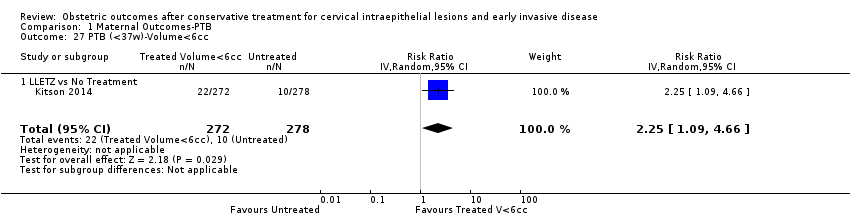
Comparison 1 Maternal Outcomes‐PTB, Outcome 27 PTB (<37w)‐Volume<6cc.

Comparison 1 Maternal Outcomes‐PTB, Outcome 28 PTB (<37w)‐Volume>6cc.

Comparison 1 Maternal Outcomes‐PTB, Outcome 29 PTB (<37w)‐Depth≤10mm.

Comparison 1 Maternal Outcomes‐PTB, Outcome 30 PTB (<37w)‐Depth≤12mm.
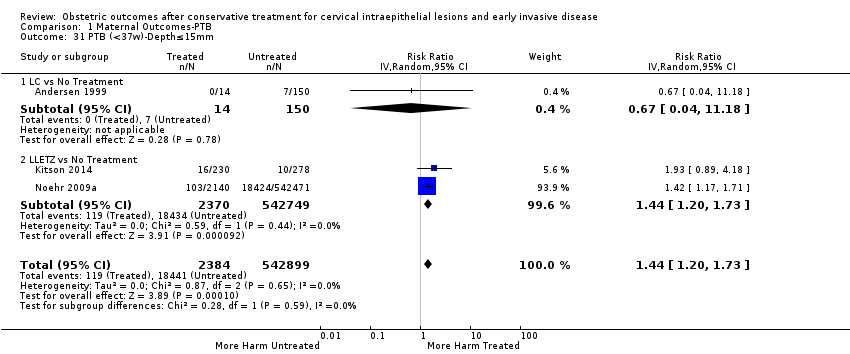
Comparison 1 Maternal Outcomes‐PTB, Outcome 31 PTB (<37w)‐Depth≤15mm.

Comparison 1 Maternal Outcomes‐PTB, Outcome 32 PTB (<37w)‐Depth≤17mm.
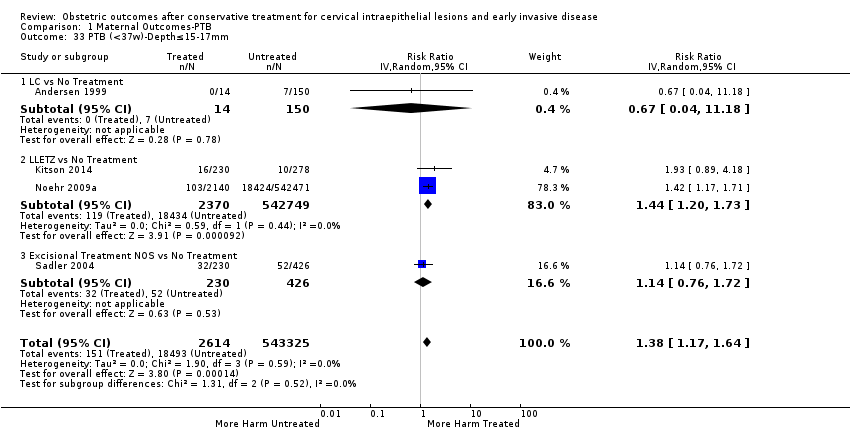
Comparison 1 Maternal Outcomes‐PTB, Outcome 33 PTB (<37w)‐Depth≤15‐17mm.

Comparison 1 Maternal Outcomes‐PTB, Outcome 34 PTB (<37w)‐Depth≤20mm.

Comparison 1 Maternal Outcomes‐PTB, Outcome 35 PTB (<37w)‐Depth≥10mm.

Comparison 1 Maternal Outcomes‐PTB, Outcome 36 PTB (<37w)‐Depth≥12mm.
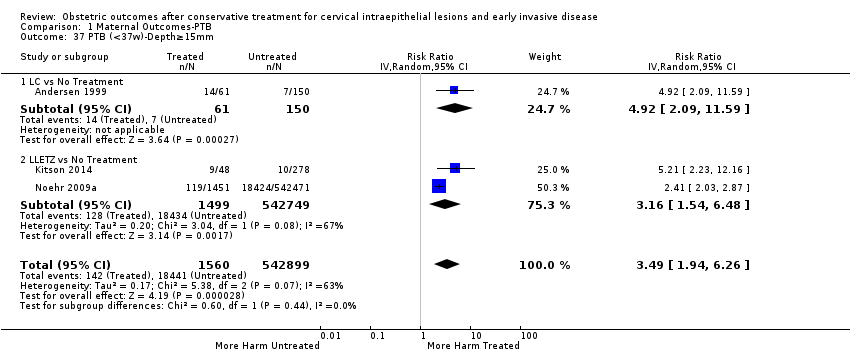
Comparison 1 Maternal Outcomes‐PTB, Outcome 37 PTB (<37w)‐Depth≥15mm.

Comparison 1 Maternal Outcomes‐PTB, Outcome 38 PTB (<37w)‐Depth≥17mm.

Comparison 1 Maternal Outcomes‐PTB, Outcome 39 PTB (<37w)‐Depth 10/13‐15/16mm.
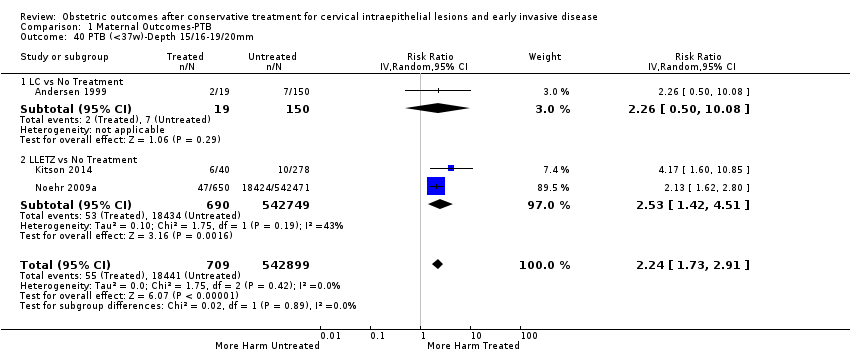
Comparison 1 Maternal Outcomes‐PTB, Outcome 40 PTB (<37w)‐Depth 15/16‐19/20mm.

Comparison 1 Maternal Outcomes‐PTB, Outcome 41 PTB (<37w)‐Volume<3cc.

Comparison 1 Maternal Outcomes‐PTB, Outcome 42 PTB (<37w)‐Volume>3cc.

Comparison 1 Maternal Outcomes‐PTB, Outcome 43 PTB (<37w)‐Depth≥10‐12mm vs ≤10‐12mm.

Comparison 1 Maternal Outcomes‐PTB, Outcome 44 PTB (<37w)‐Depth≥15‐17mm vs ≤15‐17mm.

Comparison 1 Maternal Outcomes‐PTB, Outcome 45 PTB (<37w)‐Depth≥20mm vs ≤20mm.
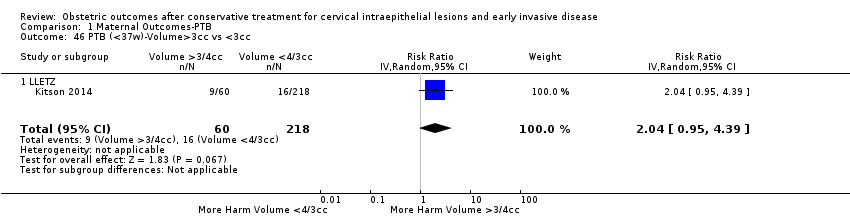
Comparison 1 Maternal Outcomes‐PTB, Outcome 46 PTB (<37w)‐Volume>3cc vs <3cc.
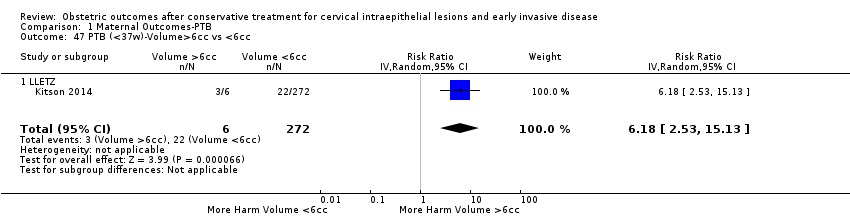
Comparison 1 Maternal Outcomes‐PTB, Outcome 47 PTB (<37w)‐Volume>6cc vs <6cc.

Comparison 1 Maternal Outcomes‐PTB, Outcome 48 PTB (<37w)‐Depth 11/13‐15/16mm vs ≤10‐12mm.

Comparison 1 Maternal Outcomes‐PTB, Outcome 49 PTB (<37w)‐Depth 16‐19mm vs 13‐15mm.
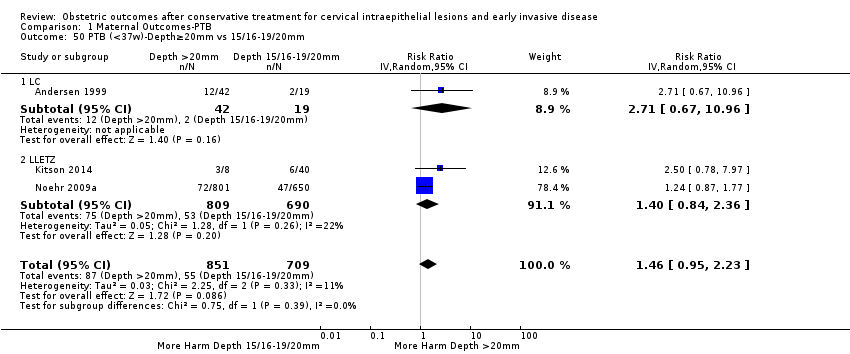
Comparison 1 Maternal Outcomes‐PTB, Outcome 50 PTB (<37w)‐Depth≥20mm vs 15/16‐19/20mm.
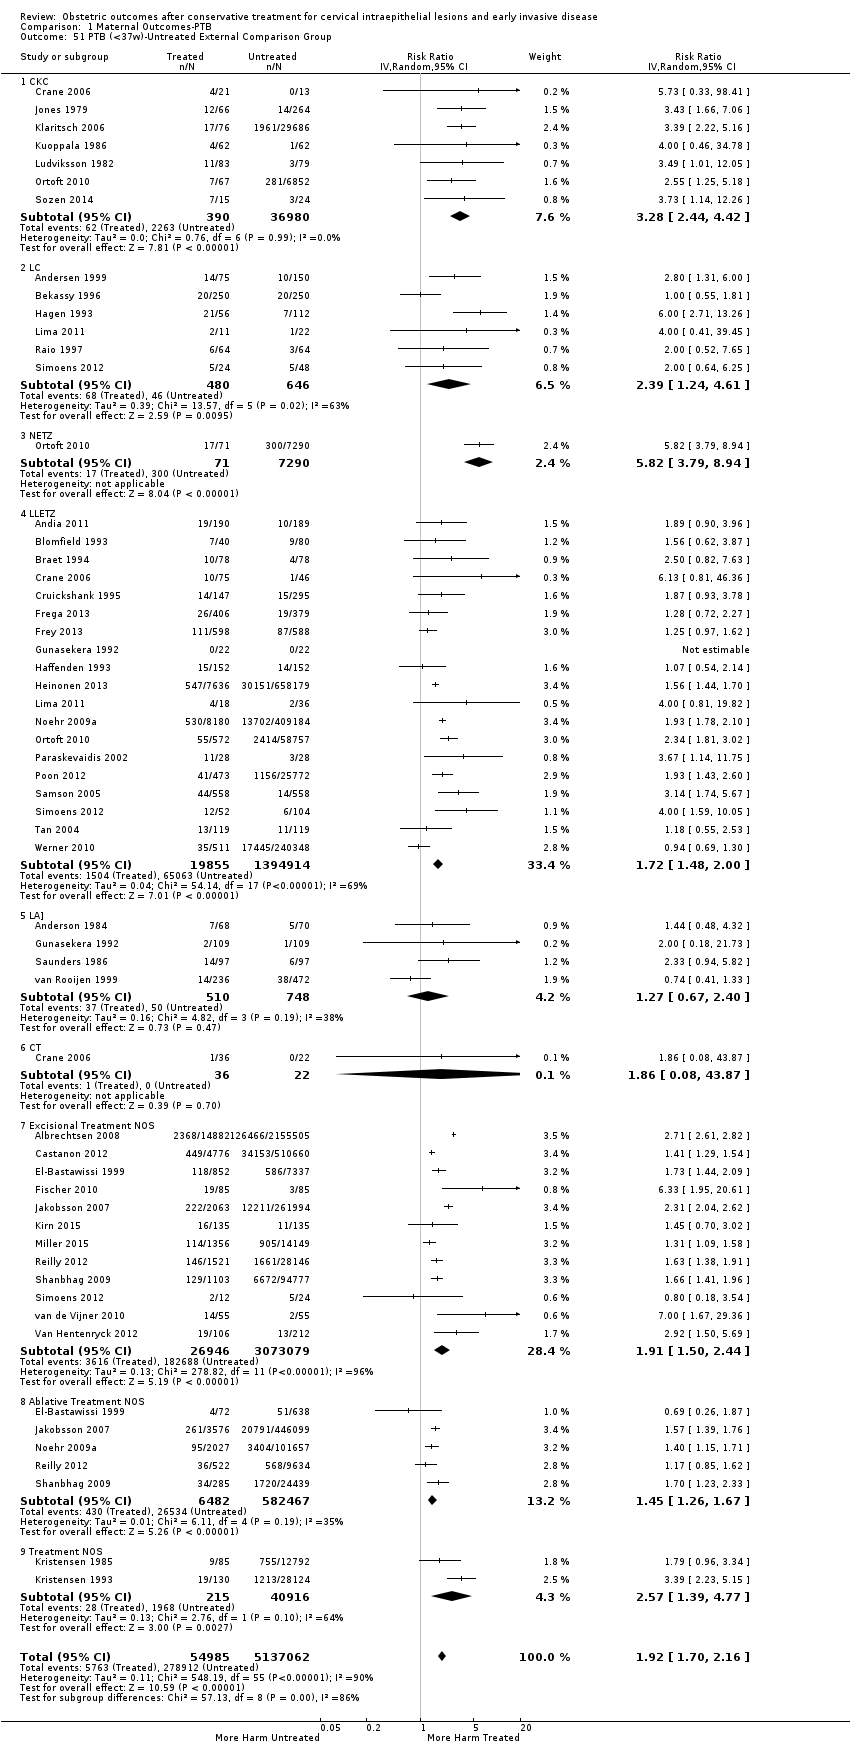
Comparison 1 Maternal Outcomes‐PTB, Outcome 51 PTB (<37w)‐Untreated External Comparison Group.

Comparison 1 Maternal Outcomes‐PTB, Outcome 52 PTB (<37w)‐Untreated Internal Comparison Group (self‐matching).

Comparison 1 Maternal Outcomes‐PTB, Outcome 53 PTB (<37w)‐Untreated Internal Comparison Group (pre‐treatment pregnancies).

Comparison 1 Maternal Outcomes‐PTB, Outcome 54 PTB (<37w)‐Untreated Colposcopy+/‐CIN+/‐Biopsy Comparison Group.

Comparison 1 Maternal Outcomes‐PTB, Outcome 55 PTB (<37w)‐Untreated HSIL Comparison Group.

Comparison 1 Maternal Outcomes‐PTB, Outcome 56 PTB (<37w)‐All Comparison Groups.
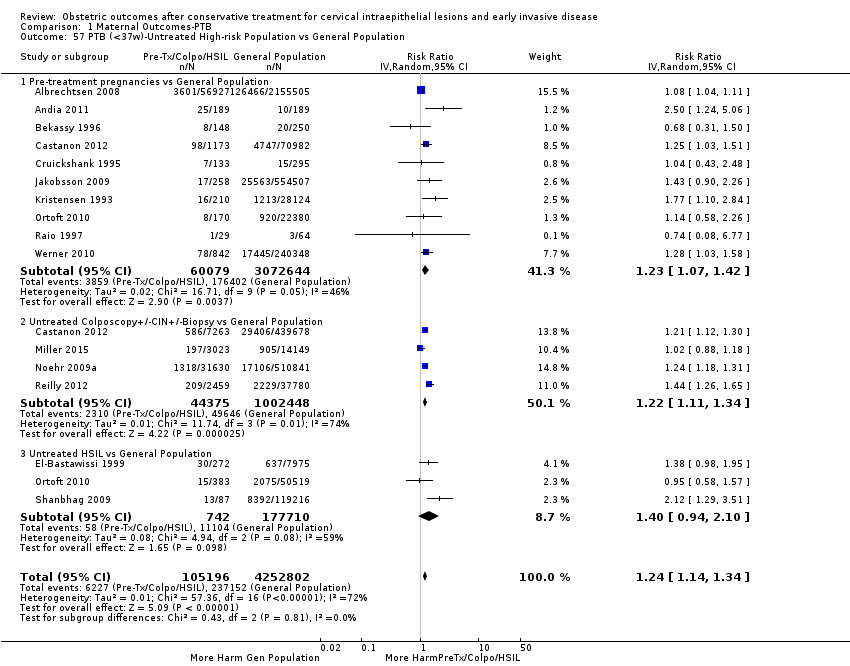
Comparison 1 Maternal Outcomes‐PTB, Outcome 57 PTB (<37w)‐Untreated High‐risk Population vs General Population.

Comparison 1 Maternal Outcomes‐PTB, Outcome 58 PTB (<37w)‐Depth≤10‐12mm vs Untreated External Comparison Group.

Comparison 1 Maternal Outcomes‐PTB, Outcome 59 PTB (<37w)‐Depth≤10‐12mm vs Untreated Internal Comparison Group.
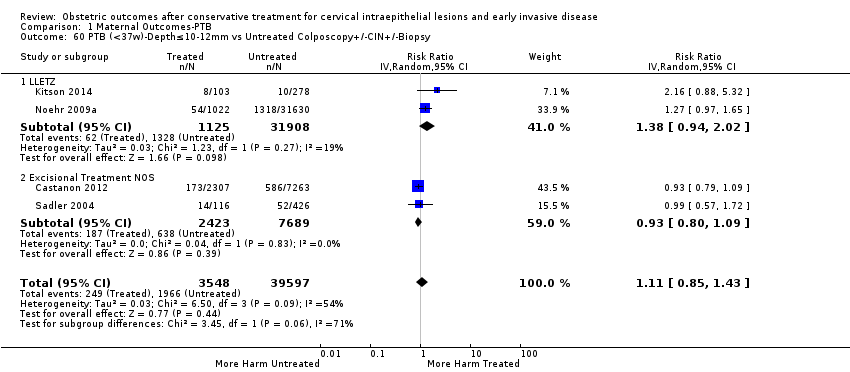
Comparison 1 Maternal Outcomes‐PTB, Outcome 60 PTB (<37w)‐Depth≤10‐12mm vs Untreated Colposcopy+/‐CIN+/‐Biopsy.

Comparison 1 Maternal Outcomes‐PTB, Outcome 61 PTB (<37w)‐Depth≤15‐17mm vs Untreated External Comparison Group.

Comparison 1 Maternal Outcomes‐PTB, Outcome 62 PTB (<37w)‐Depth≤15‐17mm vs Untreated Colposcopy+/‐CIN+/‐Biopsy.
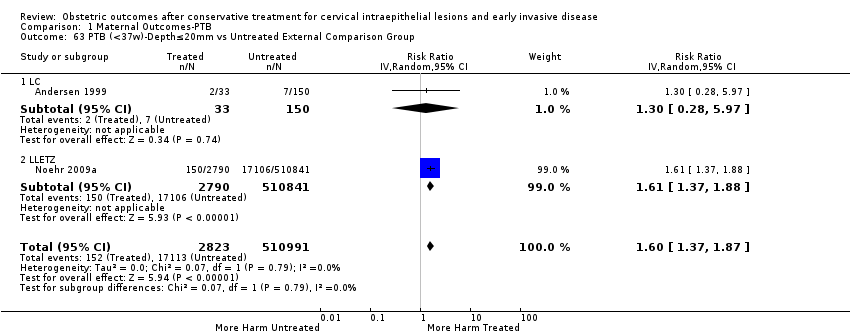
Comparison 1 Maternal Outcomes‐PTB, Outcome 63 PTB (<37w)‐Depth≤20mm vs Untreated External Comparison Group.
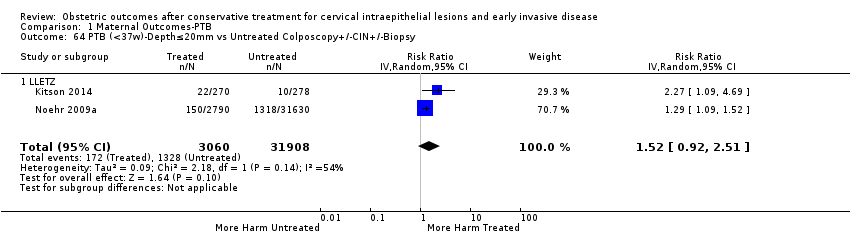
Comparison 1 Maternal Outcomes‐PTB, Outcome 64 PTB (<37w)‐Depth≤20mm vs Untreated Colposcopy+/‐CIN+/‐Biopsy.

Comparison 1 Maternal Outcomes‐PTB, Outcome 65 PTB (<37w)‐Depth≥10‐12mm vs Untreated External Comparison Group.

Comparison 1 Maternal Outcomes‐PTB, Outcome 66 PTB (<37w)‐Depth≥10‐12mm vs Untreated Internal Comparison Group.

Comparison 1 Maternal Outcomes‐PTB, Outcome 67 PTB (<37w)‐Depth≥10‐12mm vs Untreated Colposcopy+/‐CIN+/‐Biopsy.

Comparison 1 Maternal Outcomes‐PTB, Outcome 68 PTB (<37w)‐Depth≥15‐17mm vs Untreated External Comparison Group.
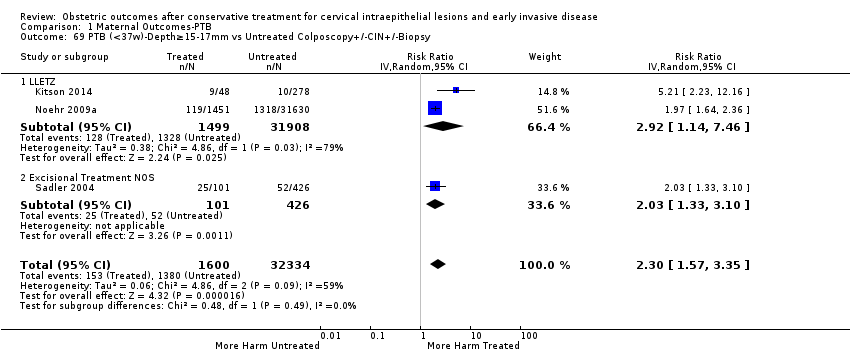
Comparison 1 Maternal Outcomes‐PTB, Outcome 69 PTB (<37w)‐Depth≥15‐17mm vs Untreated Colposcopy+/‐CIN+/‐Biopsy.

Comparison 1 Maternal Outcomes‐PTB, Outcome 70 PTB (<37w)‐Depth≥20mm vs Untreated External Comparison Group.

Comparison 1 Maternal Outcomes‐PTB, Outcome 71 PTB (<37w)‐Depth≥20mm vs Untreated Colposcopy+/‐CIN+/‐Biopsy.

Comparison 1 Maternal Outcomes‐PTB, Outcome 72 PTB (<37w)‐Depth 10/13‐15/16mm vs Untreated External Comparison Group.

Comparison 1 Maternal Outcomes‐PTB, Outcome 73 PTB (<37w)‐Depth 10/13‐15/16mm vs Untreated Colposcopy+/‐CIN+/‐Biopsy.

Comparison 1 Maternal Outcomes‐PTB, Outcome 74 PTB (<37w)‐Depth 15/16‐19/20mm vs Untreated External Comparison Group.

Comparison 1 Maternal Outcomes‐PTB, Outcome 75 PTB (<37w)‐Depth 15/16‐19/20mm vs Untreated Colposcopy+/‐CIN+/‐Biopsy.
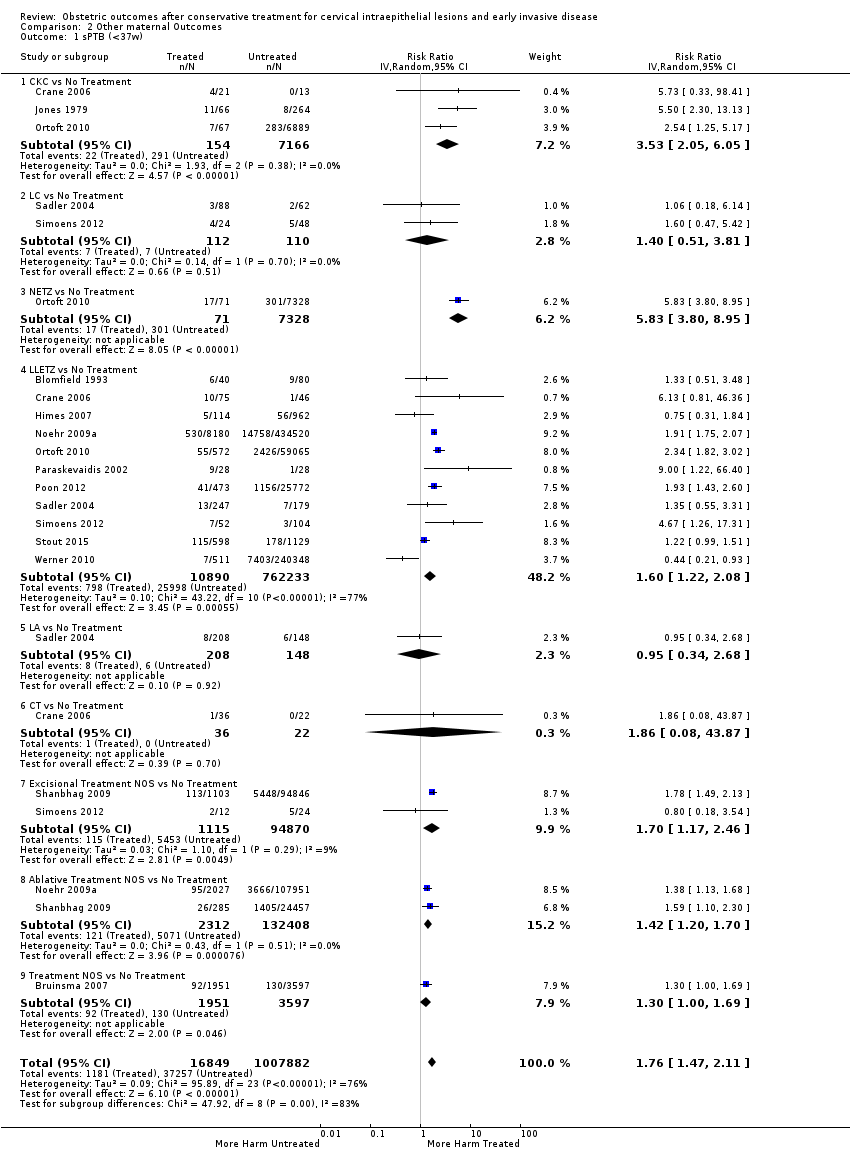
Comparison 2 Other maternal Outcomes, Outcome 1 sPTB (<37w).
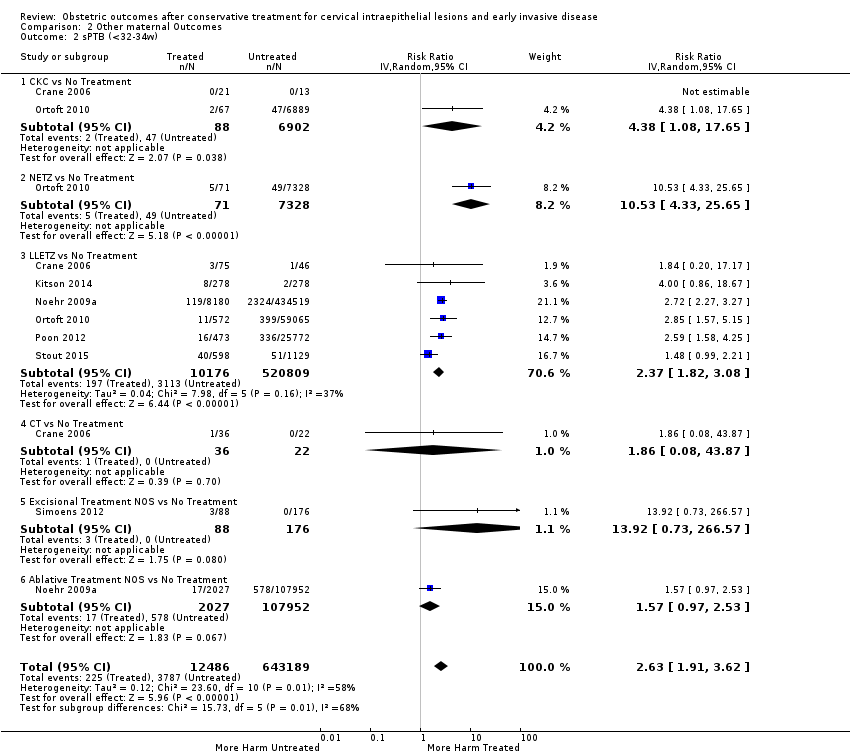
Comparison 2 Other maternal Outcomes, Outcome 2 sPTB (<32‐34w).

Comparison 2 Other maternal Outcomes, Outcome 3 sPTB (<28w).
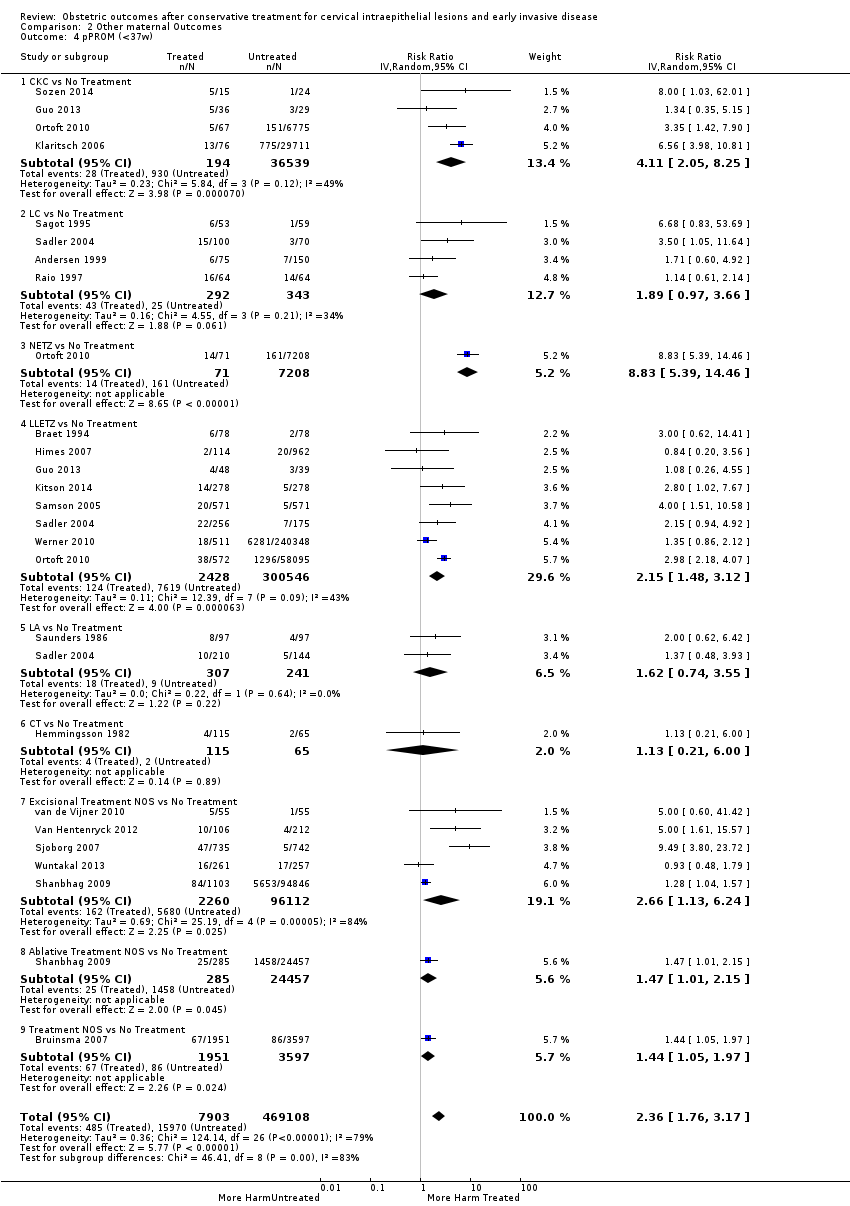
Comparison 2 Other maternal Outcomes, Outcome 4 pPROM (<37w).

Comparison 2 Other maternal Outcomes, Outcome 5 pPROM (<32w).
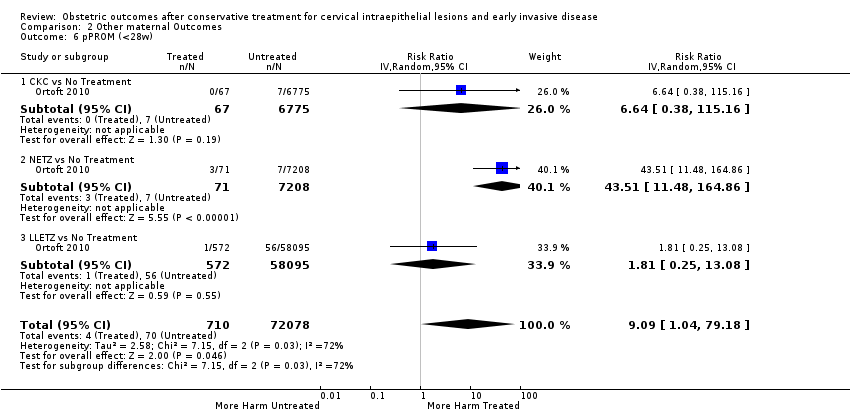
Comparison 2 Other maternal Outcomes, Outcome 6 pPROM (<28w).

Comparison 2 Other maternal Outcomes, Outcome 7 Threatened PTB.
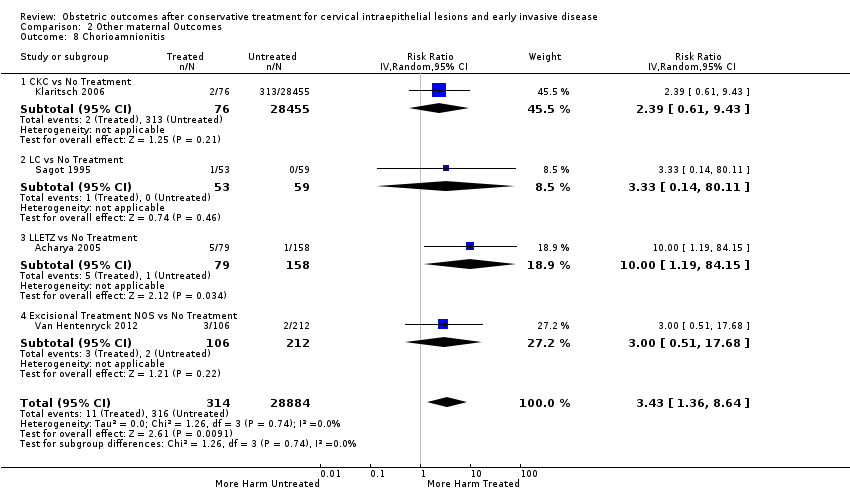
Comparison 2 Other maternal Outcomes, Outcome 8 Chorioamnionitis.

Comparison 2 Other maternal Outcomes, Outcome 9 Caeserean Section.

Comparison 2 Other maternal Outcomes, Outcome 10 Instrumental Deliveries (ventouse/forceps).
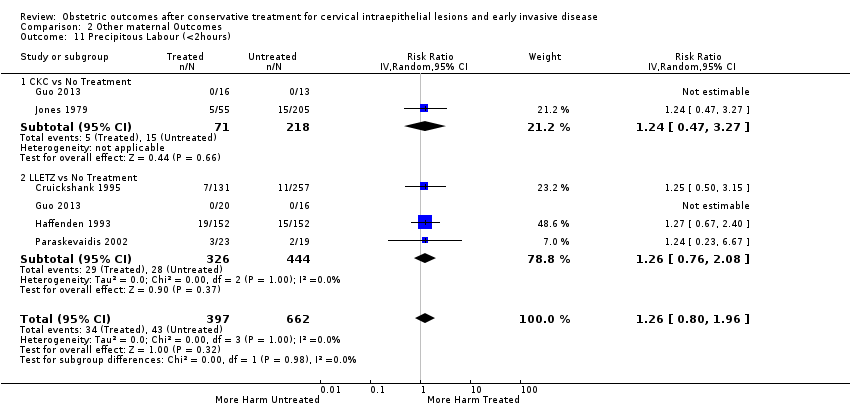
Comparison 2 Other maternal Outcomes, Outcome 11 Precipitous Labour (<2hours).

Comparison 2 Other maternal Outcomes, Outcome 12 Prolonged labour (>12hours).

Comparison 2 Other maternal Outcomes, Outcome 13 Induction of Labour.

Comparison 2 Other maternal Outcomes, Outcome 14 Oxytocin Use.

Comparison 2 Other maternal Outcomes, Outcome 15 Epidural Use.

Comparison 2 Other maternal Outcomes, Outcome 16 Pethidine Use.

Comparison 2 Other maternal Outcomes, Outcome 17 Analgesia Use NOS.

Comparison 2 Other maternal Outcomes, Outcome 18 Cervical stenosis.

Comparison 2 Other maternal Outcomes, Outcome 19 Antepartum Haemorrhage.
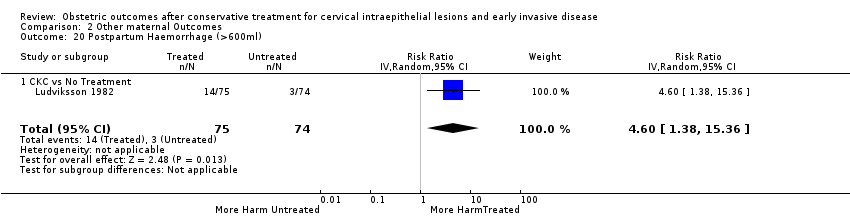
Comparison 2 Other maternal Outcomes, Outcome 20 Postpartum Haemorrhage (>600ml).

Comparison 2 Other maternal Outcomes, Outcome 21 Massive Obstetric Haemorrhage (>1000ml).
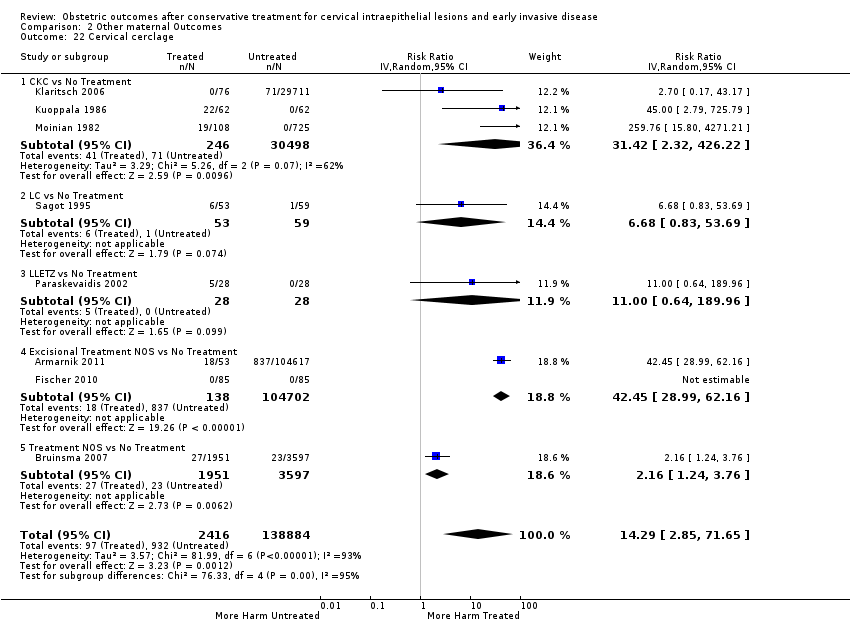
Comparison 2 Other maternal Outcomes, Outcome 22 Cervical cerclage.

Comparison 3 Neonatal Outcomes, Outcome 1 LBW (<2500g).

Comparison 3 Neonatal Outcomes, Outcome 2 LBW (<2000g).
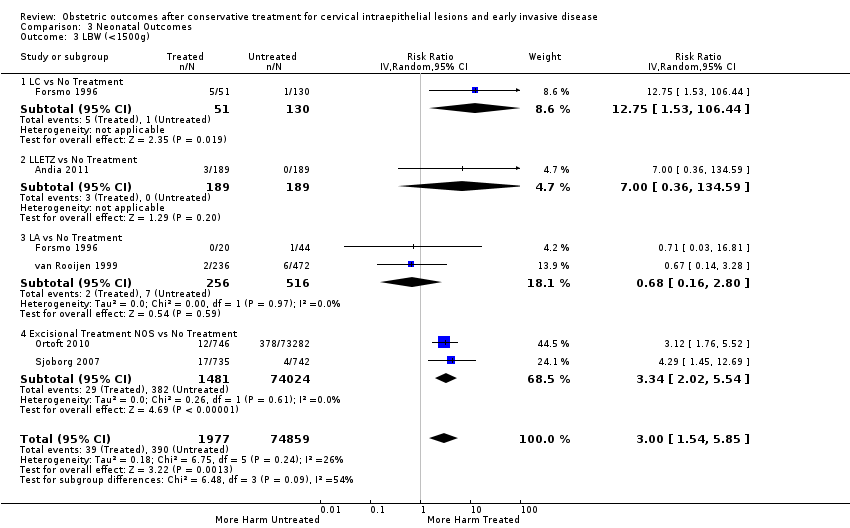
Comparison 3 Neonatal Outcomes, Outcome 3 LBW (<1500g).

Comparison 3 Neonatal Outcomes, Outcome 4 LBW (<1000g).

Comparison 3 Neonatal Outcomes, Outcome 5 NICU Admission.

Comparison 3 Neonatal Outcomes, Outcome 6 Perinatal Mortality.
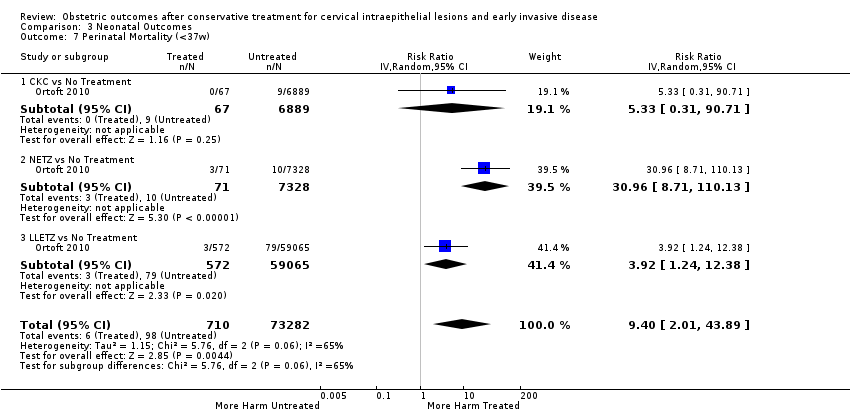
Comparison 3 Neonatal Outcomes, Outcome 7 Perinatal Mortality (<37w).
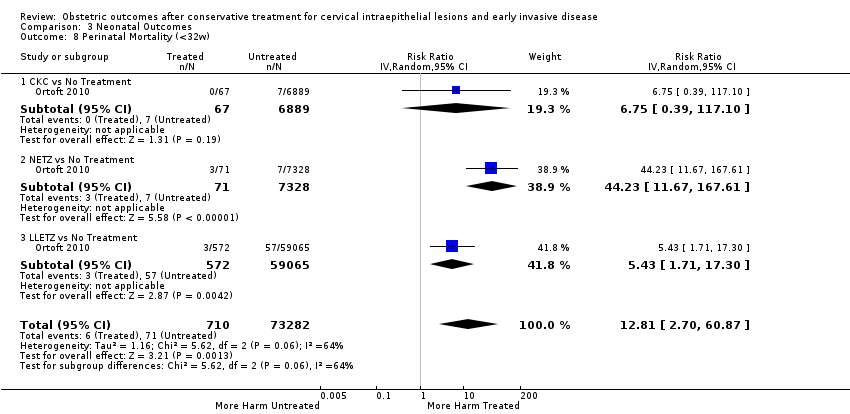
Comparison 3 Neonatal Outcomes, Outcome 8 Perinatal Mortality (<32w).
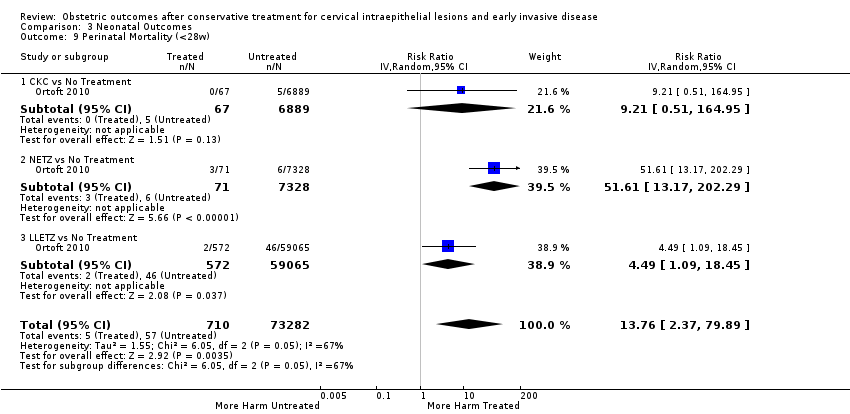
Comparison 3 Neonatal Outcomes, Outcome 9 Perinatal Mortality (<28w).
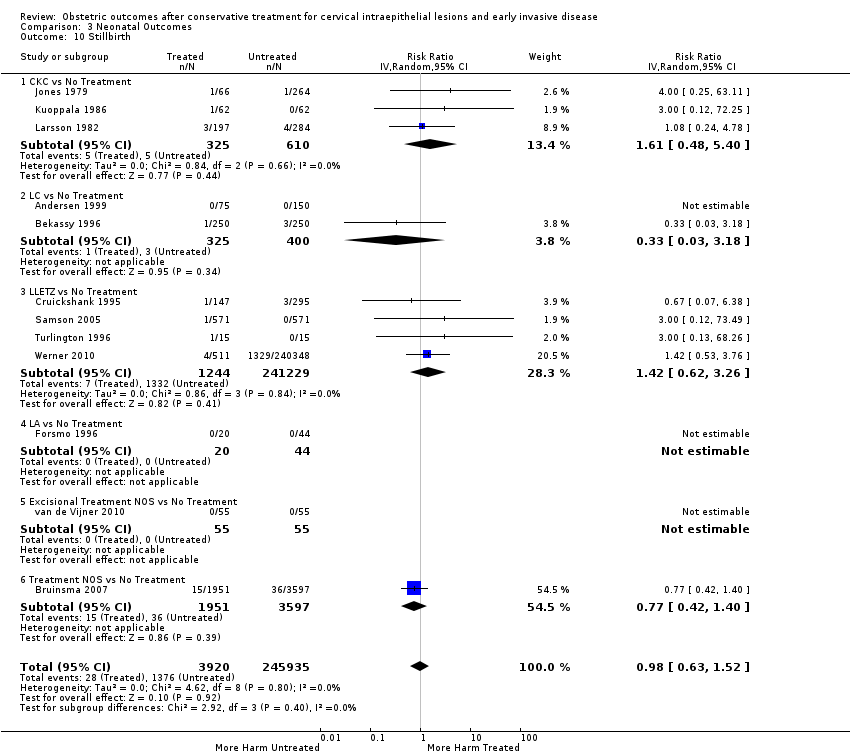
Comparison 3 Neonatal Outcomes, Outcome 10 Stillbirth.
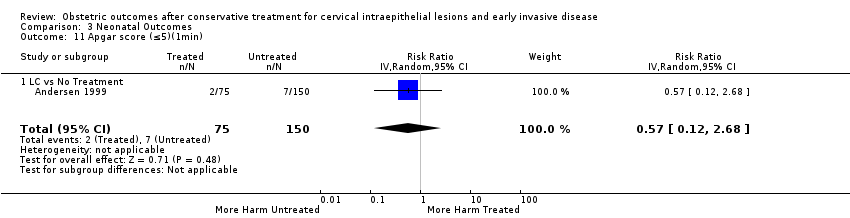
Comparison 3 Neonatal Outcomes, Outcome 11 Apgar score (≤5)(1min).

Comparison 3 Neonatal Outcomes, Outcome 12 Apgar score (<7)(1min).

Comparison 3 Neonatal Outcomes, Outcome 13 Apgar score (<7)(5min).
| The effect of treatment for CIN on maternal outcomes | ||||||
| Patient or population: women with known obstetric outcomes | ||||||
| Outcomes | Anticipated absolute effects* (95% CI) | Relative effect | № of participants | Quality of the evidence | Comments | |
| Risk with [comparison] | Risk with [intervention] | |||||
| PTB (< 37 w) | Study population | RR 1.75 | 5,242,917 | ⊕⊝⊝⊝ | ||
| 54 per 1000 | 95 per 1000 | |||||
| PTB (< 32 to 34 w) | Study population | RR 2.25 | 3,793,874 | ⊕⊝⊝⊝ | ||
| 14 per 1000 | 32 per 1000 | |||||
| PTB (< 28 to 30 w) | Study population | RR 2.23 | 3,910,629 | ⊕⊝⊝⊝ | ||
| 3 per 1000 | 7 per 1000 | |||||
| PTB (< 37 w) ‐ Repeat cones versus No Treatment | Study population | RR 3.78 | 1,317,284 | ⊕⊝⊝⊝ | ||
| 41 per 1000 | 156 per 1000 | |||||
| pPROM (<3 7 w) | Study population | RR 2.36 | 477,011 | ⊕⊝⊝⊝ | ||
| 34 per 1000 | 80 per 1000 | |||||
| PTB (< 37 w) ‐ Depth ≤ 10 mm to 12 mm versus No Treatment | Study population | RR 1.54 | 550,929 | ⊕⊝⊝⊝ | ||
| 34 per 1000 | 53 per 1000 | |||||
| PTB (< 37 w) ‐ PTB (< 37 w) ‐ Depth ≥10 mm to 12 mm versus No Treatment | Study population | RR 1.93 | 552,711 | ⊕⊕⊕⊝ | ||
| 34 per 1000 | 66 per 1000 | |||||
| PTB (< 37w) ‐ PTB (<37w) ‐ Depth ≥15 to 17mm versus No Treatment | Study population | RR 2.77 | 544,986 | ⊕⊕⊕⊕ | ||
| 34 per 1000 | 94 per 1000 | |||||
| PTB (< 37 w) ‐ PTB (< 37 w) ‐ Depth ≥ 20 mm versus No Treatment | Study population | RR 4.91 | 543,750 | ⊕⊕⊕⊕ | ||
| 34 per 1000 | 167 per 1000 | |||||
| *The risk in the intervention group (and its 95% confidence interval) is based on the assumed risk in the comparison group and the relative effect of the intervention (and its 95% CI). | ||||||
| GRADE Working Group grades of evidence | ||||||
| 1 Low‐quality evidence (based on observational studies only) is downgraded one level because of considerable heterogeneity (I2 90%) 2 Low‐quality evidence (based on observational studies only) is downgraded one level because of considerable heterogeneity (I2 83%) and suspected publication bias 3 Low‐quality evidence (based on observational studies only) is downgraded one level because of considerable heterogeneity (I2 84%) 4 Low‐quality evidence (based on observational studies only) is downgraded one level because of considerable heterogeneity (I2 75%) 5 Low‐quality evidence (based on observational studies only) is downgraded one level because of considerable heterogeneity (I2 79%) 6 Low‐quality evidence (based on observational studies only) is downgraded one level because of substantial heterogeneity (I2 67%) 7 Low‐quality evidence (based on observational studies only); heterogeneity was low (I2 37%) 8 Low‐quality evidence (based on observational studies only) is downgraded one level because of moderate heterogeneity (I2 53%) 9 Low‐quality evidence (based on observational studies only) is downgraded one level because of considerable heterogeneity (I2 77%) | ||||||
| The effect of treatment for CIN on neonatal outcomes | ||||||
| Patient or population: women with known obstetric outcomes | ||||||
| Outcomes | Anticipated absolute effects* (95% CI) | Relative effect | № of participants | Quality of the evidence | Comments | |
| Risk with No Treatment | Risk with Treatment | |||||
| LBW (< 2500 g) ‐ Treatment versus No Treatment | Study population | RR 1.81 | 1,348,206 | ⊕⊝⊝⊝ | ||
| 37 per 1000 | 66 per 1000 | |||||
| NICU Admission ‐ Treatment versus No Treatment | Study population | RR 1.45 | 2557 | ⊕⊕⊝⊝ | ||
| 89 per 1000 | 130 per 1000 | |||||
| Perinatal Mortality ‐ Treatment versus No Treatment | Study population | RR 1.51 | 1,659,433 | ⊕⊕⊝⊝ | ||
| 7 per 1000 | 11 per 1000 | |||||
| *The risk in the intervention group (and its 95% confidence interval) is based on the assumed risk in the comparison group and the relative effect of the intervention (and its 95% CI). | ||||||
| GRADE Working Group grades of evidence | ||||||
| 1 Low‐quality evidence (based on observational studies only) is downgraded one level because of substantial heterogeneity (I2 63%) | ||||||
| Outcome or subgroup title | No. of studies | No. of participants | Statistical method | Effect size |
| 1 PTB (<37w) Show forest plot | 59 | 5.242917E6 | Risk Ratio (IV, Random, 95% CI) | 1.75 [1.57, 1.96] |
| 1.1 Excisional Treatment vs No Treatment | 53 | 4.599416E6 | Risk Ratio (IV, Random, 95% CI) | 1.87 [1.64, 2.12] |
| 1.2 Ablative Treatment vs No Treatment | 14 | 602370 | Risk Ratio (IV, Random, 95% CI) | 1.35 [1.20, 1.52] |
| 1.3 Treatment NOS vs No Treatment | 2 | 41131 | Risk Ratio (IV, Random, 95% CI) | 2.57 [1.39, 4.77] |
| 2 PTB (<37w)‐Analysis by treatment modality Show forest plot | 59 | 5.242917E6 | Risk Ratio (IV, Random, 95% CI) | 1.78 [1.60, 1.98] |
| 2.1 CKC vs No Treatment | 12 | 39102 | Risk Ratio (IV, Random, 95% CI) | 2.70 [2.14, 3.40] |
| 2.2 LC vs No Treatment | 9 | 1509 | Risk Ratio (IV, Random, 95% CI) | 2.11 [1.26, 3.54] |
| 2.3 NETZ vs No Treatment | 1 | 7399 | Risk Ratio (IV, Random, 95% CI) | 5.83 [3.80, 8.95] |
| 2.4 LLETZ vs No Treatment | 25 | 1.445104E6 | Risk Ratio (IV, Random, 95% CI) | 1.58 [1.37, 1.81] |
| 2.5 FCBE vs No Treatment | 1 | 71 | Risk Ratio (IV, Random, 95% CI) | 5.22 [1.09, 24.90] |
| 2.6 LA vs No Treatment | 7 | 4710 | Risk Ratio (IV, Random, 95% CI) | 1.04 [0.86, 1.26] |
| 2.7 CT vs No Treatment | 2 | 238 | Risk Ratio (IV, Random, 95% CI) | 1.02 [0.22, 4.77] |
| 2.8 RD vs No Treatment | 1 | 2150 | Risk Ratio (IV, Random, 95% CI) | 1.62 [1.27, 2.06] |
| 2.9 Excisional Treatment NOS vs No Treatment | 15 | 3.106231E6 | Risk Ratio (IV, Random, 95% CI) | 1.90 [1.50, 2.41] |
| 2.10 Ablative Treatment NOS vs No Treatment | 5 | 595272 | Risk Ratio (IV, Random, 95% CI) | 1.46 [1.27, 1.66] |
| 2.11 Treatment NOS vs No Treatment | 2 | 41131 | Risk Ratio (IV, Random, 95% CI) | 2.57 [1.39, 4.77] |
| 3 PTB (<32‐34w) Show forest plot | 24 | 3.793874E6 | Risk Ratio (IV, Random, 95% CI) | 2.25 [1.79, 2.82] |
| 3.1 Excisional Treatment vs No Treatment | 22 | 3.666567E6 | Risk Ratio (IV, Random, 95% CI) | 2.48 [1.92, 3.20] |
| 3.2 Ablative Treatment vs No Treatment | 3 | 120820 | Risk Ratio (IV, Random, 95% CI) | 1.59 [1.08, 2.35] |
| 3.3 Treatment NOS vs No treatment | 2 | 6487 | Risk Ratio (IV, Random, 95% CI) | 1.65 [1.13, 2.42] |
| 4 PTB (<32‐34w)‐Analysis by treatment modality Show forest plot | 24 | 3.793874E6 | Risk Ratio (IV, Random, 95% CI) | 2.35 [1.88, 2.95] |
| 4.1 CKC vs No Treatment | 5 | 36979 | Risk Ratio (IV, Random, 95% CI) | 3.07 [1.72, 5.49] |
| 4.2 NETZ vs No Treatment | 1 | 7399 | Risk Ratio (IV, Random, 95% CI) | 10.53 [4.33, 25.65] |
| 4.3 LLETZ vs No Treatment | 11 | 791554 | Risk Ratio (IV, Random, 95% CI) | 2.13 [1.66, 2.75] |
| 4.4 CT vs No Treatment | 1 | 58 | Risk Ratio (IV, Random, 95% CI) | 1.86 [0.08, 43.87] |
| 4.5 Excisional Treatment NOS vs No Treatment | 9 | 2.830635E6 | Risk Ratio (IV, Random, 95% CI) | 2.94 [1.82, 4.77] |
| 4.6 Ablative Treatment NOS vs No Treatment | 2 | 120762 | Risk Ratio (IV, Random, 95% CI) | 1.59 [1.08, 2.35] |
| 4.7 Treatment NOS vs No treatment | 2 | 6487 | Risk Ratio (IV, Random, 95% CI) | 1.65 [1.13, 2.42] |
| 5 PTB (<28‐30w) Show forest plot | 8 | 3.910629E6 | Risk Ratio (IV, Random, 95% CI) | 2.23 [1.55, 3.22] |
| 5.1 Excisional Treatment vs No Treatment | 7 | 3.337003E6 | Risk Ratio (IV, Random, 95% CI) | 2.81 [1.91, 4.15] |
| 5.2 Ablative Treatment vs No Treatment | 3 | 568217 | Risk Ratio (IV, Random, 95% CI) | 1.38 [0.81, 2.36] |
| 5.3 Treatment NOS vs No Treatment | 1 | 5409 | Risk Ratio (IV, Random, 95% CI) | 1.75 [1.05, 2.91] |
| 6 PTB (<28‐30w)‐Analysis by treatment modality Show forest plot | 8 | 3.910629E6 | Risk Ratio (IV, Random, 95% CI) | 2.43 [1.69, 3.49] |
| 6.1 CKC vs No Treatment | 2 | 7118 | Risk Ratio (IV, Random, 95% CI) | 4.52 [0.83, 24.54] |
| 6.2 NETZ vs No Treatment | 1 | 7399 | Risk Ratio (IV, Random, 95% CI) | 14.74 [4.50, 48.32] |
| 6.3 LLETZ vs No Treatment | 3 | 502778 | Risk Ratio (IV, Random, 95% CI) | 2.57 [1.97, 3.35] |
| 6.4 Excisional Treatment NOS vs No treatment | 3 | 2.819708E6 | Risk Ratio (IV, Random, 95% CI) | 2.54 [1.30, 4.99] |
| 6.5 Ablative Treatment NOS vs No Treatment | 3 | 568217 | Risk Ratio (IV, Random, 95% CI) | 1.38 [0.81, 2.36] |
| 6.6 Treatment NOS vs No Treatment | 1 | 5409 | Risk Ratio (IV, Random, 95% CI) | 1.75 [1.05, 2.91] |
| 7 PTB (≤34w) Show forest plot | 15 | 424567 | Risk Ratio (IV, Random, 95% CI) | 2.59 [1.78, 3.77] |
| 7.1 Excisional Treatment vs No Treatment | 15 | 424509 | Risk Ratio (IV, Random, 95% CI) | 2.61 [1.78, 3.83] |
| 7.2 Ablative Treatment vs No Treatment | 1 | 58 | Risk Ratio (IV, Random, 95% CI) | 1.86 [0.08, 43.87] |
| 8 PTB (≤34w)‐Analysis by treatment modality Show forest plot | 15 | 424567 | Risk Ratio (IV, Random, 95% CI) | 2.56 [1.78, 3.69] |
| 8.1 CKC vs No Treatment | 4 | 30023 | Risk Ratio (IV, Random, 95% CI) | 2.85 [1.50, 5.41] |
| 8.2 LLETZ vs No Treatment | 9 | 289218 | Risk Ratio (IV, Random, 95% CI) | 1.83 [1.41, 2.39] |
| 8.3 CT vs No Treatment | 1 | 58 | Risk Ratio (IV, Random, 95% CI) | 1.86 [0.08, 43.87] |
| 8.4 Excisional Treatment NOS vs No Treatment | 4 | 105268 | Risk Ratio (IV, Random, 95% CI) | 7.30 [4.17, 12.80] |
| 9 PTB (<32‐33w) Show forest plot | 10 | 3.369685E6 | Risk Ratio (IV, Random, 95% CI) | 2.08 [1.55, 2.79] |
| 9.1 Excisional Treatment vs No Treatment | 8 | 3.242436E6 | Risk Ratio (IV, Random, 95% CI) | 2.43 [1.70, 3.47] |
| 9.2 Ablative Treatment vs No Treatment | 2 | 120762 | Risk Ratio (IV, Random, 95% CI) | 1.59 [1.08, 2.35] |
| 9.3 Treatment NOS vs No treatment | 2 | 6487 | Risk Ratio (IV, Random, 95% CI) | 1.65 [1.13, 2.42] |
| 10 PTB (<32‐33w)‐Analysis by treatment modality Show forest plot | 10 | 3.369685E6 | Risk Ratio (IV, Random, 95% CI) | 2.26 [1.70, 3.01] |
| 10.1 CKC vs No Treatment | 1 | 6956 | Risk Ratio (IV, Random, 95% CI) | 4.38 [1.08, 17.65] |
| 10.2 NETZ vs No Treatment | 1 | 7399 | Risk Ratio (IV, Random, 95% CI) | 10.53 [4.33, 25.65] |
| 10.3 LLETZ vs No Treatment | 3 | 502714 | Risk Ratio (IV, Random, 95% CI) | 2.74 [2.30, 3.26] |
| 10.4 Excisional Treatment NOS vs No Treatment | 5 | 2.725367E6 | Risk Ratio (IV, Random, 95% CI) | 2.09 [1.20, 3.63] |
| 10.5 Ablative Treatment NOS vs No Treatment | 2 | 120762 | Risk Ratio (IV, Random, 95% CI) | 1.59 [1.08, 2.35] |
| 10.6 Treatment NOS vs No treatment | 2 | 6487 | Risk Ratio (IV, Random, 95% CI) | 1.65 [1.13, 2.42] |
| 11 PTB (<30w) Show forest plot | 1 | 162 | Risk Ratio (IV, Random, 95% CI) | 2.86 [0.12, 69.11] |
| 11.1 Excisional Treatment vs No Treatment | 1 | 162 | Risk Ratio (IV, Random, 95% CI) | 2.86 [0.12, 69.11] |
| 12 PTB (<30w)‐Analysis by treatment modality Show forest plot | 1 | 162 | Risk Ratio (IV, Random, 95% CI) | 2.86 [0.12, 69.11] |
| 12.1 CKC vs No Treatment | 1 | 162 | Risk Ratio (IV, Random, 95% CI) | 2.86 [0.12, 69.11] |
| 13 PTB (<28w) Show forest plot | 7 | 3.910467E6 | Risk Ratio (IV, Random, 95% CI) | 2.22 [1.54, 3.22] |
| 13.1 Excisional Treatment vs No Treatment | 6 | 3.336841E6 | Risk Ratio (IV, Random, 95% CI) | 2.81 [1.89, 4.18] |
| 13.2 Ablative treatment vs No Treatment | 3 | 568217 | Risk Ratio (IV, Random, 95% CI) | 1.38 [0.81, 2.36] |
| 13.3 Treatment NOS vs No Treatment | 1 | 5409 | Risk Ratio (IV, Random, 95% CI) | 1.75 [1.05, 2.91] |
| 14 PTB (<28w)‐Analysis by treatment modality Show forest plot | 6 | 3.905058E6 | Risk Ratio (IV, Random, 95% CI) | 2.52 [1.71, 3.72] |
| 14.1 CKC vs No Treatment | 1 | 6956 | Risk Ratio (IV, Random, 95% CI) | 5.41 [0.74, 39.84] |
| 14.2 NETZ vs No Treatment | 1 | 7399 | Risk Ratio (IV, Random, 95% CI) | 14.74 [4.50, 48.32] |
| 14.3 LLETZ vs No Treatment | 3 | 502778 | Risk Ratio (IV, Random, 95% CI) | 2.57 [1.97, 3.35] |
| 14.4 Excisional Treatment NOS vs No treatment | 3 | 2.819708E6 | Risk Ratio (IV, Random, 95% CI) | 2.54 [1.30, 4.99] |
| 14.5 Ablative Treatment NOS vs No Treatment | 3 | 568217 | Risk Ratio (IV, Random, 95% CI) | 1.38 [0.81, 2.36] |
| 15 PTB (<37w)‐Nulliparous women Show forest plot | 6 | 245707 | Risk Ratio (IV, Random, 95% CI) | 1.92 [1.23, 2.98] |
| 15.1 LC vs No Treatment | 2 | 267 | Risk Ratio (IV, Random, 95% CI) | 2.18 [1.09, 4.37] |
| 15.2 LLETZ vs No Treatment | 3 | 231344 | Risk Ratio (IV, Random, 95% CI) | 1.51 [0.76, 3.02] |
| 15.3 Treatment NOS versus No Treatment | 1 | 14096 | Risk Ratio (IV, Random, 95% CI) | 3.53 [1.70, 7.33] |
| 16 PTB (<37w)‐Parous women Show forest plot | 5 | 339507 | Risk Ratio (IV, Random, 95% CI) | 2.05 [0.95, 4.43] |
| 16.1 LC vs No Treatment | 2 | 401 | Risk Ratio (IV, Random, 95% CI) | 2.82 [0.16, 49.84] |
| 16.2 LLETZ vs No Treatment | 2 | 324948 | Risk Ratio (IV, Random, 95% CI) | 1.20 [0.22, 6.65] |
| 16.3 Treatment NOS vs No Treatment | 1 | 14158 | Risk Ratio (IV, Random, 95% CI) | 3.73 [2.23, 6.22] |
| 17 PTB (<37w)‐Single cone Show forest plot | 17 | 1.367023E6 | Risk Ratio (IV, Random, 95% CI) | 1.75 [1.49, 2.06] |
| 17.1 CKC vs No Treatment | 3 | 36783 | Risk Ratio (IV, Random, 95% CI) | 2.89 [2.08, 4.03] |
| 17.2 LC vs No Treatment | 2 | 657 | Risk Ratio (IV, Random, 95% CI) | 1.06 [0.54, 2.09] |
| 17.3 NETZ vs No Treatment | 1 | 7399 | Risk Ratio (IV, Random, 95% CI) | 5.83 [3.80, 8.95] |
| 17.4 LLETZ vs No Treatment | 9 | 1.277874E6 | Risk Ratio (IV, Random, 95% CI) | 1.74 [1.45, 2.10] |
| 17.5 LA vs No Treatment | 4 | 1421 | Risk Ratio (IV, Random, 95% CI) | 1.07 [0.66, 1.74] |
| 17.6 Excisional Treatment NOS vs No Treatment | 3 | 32106 | Risk Ratio (IV, Random, 95% CI) | 1.88 [1.20, 2.93] |
| 17.7 Ablative Treatment NOS vs No Treatment | 1 | 10783 | Risk Ratio (IV, Random, 95% CI) | 1.14 [0.82, 1.57] |
| 18 PTB (<37w)‐Repeat cones Show forest plot | 11 | 1.317284E6 | Risk Ratio (IV, Random, 95% CI) | 3.78 [2.65, 5.39] |
| 18.1 CKC/LA vs No Treatment | 1 | 99 | Risk Ratio (IV, Random, 95% CI) | 12.56 [5.11, 30.87] |
| 18.2 LC/LC vs No Treatment | 1 | 270 | Risk Ratio (IV, Random, 95% CI) | 3.75 [1.70, 8.27] |
| 18.3 LLETZ/LLETZ vs No Treatment | 4 | 1.202174E6 | Risk Ratio (IV, Random, 95% CI) | 2.81 [2.33, 3.39] |
| 18.4 LLETZ/Treatment NOS vs No Treatment | 1 | 298 | Risk Ratio (IV, Random, 95% CI) | 9.40 [3.53, 25.03] |
| 18.5 Excisional Treatment NOS/Excisional Treatment NOS vs No Treatment | 3 | 73651 | Risk Ratio (IV, Random, 95% CI) | 5.48 [2.68, 11.24] |
| 18.6 Treatment NOS/Treatment NOS vs No Treatment | 2 | 40792 | Risk Ratio (IV, Random, 95% CI) | 1.71 [1.10, 2.67] |
| 19 PTB (<37w)‐Singleton pregnancies Show forest plot | 32 | 2.18962E6 | Risk Ratio (IV, Random, 95% CI) | 1.76 [1.57, 1.98] |
| 19.1 CKC vs No Treatment | 6 | 37759 | Risk Ratio (IV, Random, 95% CI) | 2.89 [2.22, 3.77] |
| 19.2 LC vs No Treatment | 4 | 545 | Risk Ratio (IV, Random, 95% CI) | 2.54 [1.24, 5.20] |
| 19.3 NETZ vs No Treatment | 1 | 7399 | Risk Ratio (IV, Random, 95% CI) | 5.83 [3.80, 8.95] |
| 19.4 LLETZ vs No Treatment | 18 | 1.444175E6 | Risk Ratio (IV, Random, 95% CI) | 1.61 [1.39, 1.87] |
| 19.5 LA vs No Treatment | 3 | 3420 | Risk Ratio (IV, Random, 95% CI) | 1.10 [0.75, 1.62] |
| 19.6 CT vs No Treatment | 1 | 58 | Risk Ratio (IV, Random, 95% CI) | 1.86 [0.08, 43.87] |
| 19.7 RD vs No Treatment | 1 | 2150 | Risk Ratio (IV, Random, 95% CI) | 1.62 [1.27, 2.06] |
| 19.8 Excisional Treatment NOS vs No Treatment | 7 | 542892 | Risk Ratio (IV, Random, 95% CI) | 1.42 [1.17, 1.72] |
| 19.9 Ablative Treatment NOS vs No Treatment | 2 | 110091 | Risk Ratio (IV, Random, 95% CI) | 1.14 [0.56, 2.32] |
| 19.10 Treatment NOS vs No Treatment | 2 | 41131 | Risk Ratio (IV, Random, 95% CI) | 2.57 [1.39, 4.77] |
| 20 PTB (<37w)‐Multiple pregnancies Show forest plot | 5 | 10797 | Risk Ratio (IV, Random, 95% CI) | 1.14 [0.95, 1.35] |
| 20.1 CKC vs No Treatment | 2 | 84 | Risk Ratio (IV, Random, 95% CI) | 0.95 [0.49, 1.83] |
| 20.2 LLETZ vs No Treatment | 3 | 10199 | Risk Ratio (IV, Random, 95% CI) | 1.27 [1.09, 1.47] |
| 20.3 Excisional Treatment NOS vs No Treatment | 1 | 4 | Risk Ratio (IV, Random, 95% CI) | 3.5 [0.31, 39.71] |
| 20.4 Ablative Treatment NOS vs No Treatment | 1 | 510 | Risk Ratio (IV, Random, 95% CI) | 0.93 [0.72, 1.20] |
| 21 PTB (<32‐34w)‐Multiple pregnancies Show forest plot | 3 | 10789 | Risk Ratio (IV, Random, 95% CI) | 1.68 [0.95, 2.98] |
| 21.1 CKC vs No Treatment | 1 | 80 | Risk Ratio (IV, Random, 95% CI) | 3.5 [1.29, 9.52] |
| 21.2 LLETZ vs No Treatment | 3 | 10199 | Risk Ratio (IV, Random, 95% CI) | 1.76 [0.88, 3.50] |
| 21.3 Ablative Treatment NOS vs No Treatment | 1 | 510 | Risk Ratio (IV, Random, 95% CI) | 0.85 [0.38, 1.91] |
| 22 PTB (<28w)‐Multiple pregnancies Show forest plot | 2 | 10744 | Risk Ratio (IV, Random, 95% CI) | 2.43 [1.40, 4.22] |
| 22.1 CKC vs No Treatment | 1 | 80 | Risk Ratio (IV, Random, 95% CI) | 2.15 [0.09, 49.56] |
| 22.2 LLETZ vs No Treatment | 2 | 10154 | Risk Ratio (IV, Random, 95% CI) | 2.45 [1.34, 4.47] |
| 22.3 Ablative Treatment NOS vs No Treatment | 1 | 510 | Risk Ratio (IV, Random, 95% CI) | 2.32 [0.48, 11.26] |
| 23 PTB (<37w)‐Depth≤10‐12mm Show forest plot | 8 | 550929 | Risk Ratio (IV, Random, 95% CI) | 1.54 [1.09, 2.18] |
| 23.1 LC vs No Treatment | 1 | 105 | Risk Ratio (IV, Random, 95% CI) | 0.52 [0.06, 4.83] |
| 23.2 LLETZ vs No Treatment | 3 | 544907 | Risk Ratio (IV, Random, 95% CI) | 2.01 [1.28, 3.15] |
| 23.3 Excisional Treatment NOS vs No Treatment | 4 | 5917 | Risk Ratio (IV, Random, 95% CI) | 1.20 [0.78, 1.85] |
| 24 PTB (<37w)‐Depth≥10‐12mm Show forest plot | 8 | 552711 | Risk Ratio (IV, Random, 95% CI) | 1.93 [1.62, 2.31] |
| 24.1 LC vs No Treatment | 1 | 87 | Risk Ratio (IV, Random, 95% CI) | 4.64 [1.20, 17.88] |
| 24.2 LLETZ vs No Treatment | 3 | 546134 | Risk Ratio (IV, Random, 95% CI) | 2.29 [1.57, 3.34] |
| 24.3 Excisional Treatment NOS vs No Treatment | 4 | 6490 | Risk Ratio (IV, Random, 95% CI) | 1.68 [1.41, 1.99] |
| 25 PTB (<37w)‐Depth≥15‐17mm Show forest plot | 4 | 544986 | Risk Ratio (IV, Random, 95% CI) | 2.77 [1.95, 3.93] |
| 25.1 LC vs No Treatment | 1 | 211 | Risk Ratio (IV, Random, 95% CI) | 4.92 [2.09, 11.59] |
| 25.2 LLETZ vs No Treatment | 2 | 544248 | Risk Ratio (IV, Random, 95% CI) | 3.16 [1.54, 6.48] |
| 25.3 Excisional Treatment NOS vs No Treatment | 1 | 527 | Risk Ratio (IV, Random, 95% CI) | 2.03 [1.33, 3.10] |
| 26 PTB (<37w)‐Depth≥20mm Show forest plot | 3 | 543750 | Risk Ratio (IV, Random, 95% CI) | 4.91 [2.06, 11.68] |
| 26.1 LC vs No Treatment | 1 | 192 | Risk Ratio (IV, Random, 95% CI) | 6.12 [2.57, 14.57] |
| 26.2 LLETZ vs No Treatment | 2 | 543558 | Risk Ratio (IV, Random, 95% CI) | 4.72 [1.25, 17.80] |
| 27 PTB (<37w)‐Volume<6cc Show forest plot | 1 | 550 | Risk Ratio (IV, Random, 95% CI) | 2.25 [1.09, 4.66] |
| 27.1 LLETZ vs No Treatment | 1 | 550 | Risk Ratio (IV, Random, 95% CI) | 2.25 [1.09, 4.66] |
| 28 PTB (<37w)‐Volume>6cc Show forest plot | 1 | 284 | Risk Ratio (IV, Random, 95% CI) | 13.90 [5.09, 37.98] |
| 28.1 LLETZ (Volume>6cc) vs No Treatment | 1 | 284 | Risk Ratio (IV, Random, 95% CI) | 13.90 [5.09, 37.98] |
| 29 PTB (<37w)‐Depth≤10mm Show forest plot | 7 | 7436 | Risk Ratio (IV, Random, 95% CI) | 1.60 [0.99, 2.59] |
| 29.1 LC vs No Treatment | 1 | 105 | Risk Ratio (IV, Random, 95% CI) | 0.52 [0.06, 4.83] |
| 29.2 LLETZ vs No Treatment | 2 | 1414 | Risk Ratio (IV, Random, 95% CI) | 2.72 [1.65, 4.50] |
| 29.3 Excisional Treatment NOS vs No Treatment | 4 | 5917 | Risk Ratio (IV, Random, 95% CI) | 1.20 [0.78, 1.85] |
| 30 PTB (<37w)‐Depth≤12mm Show forest plot | 1 | 543493 | Risk Ratio (IV, Random, 95% CI) | 1.56 [1.20, 2.02] |
| 30.1 LLETZ vs No Treatment | 1 | 543493 | Risk Ratio (IV, Random, 95% CI) | 1.56 [1.20, 2.02] |
| 31 PTB (<37w)‐Depth≤15mm Show forest plot | 3 | 545283 | Risk Ratio (IV, Random, 95% CI) | 1.44 [1.20, 1.73] |
| 31.1 LC vs No Treatment | 1 | 164 | Risk Ratio (IV, Random, 95% CI) | 0.67 [0.04, 11.18] |
| 31.2 LLETZ vs No Treatment | 2 | 545119 | Risk Ratio (IV, Random, 95% CI) | 1.44 [1.20, 1.73] |
| 32 PTB (<37w)‐Depth≤17mm Show forest plot | 1 | 656 | Risk Ratio (IV, Random, 95% CI) | 1.14 [0.76, 1.72] |
| 32.1 Excisional Treatment NOS vs No Treatment | 1 | 656 | Risk Ratio (IV, Random, 95% CI) | 1.14 [0.76, 1.72] |
| 33 PTB (<37w)‐Depth≤15‐17mm Show forest plot | 4 | 545939 | Risk Ratio (IV, Random, 95% CI) | 1.38 [1.17, 1.64] |
| 33.1 LC vs No Treatment | 1 | 164 | Risk Ratio (IV, Random, 95% CI) | 0.67 [0.04, 11.18] |
| 33.2 LLETZ vs No Treatment | 2 | 545119 | Risk Ratio (IV, Random, 95% CI) | 1.44 [1.20, 1.73] |
| 33.3 Excisional Treatment NOS vs No Treatment | 1 | 656 | Risk Ratio (IV, Random, 95% CI) | 1.14 [0.76, 1.72] |
| 34 PTB (<37w)‐Depth≤20mm Show forest plot | 3 | 545992 | Risk Ratio (IV, Random, 95% CI) | 1.60 [1.38, 1.87] |
| 34.1 LC vs No Treatment | 1 | 183 | Risk Ratio (IV, Random, 95% CI) | 1.30 [0.28, 5.97] |
| 34.2 LLETZ vs No Treatment | 2 | 545809 | Risk Ratio (IV, Random, 95% CI) | 1.61 [1.38, 1.87] |
| 35 PTB (<37w)‐Depth≥10mm Show forest plot | 7 | 7671 | Risk Ratio (IV, Random, 95% CI) | 2.12 [1.58, 2.85] |
| 35.1 LC vs No Treatment | 1 | 87 | Risk Ratio (IV, Random, 95% CI) | 4.64 [1.20, 17.88] |
| 35.2 LLETZ vs No Treatment | 2 | 1094 | Risk Ratio (IV, Random, 95% CI) | 3.16 [1.80, 5.55] |
| 35.3 Excisional Treatment NOS vs No Treatment | 4 | 6490 | Risk Ratio (IV, Random, 95% CI) | 1.68 [1.41, 1.99] |
| 36 PTB (<37w)‐Depth≥12mm Show forest plot | 1 | 545040 | Risk Ratio (IV, Random, 95% CI) | 1.93 [1.66, 2.23] |
| 36.1 LLETZ vs No Treatment | 1 | 545040 | Risk Ratio (IV, Random, 95% CI) | 1.93 [1.66, 2.23] |
| 37 PTB (<37w)‐Depth≥15mm Show forest plot | 3 | 544459 | Risk Ratio (IV, Random, 95% CI) | 3.49 [1.94, 6.26] |
| 37.1 LC vs No Treatment | 1 | 211 | Risk Ratio (IV, Random, 95% CI) | 4.92 [2.09, 11.59] |
| 37.2 LLETZ vs No Treatment | 2 | 544248 | Risk Ratio (IV, Random, 95% CI) | 3.16 [1.54, 6.48] |
| 38 PTB (<37w)‐Depth≥17mm Show forest plot | 1 | 527 | Risk Ratio (IV, Random, 95% CI) | 2.03 [1.33, 3.10] |
| 38.1 Excisional Treatment NOS vs No Treatment | 1 | 527 | Risk Ratio (IV, Random, 95% CI) | 2.03 [1.33, 3.10] |
| 39 PTB (<37w)‐Depth 10/13‐15/16mm Show forest plot | 3 | 544534 | Risk Ratio (IV, Random, 95% CI) | 1.32 [1.04, 1.66] |
| 39.1 LLETZ vs No Treatment | 2 | 543994 | Risk Ratio (IV, Random, 95% CI) | 1.32 [1.02, 1.72] |
| 39.2 Excisional Treatment NOS vs No Treatment | 1 | 540 | Risk Ratio (IV, Random, 95% CI) | 1.29 [0.79, 2.12] |
| 40 PTB (<37w)‐Depth 15/16‐19/20mm Show forest plot | 3 | 543608 | Risk Ratio (IV, Random, 95% CI) | 2.24 [1.73, 2.91] |
| 40.1 LC vs No Treatment | 1 | 169 | Risk Ratio (IV, Random, 95% CI) | 2.26 [0.50, 10.08] |
| 40.2 LLETZ vs No Treatment | 2 | 543439 | Risk Ratio (IV, Random, 95% CI) | 2.53 [1.42, 4.51] |
| 41 PTB (<37w)‐Volume<3cc Show forest plot | 1 | 496 | Risk Ratio (IV, Random, 95% CI) | 2.04 [0.94, 4.41] |
| 41.1 LLETZ vs No Treatment | 1 | 496 | Risk Ratio (IV, Random, 95% CI) | 2.04 [0.94, 4.41] |
| 42 PTB (<37w)‐Volume>3cc Show forest plot | 1 | 338 | Risk Ratio (IV, Random, 95% CI) | 4.17 [1.77, 9.82] |
| 42.1 LLETZ vs No Treatment | 1 | 338 | Risk Ratio (IV, Random, 95% CI) | 4.17 [1.77, 9.82] |
| 43 PTB (<37w)‐Depth≥10‐12mm vs ≤10‐12mm Show forest plot | 7 | 6359 | Risk Ratio (IV, Random, 95% CI) | 1.54 [1.31, 1.80] |
| 43.1 LC | 1 | 64 | Risk Ratio (IV, Random, 95% CI) | 8.91 [1.11, 71.73] |
| 43.2 LLETZ | 2 | 836 | Risk Ratio (IV, Random, 95% CI) | 1.26 [0.74, 2.17] |
| 43.3 Excision NOS | 4 | 5459 | Risk Ratio (IV, Random, 95% CI) | 1.55 [1.31, 1.83] |
| 44 PTB (<37w)‐Depth≥15‐17mm vs ≤15‐17mm Show forest plot | 4 | 4275 | Risk Ratio (IV, Random, 95% CI) | 1.82 [1.47, 2.26] |
| 44.1 LC | 1 | 75 | Risk Ratio (IV, Random, 95% CI) | 7.02 [0.44, 111.10] |
| 44.2 LLETZ | 2 | 3869 | Risk Ratio (IV, Random, 95% CI) | 1.86 [1.36, 2.55] |
| 44.3 Excisional Treatment NOS | 1 | 331 | Risk Ratio (IV, Random, 95% CI) | 1.78 [1.11, 2.84] |
| 45 PTB (<37w)‐Depth≥20mm vs ≤20mm Show forest plot | 3 | 3944 | Risk Ratio (IV, Random, 95% CI) | 2.79 [1.24, 6.27] |
| 45.1 LC | 1 | 75 | Risk Ratio (IV, Random, 95% CI) | 4.71 [1.13, 19.62] |
| 45.2 LLETZ | 2 | 3869 | Risk Ratio (IV, Random, 95% CI) | 2.47 [0.94, 6.51] |
| 46 PTB (<37w)‐Volume>3cc vs <3cc Show forest plot | 1 | 278 | Risk Ratio (IV, Random, 95% CI) | 2.04 [0.95, 4.39] |
| 46.1 LLETZ | 1 | 278 | Risk Ratio (IV, Random, 95% CI) | 2.04 [0.95, 4.39] |
| 47 PTB (<37w)‐Volume>6cc vs <6cc Show forest plot | 1 | 278 | Risk Ratio (IV, Random, 95% CI) | 6.18 [2.53, 15.13] |
| 47.1 LLETZ | 1 | 278 | Risk Ratio (IV, Random, 95% CI) | 6.18 [2.53, 15.13] |
| 48 PTB (<37w)‐Depth 11/13‐15/16mm vs ≤10‐12mm Show forest plot | 3 | 2600 | Risk Ratio (IV, Random, 95% CI) | 0.92 [0.67, 1.25] |
| 48.1 LLETZ | 2 | 2370 | Risk Ratio (IV, Random, 95% CI) | 0.83 [0.58, 1.17] |
| 48.2 Excisional Treatment NOS | 1 | 230 | Risk Ratio (IV, Random, 95% CI) | 1.31 [0.68, 2.50] |
| 49 PTB (<37w)‐Depth 16‐19mm vs 13‐15mm Show forest plot | 1 | 1768 | Risk Ratio (IV, Random, 95% CI) | 1.65 [1.12, 2.43] |
| 49.1 LLETZ | 1 | 1768 | Risk Ratio (IV, Random, 95% CI) | 1.65 [1.12, 2.43] |
| 50 PTB (<37w)‐Depth≥20mm vs 15/16‐19/20mm Show forest plot | 3 | 1560 | Risk Ratio (IV, Random, 95% CI) | 1.46 [0.95, 2.23] |
| 50.1 LC | 1 | 61 | Risk Ratio (IV, Random, 95% CI) | 2.71 [0.67, 10.96] |
| 50.2 LLETZ | 2 | 1499 | Risk Ratio (IV, Random, 95% CI) | 1.40 [0.84, 2.36] |
| 51 PTB (<37w)‐Untreated External Comparison Group Show forest plot | 44 | 5.192047E6 | Risk Ratio (IV, Random, 95% CI) | 1.92 [1.70, 2.16] |
| 51.1 CKC | 7 | 37370 | Risk Ratio (IV, Random, 95% CI) | 3.28 [2.44, 4.42] |
| 51.2 LC | 6 | 1126 | Risk Ratio (IV, Random, 95% CI) | 2.39 [1.24, 4.61] |
| 51.3 NETZ | 1 | 7361 | Risk Ratio (IV, Random, 95% CI) | 5.82 [3.79, 8.94] |
| 51.4 LLETZ | 19 | 1.414769E6 | Risk Ratio (IV, Random, 95% CI) | 1.72 [1.48, 2.00] |
| 51.5 LA] | 4 | 1258 | Risk Ratio (IV, Random, 95% CI) | 1.27 [0.67, 2.40] |
| 51.6 CT | 1 | 58 | Risk Ratio (IV, Random, 95% CI) | 1.86 [0.08, 43.87] |
| 51.7 Excisional Treatment NOS | 12 | 3.100025E6 | Risk Ratio (IV, Random, 95% CI) | 1.91 [1.50, 2.44] |
| 51.8 Ablative Treatment NOS | 5 | 588949 | Risk Ratio (IV, Random, 95% CI) | 1.45 [1.26, 1.67] |
| 51.9 Treatment NOS | 2 | 41131 | Risk Ratio (IV, Random, 95% CI) | 2.57 [1.39, 4.77] |
| 52 PTB (<37w)‐Untreated Internal Comparison Group (self‐matching) Show forest plot | 8 | 2987 | Risk Ratio (IV, Random, 95% CI) | 1.59 [1.19, 2.13] |
| 52.1 LC | 2 | 354 | Risk Ratio (IV, Random, 95% CI) | 1.30 [0.56, 3.06] |
| 52.2 LLETZ | 1 | 516 | Risk Ratio (IV, Random, 95% CI) | 1.82 [1.04, 3.21] |
| 52.3 FCBE | 1 | 71 | Risk Ratio (IV, Random, 95% CI) | 5.22 [1.09, 24.90] |
| 52.4 Excisional Treatment NOS | 3 | 1922 | Risk Ratio (IV, Random, 95% CI) | 1.46 [0.89, 2.39] |
| 52.5 Treatment NOS | 1 | 124 | Risk Ratio (IV, Random, 95% CI) | 2.0 [0.73, 5.51] |
| 53 PTB (<37w)‐Untreated Internal Comparison Group (pre‐treatment pregnancies) Show forest plot | 13 | 83404 | Risk Ratio (IV, Random, 95% CI) | 1.39 [0.98, 1.96] |
| 53.1 CKC | 3 | 1430 | Risk Ratio (IV, Random, 95% CI) | 1.79 [0.81, 3.95] |
| 53.2 LC | 2 | 161 | Risk Ratio (IV, Random, 95% CI) | 1.65 [0.11, 23.58] |
| 53.3 LLETZ | 4 | 3207 | Risk Ratio (IV, Random, 95% CI) | 1.13 [0.66, 1.94] |
| 53.4 LA | 1 | 226 | Risk Ratio (IV, Random, 95% CI) | 1.20 [0.57, 2.53] |
| 53.5 CT | 1 | 180 | Risk Ratio (IV, Random, 95% CI) | 0.85 [0.15, 4.94] |
| 53.6 Excisional NOS | 3 | 78200 | Risk Ratio (IV, Random, 95% CI) | 1.65 [0.88, 3.08] |
| 54 PTB (<37w)‐Untreated Colposcopy+/‐CIN+/‐Biopsy Comparison Group Show forest plot | 13 | 74958 | Risk Ratio (IV, Random, 95% CI) | 1.27 [1.14, 1.41] |
| 54.1 CKC | 2 | 265 | Risk Ratio (IV, Random, 95% CI) | 1.76 [1.01, 3.08] |
| 54.2 LC | 1 | 177 | Risk Ratio (IV, Random, 95% CI) | 1.52 [0.74, 3.15] |
| 54.3 LLETZ | 9 | 39249 | Risk Ratio (IV, Random, 95% CI) | 1.33 [1.11, 1.60] |
| 54.4 LA | 2 | 3326 | Risk Ratio (IV, Random, 95% CI) | 1.05 [0.84, 1.31] |
| 54.5 RD | 1 | 2150 | Risk Ratio (IV, Random, 95% CI) | 1.62 [1.27, 2.06] |
| 54.6 Excisional Treatment NOS | 5 | 20321 | Risk Ratio (IV, Random, 95% CI) | 1.23 [1.07, 1.41] |
| 54.7 Ablative Treatment NOS | 2 | 9470 | Risk Ratio (IV, Random, 95% CI) | 1.00 [0.74, 1.36] |
| 55 PTB (<37w)‐Untreated HSIL Comparison Group Show forest plot | 3 | 3764 | Risk Ratio (IV, Random, 95% CI) | 1.37 [0.85, 2.19] |
| 55.1 CKC | 1 | 103 | Risk Ratio (IV, Random, 95% CI) | 3.76 [0.48, 29.39] |
| 55.2 NETZ | 1 | 109 | Risk Ratio (IV, Random, 95% CI) | 4.55 [1.11, 18.66] |
| 55.3 LLETZ | 1 | 881 | Risk Ratio (IV, Random, 95% CI) | 2.48 [1.35, 4.55] |
| 55.4 Excisional Treatment NOS | 2 | 2274 | Risk Ratio (IV, Random, 95% CI) | 1.06 [0.71, 1.59] |
| 55.5 Ablative Treatment NOS | 2 | 397 | Risk Ratio (IV, Random, 95% CI) | 0.68 [0.28, 1.68] |
| 56 PTB (<37w)‐All Comparison Groups Show forest plot | 58 | 5.292724E6 | Risk Ratio (IV, Random, 95% CI) | 1.76 [1.58, 1.97] |
| 56.1 Treatment vs Untreated External Comparison Group | 43 | 5.165466E6 | Risk Ratio (IV, Random, 95% CI) | 1.97 [1.71, 2.26] |
| 56.2 Treatment vs Untreated Internal Comparison Group (pre‐treatment pregnancies) | 13 | 62519 | Risk Ratio (IV, Random, 95% CI) | 1.66 [1.24, 2.22] |
| 56.3 Treatment vs Untreated Internal Comparison Group (self‐matching) | 6 | 1263 | Risk Ratio (IV, Random, 95% CI) | 1.91 [1.19, 3.08] |
| 56.4 Treatment vs Untreated Colposcopy+/‐CIN+/‐Biopsy Comparison Group | 12 | 62702 | Risk Ratio (IV, Random, 95% CI) | 1.33 [1.17, 1.50] |
| 56.5 Treatment vs Untreated HSIL Comparison Group | 3 | 774 | Risk Ratio (IV, Random, 95% CI) | 1.46 [0.62, 3.42] |
| 57 PTB (<37w)‐Untreated High‐risk Population vs General Population Show forest plot | 15 | 4.357998E6 | Risk Ratio (IV, Random, 95% CI) | 1.24 [1.14, 1.34] |
| 57.1 Pre‐treatment pregnancies vs General Population | 10 | 3.132723E6 | Risk Ratio (IV, Random, 95% CI) | 1.23 [1.07, 1.42] |
| 57.2 Untreated Colposcopy+/‐CIN+/‐Biopsy vs General Population | 4 | 1.046823E6 | Risk Ratio (IV, Random, 95% CI) | 1.22 [1.11, 1.34] |
| 57.3 Untreated HSIL vs General Population | 3 | 178452 | Risk Ratio (IV, Random, 95% CI) | 1.40 [0.94, 2.10] |
| 58 PTB (<37w)‐Depth≤10‐12mm vs Untreated External Comparison Group Show forest plot | 6 | 1.026243E6 | Risk Ratio (IV, Random, 95% CI) | 1.64 [1.11, 2.42] |
| 58.1 LCp | 1 | 105 | Risk Ratio (IV, Random, 95% CI) | 0.52 [0.06, 4.83] |
| 58.2 LLETZ | 2 | 512896 | Risk Ratio (IV, Random, 95% CI) | 2.06 [1.10, 3.84] |
| 58.3 Excisional Treatment NOS | 3 | 513242 | Risk Ratio (IV, Random, 95% CI) | 1.57 [0.72, 3.41] |
| 59 PTB (<37w)‐Depth≤10‐12mm vs Untreated Internal Comparison Group Show forest plot | 2 | 3550 | Risk Ratio (IV, Random, 95% CI) | 0.90 [0.71, 1.14] |
| 59.1 LC | 1 | 70 | Risk Ratio (IV, Random, 95% CI) | 0.71 [0.05, 10.85] |
| 59.2 Excisional Treatment NOS | 1 | 3480 | Risk Ratio (IV, Random, 95% CI) | 0.90 [0.71, 1.14] |
| 60 PTB (<37w)‐Depth≤10‐12mm vs Untreated Colposcopy+/‐CIN+/‐Biopsy Show forest plot | 4 | 43145 | Risk Ratio (IV, Random, 95% CI) | 1.11 [0.85, 1.43] |
| 60.1 LLETZ | 2 | 33033 | Risk Ratio (IV, Random, 95% CI) | 1.38 [0.94, 2.02] |
| 60.2 Excisional Treatment NOS | 2 | 10112 | Risk Ratio (IV, Random, 95% CI) | 0.93 [0.80, 1.09] |
| 61 PTB (<37w)‐Depth≤15‐17mm vs Untreated External Comparison Group Show forest plot | 2 | 513145 | Risk Ratio (IV, Random, 95% CI) | 1.43 [1.19, 1.73] |
| 61.1 LC | 1 | 164 | Risk Ratio (IV, Random, 95% CI) | 0.67 [0.04, 11.18] |
| 61.2 LLETZ | 1 | 512981 | Risk Ratio (IV, Random, 95% CI) | 1.44 [1.19, 1.74] |
| 62 PTB (<37w)‐Depth≤15‐17mm vs Untreated Colposcopy+/‐CIN+/‐Biopsy Show forest plot | 3 | 34934 | Risk Ratio (IV, Random, 95% CI) | 1.18 [1.00, 1.40] |
| 62.1 LLETZ | 2 | 34278 | Risk Ratio (IV, Random, 95% CI) | 1.30 [0.85, 1.98] |
| 62.2 Excisional Treatment NOS | 1 | 656 | Risk Ratio (IV, Random, 95% CI) | 1.14 [0.76, 1.72] |
| 63 PTB (<37w)‐Depth≤20mm vs Untreated External Comparison Group Show forest plot | 2 | 513814 | Risk Ratio (IV, Random, 95% CI) | 1.60 [1.37, 1.87] |
| 63.1 LC | 1 | 183 | Risk Ratio (IV, Random, 95% CI) | 1.30 [0.28, 5.97] |
| 63.2 LLETZ | 1 | 513631 | Risk Ratio (IV, Random, 95% CI) | 1.61 [1.37, 1.88] |
| 64 PTB (<37w)‐Depth≤20mm vs Untreated Colposcopy+/‐CIN+/‐Biopsy Show forest plot | 2 | 34968 | Risk Ratio (IV, Random, 95% CI) | 1.52 [0.92, 2.51] |
| 64.1 LLETZ | 2 | 34968 | Risk Ratio (IV, Random, 95% CI) | 1.52 [0.92, 2.51] |
| 65 PTB (<37w)‐Depth≥10‐12mm vs Untreated External Comparison Group Show forest plot | 6 | 1.027812E6 | Risk Ratio (IV, Random, 95% CI) | 1.96 [1.66, 2.32] |
| 65.1 LC | 1 | 87 | Risk Ratio (IV, Random, 95% CI) | 4.64 [1.20, 17.88] |
| 65.2 LLETZ | 2 | 514051 | Risk Ratio (IV, Random, 95% CI) | 2.40 [1.30, 4.43] |
| 65.3 Excisional Treatment NOS | 3 | 513674 | Risk Ratio (IV, Random, 95% CI) | 1.82 [1.49, 2.22] |
| 66 PTB (<37w)‐Depth≥10‐12mm vs Untreated Internal Comparison Group Show forest plot | 2 | 3944 | Risk Ratio (IV, Random, 95% CI) | 2.05 [0.56, 7.48] |
| 66.1 LC | 1 | 52 | Risk Ratio (IV, Random, 95% CI) | 6.30 [0.79, 50.27] |
| 66.2 Excisional Treatment NOS | 1 | 3892 | Risk Ratio (IV, Random, 95% CI) | 1.39 [1.12, 1.73] |
| 67 PTB (<37w)‐Depth≥10‐12mm vs Untreated Colposcopy+/‐CIN+/‐Biopsy Show forest plot | 4 | 45275 | Risk Ratio (IV, Random, 95% CI) | 1.52 [1.37, 1.68] |
| 67.1 LLETZ | 2 | 34652 | Risk Ratio (IV, Random, 95% CI) | 1.80 [1.13, 2.87] |
| 67.2 Excisional Treatment NOS | 2 | 10623 | Risk Ratio (IV, Random, 95% CI) | 1.46 [1.29, 1.65] |
| 68 PTB (<37w)‐Depth≥15‐17mm vs Untreated External Comparison Group Show forest plot | 2 | 512503 | Risk Ratio (IV, Random, 95% CI) | 3.04 [1.62, 5.73] |
| 68.1 LC | 1 | 211 | Risk Ratio (IV, Random, 95% CI) | 4.92 [2.09, 11.59] |
| 68.2 LLETZ | 1 | 512292 | Risk Ratio (IV, Random, 95% CI) | 2.45 [2.06, 2.91] |
| 69 PTB (<37w)‐Depth≥15‐17mm vs Untreated Colposcopy+/‐CIN+/‐Biopsy Show forest plot | 3 | 33934 | Risk Ratio (IV, Random, 95% CI) | 2.30 [1.57, 3.35] |
| 69.1 LLETZ | 2 | 33407 | Risk Ratio (IV, Random, 95% CI) | 2.92 [1.14, 7.46] |
| 69.2 Excisional Treatment NOS | 1 | 527 | Risk Ratio (IV, Random, 95% CI) | 2.03 [1.33, 3.10] |
| 70 PTB (<37w)‐Depth≥20mm vs Untreated External Comparison Group Show forest plot | 2 | 511834 | Risk Ratio (IV, Random, 95% CI) | 3.63 [1.67, 7.90] |
| 70.1 LC | 1 | 192 | Risk Ratio (IV, Random, 95% CI) | 6.12 [2.57, 14.57] |
| 70.2 LLETZ | 1 | 511642 | Risk Ratio (IV, Random, 95% CI) | 2.68 [2.15, 3.35] |
| 71 PTB (<37w)‐Depth≥20mm vs Untreated Colposcopy+/‐CIN+/‐Biopsy Show forest plot | 2 | 32717 | Risk Ratio (IV, Random, 95% CI) | 4.32 [0.93, 20.03] |
| 71.1 LLETZ | 2 | 32717 | Risk Ratio (IV, Random, 95% CI) | 4.32 [0.93, 20.03] |
| 72 PTB (<37w)‐Depth 10/13‐15/16mm vs Untreated External Comparison Group Show forest plot | 1 | 511959 | Risk Ratio (IV, Random, 95% CI) | 1.31 [0.99, 1.72] |
| 72.1 LLETZ | 1 | 511959 | Risk Ratio (IV, Random, 95% CI) | 1.31 [0.99, 1.72] |
| 73 PTB (<37w)‐Depth 10/13‐15/16mm vs Untreated Colposcopy+/‐CIN+/‐Biopsy Show forest plot | 3 | 33693 | Risk Ratio (IV, Random, 95% CI) | 1.14 [0.90, 1.44] |
| 73.1 LLETZ | 2 | 33153 | Risk Ratio (IV, Random, 95% CI) | 1.12 [0.80, 1.57] |
| 73.2 Excisional Treatment NOS | 1 | 540 | Risk Ratio (IV, Random, 95% CI) | 1.29 [0.79, 2.12] |
| 74 PTB (<37w)‐Depth 15/16‐19/20mm vs Untreated External Comparison Group Show forest plot | 2 | 511660 | Risk Ratio (IV, Random, 95% CI) | 2.16 [1.65, 2.84] |
| 74.1 LC | 1 | 169 | Risk Ratio (IV, Random, 95% CI) | 2.26 [0.50, 10.08] |
| 74.2 LLETZ | 1 | 511491 | Risk Ratio (IV, Random, 95% CI) | 2.16 [1.64, 2.84] |
| 75 PTB (<37w)‐Depth 15/16‐19/20mm vs Untreated Colposcopy+/‐CIN+/‐Biopsy Show forest plot | 2 | 32598 | Risk Ratio (IV, Random, 95% CI) | 2.38 [1.04, 5.42] |
| 75.1 LLETZ | 2 | 32598 | Risk Ratio (IV, Random, 95% CI) | 2.38 [1.04, 5.42] |
| Outcome or subgroup title | No. of studies | No. of participants | Statistical method | Effect size |
| 1 sPTB (<37w) Show forest plot | 14 | 1.024731E6 | Risk Ratio (IV, Random, 95% CI) | 1.76 [1.47, 2.11] |
| 1.1 CKC vs No Treatment | 3 | 7320 | Risk Ratio (IV, Random, 95% CI) | 3.53 [2.05, 6.05] |
| 1.2 LC vs No Treatment | 2 | 222 | Risk Ratio (IV, Random, 95% CI) | 1.40 [0.51, 3.81] |
| 1.3 NETZ vs No Treatment | 1 | 7399 | Risk Ratio (IV, Random, 95% CI) | 5.83 [3.80, 8.95] |
| 1.4 LLETZ vs No Treatment | 11 | 773123 | Risk Ratio (IV, Random, 95% CI) | 1.60 [1.22, 2.08] |
| 1.5 LA vs No Treatment | 1 | 356 | Risk Ratio (IV, Random, 95% CI) | 0.95 [0.34, 2.68] |
| 1.6 CT vs No Treatment | 1 | 58 | Risk Ratio (IV, Random, 95% CI) | 1.86 [0.08, 43.87] |
| 1.7 Excisional Treatment NOS vs No Treatment | 2 | 95985 | Risk Ratio (IV, Random, 95% CI) | 1.70 [1.17, 2.46] |
| 1.8 Ablative Treatment NOS vs No Treatment | 2 | 134720 | Risk Ratio (IV, Random, 95% CI) | 1.42 [1.20, 1.70] |
| 1.9 Treatment NOS vs No Treatment | 1 | 5548 | Risk Ratio (IV, Random, 95% CI) | 1.30 [1.00, 1.69] |
| 2 sPTB (<32‐34w) Show forest plot | 7 | 655675 | Risk Ratio (IV, Random, 95% CI) | 2.63 [1.91, 3.62] |
| 2.1 CKC vs No Treatment | 2 | 6990 | Risk Ratio (IV, Random, 95% CI) | 4.38 [1.08, 17.65] |
| 2.2 NETZ vs No Treatment | 1 | 7399 | Risk Ratio (IV, Random, 95% CI) | 10.53 [4.33, 25.65] |
| 2.3 LLETZ vs No Treatment | 6 | 530985 | Risk Ratio (IV, Random, 95% CI) | 2.37 [1.82, 3.08] |
| 2.4 CT vs No Treatment | 1 | 58 | Risk Ratio (IV, Random, 95% CI) | 1.86 [0.08, 43.87] |
| 2.5 Excisional Treatment NOS vs No Treatment | 1 | 264 | Risk Ratio (IV, Random, 95% CI) | 13.92 [0.73, 266.57] |
| 2.6 Ablative Treatment NOS vs No Treatment | 1 | 109979 | Risk Ratio (IV, Random, 95% CI) | 1.57 [0.97, 2.53] |
| 3 sPTB (<28w) Show forest plot | 2 | 626670 | Risk Ratio (IV, Random, 95% CI) | 3.18 [1.64, 6.16] |
| 3.1 CKC vs No Treatment | 1 | 6956 | Risk Ratio (IV, Random, 95% CI) | 5.41 [0.74, 39.84] |
| 3.2 NETZ vs No Treatment | 1 | 7399 | Risk Ratio (IV, Random, 95% CI) | 14.74 [4.50, 48.32] |
| 3.3 LLETZ vs No Treatment | 2 | 502336 | Risk Ratio (IV, Random, 95% CI) | 2.57 [1.96, 3.36] |
| 3.4 Ablative Treatment NOS vs No Treatment | 1 | 109979 | Risk Ratio (IV, Random, 95% CI) | 1.22 [0.54, 2.74] |
| 4 pPROM (<37w) Show forest plot | 21 | 477011 | Risk Ratio (IV, Random, 95% CI) | 2.36 [1.76, 3.17] |
| 4.1 CKC vs No Treatment | 4 | 36733 | Risk Ratio (IV, Random, 95% CI) | 4.11 [2.05, 8.25] |
| 4.2 LC vs No Treatment | 4 | 635 | Risk Ratio (IV, Random, 95% CI) | 1.89 [0.97, 3.66] |
| 4.3 NETZ vs No Treatment | 1 | 7279 | Risk Ratio (IV, Random, 95% CI) | 8.83 [5.39, 14.46] |
| 4.4 LLETZ vs No Treatment | 8 | 302974 | Risk Ratio (IV, Random, 95% CI) | 2.15 [1.48, 3.12] |
| 4.5 LA vs No Treatment | 2 | 548 | Risk Ratio (IV, Random, 95% CI) | 1.62 [0.74, 3.55] |
| 4.6 CT vs No Treatment | 1 | 180 | Risk Ratio (IV, Random, 95% CI) | 1.13 [0.21, 6.00] |
| 4.7 Excisional Treatment NOS vs No Treatment | 5 | 98372 | Risk Ratio (IV, Random, 95% CI) | 2.66 [1.13, 6.24] |
| 4.8 Ablative Treatment NOS vs No Treatment | 1 | 24742 | Risk Ratio (IV, Random, 95% CI) | 1.47 [1.01, 2.15] |
| 4.9 Treatment NOS vs No Treatment | 1 | 5548 | Risk Ratio (IV, Random, 95% CI) | 1.44 [1.05, 1.97] |
| 5 pPROM (<32w) Show forest plot | 1 | 72788 | Risk Ratio (IV, Random, 95% CI) | 8.30 [2.03, 33.98] |
| 5.1 CKC vs No Treatment | 1 | 6842 | Risk Ratio (IV, Random, 95% CI) | 5.32 [0.72, 39.19] |
| 5.2 NETZ vs No Treatment | 1 | 7279 | Risk Ratio (IV, Random, 95% CI) | 25.38 [9.80, 65.74] |
| 5.3 LLETZ vs No Treatment | 1 | 58667 | Risk Ratio (IV, Random, 95% CI) | 3.74 [1.66, 8.41] |
| 6 pPROM (<28w) Show forest plot | 1 | 72788 | Risk Ratio (IV, Random, 95% CI) | 9.09 [1.04, 79.18] |
| 6.1 CKC vs No Treatment | 1 | 6842 | Risk Ratio (IV, Random, 95% CI) | 6.64 [0.38, 115.16] |
| 6.2 NETZ vs No Treatment | 1 | 7279 | Risk Ratio (IV, Random, 95% CI) | 43.51 [11.48, 164.86] |
| 6.3 LLETZ vs No Treatment | 1 | 58667 | Risk Ratio (IV, Random, 95% CI) | 1.81 [0.25, 13.08] |
| 7 Threatened PTB Show forest plot | 5 | 903 | Risk Ratio (IV, Random, 95% CI) | 2.44 [1.37, 4.33] |
| 7.1 CKC vs No Treatment | 1 | 126 | Risk Ratio (IV, Random, 95% CI) | 1.40 [0.45, 4.34] |
| 7.2 LC vs No Treatment | 1 | 112 | Risk Ratio (IV, Random, 95% CI) | 1.56 [0.53, 4.62] |
| 7.3 LLETZ vs No Treatment | 1 | 237 | Risk Ratio (IV, Random, 95% CI) | 4.0 [0.75, 21.37] |
| 7.4 Excisional Treatment NOS vs No Treatment | 2 | 428 | Risk Ratio (IV, Random, 95% CI) | 4.51 [1.68, 12.06] |
| 8 Chorioamnionitis Show forest plot | 4 | 29198 | Risk Ratio (IV, Random, 95% CI) | 3.43 [1.36, 8.64] |
| 8.1 CKC vs No Treatment | 1 | 28531 | Risk Ratio (IV, Random, 95% CI) | 2.39 [0.61, 9.43] |
| 8.2 LC vs No Treatment | 1 | 112 | Risk Ratio (IV, Random, 95% CI) | 3.33 [0.14, 80.11] |
| 8.3 LLETZ vs No Treatment | 1 | 237 | Risk Ratio (IV, Random, 95% CI) | 10.00 [1.19, 84.15] |
| 8.4 Excisional Treatment NOS vs No Treatment | 1 | 318 | Risk Ratio (IV, Random, 95% CI) | 3.0 [0.51, 17.68] |
| 9 Caeserean Section Show forest plot | 36 | 272360 | Risk Ratio (IV, Random, 95% CI) | 1.06 [0.98, 1.14] |
| 9.1 CKC vs No Treatment | 6 | 30462 | Risk Ratio (IV, Random, 95% CI) | 1.24 [0.91, 1.68] |
| 9.2 LC vs No Treatment | 5 | 1038 | Risk Ratio (IV, Random, 95% CI) | 1.38 [0.90, 2.11] |
| 9.3 LLETZ vs No Treatment | 14 | 5436 | Risk Ratio (IV, Random, 95% CI) | 1.04 [0.94, 1.15] |
| 9.4 LA vs No Treatment | 4 | 1258 | Risk Ratio (IV, Random, 95% CI) | 0.86 [0.61, 1.20] |
| 9.5 CT vs No Treatment | 2 | 238 | Risk Ratio (IV, Random, 95% CI) | 2.47 [1.02, 6.01] |
| 9.6 Excisional Treatment NOS vs No Treatment | 9 | 203532 | Risk Ratio (IV, Random, 95% CI) | 1.03 [0.89, 1.20] |
| 9.7 Ablative Treatment NOS vs No Treatment | 2 | 24848 | Risk Ratio (IV, Random, 95% CI) | 1.38 [0.42, 4.58] |
| 9.8 Treatment NOS vs No Treatment | 1 | 5548 | Risk Ratio (IV, Random, 95% CI) | 1.13 [1.00, 1.27] |
| 10 Instrumental Deliveries (ventouse/forceps) Show forest plot | 16 | 9588 | Risk Ratio (IV, Random, 95% CI) | 0.97 [0.88, 1.08] |
| 10.1 CKC vs No Treatment | 2 | 454 | Risk Ratio (IV, Random, 95% CI) | 1.33 [0.66, 2.70] |
| 10.2 LC vs No Treatment | 2 | 668 | Risk Ratio (IV, Random, 95% CI) | 1.16 [0.65, 2.07] |
| 10.3 LLETZ vs No Treatment | 6 | 1418 | Risk Ratio (IV, Random, 95% CI) | 0.89 [0.68, 1.17] |
| 10.4 LA vs No Treatment | 3 | 550 | Risk Ratio (IV, Random, 95% CI) | 0.94 [0.62, 1.41] |
| 10.5 Excisional Treatment NOS vs No Treatment | 3 | 950 | Risk Ratio (IV, Random, 95% CI) | 0.71 [0.46, 1.10] |
| 10.6 Treatment NOS vs No Treatment | 1 | 5548 | Risk Ratio (IV, Random, 95% CI) | 1.01 [0.89, 1.15] |
| 11 Precipitous Labour (<2hours) Show forest plot | 5 | 1059 | Risk Ratio (IV, Random, 95% CI) | 1.26 [0.80, 1.96] |
| 11.1 CKC vs No Treatment | 2 | 289 | Risk Ratio (IV, Random, 95% CI) | 1.24 [0.47, 3.27] |
| 11.2 LLETZ vs No Treatment | 4 | 770 | Risk Ratio (IV, Random, 95% CI) | 1.26 [0.76, 2.08] |
| 12 Prolonged labour (>12hours) Show forest plot | 7 | 1854 | Risk Ratio (IV, Random, 95% CI) | 1.25 [0.92, 1.69] |
| 12.1 CKC vs No Treatment | 2 | 325 | Risk Ratio (IV, Random, 95% CI) | 1.99 [0.89, 4.45] |
| 12.2 LC vs No Treatment | 1 | 500 | Risk Ratio (IV, Random, 95% CI) | 0.92 [0.41, 2.04] |
| 12.3 LLETZ vs No Treatment | 4 | 673 | Risk Ratio (IV, Random, 95% CI) | 0.96 [0.55, 1.70] |
| 12.4 LA vs No Treatment | 2 | 356 | Risk Ratio (IV, Random, 95% CI) | 1.41 [0.88, 2.26] |
| 13 Induction of Labour Show forest plot | 11 | 4668 | Risk Ratio (IV, Random, 95% CI) | 1.01 [0.89, 1.15] |
| 13.1 CKC vs No Treatment | 2 | 137 | Risk Ratio (IV, Random, 95% CI) | 1.11 [0.54, 2.29] |
| 13.2 LLETZ vs No treatment | 8 | 4056 | Risk Ratio (IV, Random, 95% CI) | 0.99 [0.82, 1.20] |
| 13.3 CT vs No Treatment | 1 | 58 | Risk Ratio (IV, Random, 95% CI) | 0.61 [0.22, 1.66] |
| 13.4 Excisional Treatment NOS vs No Treatment | 2 | 417 | Risk Ratio (IV, Random, 95% CI) | 0.90 [0.64, 1.28] |
| 14 Oxytocin Use Show forest plot | 6 | 2006 | Risk Ratio (IV, Random, 95% CI) | 0.90 [0.64, 1.26] |
| 14.1 CKC vs No Treatment | 1 | 103 | Risk Ratio (IV, Random, 95% CI) | 0.98 [0.59, 1.63] |
| 14.2 LLETZ vs No Treatment | 4 | 1804 | Risk Ratio (IV, Random, 95% CI) | 0.76 [0.43, 1.34] |
| 14.3 Excisional Treatment NOS vs No Treatment | 1 | 99 | Risk Ratio (IV, Random, 95% CI) | 1.18 [0.67, 2.05] |
| 15 Epidural Use Show forest plot | 5 | 105488 | Risk Ratio (IV, Random, 95% CI) | 1.02 [0.68, 1.53] |
| 15.1 LLETZ vs No Treatment | 4 | 818 | Risk Ratio (IV, Random, 95% CI) | 0.86 [0.64, 1.16] |
| 15.2 Excisional Treatment NOS vs No Treatment | 1 | 104670 | Risk Ratio (IV, Random, 95% CI) | 1.79 [1.29, 2.50] |
| 16 Pethidine Use Show forest plot | 2 | 394 | Risk Ratio (IV, Random, 95% CI) | 0.94 [0.72, 1.24] |
| 16.1 LLETZ vs No treatment | 2 | 394 | Risk Ratio (IV, Random, 95% CI) | 0.94 [0.72, 1.24] |
| 17 Analgesia Use NOS Show forest plot | 1 | 103 | Risk Ratio (IV, Random, 95% CI) | 1.11 [0.62, 1.98] |
| 17.1 CKC vs No Treatment | 1 | 103 | Risk Ratio (IV, Random, 95% CI) | 1.11 [0.62, 1.98] |
| 18 Cervical stenosis Show forest plot | 2 | 680 | Risk Ratio (IV, Random, 95% CI) | 2.26 [0.24, 21.59] |
| 18.1 LC vs No Treatment | 1 | 500 | Risk Ratio (IV, Random, 95% CI) | 3.0 [0.12, 73.29] |
| 18.2 CT vs No Treatment | 1 | 180 | Risk Ratio (IV, Random, 95% CI) | 1.71 [0.07, 41.31] |
| 19 Antepartum Haemorrhage Show forest plot | 4 | 1245 | Risk Ratio (IV, Random, 95% CI) | 1.11 [0.40, 3.12] |
| 19.1 CKC vs No Treatment | 1 | 34 | Risk Ratio (IV, Random, 95% CI) | 1.24 [0.26, 5.83] |
| 19.2 LC vs No Treatment | 1 | 168 | Risk Ratio (IV, Random, 95% CI) | 17.84 [0.98, 325.68] |
| 19.3 LLETZ vs No Treatment | 2 | 277 | Risk Ratio (IV, Random, 95% CI) | 0.52 [0.16, 1.67] |
| 19.4 LA vs No Treatment | 1 | 708 | Risk Ratio (IV, Random, 95% CI) | 8.00 [0.90, 71.18] |
| 19.5 CT vs No Treatment | 1 | 58 | Risk Ratio (IV, Random, 95% CI) | 0.41 [0.07, 2.25] |
| 20 Postpartum Haemorrhage (>600ml) Show forest plot | 1 | 149 | Risk Ratio (IV, Random, 95% CI) | 4.60 [1.38, 15.36] |
| 20.1 CKC vs No Treatment | 1 | 149 | Risk Ratio (IV, Random, 95% CI) | 4.60 [1.38, 15.36] |
| 21 Massive Obstetric Haemorrhage (>1000ml) Show forest plot | 1 | 149 | Risk Ratio (IV, Random, 95% CI) | 3.95 [0.45, 34.48] |
| 21.1 CKC vs No Treatment | 1 | 149 | Risk Ratio (IV, Random, 95% CI) | 3.95 [0.45, 34.48] |
| 22 Cervical cerclage Show forest plot | 8 | 141300 | Risk Ratio (IV, Random, 95% CI) | 14.29 [2.85, 71.65] |
| 22.1 CKC vs No Treatment | 3 | 30744 | Risk Ratio (IV, Random, 95% CI) | 31.42 [2.32, 426.22] |
| 22.2 LC vs No Treatment | 1 | 112 | Risk Ratio (IV, Random, 95% CI) | 6.68 [0.83, 53.69] |
| 22.3 LLETZ vs No Treatment | 1 | 56 | Risk Ratio (IV, Random, 95% CI) | 11.00 [0.64, 189.96] |
| 22.4 Excisional Treatment NOS vs No Treatment | 2 | 104840 | Risk Ratio (IV, Random, 95% CI) | 42.45 [28.99, 62.16] |
| 22.5 Treatment NOS vs No Treatment | 1 | 5548 | Risk Ratio (IV, Random, 95% CI) | 2.16 [1.24, 3.76] |
| Outcome or subgroup title | No. of studies | No. of participants | Statistical method | Effect size |
| 1 LBW (<2500g) Show forest plot | 30 | 1.348206E6 | Risk Ratio (IV, Random, 95% CI) | 1.81 [1.58, 2.07] |
| 1.1 CKC vs No Treatment | 5 | 30304 | Risk Ratio (IV, Random, 95% CI) | 2.51 [1.78, 3.53] |
| 1.2 LC vs No Treatment | 4 | 786 | Risk Ratio (IV, Random, 95% CI) | 1.76 [0.72, 4.35] |
| 1.3 LLETZ vs No Treatment | 12 | 3357 | Risk Ratio (IV, Random, 95% CI) | 2.11 [1.51, 2.94] |
| 1.4 LA vs No Treatment | 4 | 1104 | Risk Ratio (IV, Random, 95% CI) | 1.07 [0.59, 1.92] |
| 1.5 CT vs No Treatment | 1 | 58 | Risk Ratio (IV, Random, 95% CI) | 3.67 [0.47, 28.47] |
| 1.6 Excisional Treatment NOS vs No Treatment | 10 | 823648 | Risk Ratio (IV, Random, 95% CI) | 2.01 [1.62, 2.49] |
| 1.7 Ablative Treatment NOS vs No Treatment | 4 | 483402 | Risk Ratio (IV, Random, 95% CI) | 1.36 [1.19, 1.55] |
| 1.8 Treatment NOS vs No Treatment | 1 | 5547 | Risk Ratio (IV, Random, 95% CI) | 1.35 [1.14, 1.60] |
| 2 LBW (<2000g) Show forest plot | 3 | 74981 | Risk Ratio (IV, Random, 95% CI) | 2.49 [0.97, 6.36] |
| 2.1 LC vs No Treatment | 1 | 181 | Risk Ratio (IV, Random, 95% CI) | 4.46 [1.36, 14.59] |
| 2.2 LA vs No Treatment | 2 | 772 | Risk Ratio (IV, Random, 95% CI) | 0.95 [0.39, 2.29] |
| 2.3 Excisional Treatment NOS vs No Treatment | 1 | 74028 | Risk Ratio (IV, Random, 95% CI) | 4.60 [3.32, 6.37] |
| 3 LBW (<1500g) Show forest plot | 5 | 76836 | Risk Ratio (IV, Random, 95% CI) | 3.00 [1.54, 5.85] |
| 3.1 LC vs No Treatment | 1 | 181 | Risk Ratio (IV, Random, 95% CI) | 12.75 [1.53, 106.44] |
| 3.2 LLETZ vs No Treatment | 1 | 378 | Risk Ratio (IV, Random, 95% CI) | 7.0 [0.36, 134.59] |
| 3.3 LA vs No Treatment | 2 | 772 | Risk Ratio (IV, Random, 95% CI) | 0.68 [0.16, 2.80] |
| 3.4 Excisional Treatment NOS vs No Treatment | 2 | 75505 | Risk Ratio (IV, Random, 95% CI) | 3.34 [2.02, 5.54] |
| 4 LBW (<1000g) Show forest plot | 2 | 2185 | Risk Ratio (IV, Random, 95% CI) | 2.09 [0.06, 74.71] |
| 4.1 LA vs No Treatment | 1 | 708 | Risk Ratio (IV, Random, 95% CI) | 0.29 [0.01, 5.50] |
| 4.2 Excisional Treatment NOS vs No Treatment | 1 | 1477 | Risk Ratio (IV, Random, 95% CI) | 11.10 [1.44, 85.79] |
| 5 NICU Admission Show forest plot | 8 | 2557 | Risk Ratio (IV, Random, 95% CI) | 1.45 [1.16, 1.81] |
| 5.1 CKC vs No Treatment | 2 | 71 | Risk Ratio (IV, Random, 95% CI) | 1.40 [0.52, 3.75] |
| 5.2 LLETZ vs No Treatment | 5 | 1994 | Risk Ratio (IV, Random, 95% CI) | 1.42 [1.01, 1.99] |
| 5.3 CT vs No Treatment | 1 | 58 | Risk Ratio (IV, Random, 95% CI) | 2.44 [0.29, 20.49] |
| 5.4 Excisional Treatment NOS vs No Treatment | 2 | 434 | Risk Ratio (IV, Random, 95% CI) | 1.76 [1.13, 2.75] |
| 6 Perinatal Mortality Show forest plot | 23 | 1.659433E6 | Risk Ratio (IV, Random, 95% CI) | 1.51 [1.13, 2.03] |
| 6.1 CKC vs No Treatment | 7 | 50588 | Risk Ratio (IV, Random, 95% CI) | 1.46 [0.83, 2.57] |
| 6.2 LC vs No Treatment | 3 | 906 | Risk Ratio (IV, Random, 95% CI) | 1.89 [0.26, 13.87] |
| 6.3 NETZ vs No Treatment | 1 | 7399 | Risk Ratio (IV, Random, 95% CI) | 9.99 [3.13, 31.92] |
| 6.4 LLETZ vs No Treatment | 7 | 302271 | Risk Ratio (IV, Random, 95% CI) | 1.53 [0.88, 2.67] |
| 6.5 LA vs No Treatment | 2 | 258 | Risk Ratio (IV, Random, 95% CI) | 3.0 [0.12, 72.74] |
| 6.6 CT vs No Treatment | 2 | 238 | Risk Ratio (IV, Random, 95% CI) | 0.19 [0.01, 4.59] |
| 6.7 Excisional Treatment NOS vs No Treatment | 5 | 820028 | Risk Ratio (IV, Random, 95% CI) | 1.85 [1.02, 3.36] |
| 6.8 Ablative Treatment NOS vs No Treatment | 2 | 472197 | Risk Ratio (IV, Random, 95% CI) | 0.69 [0.42, 1.13] |
| 6.9 Treatment NOS vs No Treatment | 1 | 5548 | Risk Ratio (IV, Random, 95% CI) | 1.00 [0.63, 1.58] |
| 7 Perinatal Mortality (<37w) Show forest plot | 1 | 73992 | Risk Ratio (IV, Random, 95% CI) | 9.40 [2.01, 43.89] |
| 7.1 CKC vs No Treatment | 1 | 6956 | Risk Ratio (IV, Random, 95% CI) | 5.33 [0.31, 90.71] |
| 7.2 NETZ vs No Treatment | 1 | 7399 | Risk Ratio (IV, Random, 95% CI) | 30.96 [8.71, 110.13] |
| 7.3 LLETZ vs No Treatment | 1 | 59637 | Risk Ratio (IV, Random, 95% CI) | 3.92 [1.24, 12.38] |
| 8 Perinatal Mortality (<32w) Show forest plot | 1 | 73992 | Risk Ratio (IV, Random, 95% CI) | 12.81 [2.70, 60.87] |
| 8.1 CKC vs No Treatment | 1 | 6956 | Risk Ratio (IV, Random, 95% CI) | 6.75 [0.39, 117.10] |
| 8.2 NETZ vs No Treatment | 1 | 7399 | Risk Ratio (IV, Random, 95% CI) | 44.23 [11.67, 167.61] |
| 8.3 LLETZ vs No Treatment | 1 | 59637 | Risk Ratio (IV, Random, 95% CI) | 5.43 [1.71, 17.30] |
| 9 Perinatal Mortality (<28w) Show forest plot | 1 | 73992 | Risk Ratio (IV, Random, 95% CI) | 13.76 [2.37, 79.89] |
| 9.1 CKC vs No Treatment | 1 | 6956 | Risk Ratio (IV, Random, 95% CI) | 9.21 [0.51, 164.95] |
| 9.2 NETZ vs No Treatment | 1 | 7399 | Risk Ratio (IV, Random, 95% CI) | 51.61 [13.17, 202.29] |
| 9.3 LLETZ vs No Treatment | 1 | 59637 | Risk Ratio (IV, Random, 95% CI) | 4.49 [1.09, 18.45] |
| 10 Stillbirth Show forest plot | 12 | 249855 | Risk Ratio (IV, Random, 95% CI) | 0.98 [0.63, 1.52] |
| 10.1 CKC vs No Treatment | 3 | 935 | Risk Ratio (IV, Random, 95% CI) | 1.61 [0.48, 5.40] |
| 10.2 LC vs No Treatment | 2 | 725 | Risk Ratio (IV, Random, 95% CI) | 0.33 [0.03, 3.18] |
| 10.3 LLETZ vs No Treatment | 4 | 242473 | Risk Ratio (IV, Random, 95% CI) | 1.42 [0.62, 3.26] |
| 10.4 LA vs No Treatment | 1 | 64 | Risk Ratio (IV, Random, 95% CI) | 0.0 [0.0, 0.0] |
| 10.5 Excisional Treatment NOS vs No Treatment | 1 | 110 | Risk Ratio (IV, Random, 95% CI) | 0.0 [0.0, 0.0] |
| 10.6 Treatment NOS vs No Treatment | 1 | 5548 | Risk Ratio (IV, Random, 95% CI) | 0.77 [0.42, 1.40] |
| 11 Apgar score (≤5)(1min) Show forest plot | 1 | 225 | Risk Ratio (IV, Random, 95% CI) | 0.57 [0.12, 2.68] |
| 11.1 LC vs No Treatment | 1 | 225 | Risk Ratio (IV, Random, 95% CI) | 0.57 [0.12, 2.68] |
| 12 Apgar score (<7)(1min) Show forest plot | 1 | 152 | Risk Ratio (IV, Random, 95% CI) | 0.63 [0.07, 5.71] |
| 12.1 LLETZ vs No Treatment | 1 | 87 | Risk Ratio (IV, Random, 95% CI) | 0.16 [0.01, 3.30] |
| 12.2 CKC vs No Treatment | 1 | 65 | Risk Ratio (IV, Random, 95% CI) | 1.61 [0.15, 16.90] |
| 13 Apgar score (<7)(5min) Show forest plot | 2 | 297 | Risk Ratio (IV, Random, 95% CI) | 0.82 [0.19, 3.59] |
| 13.1 CKC vs No Treatment | 1 | 32 | Risk Ratio (IV, Random, 95% CI) | 0.0 [0.0, 0.0] |
| 13.2 LLETZ vs No Treatment | 1 | 120 | Risk Ratio (IV, Random, 95% CI) | 0.93 [0.16, 5.37] |
| 13.3 CT vs No Treatment | 1 | 58 | Risk Ratio (IV, Random, 95% CI) | 0.61 [0.04, 9.28] |
| 13.4 Excisional Treatment NOS vs No Treatment | 1 | 87 | Risk Ratio (IV, Random, 95% CI) | 0.0 [0.0, 0.0] |