Resultados obstétricos después del tratamiento conservador para las lesiones intraepiteliales cervicales y la enfermedad invasiva temprana
Información
- DOI:
- https://doi.org/10.1002/14651858.CD012847Copiar DOI

- Base de datos:
-
- Cochrane Database of Systematic Reviews
- Versión publicada:
-
- 02 noviembre 2017see what's new
- Tipo:
-
- Intervention
- Etapa:
-
- Review
- Grupo Editorial Cochrane:
-
Grupo Cochrane de Cáncer ginecológico, neurooncología y otros cánceres
- Copyright:
-
- Copyright © 2017 The Cochrane Collaboration. Published by John Wiley & Sons, Ltd.
Cifras del artículo
Altmetric:
Citado por:
Autores
Contributions of authors
The study was conceived and designed by MK, MA, PB, and EP. MK, AA, and MP acquired the data, which were collated and analysed by MK, AA, IK, and MA. All review authors drafted and critically revised the manuscript for important intellectual content. MA, PB, and EP are joint senior authors. All authors gave final approval of the version to be published and have contributed to the manuscript.
Sources of support
Internal sources
-
Imperial Healthcare NHS Trust NIHR Biomedical Research Centre, UK.
P45272 (MK and PRB)
External sources
-
The British Society for Colposcopy and Cervical Pathology, UK.
Jordan/Singer Award (P47773) (MK)
-
Genesis Research Trust, UK.
P55549 (MK)
-
Sigrid Jusélius Fellowship, Finland.
P52483 (IK and MK)
-
COHEAHR Network, Other.
grant No 603019 (MA); funded by Seventh Framework Programme of DG Research of the European Commission (Brussels); Institut National du Cancer (Paris) through the COSPCC study (Conséquences obstétricales du (sur)traitement des précurseurs du cancer du col); the European Federation of Colposcopy (Birmingham); and the Joint Action CANCON
-
Imperial College Healthcare Charity, UK.
P47907 (AM and MK)
-
Imperial Healthcare NHS Trust Biomedical Researh Centre, UK.
P45272 (MK, PRB)
-
NIHR RfPB, UK.
(MK, IK, PRB)
Declarations of interest
No known conflict of interest for the published work. Details are included in the individual conflict of interest forms completed by each author.
Acknowledgements
We thank Jo Morrison, Clare Jess, Jane Hayes and Andy Bryant of the CGNOC editorial team for their contribution to the editorial process. We thank the peer reviewers for their many helpful suggestions.
This project was supported by the National Institute for Health Research (NIHR), via Cochrane Infrastructure funding to the Cochrane Gynaecological, Neuro‐oncology and Orphan Cancer Group. The views and opinions expressed herein are those of the authors and do not necessarily reflect those of the Systematic Reviews Programme, NIHR, National Health Service or the Department of Health.
Version history
| Published | Title | Stage | Authors | Version |
| 2017 Nov 02 | Obstetric outcomes after conservative treatment for cervical intraepithelial lesions and early invasive disease | Review | Maria Kyrgiou, Antonios Athanasiou, Ilkka E J Kalliala, Maria Paraskevaidi, Anita Mitra, Pierre PL Martin‐Hirsch, Marc Arbyn, Phillip Bennett, Evangelos Paraskevaidis | |
Differences between protocol and review
The original protocol was drafted to analyse fertility, early pregnancy and obstetric outcomes in women with a history of treatment for CIN versus untreated controls. Due to the clinical difference of the outcomes and the large number of studies, interventions and outcomes, it was decided to split the review into two. Fertility and early pregnancy outcomes were removed and published in a prior review (Kyrgiou 2015b).
The current review addresses the impact of conservative treatment on obstetric outcomes. We also included two treatment techniques, called needle excision of the transformation zone (NETZ) or straight wire excision of the transformation zone (SWETZ) and Fischer cone biopsy excisor (FCBE), respectively as they are a variation of large loop excision of the transformation zone (LLETZ)/loop electrosurgical excisional procedure (LEEP). We also extended the inclusion criteria to include women treated for early cervical cancer (stage IA1).
Only studies published in English were included as given the large number of included studies and the low quality of these small studies we considered that their inclusion would not alter the conclusions of the review. In future updates we will consider the inclusion of these reports (Characteristics of studies awaiting classification).
We considered both studies with adjusted or unadjusted data and extracted unadjusted data for the analysis as previously described in our protocol. More recent guidance recommends the use of adjusted data and this will be incorporated in future updates of this review.
Keywords
MeSH
Medical Subject Headings (MeSH) Keywords
- *Infant, Low Birth Weight;
- Confidence Intervals;
- Conservative Treatment [*adverse effects, methods];
- Fetal Membranes, Premature Rupture [epidemiology];
- Intensive Care, Neonatal [statistics & numerical data];
- Neoplasm Invasiveness;
- Observational Studies as Topic;
- Perinatal Mortality;
- Postoperative Complications [*epidemiology];
- Pregnancy Outcome;
- Premature Birth [*epidemiology];
- Retrospective Studies;
- Uterine Cervical Dysplasia [pathology, *surgery];
- Uterine Cervical Neoplasms [pathology, *surgery];
Medical Subject Headings Check Words
Adult; Female; Humans; Infant, Newborn; Pregnancy;
PICO

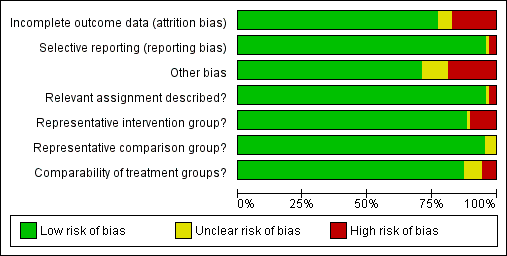
'Risk of bias' graph: review authors' judgements about each risk of bias item presented as percentages across all included studies.

'Risk of bias' summary: review authors' judgements about each risk of bias item for each included study.

Comparison 1 Maternal Outcomes‐PTB, Outcome 1 PTB (<37w).

Comparison 1 Maternal Outcomes‐PTB, Outcome 2 PTB (<37w)‐Analysis by treatment modality.
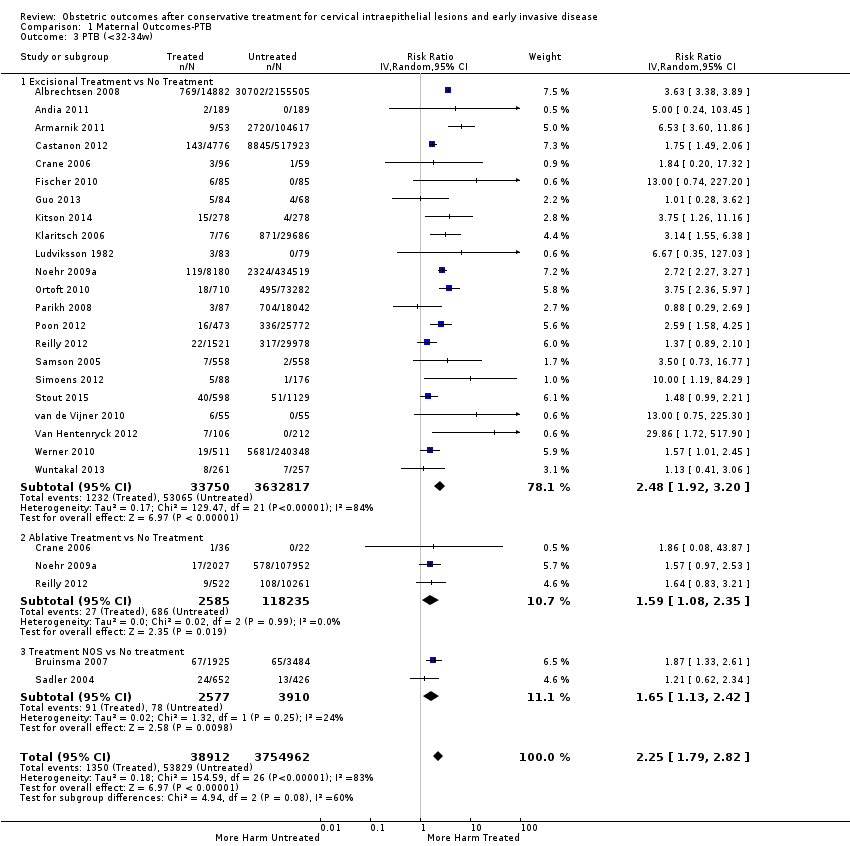
Comparison 1 Maternal Outcomes‐PTB, Outcome 3 PTB (<32‐34w).

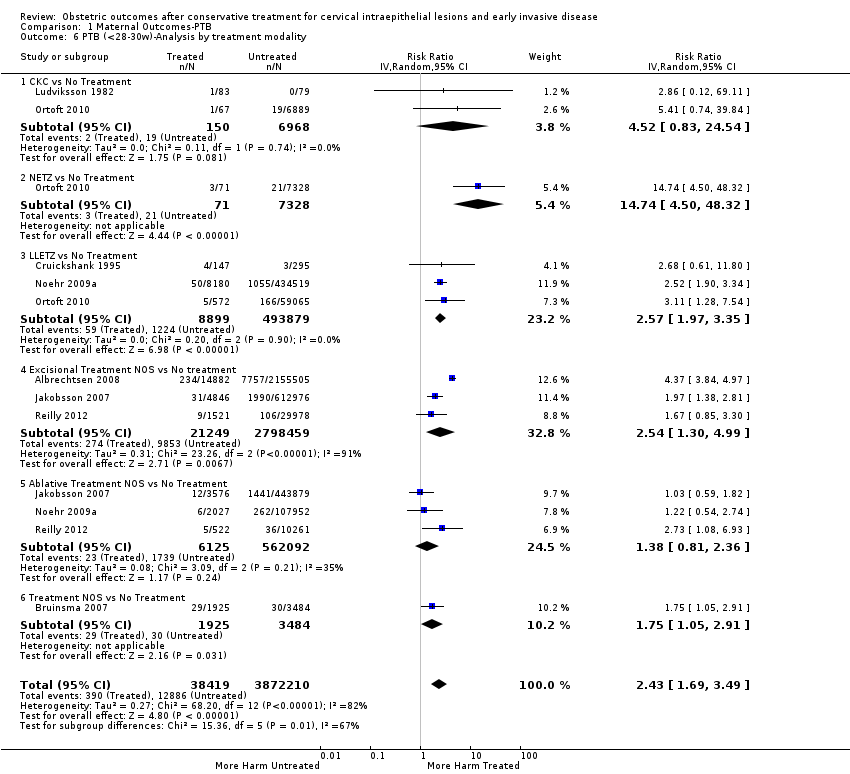
Comparison 1 Maternal Outcomes‐PTB, Outcome 4 PTB (<32‐34w)‐Analysis by treatment modality.

Comparison 1 Maternal Outcomes‐PTB, Outcome 5 PTB (<28‐30w).
Comparison 1 Maternal Outcomes‐PTB, Outcome 6 PTB (<28‐30w)‐Analysis by treatment modality.
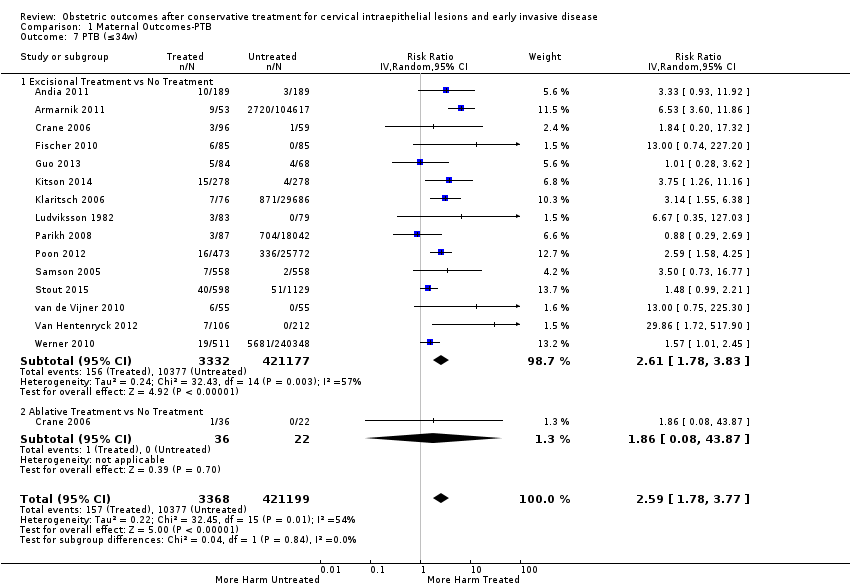
Comparison 1 Maternal Outcomes‐PTB, Outcome 7 PTB (≤34w).
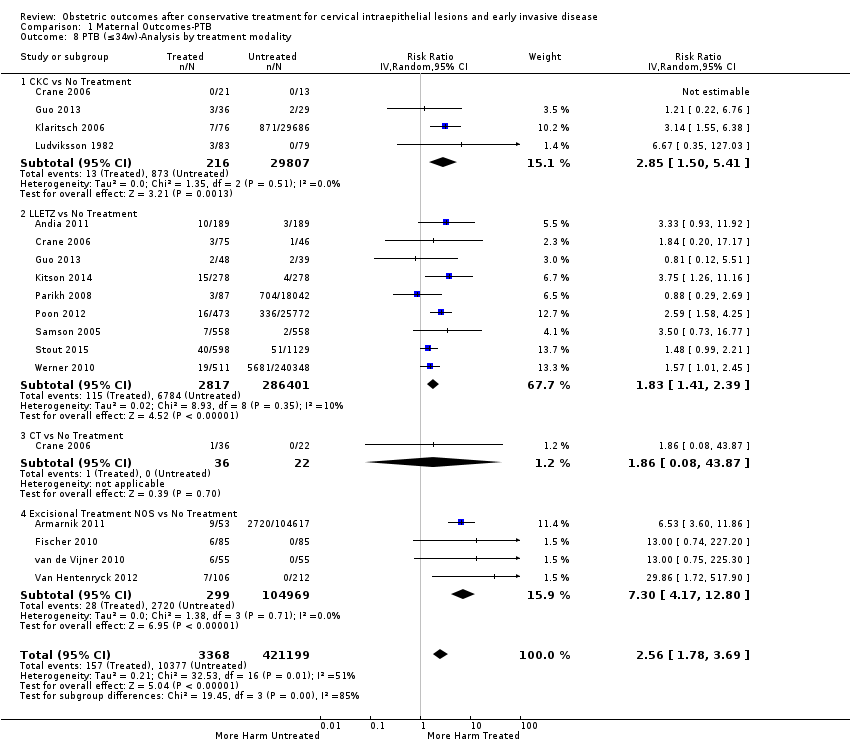
Comparison 1 Maternal Outcomes‐PTB, Outcome 8 PTB (≤34w)‐Analysis by treatment modality.

Comparison 1 Maternal Outcomes‐PTB, Outcome 9 PTB (<32‐33w).

Comparison 1 Maternal Outcomes‐PTB, Outcome 10 PTB (<32‐33w)‐Analysis by treatment modality.

Comparison 1 Maternal Outcomes‐PTB, Outcome 11 PTB (<30w).
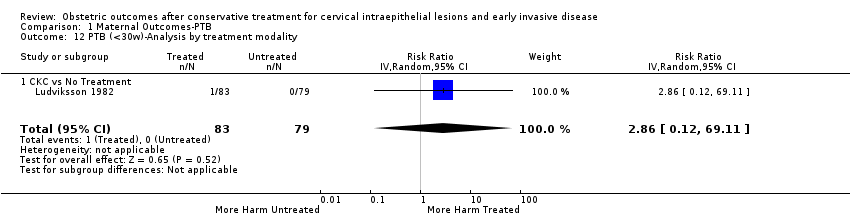
Comparison 1 Maternal Outcomes‐PTB, Outcome 12 PTB (<30w)‐Analysis by treatment modality.
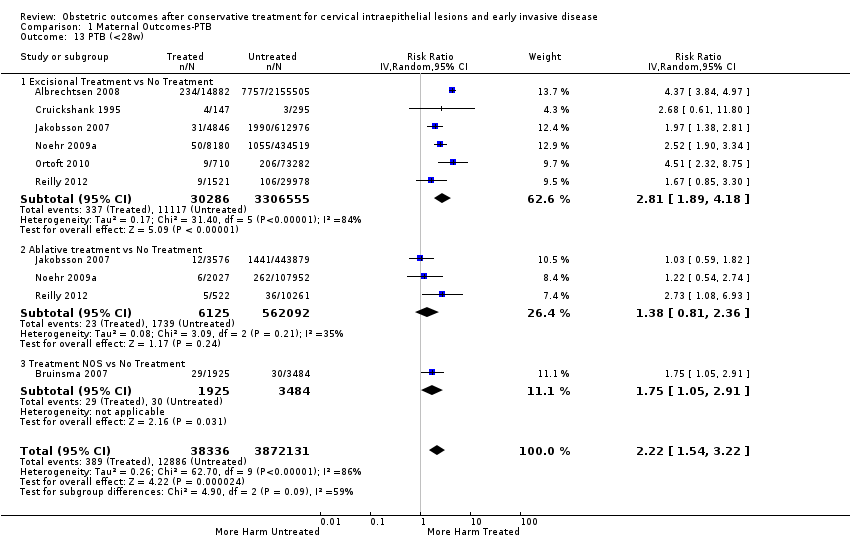
Comparison 1 Maternal Outcomes‐PTB, Outcome 13 PTB (<28w).

Comparison 1 Maternal Outcomes‐PTB, Outcome 14 PTB (<28w)‐Analysis by treatment modality.

Comparison 1 Maternal Outcomes‐PTB, Outcome 15 PTB (<37w)‐Nulliparous women.

Comparison 1 Maternal Outcomes‐PTB, Outcome 16 PTB (<37w)‐Parous women.
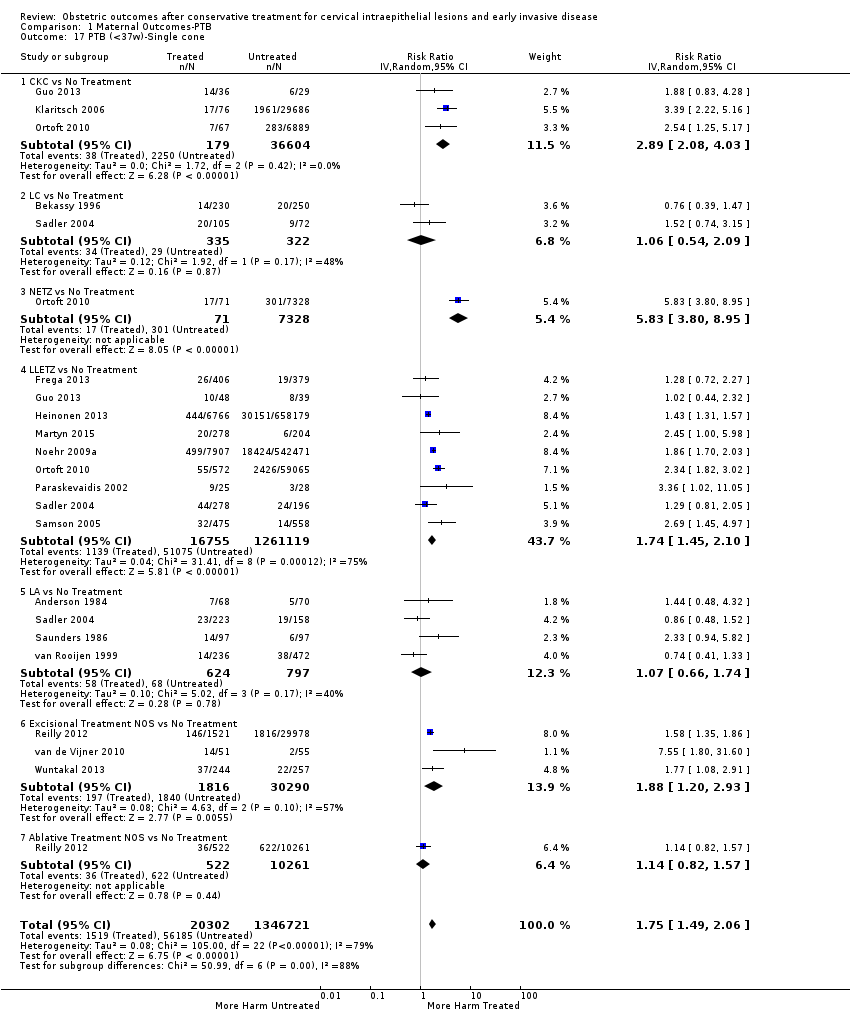
Comparison 1 Maternal Outcomes‐PTB, Outcome 17 PTB (<37w)‐Single cone.

Comparison 1 Maternal Outcomes‐PTB, Outcome 18 PTB (<37w)‐Repeat cones.

Comparison 1 Maternal Outcomes‐PTB, Outcome 19 PTB (<37w)‐Singleton pregnancies.

Comparison 1 Maternal Outcomes‐PTB, Outcome 20 PTB (<37w)‐Multiple pregnancies.
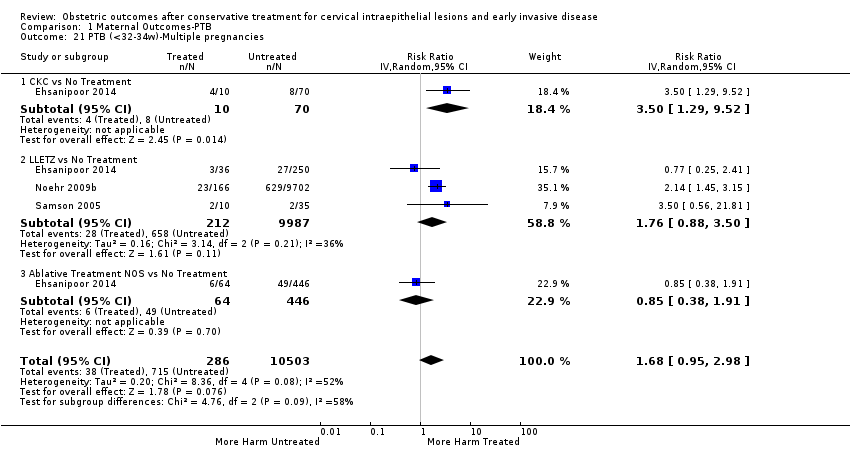
Comparison 1 Maternal Outcomes‐PTB, Outcome 21 PTB (<32‐34w)‐Multiple pregnancies.
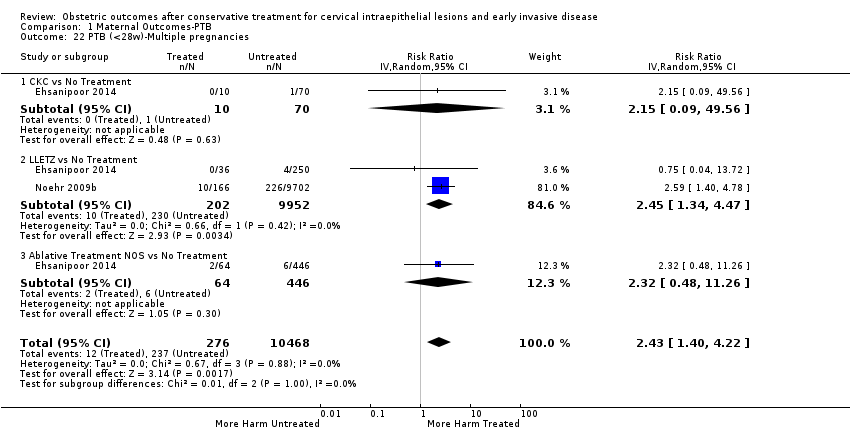
Comparison 1 Maternal Outcomes‐PTB, Outcome 22 PTB (<28w)‐Multiple pregnancies.

Comparison 1 Maternal Outcomes‐PTB, Outcome 23 PTB (<37w)‐Depth≤10‐12mm.

Comparison 1 Maternal Outcomes‐PTB, Outcome 24 PTB (<37w)‐Depth≥10‐12mm.

Comparison 1 Maternal Outcomes‐PTB, Outcome 25 PTB (<37w)‐Depth≥15‐17mm.

Comparison 1 Maternal Outcomes‐PTB, Outcome 26 PTB (<37w)‐Depth≥20mm.
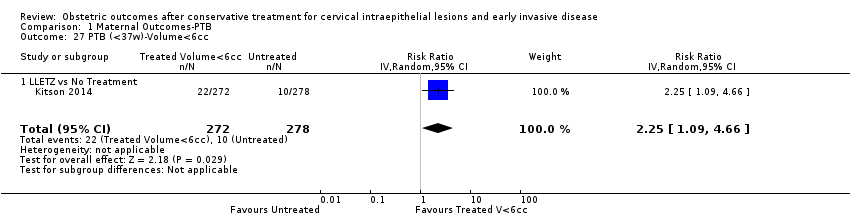
Comparison 1 Maternal Outcomes‐PTB, Outcome 27 PTB (<37w)‐Volume<6cc.

Comparison 1 Maternal Outcomes‐PTB, Outcome 28 PTB (<37w)‐Volume>6cc.

Comparison 1 Maternal Outcomes‐PTB, Outcome 29 PTB (<37w)‐Depth≤10mm.

Comparison 1 Maternal Outcomes‐PTB, Outcome 30 PTB (<37w)‐Depth≤12mm.
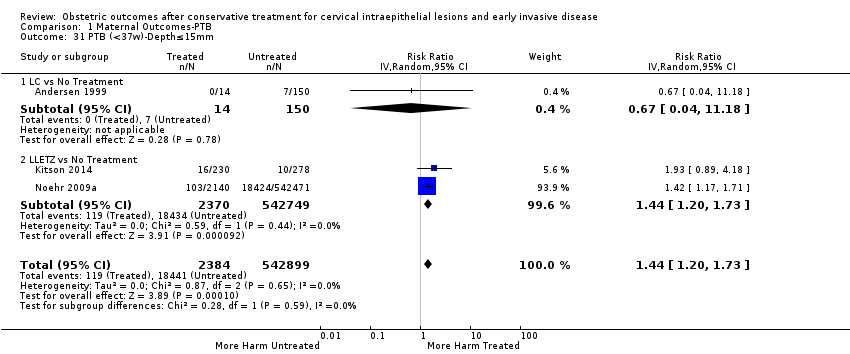
Comparison 1 Maternal Outcomes‐PTB, Outcome 31 PTB (<37w)‐Depth≤15mm.

Comparison 1 Maternal Outcomes‐PTB, Outcome 32 PTB (<37w)‐Depth≤17mm.
Comparison 1 Maternal Outcomes‐PTB, Outcome 33 PTB (<37w)‐Depth≤15‐17mm.
Comparison 1 Maternal Outcomes‐PTB, Outcome 34 PTB (<37w)‐Depth≤20mm.

Comparison 1 Maternal Outcomes‐PTB, Outcome 35 PTB (<37w)‐Depth≥10mm.

Comparison 1 Maternal Outcomes‐PTB, Outcome 36 PTB (<37w)‐Depth≥12mm.
Comparison 1 Maternal Outcomes‐PTB, Outcome 37 PTB (<37w)‐Depth≥15mm.
Comparison 1 Maternal Outcomes‐PTB, Outcome 38 PTB (<37w)‐Depth≥17mm.

Comparison 1 Maternal Outcomes‐PTB, Outcome 39 PTB (<37w)‐Depth 10/13‐15/16mm.
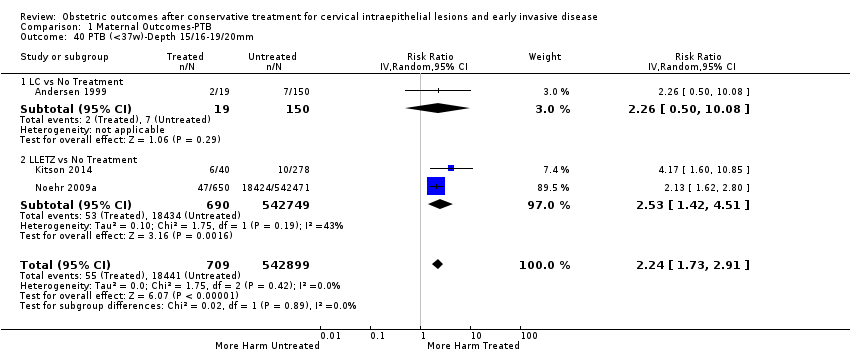
Comparison 1 Maternal Outcomes‐PTB, Outcome 40 PTB (<37w)‐Depth 15/16‐19/20mm.

Comparison 1 Maternal Outcomes‐PTB, Outcome 41 PTB (<37w)‐Volume<3cc.

Comparison 1 Maternal Outcomes‐PTB, Outcome 42 PTB (<37w)‐Volume>3cc.

Comparison 1 Maternal Outcomes‐PTB, Outcome 43 PTB (<37w)‐Depth≥10‐12mm vs ≤10‐12mm.

Comparison 1 Maternal Outcomes‐PTB, Outcome 44 PTB (<37w)‐Depth≥15‐17mm vs ≤15‐17mm.

Comparison 1 Maternal Outcomes‐PTB, Outcome 45 PTB (<37w)‐Depth≥20mm vs ≤20mm.
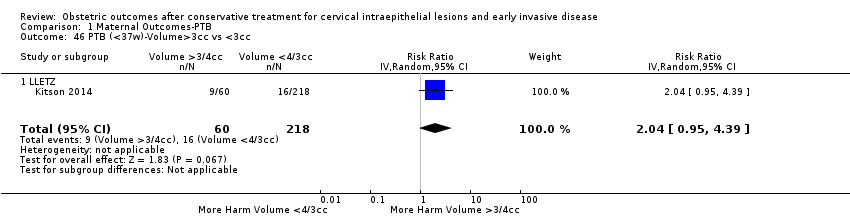
Comparison 1 Maternal Outcomes‐PTB, Outcome 46 PTB (<37w)‐Volume>3cc vs <3cc.
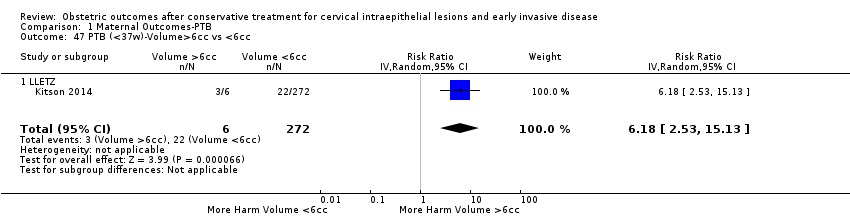
Comparison 1 Maternal Outcomes‐PTB, Outcome 47 PTB (<37w)‐Volume>6cc vs <6cc.

Comparison 1 Maternal Outcomes‐PTB, Outcome 48 PTB (<37w)‐Depth 11/13‐15/16mm vs ≤10‐12mm.

Comparison 1 Maternal Outcomes‐PTB, Outcome 49 PTB (<37w)‐Depth 16‐19mm vs 13‐15mm.
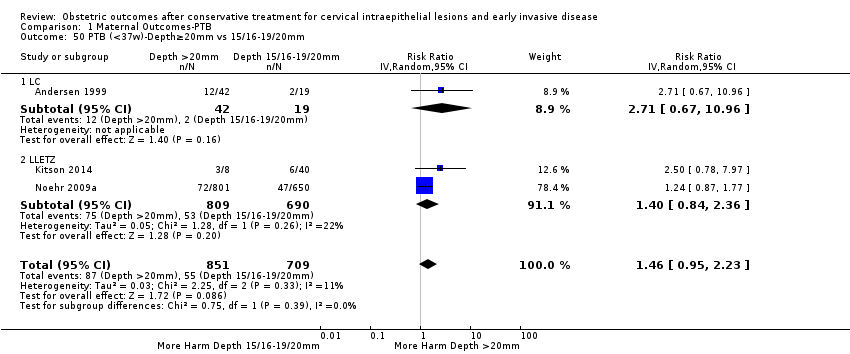
Comparison 1 Maternal Outcomes‐PTB, Outcome 50 PTB (<37w)‐Depth≥20mm vs 15/16‐19/20mm.
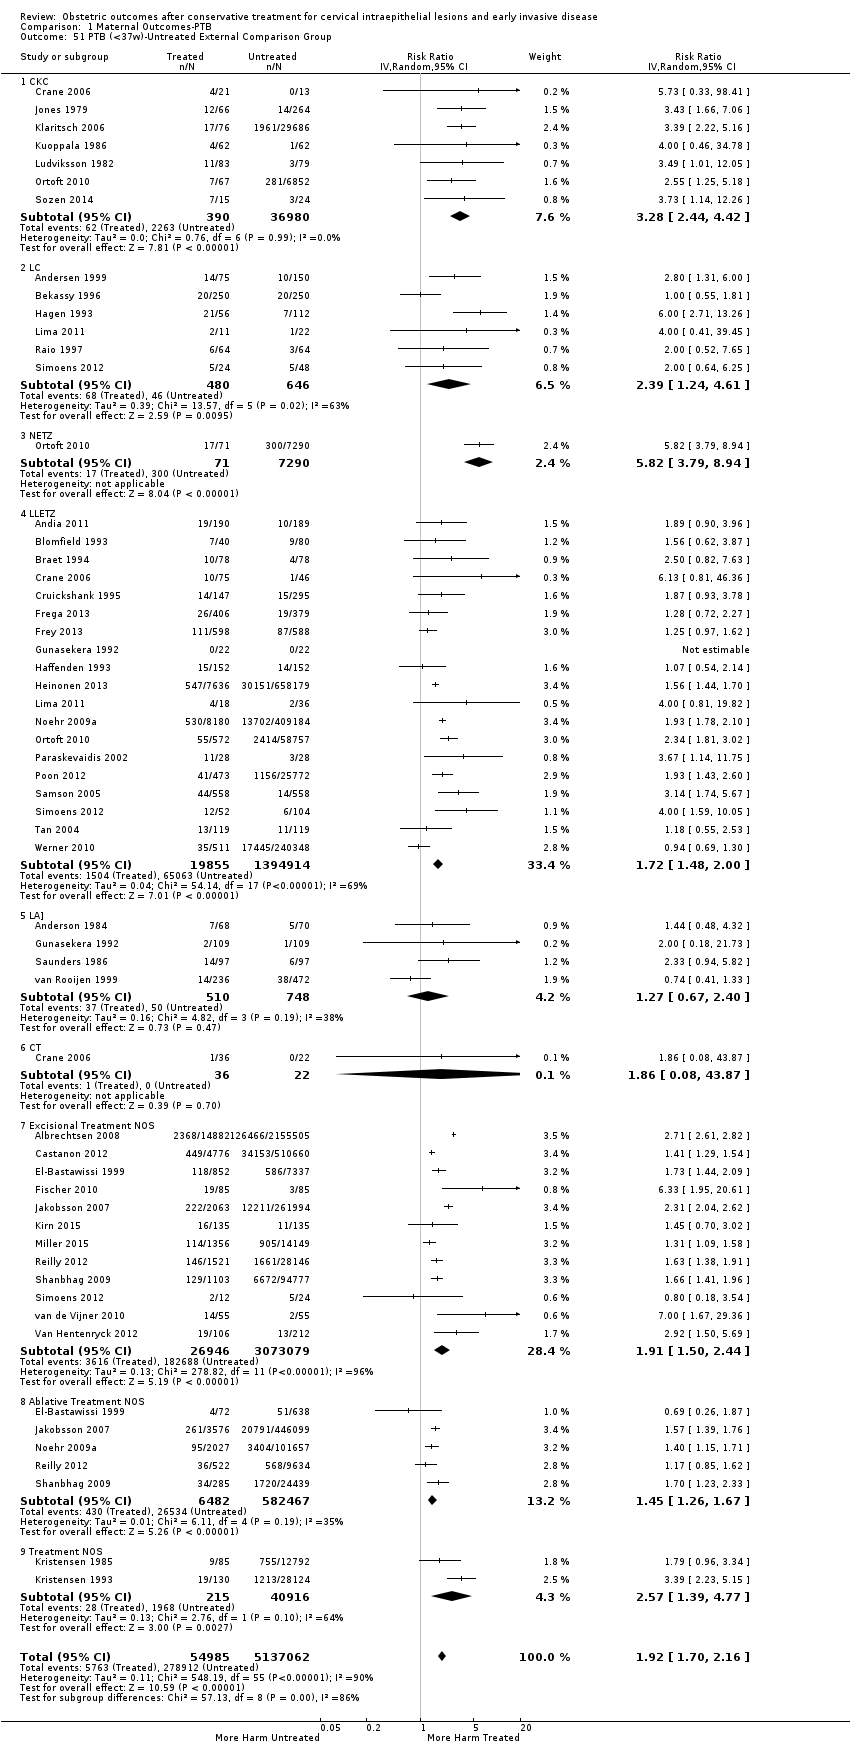
Comparison 1 Maternal Outcomes‐PTB, Outcome 51 PTB (<37w)‐Untreated External Comparison Group.

Comparison 1 Maternal Outcomes‐PTB, Outcome 52 PTB (<37w)‐Untreated Internal Comparison Group (self‐matching).
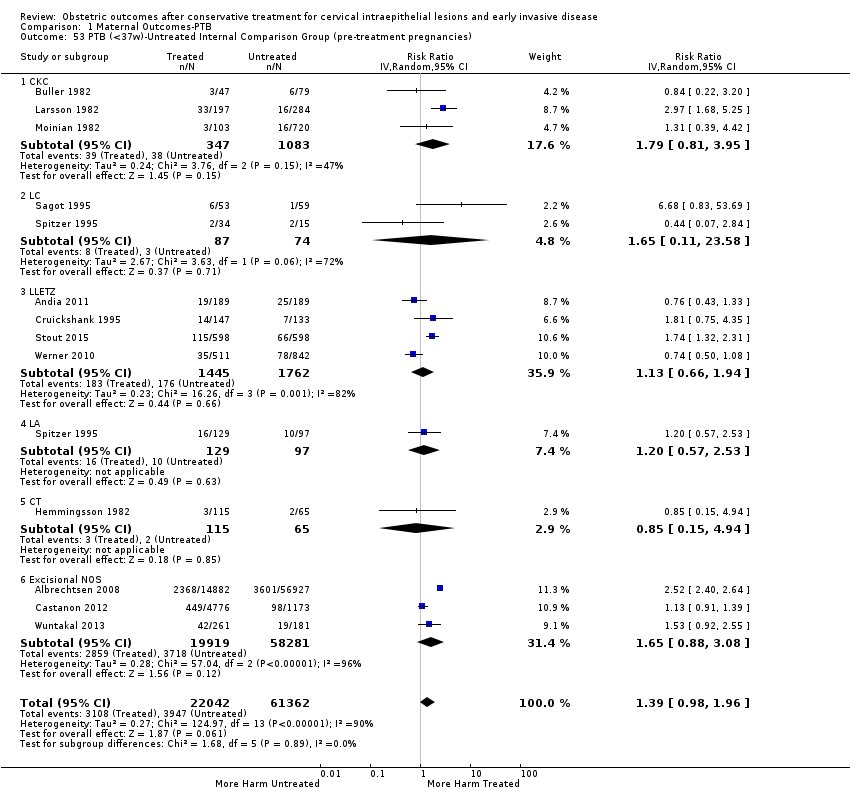
Comparison 1 Maternal Outcomes‐PTB, Outcome 53 PTB (<37w)‐Untreated Internal Comparison Group (pre‐treatment pregnancies).

Comparison 1 Maternal Outcomes‐PTB, Outcome 54 PTB (<37w)‐Untreated Colposcopy+/‐CIN+/‐Biopsy Comparison Group.

Comparison 1 Maternal Outcomes‐PTB, Outcome 55 PTB (<37w)‐Untreated HSIL Comparison Group.

Comparison 1 Maternal Outcomes‐PTB, Outcome 56 PTB (<37w)‐All Comparison Groups.
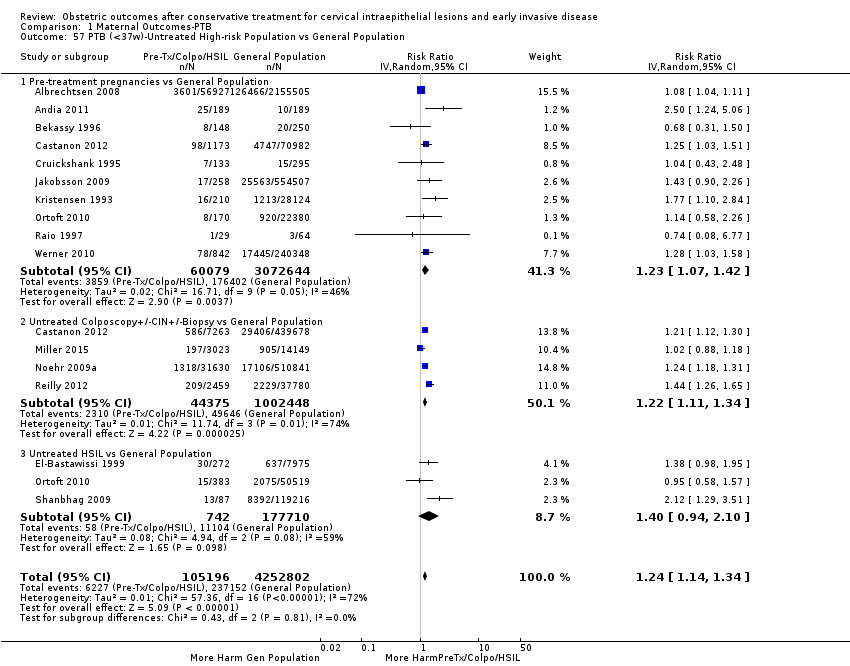
Comparison 1 Maternal Outcomes‐PTB, Outcome 57 PTB (<37w)‐Untreated High‐risk Population vs General Population.
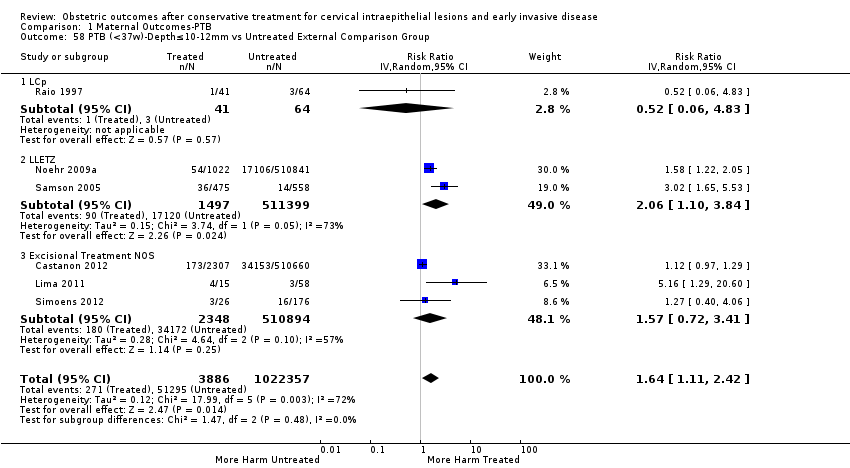
Comparison 1 Maternal Outcomes‐PTB, Outcome 58 PTB (<37w)‐Depth≤10‐12mm vs Untreated External Comparison Group.

Comparison 1 Maternal Outcomes‐PTB, Outcome 59 PTB (<37w)‐Depth≤10‐12mm vs Untreated Internal Comparison Group.
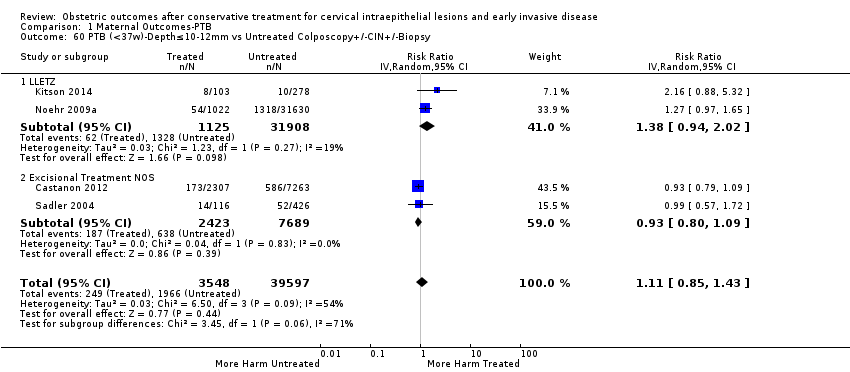
Comparison 1 Maternal Outcomes‐PTB, Outcome 60 PTB (<37w)‐Depth≤10‐12mm vs Untreated Colposcopy+/‐CIN+/‐Biopsy.

Comparison 1 Maternal Outcomes‐PTB, Outcome 61 PTB (<37w)‐Depth≤15‐17mm vs Untreated External Comparison Group.

Comparison 1 Maternal Outcomes‐PTB, Outcome 62 PTB (<37w)‐Depth≤15‐17mm vs Untreated Colposcopy+/‐CIN+/‐Biopsy.
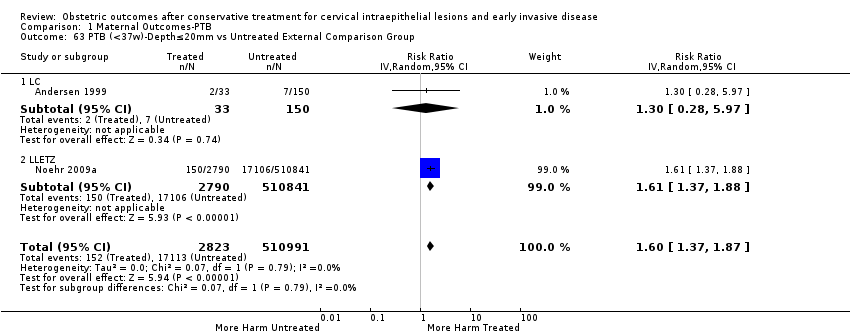
Comparison 1 Maternal Outcomes‐PTB, Outcome 63 PTB (<37w)‐Depth≤20mm vs Untreated External Comparison Group.
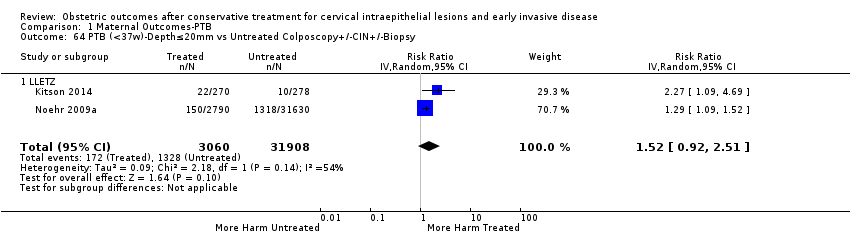
Comparison 1 Maternal Outcomes‐PTB, Outcome 64 PTB (<37w)‐Depth≤20mm vs Untreated Colposcopy+/‐CIN+/‐Biopsy.

Comparison 1 Maternal Outcomes‐PTB, Outcome 65 PTB (<37w)‐Depth≥10‐12mm vs Untreated External Comparison Group.

Comparison 1 Maternal Outcomes‐PTB, Outcome 66 PTB (<37w)‐Depth≥10‐12mm vs Untreated Internal Comparison Group.

Comparison 1 Maternal Outcomes‐PTB, Outcome 67 PTB (<37w)‐Depth≥10‐12mm vs Untreated Colposcopy+/‐CIN+/‐Biopsy.

Comparison 1 Maternal Outcomes‐PTB, Outcome 68 PTB (<37w)‐Depth≥15‐17mm vs Untreated External Comparison Group.
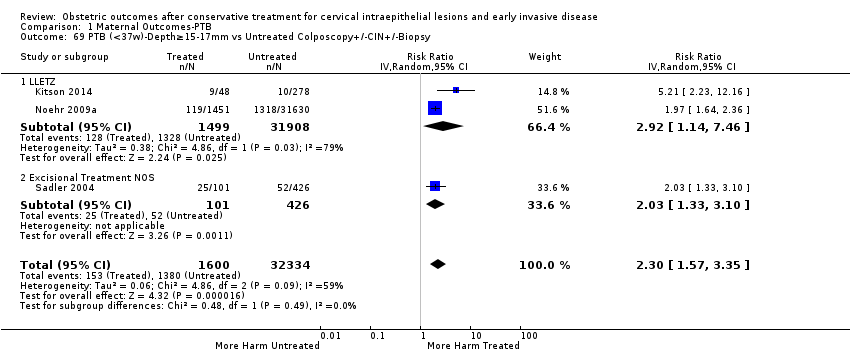
Comparison 1 Maternal Outcomes‐PTB, Outcome 69 PTB (<37w)‐Depth≥15‐17mm vs Untreated Colposcopy+/‐CIN+/‐Biopsy.

Comparison 1 Maternal Outcomes‐PTB, Outcome 70 PTB (<37w)‐Depth≥20mm vs Untreated External Comparison Group.

Comparison 1 Maternal Outcomes‐PTB, Outcome 71 PTB (<37w)‐Depth≥20mm vs Untreated Colposcopy+/‐CIN+/‐Biopsy.

Comparison 1 Maternal Outcomes‐PTB, Outcome 72 PTB (<37w)‐Depth 10/13‐15/16mm vs Untreated External Comparison Group.

Comparison 1 Maternal Outcomes‐PTB, Outcome 73 PTB (<37w)‐Depth 10/13‐15/16mm vs Untreated Colposcopy+/‐CIN+/‐Biopsy.

Comparison 1 Maternal Outcomes‐PTB, Outcome 74 PTB (<37w)‐Depth 15/16‐19/20mm vs Untreated External Comparison Group.

Comparison 1 Maternal Outcomes‐PTB, Outcome 75 PTB (<37w)‐Depth 15/16‐19/20mm vs Untreated Colposcopy+/‐CIN+/‐Biopsy.
Comparison 2 Other maternal Outcomes, Outcome 1 sPTB (<37w).
Comparison 2 Other maternal Outcomes, Outcome 2 sPTB (<32‐34w).
Comparison 2 Other maternal Outcomes, Outcome 3 sPTB (<28w).
Comparison 2 Other maternal Outcomes, Outcome 4 pPROM (<37w).

Comparison 2 Other maternal Outcomes, Outcome 5 pPROM (<32w).
Comparison 2 Other maternal Outcomes, Outcome 6 pPROM (<28w).
Comparison 2 Other maternal Outcomes, Outcome 7 Threatened PTB.
Comparison 2 Other maternal Outcomes, Outcome 8 Chorioamnionitis.
Comparison 2 Other maternal Outcomes, Outcome 9 Caeserean Section.

Comparison 2 Other maternal Outcomes, Outcome 10 Instrumental Deliveries (ventouse/forceps).
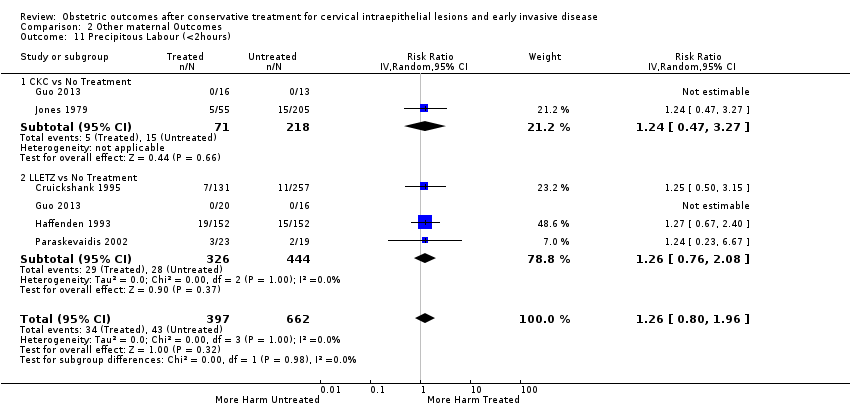
Comparison 2 Other maternal Outcomes, Outcome 11 Precipitous Labour (<2hours).

Comparison 2 Other maternal Outcomes, Outcome 12 Prolonged labour (>12hours).
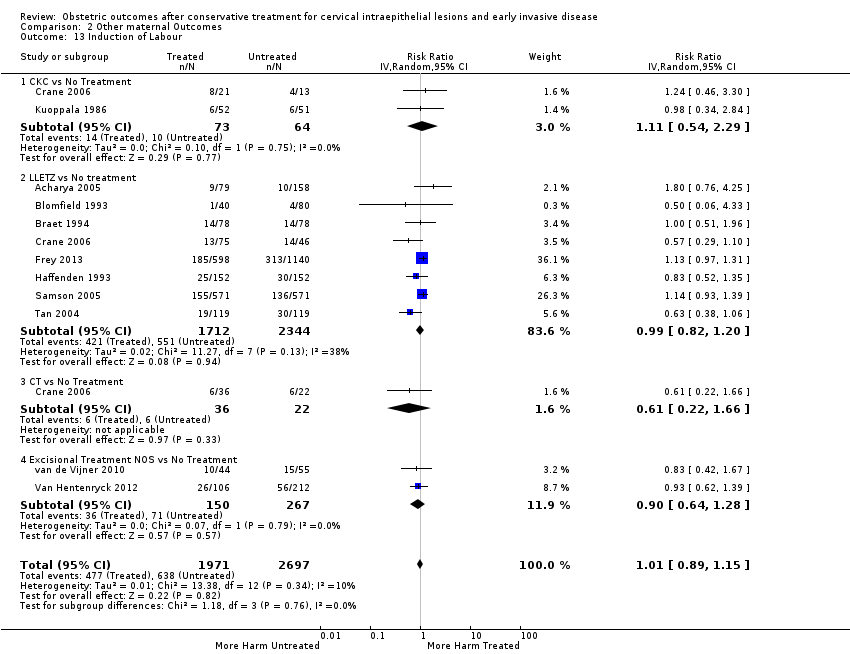
Comparison 2 Other maternal Outcomes, Outcome 13 Induction of Labour.

Comparison 2 Other maternal Outcomes, Outcome 14 Oxytocin Use.

Comparison 2 Other maternal Outcomes, Outcome 15 Epidural Use.

Comparison 2 Other maternal Outcomes, Outcome 16 Pethidine Use.

Comparison 2 Other maternal Outcomes, Outcome 17 Analgesia Use NOS.

Comparison 2 Other maternal Outcomes, Outcome 18 Cervical stenosis.

Comparison 2 Other maternal Outcomes, Outcome 19 Antepartum Haemorrhage.
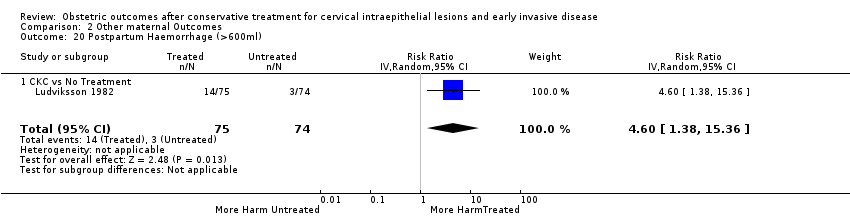
Comparison 2 Other maternal Outcomes, Outcome 20 Postpartum Haemorrhage (>600ml).

Comparison 2 Other maternal Outcomes, Outcome 21 Massive Obstetric Haemorrhage (>1000ml).
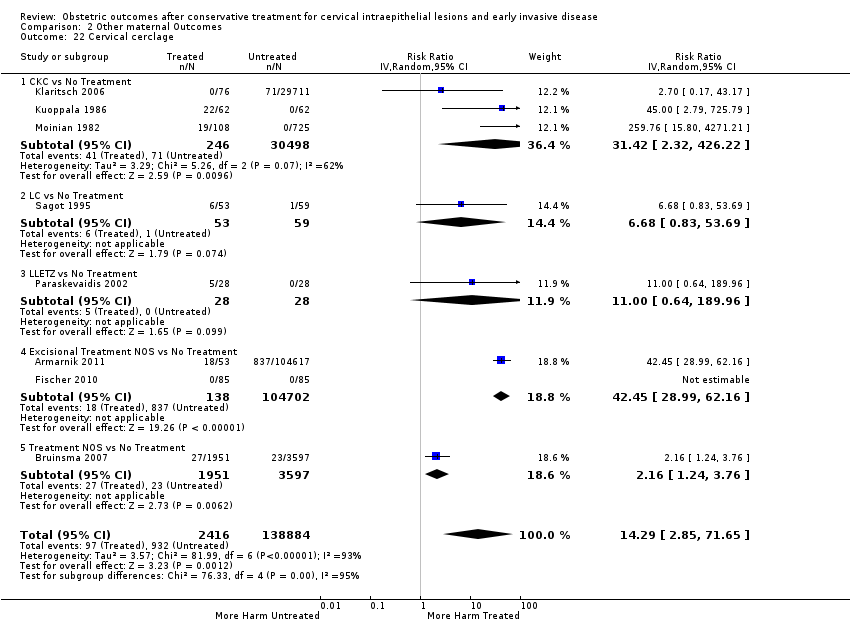
Comparison 2 Other maternal Outcomes, Outcome 22 Cervical cerclage.

Comparison 3 Neonatal Outcomes, Outcome 1 LBW (<2500g).

Comparison 3 Neonatal Outcomes, Outcome 2 LBW (<2000g).
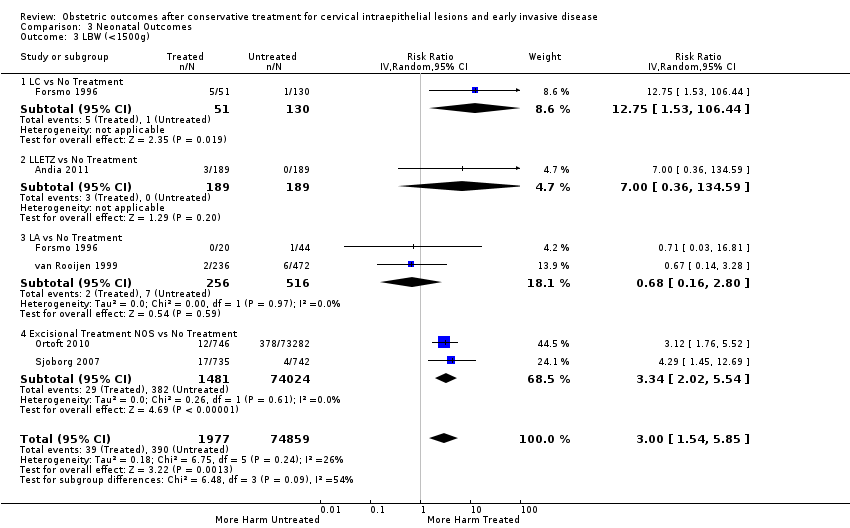
Comparison 3 Neonatal Outcomes, Outcome 3 LBW (<1500g).

Comparison 3 Neonatal Outcomes, Outcome 4 LBW (<1000g).

Comparison 3 Neonatal Outcomes, Outcome 5 NICU Admission.
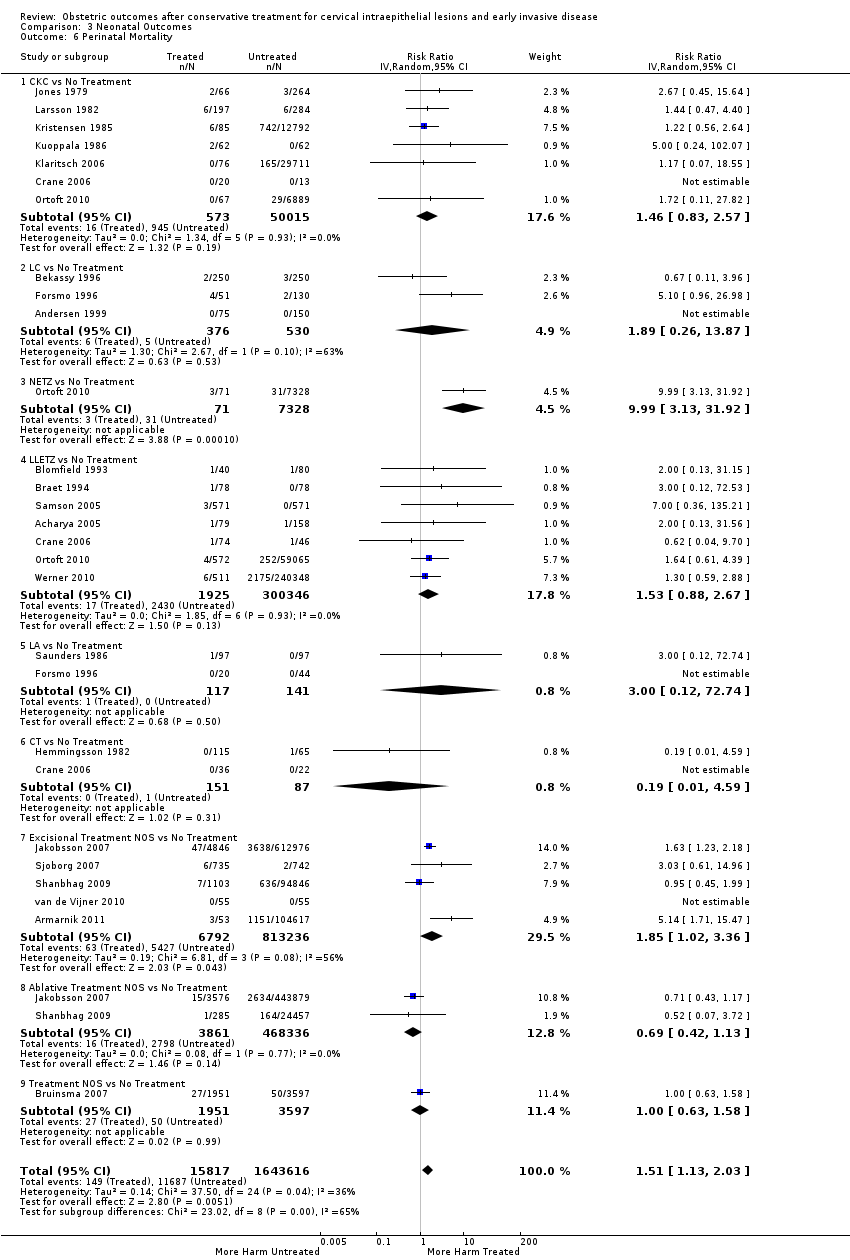
Comparison 3 Neonatal Outcomes, Outcome 6 Perinatal Mortality.
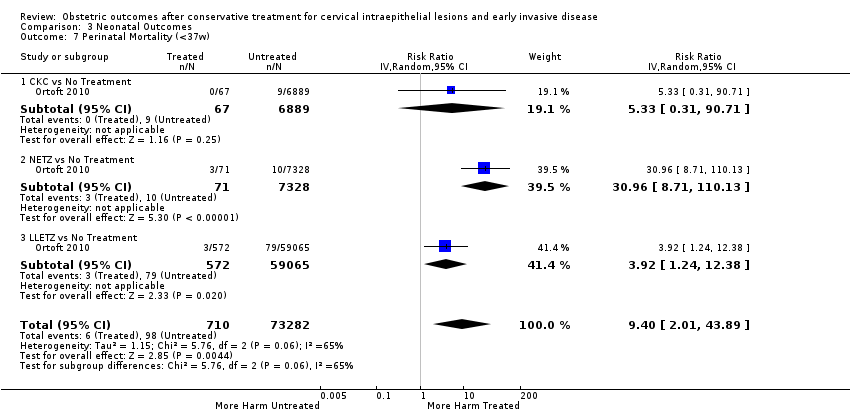
Comparison 3 Neonatal Outcomes, Outcome 7 Perinatal Mortality (<37w).
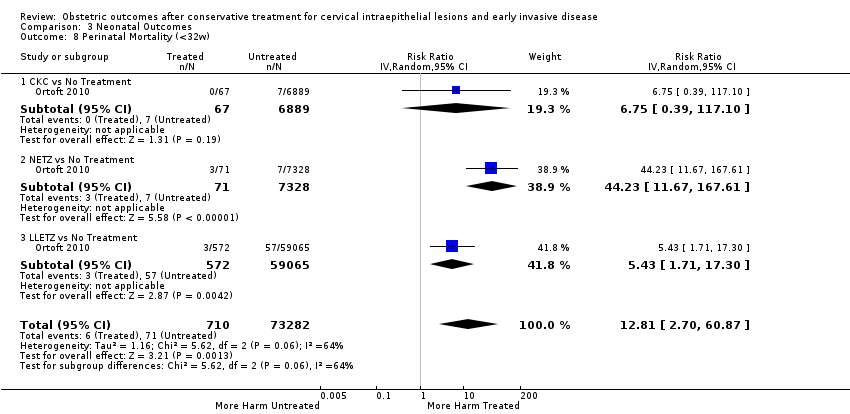
Comparison 3 Neonatal Outcomes, Outcome 8 Perinatal Mortality (<32w).
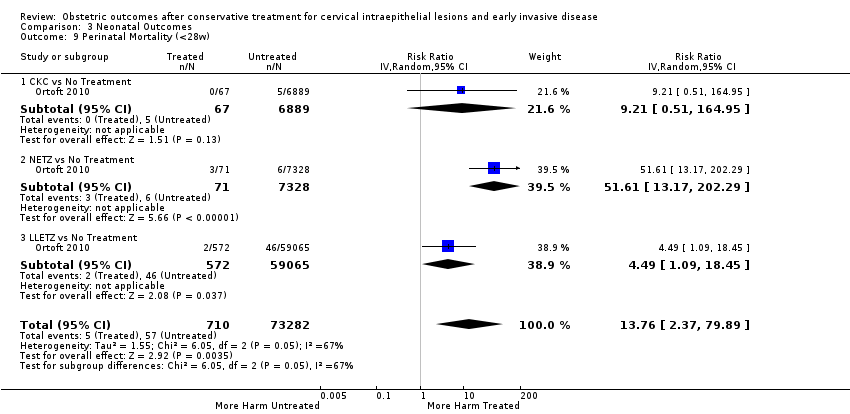
Comparison 3 Neonatal Outcomes, Outcome 9 Perinatal Mortality (<28w).
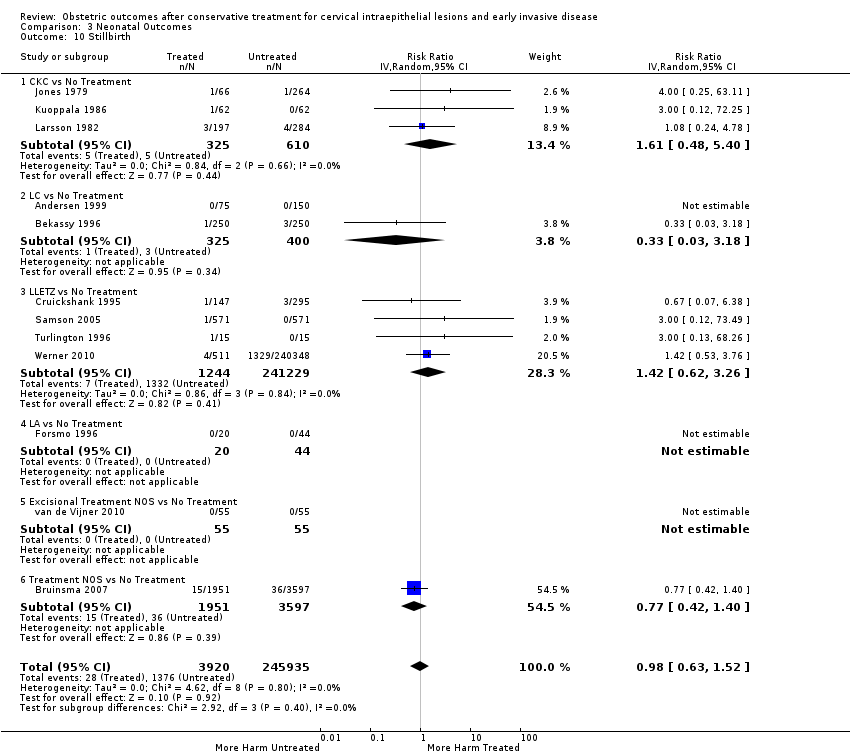
Comparison 3 Neonatal Outcomes, Outcome 10 Stillbirth.
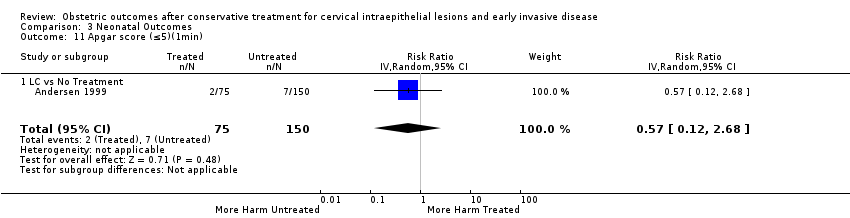
Comparison 3 Neonatal Outcomes, Outcome 11 Apgar score (≤5)(1min).

Comparison 3 Neonatal Outcomes, Outcome 12 Apgar score (<7)(1min).

Comparison 3 Neonatal Outcomes, Outcome 13 Apgar score (<7)(5min).
| The effect of treatment for CIN on maternal outcomes | ||||||
| Patient or population: women with known obstetric outcomes | ||||||
| Outcomes | Anticipated absolute effects* (95% CI) | Relative effect | № of participants | Quality of the evidence | Comments | |
| Risk with [comparison] | Risk with [intervention] | |||||
| PTB (< 37 w) | Study population | RR 1.75 | 5,242,917 | ⊕⊝⊝⊝ | ||
| 54 per 1000 | 95 per 1000 | |||||
| PTB (< 32 to 34 w) | Study population | RR 2.25 | 3,793,874 | ⊕⊝⊝⊝ | ||
| 14 per 1000 | 32 per 1000 | |||||
| PTB (< 28 to 30 w) | Study population | RR 2.23 | 3,910,629 | ⊕⊝⊝⊝ | ||
| 3 per 1000 | 7 per 1000 | |||||
| PTB (< 37 w) ‐ Repeat cones versus No Treatment | Study population | RR 3.78 | 1,317,284 | ⊕⊝⊝⊝ | ||
| 41 per 1000 | 156 per 1000 | |||||
| pPROM (<3 7 w) | Study population | RR 2.36 | 477,011 | ⊕⊝⊝⊝ | ||
| 34 per 1000 | 80 per 1000 | |||||
| PTB (< 37 w) ‐ Depth ≤ 10 mm to 12 mm versus No Treatment | Study population | RR 1.54 | 550,929 | ⊕⊝⊝⊝ | ||
| 34 per 1000 | 53 per 1000 | |||||
| PTB (< 37 w) ‐ PTB (< 37 w) ‐ Depth ≥10 mm to 12 mm versus No Treatment | Study population | RR 1.93 | 552,711 | ⊕⊕⊕⊝ | ||
| 34 per 1000 | 66 per 1000 | |||||
| PTB (< 37w) ‐ PTB (<37w) ‐ Depth ≥15 to 17mm versus No Treatment | Study population | RR 2.77 | 544,986 | ⊕⊕⊕⊕ | ||
| 34 per 1000 | 94 per 1000 | |||||
| PTB (< 37 w) ‐ PTB (< 37 w) ‐ Depth ≥ 20 mm versus No Treatment | Study population | RR 4.91 | 543,750 | ⊕⊕⊕⊕ | ||
| 34 per 1000 | 167 per 1000 | |||||
| *The risk in the intervention group (and its 95% confidence interval) is based on the assumed risk in the comparison group and the relative effect of the intervention (and its 95% CI). | ||||||
| GRADE Working Group grades of evidence | ||||||
| 1 Low‐quality evidence (based on observational studies only) is downgraded one level because of considerable heterogeneity (I2 90%) 2 Low‐quality evidence (based on observational studies only) is downgraded one level because of considerable heterogeneity (I2 83%) and suspected publication bias 3 Low‐quality evidence (based on observational studies only) is downgraded one level because of considerable heterogeneity (I2 84%) 4 Low‐quality evidence (based on observational studies only) is downgraded one level because of considerable heterogeneity (I2 75%) 5 Low‐quality evidence (based on observational studies only) is downgraded one level because of considerable heterogeneity (I2 79%) 6 Low‐quality evidence (based on observational studies only) is downgraded one level because of substantial heterogeneity (I2 67%) 7 Low‐quality evidence (based on observational studies only); heterogeneity was low (I2 37%) 8 Low‐quality evidence (based on observational studies only) is downgraded one level because of moderate heterogeneity (I2 53%) 9 Low‐quality evidence (based on observational studies only) is downgraded one level because of considerable heterogeneity (I2 77%) | ||||||
| The effect of treatment for CIN on neonatal outcomes | ||||||
| Patient or population: women with known obstetric outcomes | ||||||
| Outcomes | Anticipated absolute effects* (95% CI) | Relative effect | № of participants | Quality of the evidence | Comments | |
| Risk with No Treatment | Risk with Treatment | |||||
| LBW (< 2500 g) ‐ Treatment versus No Treatment | Study population | RR 1.81 | 1,348,206 | ⊕⊝⊝⊝ | ||
| 37 per 1000 | 66 per 1000 | |||||
| NICU Admission ‐ Treatment versus No Treatment | Study population | RR 1.45 | 2557 | ⊕⊕⊝⊝ | ||
| 89 per 1000 | 130 per 1000 | |||||
| Perinatal Mortality ‐ Treatment versus No Treatment | Study population | RR 1.51 | 1,659,433 | ⊕⊕⊝⊝ | ||
| 7 per 1000 | 11 per 1000 | |||||
| *The risk in the intervention group (and its 95% confidence interval) is based on the assumed risk in the comparison group and the relative effect of the intervention (and its 95% CI). | ||||||
| GRADE Working Group grades of evidence | ||||||
| 1 Low‐quality evidence (based on observational studies only) is downgraded one level because of substantial heterogeneity (I2 63%) | ||||||
| Outcome or subgroup title | No. of studies | No. of participants | Statistical method | Effect size |
| 1 PTB (<37w) Show forest plot | 59 | 5.242917E6 | Risk Ratio (IV, Random, 95% CI) | 1.75 [1.57, 1.96] |
| 1.1 Excisional Treatment vs No Treatment | 53 | 4.599416E6 | Risk Ratio (IV, Random, 95% CI) | 1.87 [1.64, 2.12] |
| 1.2 Ablative Treatment vs No Treatment | 14 | 602370 | Risk Ratio (IV, Random, 95% CI) | 1.35 [1.20, 1.52] |
| 1.3 Treatment NOS vs No Treatment | 2 | 41131 | Risk Ratio (IV, Random, 95% CI) | 2.57 [1.39, 4.77] |
| 2 PTB (<37w)‐Analysis by treatment modality Show forest plot | 59 | 5.242917E6 | Risk Ratio (IV, Random, 95% CI) | 1.78 [1.60, 1.98] |
| 2.1 CKC vs No Treatment | 12 | 39102 | Risk Ratio (IV, Random, 95% CI) | 2.70 [2.14, 3.40] |
| 2.2 LC vs No Treatment | 9 | 1509 | Risk Ratio (IV, Random, 95% CI) | 2.11 [1.26, 3.54] |
| 2.3 NETZ vs No Treatment | 1 | 7399 | Risk Ratio (IV, Random, 95% CI) | 5.83 [3.80, 8.95] |
| 2.4 LLETZ vs No Treatment | 25 | 1.445104E6 | Risk Ratio (IV, Random, 95% CI) | 1.58 [1.37, 1.81] |
| 2.5 FCBE vs No Treatment | 1 | 71 | Risk Ratio (IV, Random, 95% CI) | 5.22 [1.09, 24.90] |
| 2.6 LA vs No Treatment | 7 | 4710 | Risk Ratio (IV, Random, 95% CI) | 1.04 [0.86, 1.26] |
| 2.7 CT vs No Treatment | 2 | 238 | Risk Ratio (IV, Random, 95% CI) | 1.02 [0.22, 4.77] |
| 2.8 RD vs No Treatment | 1 | 2150 | Risk Ratio (IV, Random, 95% CI) | 1.62 [1.27, 2.06] |
| 2.9 Excisional Treatment NOS vs No Treatment | 15 | 3.106231E6 | Risk Ratio (IV, Random, 95% CI) | 1.90 [1.50, 2.41] |
| 2.10 Ablative Treatment NOS vs No Treatment | 5 | 595272 | Risk Ratio (IV, Random, 95% CI) | 1.46 [1.27, 1.66] |
| 2.11 Treatment NOS vs No Treatment | 2 | 41131 | Risk Ratio (IV, Random, 95% CI) | 2.57 [1.39, 4.77] |
| 3 PTB (<32‐34w) Show forest plot | 24 | 3.793874E6 | Risk Ratio (IV, Random, 95% CI) | 2.25 [1.79, 2.82] |
| 3.1 Excisional Treatment vs No Treatment | 22 | 3.666567E6 | Risk Ratio (IV, Random, 95% CI) | 2.48 [1.92, 3.20] |
| 3.2 Ablative Treatment vs No Treatment | 3 | 120820 | Risk Ratio (IV, Random, 95% CI) | 1.59 [1.08, 2.35] |
| 3.3 Treatment NOS vs No treatment | 2 | 6487 | Risk Ratio (IV, Random, 95% CI) | 1.65 [1.13, 2.42] |
| 4 PTB (<32‐34w)‐Analysis by treatment modality Show forest plot | 24 | 3.793874E6 | Risk Ratio (IV, Random, 95% CI) | 2.35 [1.88, 2.95] |
| 4.1 CKC vs No Treatment | 5 | 36979 | Risk Ratio (IV, Random, 95% CI) | 3.07 [1.72, 5.49] |
| 4.2 NETZ vs No Treatment | 1 | 7399 | Risk Ratio (IV, Random, 95% CI) | 10.53 [4.33, 25.65] |
| 4.3 LLETZ vs No Treatment | 11 | 791554 | Risk Ratio (IV, Random, 95% CI) | 2.13 [1.66, 2.75] |
| 4.4 CT vs No Treatment | 1 | 58 | Risk Ratio (IV, Random, 95% CI) | 1.86 [0.08, 43.87] |
| 4.5 Excisional Treatment NOS vs No Treatment | 9 | 2.830635E6 | Risk Ratio (IV, Random, 95% CI) | 2.94 [1.82, 4.77] |
| 4.6 Ablative Treatment NOS vs No Treatment | 2 | 120762 | Risk Ratio (IV, Random, 95% CI) | 1.59 [1.08, 2.35] |
| 4.7 Treatment NOS vs No treatment | 2 | 6487 | Risk Ratio (IV, Random, 95% CI) | 1.65 [1.13, 2.42] |
| 5 PTB (<28‐30w) Show forest plot | 8 | 3.910629E6 | Risk Ratio (IV, Random, 95% CI) | 2.23 [1.55, 3.22] |
| 5.1 Excisional Treatment vs No Treatment | 7 | 3.337003E6 | Risk Ratio (IV, Random, 95% CI) | 2.81 [1.91, 4.15] |
| 5.2 Ablative Treatment vs No Treatment | 3 | 568217 | Risk Ratio (IV, Random, 95% CI) | 1.38 [0.81, 2.36] |
| 5.3 Treatment NOS vs No Treatment | 1 | 5409 | Risk Ratio (IV, Random, 95% CI) | 1.75 [1.05, 2.91] |
| 6 PTB (<28‐30w)‐Analysis by treatment modality Show forest plot | 8 | 3.910629E6 | Risk Ratio (IV, Random, 95% CI) | 2.43 [1.69, 3.49] |
| 6.1 CKC vs No Treatment | 2 | 7118 | Risk Ratio (IV, Random, 95% CI) | 4.52 [0.83, 24.54] |
| 6.2 NETZ vs No Treatment | 1 | 7399 | Risk Ratio (IV, Random, 95% CI) | 14.74 [4.50, 48.32] |
| 6.3 LLETZ vs No Treatment | 3 | 502778 | Risk Ratio (IV, Random, 95% CI) | 2.57 [1.97, 3.35] |
| 6.4 Excisional Treatment NOS vs No treatment | 3 | 2.819708E6 | Risk Ratio (IV, Random, 95% CI) | 2.54 [1.30, 4.99] |
| 6.5 Ablative Treatment NOS vs No Treatment | 3 | 568217 | Risk Ratio (IV, Random, 95% CI) | 1.38 [0.81, 2.36] |
| 6.6 Treatment NOS vs No Treatment | 1 | 5409 | Risk Ratio (IV, Random, 95% CI) | 1.75 [1.05, 2.91] |
| 7 PTB (≤34w) Show forest plot | 15 | 424567 | Risk Ratio (IV, Random, 95% CI) | 2.59 [1.78, 3.77] |
| 7.1 Excisional Treatment vs No Treatment | 15 | 424509 | Risk Ratio (IV, Random, 95% CI) | 2.61 [1.78, 3.83] |
| 7.2 Ablative Treatment vs No Treatment | 1 | 58 | Risk Ratio (IV, Random, 95% CI) | 1.86 [0.08, 43.87] |
| 8 PTB (≤34w)‐Analysis by treatment modality Show forest plot | 15 | 424567 | Risk Ratio (IV, Random, 95% CI) | 2.56 [1.78, 3.69] |
| 8.1 CKC vs No Treatment | 4 | 30023 | Risk Ratio (IV, Random, 95% CI) | 2.85 [1.50, 5.41] |
| 8.2 LLETZ vs No Treatment | 9 | 289218 | Risk Ratio (IV, Random, 95% CI) | 1.83 [1.41, 2.39] |
| 8.3 CT vs No Treatment | 1 | 58 | Risk Ratio (IV, Random, 95% CI) | 1.86 [0.08, 43.87] |
| 8.4 Excisional Treatment NOS vs No Treatment | 4 | 105268 | Risk Ratio (IV, Random, 95% CI) | 7.30 [4.17, 12.80] |
| 9 PTB (<32‐33w) Show forest plot | 10 | 3.369685E6 | Risk Ratio (IV, Random, 95% CI) | 2.08 [1.55, 2.79] |
| 9.1 Excisional Treatment vs No Treatment | 8 | 3.242436E6 | Risk Ratio (IV, Random, 95% CI) | 2.43 [1.70, 3.47] |
| 9.2 Ablative Treatment vs No Treatment | 2 | 120762 | Risk Ratio (IV, Random, 95% CI) | 1.59 [1.08, 2.35] |
| 9.3 Treatment NOS vs No treatment | 2 | 6487 | Risk Ratio (IV, Random, 95% CI) | 1.65 [1.13, 2.42] |
| 10 PTB (<32‐33w)‐Analysis by treatment modality Show forest plot | 10 | 3.369685E6 | Risk Ratio (IV, Random, 95% CI) | 2.26 [1.70, 3.01] |
| 10.1 CKC vs No Treatment | 1 | 6956 | Risk Ratio (IV, Random, 95% CI) | 4.38 [1.08, 17.65] |
| 10.2 NETZ vs No Treatment | 1 | 7399 | Risk Ratio (IV, Random, 95% CI) | 10.53 [4.33, 25.65] |
| 10.3 LLETZ vs No Treatment | 3 | 502714 | Risk Ratio (IV, Random, 95% CI) | 2.74 [2.30, 3.26] |
| 10.4 Excisional Treatment NOS vs No Treatment | 5 | 2.725367E6 | Risk Ratio (IV, Random, 95% CI) | 2.09 [1.20, 3.63] |
| 10.5 Ablative Treatment NOS vs No Treatment | 2 | 120762 | Risk Ratio (IV, Random, 95% CI) | 1.59 [1.08, 2.35] |
| 10.6 Treatment NOS vs No treatment | 2 | 6487 | Risk Ratio (IV, Random, 95% CI) | 1.65 [1.13, 2.42] |
| 11 PTB (<30w) Show forest plot | 1 | 162 | Risk Ratio (IV, Random, 95% CI) | 2.86 [0.12, 69.11] |
| 11.1 Excisional Treatment vs No Treatment | 1 | 162 | Risk Ratio (IV, Random, 95% CI) | 2.86 [0.12, 69.11] |
| 12 PTB (<30w)‐Analysis by treatment modality Show forest plot | 1 | 162 | Risk Ratio (IV, Random, 95% CI) | 2.86 [0.12, 69.11] |
| 12.1 CKC vs No Treatment | 1 | 162 | Risk Ratio (IV, Random, 95% CI) | 2.86 [0.12, 69.11] |
| 13 PTB (<28w) Show forest plot | 7 | 3.910467E6 | Risk Ratio (IV, Random, 95% CI) | 2.22 [1.54, 3.22] |
| 13.1 Excisional Treatment vs No Treatment | 6 | 3.336841E6 | Risk Ratio (IV, Random, 95% CI) | 2.81 [1.89, 4.18] |
| 13.2 Ablative treatment vs No Treatment | 3 | 568217 | Risk Ratio (IV, Random, 95% CI) | 1.38 [0.81, 2.36] |
| 13.3 Treatment NOS vs No Treatment | 1 | 5409 | Risk Ratio (IV, Random, 95% CI) | 1.75 [1.05, 2.91] |
| 14 PTB (<28w)‐Analysis by treatment modality Show forest plot | 6 | 3.905058E6 | Risk Ratio (IV, Random, 95% CI) | 2.52 [1.71, 3.72] |
| 14.1 CKC vs No Treatment | 1 | 6956 | Risk Ratio (IV, Random, 95% CI) | 5.41 [0.74, 39.84] |
| 14.2 NETZ vs No Treatment | 1 | 7399 | Risk Ratio (IV, Random, 95% CI) | 14.74 [4.50, 48.32] |
| 14.3 LLETZ vs No Treatment | 3 | 502778 | Risk Ratio (IV, Random, 95% CI) | 2.57 [1.97, 3.35] |
| 14.4 Excisional Treatment NOS vs No treatment | 3 | 2.819708E6 | Risk Ratio (IV, Random, 95% CI) | 2.54 [1.30, 4.99] |
| 14.5 Ablative Treatment NOS vs No Treatment | 3 | 568217 | Risk Ratio (IV, Random, 95% CI) | 1.38 [0.81, 2.36] |
| 15 PTB (<37w)‐Nulliparous women Show forest plot | 6 | 245707 | Risk Ratio (IV, Random, 95% CI) | 1.92 [1.23, 2.98] |
| 15.1 LC vs No Treatment | 2 | 267 | Risk Ratio (IV, Random, 95% CI) | 2.18 [1.09, 4.37] |
| 15.2 LLETZ vs No Treatment | 3 | 231344 | Risk Ratio (IV, Random, 95% CI) | 1.51 [0.76, 3.02] |
| 15.3 Treatment NOS versus No Treatment | 1 | 14096 | Risk Ratio (IV, Random, 95% CI) | 3.53 [1.70, 7.33] |
| 16 PTB (<37w)‐Parous women Show forest plot | 5 | 339507 | Risk Ratio (IV, Random, 95% CI) | 2.05 [0.95, 4.43] |
| 16.1 LC vs No Treatment | 2 | 401 | Risk Ratio (IV, Random, 95% CI) | 2.82 [0.16, 49.84] |
| 16.2 LLETZ vs No Treatment | 2 | 324948 | Risk Ratio (IV, Random, 95% CI) | 1.20 [0.22, 6.65] |
| 16.3 Treatment NOS vs No Treatment | 1 | 14158 | Risk Ratio (IV, Random, 95% CI) | 3.73 [2.23, 6.22] |
| 17 PTB (<37w)‐Single cone Show forest plot | 17 | 1.367023E6 | Risk Ratio (IV, Random, 95% CI) | 1.75 [1.49, 2.06] |
| 17.1 CKC vs No Treatment | 3 | 36783 | Risk Ratio (IV, Random, 95% CI) | 2.89 [2.08, 4.03] |
| 17.2 LC vs No Treatment | 2 | 657 | Risk Ratio (IV, Random, 95% CI) | 1.06 [0.54, 2.09] |
| 17.3 NETZ vs No Treatment | 1 | 7399 | Risk Ratio (IV, Random, 95% CI) | 5.83 [3.80, 8.95] |
| 17.4 LLETZ vs No Treatment | 9 | 1.277874E6 | Risk Ratio (IV, Random, 95% CI) | 1.74 [1.45, 2.10] |
| 17.5 LA vs No Treatment | 4 | 1421 | Risk Ratio (IV, Random, 95% CI) | 1.07 [0.66, 1.74] |
| 17.6 Excisional Treatment NOS vs No Treatment | 3 | 32106 | Risk Ratio (IV, Random, 95% CI) | 1.88 [1.20, 2.93] |
| 17.7 Ablative Treatment NOS vs No Treatment | 1 | 10783 | Risk Ratio (IV, Random, 95% CI) | 1.14 [0.82, 1.57] |
| 18 PTB (<37w)‐Repeat cones Show forest plot | 11 | 1.317284E6 | Risk Ratio (IV, Random, 95% CI) | 3.78 [2.65, 5.39] |
| 18.1 CKC/LA vs No Treatment | 1 | 99 | Risk Ratio (IV, Random, 95% CI) | 12.56 [5.11, 30.87] |
| 18.2 LC/LC vs No Treatment | 1 | 270 | Risk Ratio (IV, Random, 95% CI) | 3.75 [1.70, 8.27] |
| 18.3 LLETZ/LLETZ vs No Treatment | 4 | 1.202174E6 | Risk Ratio (IV, Random, 95% CI) | 2.81 [2.33, 3.39] |
| 18.4 LLETZ/Treatment NOS vs No Treatment | 1 | 298 | Risk Ratio (IV, Random, 95% CI) | 9.40 [3.53, 25.03] |
| 18.5 Excisional Treatment NOS/Excisional Treatment NOS vs No Treatment | 3 | 73651 | Risk Ratio (IV, Random, 95% CI) | 5.48 [2.68, 11.24] |
| 18.6 Treatment NOS/Treatment NOS vs No Treatment | 2 | 40792 | Risk Ratio (IV, Random, 95% CI) | 1.71 [1.10, 2.67] |
| 19 PTB (<37w)‐Singleton pregnancies Show forest plot | 32 | 2.18962E6 | Risk Ratio (IV, Random, 95% CI) | 1.76 [1.57, 1.98] |
| 19.1 CKC vs No Treatment | 6 | 37759 | Risk Ratio (IV, Random, 95% CI) | 2.89 [2.22, 3.77] |
| 19.2 LC vs No Treatment | 4 | 545 | Risk Ratio (IV, Random, 95% CI) | 2.54 [1.24, 5.20] |
| 19.3 NETZ vs No Treatment | 1 | 7399 | Risk Ratio (IV, Random, 95% CI) | 5.83 [3.80, 8.95] |
| 19.4 LLETZ vs No Treatment | 18 | 1.444175E6 | Risk Ratio (IV, Random, 95% CI) | 1.61 [1.39, 1.87] |
| 19.5 LA vs No Treatment | 3 | 3420 | Risk Ratio (IV, Random, 95% CI) | 1.10 [0.75, 1.62] |
| 19.6 CT vs No Treatment | 1 | 58 | Risk Ratio (IV, Random, 95% CI) | 1.86 [0.08, 43.87] |
| 19.7 RD vs No Treatment | 1 | 2150 | Risk Ratio (IV, Random, 95% CI) | 1.62 [1.27, 2.06] |
| 19.8 Excisional Treatment NOS vs No Treatment | 7 | 542892 | Risk Ratio (IV, Random, 95% CI) | 1.42 [1.17, 1.72] |
| 19.9 Ablative Treatment NOS vs No Treatment | 2 | 110091 | Risk Ratio (IV, Random, 95% CI) | 1.14 [0.56, 2.32] |
| 19.10 Treatment NOS vs No Treatment | 2 | 41131 | Risk Ratio (IV, Random, 95% CI) | 2.57 [1.39, 4.77] |
| 20 PTB (<37w)‐Multiple pregnancies Show forest plot | 5 | 10797 | Risk Ratio (IV, Random, 95% CI) | 1.14 [0.95, 1.35] |
| 20.1 CKC vs No Treatment | 2 | 84 | Risk Ratio (IV, Random, 95% CI) | 0.95 [0.49, 1.83] |
| 20.2 LLETZ vs No Treatment | 3 | 10199 | Risk Ratio (IV, Random, 95% CI) | 1.27 [1.09, 1.47] |
| 20.3 Excisional Treatment NOS vs No Treatment | 1 | 4 | Risk Ratio (IV, Random, 95% CI) | 3.5 [0.31, 39.71] |
| 20.4 Ablative Treatment NOS vs No Treatment | 1 | 510 | Risk Ratio (IV, Random, 95% CI) | 0.93 [0.72, 1.20] |
| 21 PTB (<32‐34w)‐Multiple pregnancies Show forest plot | 3 | 10789 | Risk Ratio (IV, Random, 95% CI) | 1.68 [0.95, 2.98] |
| 21.1 CKC vs No Treatment | 1 | 80 | Risk Ratio (IV, Random, 95% CI) | 3.5 [1.29, 9.52] |
| 21.2 LLETZ vs No Treatment | 3 | 10199 | Risk Ratio (IV, Random, 95% CI) | 1.76 [0.88, 3.50] |
| 21.3 Ablative Treatment NOS vs No Treatment | 1 | 510 | Risk Ratio (IV, Random, 95% CI) | 0.85 [0.38, 1.91] |
| 22 PTB (<28w)‐Multiple pregnancies Show forest plot | 2 | 10744 | Risk Ratio (IV, Random, 95% CI) | 2.43 [1.40, 4.22] |
| 22.1 CKC vs No Treatment | 1 | 80 | Risk Ratio (IV, Random, 95% CI) | 2.15 [0.09, 49.56] |
| 22.2 LLETZ vs No Treatment | 2 | 10154 | Risk Ratio (IV, Random, 95% CI) | 2.45 [1.34, 4.47] |
| 22.3 Ablative Treatment NOS vs No Treatment | 1 | 510 | Risk Ratio (IV, Random, 95% CI) | 2.32 [0.48, 11.26] |
| 23 PTB (<37w)‐Depth≤10‐12mm Show forest plot | 8 | 550929 | Risk Ratio (IV, Random, 95% CI) | 1.54 [1.09, 2.18] |
| 23.1 LC vs No Treatment | 1 | 105 | Risk Ratio (IV, Random, 95% CI) | 0.52 [0.06, 4.83] |
| 23.2 LLETZ vs No Treatment | 3 | 544907 | Risk Ratio (IV, Random, 95% CI) | 2.01 [1.28, 3.15] |
| 23.3 Excisional Treatment NOS vs No Treatment | 4 | 5917 | Risk Ratio (IV, Random, 95% CI) | 1.20 [0.78, 1.85] |
| 24 PTB (<37w)‐Depth≥10‐12mm Show forest plot | 8 | 552711 | Risk Ratio (IV, Random, 95% CI) | 1.93 [1.62, 2.31] |
| 24.1 LC vs No Treatment | 1 | 87 | Risk Ratio (IV, Random, 95% CI) | 4.64 [1.20, 17.88] |
| 24.2 LLETZ vs No Treatment | 3 | 546134 | Risk Ratio (IV, Random, 95% CI) | 2.29 [1.57, 3.34] |
| 24.3 Excisional Treatment NOS vs No Treatment | 4 | 6490 | Risk Ratio (IV, Random, 95% CI) | 1.68 [1.41, 1.99] |
| 25 PTB (<37w)‐Depth≥15‐17mm Show forest plot | 4 | 544986 | Risk Ratio (IV, Random, 95% CI) | 2.77 [1.95, 3.93] |
| 25.1 LC vs No Treatment | 1 | 211 | Risk Ratio (IV, Random, 95% CI) | 4.92 [2.09, 11.59] |
| 25.2 LLETZ vs No Treatment | 2 | 544248 | Risk Ratio (IV, Random, 95% CI) | 3.16 [1.54, 6.48] |
| 25.3 Excisional Treatment NOS vs No Treatment | 1 | 527 | Risk Ratio (IV, Random, 95% CI) | 2.03 [1.33, 3.10] |
| 26 PTB (<37w)‐Depth≥20mm Show forest plot | 3 | 543750 | Risk Ratio (IV, Random, 95% CI) | 4.91 [2.06, 11.68] |
| 26.1 LC vs No Treatment | 1 | 192 | Risk Ratio (IV, Random, 95% CI) | 6.12 [2.57, 14.57] |
| 26.2 LLETZ vs No Treatment | 2 | 543558 | Risk Ratio (IV, Random, 95% CI) | 4.72 [1.25, 17.80] |
| 27 PTB (<37w)‐Volume<6cc Show forest plot | 1 | 550 | Risk Ratio (IV, Random, 95% CI) | 2.25 [1.09, 4.66] |
| 27.1 LLETZ vs No Treatment | 1 | 550 | Risk Ratio (IV, Random, 95% CI) | 2.25 [1.09, 4.66] |
| 28 PTB (<37w)‐Volume>6cc Show forest plot | 1 | 284 | Risk Ratio (IV, Random, 95% CI) | 13.90 [5.09, 37.98] |
| 28.1 LLETZ (Volume>6cc) vs No Treatment | 1 | 284 | Risk Ratio (IV, Random, 95% CI) | 13.90 [5.09, 37.98] |
| 29 PTB (<37w)‐Depth≤10mm Show forest plot | 7 | 7436 | Risk Ratio (IV, Random, 95% CI) | 1.60 [0.99, 2.59] |
| 29.1 LC vs No Treatment | 1 | 105 | Risk Ratio (IV, Random, 95% CI) | 0.52 [0.06, 4.83] |
| 29.2 LLETZ vs No Treatment | 2 | 1414 | Risk Ratio (IV, Random, 95% CI) | 2.72 [1.65, 4.50] |
| 29.3 Excisional Treatment NOS vs No Treatment | 4 | 5917 | Risk Ratio (IV, Random, 95% CI) | 1.20 [0.78, 1.85] |
| 30 PTB (<37w)‐Depth≤12mm Show forest plot | 1 | 543493 | Risk Ratio (IV, Random, 95% CI) | 1.56 [1.20, 2.02] |
| 30.1 LLETZ vs No Treatment | 1 | 543493 | Risk Ratio (IV, Random, 95% CI) | 1.56 [1.20, 2.02] |
| 31 PTB (<37w)‐Depth≤15mm Show forest plot | 3 | 545283 | Risk Ratio (IV, Random, 95% CI) | 1.44 [1.20, 1.73] |
| 31.1 LC vs No Treatment | 1 | 164 | Risk Ratio (IV, Random, 95% CI) | 0.67 [0.04, 11.18] |
| 31.2 LLETZ vs No Treatment | 2 | 545119 | Risk Ratio (IV, Random, 95% CI) | 1.44 [1.20, 1.73] |
| 32 PTB (<37w)‐Depth≤17mm Show forest plot | 1 | 656 | Risk Ratio (IV, Random, 95% CI) | 1.14 [0.76, 1.72] |
| 32.1 Excisional Treatment NOS vs No Treatment | 1 | 656 | Risk Ratio (IV, Random, 95% CI) | 1.14 [0.76, 1.72] |
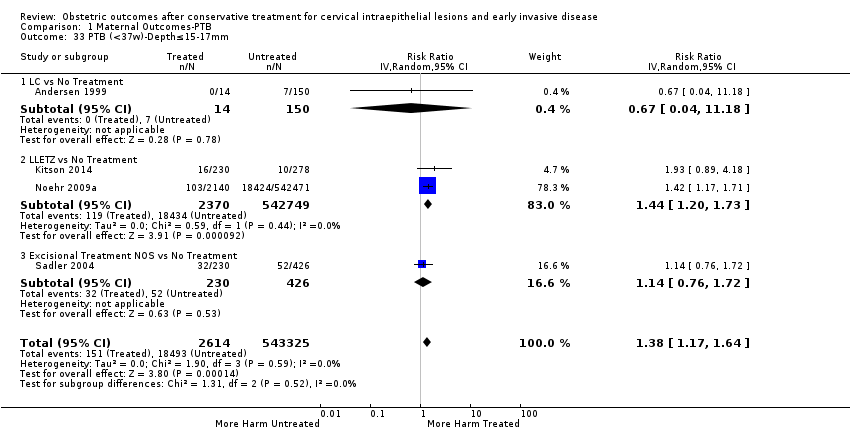
| 33 PTB (<37w)‐Depth≤15‐17mm Show forest plot | 4 | 545939 | Risk Ratio (IV, Random, 95% CI) | 1.38 [1.17, 1.64] |
| 33.1 LC vs No Treatment | 1 | 164 | Risk Ratio (IV, Random, 95% CI) | 0.67 [0.04, 11.18] |
| 33.2 LLETZ vs No Treatment | 2 | 545119 | Risk Ratio (IV, Random, 95% CI) | 1.44 [1.20, 1.73] |
| 33.3 Excisional Treatment NOS vs No Treatment | 1 | 656 | Risk Ratio (IV, Random, 95% CI) | 1.14 [0.76, 1.72] |
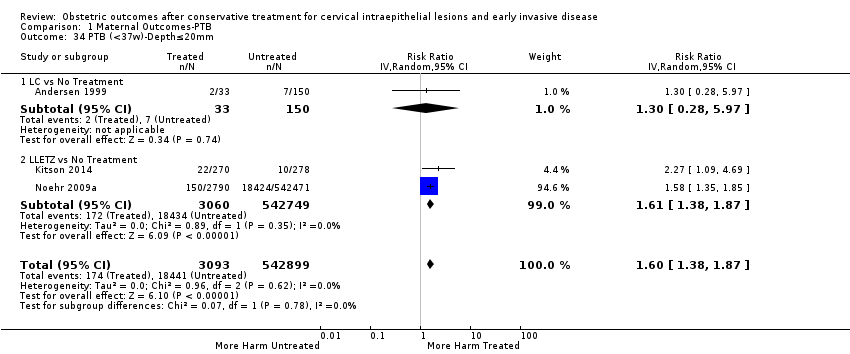
| 34 PTB (<37w)‐Depth≤20mm Show forest plot | 3 | 545992 | Risk Ratio (IV, Random, 95% CI) | 1.60 [1.38, 1.87] |
| 34.1 LC vs No Treatment | 1 | 183 | Risk Ratio (IV, Random, 95% CI) | 1.30 [0.28, 5.97] |
| 34.2 LLETZ vs No Treatment | 2 | 545809 | Risk Ratio (IV, Random, 95% CI) | 1.61 [1.38, 1.87] |
| 35 PTB (<37w)‐Depth≥10mm Show forest plot | 7 | 7671 | Risk Ratio (IV, Random, 95% CI) | 2.12 [1.58, 2.85] |
| 35.1 LC vs No Treatment | 1 | 87 | Risk Ratio (IV, Random, 95% CI) | 4.64 [1.20, 17.88] |
| 35.2 LLETZ vs No Treatment | 2 | 1094 | Risk Ratio (IV, Random, 95% CI) | 3.16 [1.80, 5.55] |
| 35.3 Excisional Treatment NOS vs No Treatment | 4 | 6490 | Risk Ratio (IV, Random, 95% CI) | 1.68 [1.41, 1.99] |
| 36 PTB (<37w)‐Depth≥12mm Show forest plot | 1 | 545040 | Risk Ratio (IV, Random, 95% CI) | 1.93 [1.66, 2.23] |
| 36.1 LLETZ vs No Treatment | 1 | 545040 | Risk Ratio (IV, Random, 95% CI) | 1.93 [1.66, 2.23] |
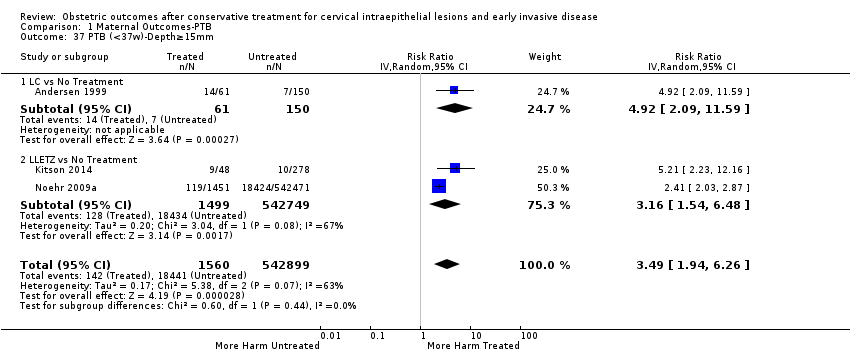
| 37 PTB (<37w)‐Depth≥15mm Show forest plot | 3 | 544459 | Risk Ratio (IV, Random, 95% CI) | 3.49 [1.94, 6.26] |
| 37.1 LC vs No Treatment | 1 | 211 | Risk Ratio (IV, Random, 95% CI) | 4.92 [2.09, 11.59] |
| 37.2 LLETZ vs No Treatment | 2 | 544248 | Risk Ratio (IV, Random, 95% CI) | 3.16 [1.54, 6.48] |
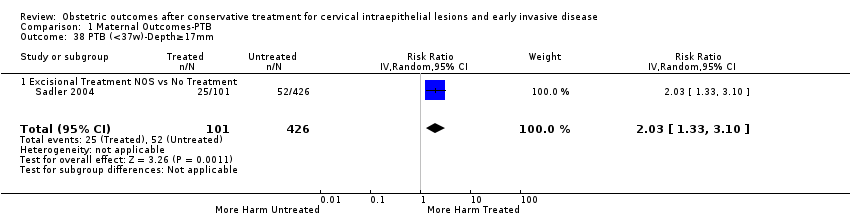
| 38 PTB (<37w)‐Depth≥17mm Show forest plot | 1 | 527 | Risk Ratio (IV, Random, 95% CI) | 2.03 [1.33, 3.10] |
| 38.1 Excisional Treatment NOS vs No Treatment | 1 | 527 | Risk Ratio (IV, Random, 95% CI) | 2.03 [1.33, 3.10] |
| 39 PTB (<37w)‐Depth 10/13‐15/16mm Show forest plot | 3 | 544534 | Risk Ratio (IV, Random, 95% CI) | 1.32 [1.04, 1.66] |
| 39.1 LLETZ vs No Treatment | 2 | 543994 | Risk Ratio (IV, Random, 95% CI) | 1.32 [1.02, 1.72] |
| 39.2 Excisional Treatment NOS vs No Treatment | 1 | 540 | Risk Ratio (IV, Random, 95% CI) | 1.29 [0.79, 2.12] |
| 40 PTB (<37w)‐Depth 15/16‐19/20mm Show forest plot | 3 | 543608 | Risk Ratio (IV, Random, 95% CI) | 2.24 [1.73, 2.91] |
| 40.1 LC vs No Treatment | 1 | 169 | Risk Ratio (IV, Random, 95% CI) | 2.26 [0.50, 10.08] |
| 40.2 LLETZ vs No Treatment | 2 | 543439 | Risk Ratio (IV, Random, 95% CI) | 2.53 [1.42, 4.51] |
| 41 PTB (<37w)‐Volume<3cc Show forest plot | 1 | 496 | Risk Ratio (IV, Random, 95% CI) | 2.04 [0.94, 4.41] |
| 41.1 LLETZ vs No Treatment | 1 | 496 | Risk Ratio (IV, Random, 95% CI) | 2.04 [0.94, 4.41] |
| 42 PTB (<37w)‐Volume>3cc Show forest plot | 1 | 338 | Risk Ratio (IV, Random, 95% CI) | 4.17 [1.77, 9.82] |
| 42.1 LLETZ vs No Treatment | 1 | 338 | Risk Ratio (IV, Random, 95% CI) | 4.17 [1.77, 9.82] |
| 43 PTB (<37w)‐Depth≥10‐12mm vs ≤10‐12mm Show forest plot | 7 | 6359 | Risk Ratio (IV, Random, 95% CI) | 1.54 [1.31, 1.80] |
| 43.1 LC | 1 | 64 | Risk Ratio (IV, Random, 95% CI) | 8.91 [1.11, 71.73] |
| 43.2 LLETZ | 2 | 836 | Risk Ratio (IV, Random, 95% CI) | 1.26 [0.74, 2.17] |
| 43.3 Excision NOS | 4 | 5459 | Risk Ratio (IV, Random, 95% CI) | 1.55 [1.31, 1.83] |
| 44 PTB (<37w)‐Depth≥15‐17mm vs ≤15‐17mm Show forest plot | 4 | 4275 | Risk Ratio (IV, Random, 95% CI) | 1.82 [1.47, 2.26] |
| 44.1 LC | 1 | 75 | Risk Ratio (IV, Random, 95% CI) | 7.02 [0.44, 111.10] |
| 44.2 LLETZ | 2 | 3869 | Risk Ratio (IV, Random, 95% CI) | 1.86 [1.36, 2.55] |
| 44.3 Excisional Treatment NOS | 1 | 331 | Risk Ratio (IV, Random, 95% CI) | 1.78 [1.11, 2.84] |
| 45 PTB (<37w)‐Depth≥20mm vs ≤20mm Show forest plot | 3 | 3944 | Risk Ratio (IV, Random, 95% CI) | 2.79 [1.24, 6.27] |
| 45.1 LC | 1 | 75 | Risk Ratio (IV, Random, 95% CI) | 4.71 [1.13, 19.62] |
| 45.2 LLETZ | 2 | 3869 | Risk Ratio (IV, Random, 95% CI) | 2.47 [0.94, 6.51] |
| 46 PTB (<37w)‐Volume>3cc vs <3cc Show forest plot | 1 | 278 | Risk Ratio (IV, Random, 95% CI) | 2.04 [0.95, 4.39] |
| 46.1 LLETZ | 1 | 278 | Risk Ratio (IV, Random, 95% CI) | 2.04 [0.95, 4.39] |
| 47 PTB (<37w)‐Volume>6cc vs <6cc Show forest plot | 1 | 278 | Risk Ratio (IV, Random, 95% CI) | 6.18 [2.53, 15.13] |
| 47.1 LLETZ | 1 | 278 | Risk Ratio (IV, Random, 95% CI) | 6.18 [2.53, 15.13] |
| 48 PTB (<37w)‐Depth 11/13‐15/16mm vs ≤10‐12mm Show forest plot | 3 | 2600 | Risk Ratio (IV, Random, 95% CI) | 0.92 [0.67, 1.25] |
| 48.1 LLETZ | 2 | 2370 | Risk Ratio (IV, Random, 95% CI) | 0.83 [0.58, 1.17] |
| 48.2 Excisional Treatment NOS | 1 | 230 | Risk Ratio (IV, Random, 95% CI) | 1.31 [0.68, 2.50] |
| 49 PTB (<37w)‐Depth 16‐19mm vs 13‐15mm Show forest plot | 1 | 1768 | Risk Ratio (IV, Random, 95% CI) | 1.65 [1.12, 2.43] |
| 49.1 LLETZ | 1 | 1768 | Risk Ratio (IV, Random, 95% CI) | 1.65 [1.12, 2.43] |
| 50 PTB (<37w)‐Depth≥20mm vs 15/16‐19/20mm Show forest plot | 3 | 1560 | Risk Ratio (IV, Random, 95% CI) | 1.46 [0.95, 2.23] |
| 50.1 LC | 1 | 61 | Risk Ratio (IV, Random, 95% CI) | 2.71 [0.67, 10.96] |
| 50.2 LLETZ | 2 | 1499 | Risk Ratio (IV, Random, 95% CI) | 1.40 [0.84, 2.36] |
| 51 PTB (<37w)‐Untreated External Comparison Group Show forest plot | 44 | 5.192047E6 | Risk Ratio (IV, Random, 95% CI) | 1.92 [1.70, 2.16] |
| 51.1 CKC | 7 | 37370 | Risk Ratio (IV, Random, 95% CI) | 3.28 [2.44, 4.42] |
| 51.2 LC | 6 | 1126 | Risk Ratio (IV, Random, 95% CI) | 2.39 [1.24, 4.61] |
| 51.3 NETZ | 1 | 7361 | Risk Ratio (IV, Random, 95% CI) | 5.82 [3.79, 8.94] |
| 51.4 LLETZ | 19 | 1.414769E6 | Risk Ratio (IV, Random, 95% CI) | 1.72 [1.48, 2.00] |
| 51.5 LA] | 4 | 1258 | Risk Ratio (IV, Random, 95% CI) | 1.27 [0.67, 2.40] |
| 51.6 CT | 1 | 58 | Risk Ratio (IV, Random, 95% CI) | 1.86 [0.08, 43.87] |
| 51.7 Excisional Treatment NOS | 12 | 3.100025E6 | Risk Ratio (IV, Random, 95% CI) | 1.91 [1.50, 2.44] |
| 51.8 Ablative Treatment NOS | 5 | 588949 | Risk Ratio (IV, Random, 95% CI) | 1.45 [1.26, 1.67] |
| 51.9 Treatment NOS | 2 | 41131 | Risk Ratio (IV, Random, 95% CI) | 2.57 [1.39, 4.77] |
| 52 PTB (<37w)‐Untreated Internal Comparison Group (self‐matching) Show forest plot | 8 | 2987 | Risk Ratio (IV, Random, 95% CI) | 1.59 [1.19, 2.13] |
| 52.1 LC | 2 | 354 | Risk Ratio (IV, Random, 95% CI) | 1.30 [0.56, 3.06] |
| 52.2 LLETZ | 1 | 516 | Risk Ratio (IV, Random, 95% CI) | 1.82 [1.04, 3.21] |
| 52.3 FCBE | 1 | 71 | Risk Ratio (IV, Random, 95% CI) | 5.22 [1.09, 24.90] |
| 52.4 Excisional Treatment NOS | 3 | 1922 | Risk Ratio (IV, Random, 95% CI) | 1.46 [0.89, 2.39] |
| 52.5 Treatment NOS | 1 | 124 | Risk Ratio (IV, Random, 95% CI) | 2.0 [0.73, 5.51] |
| 53 PTB (<37w)‐Untreated Internal Comparison Group (pre‐treatment pregnancies) Show forest plot | 13 | 83404 | Risk Ratio (IV, Random, 95% CI) | 1.39 [0.98, 1.96] |
| 53.1 CKC | 3 | 1430 | Risk Ratio (IV, Random, 95% CI) | 1.79 [0.81, 3.95] |
| 53.2 LC | 2 | 161 | Risk Ratio (IV, Random, 95% CI) | 1.65 [0.11, 23.58] |
| 53.3 LLETZ | 4 | 3207 | Risk Ratio (IV, Random, 95% CI) | 1.13 [0.66, 1.94] |
| 53.4 LA | 1 | 226 | Risk Ratio (IV, Random, 95% CI) | 1.20 [0.57, 2.53] |
| 53.5 CT | 1 | 180 | Risk Ratio (IV, Random, 95% CI) | 0.85 [0.15, 4.94] |
| 53.6 Excisional NOS | 3 | 78200 | Risk Ratio (IV, Random, 95% CI) | 1.65 [0.88, 3.08] |
| 54 PTB (<37w)‐Untreated Colposcopy+/‐CIN+/‐Biopsy Comparison Group Show forest plot | 13 | 74958 | Risk Ratio (IV, Random, 95% CI) | 1.27 [1.14, 1.41] |
| 54.1 CKC | 2 | 265 | Risk Ratio (IV, Random, 95% CI) | 1.76 [1.01, 3.08] |
| 54.2 LC | 1 | 177 | Risk Ratio (IV, Random, 95% CI) | 1.52 [0.74, 3.15] |
| 54.3 LLETZ | 9 | 39249 | Risk Ratio (IV, Random, 95% CI) | 1.33 [1.11, 1.60] |
| 54.4 LA | 2 | 3326 | Risk Ratio (IV, Random, 95% CI) | 1.05 [0.84, 1.31] |
| 54.5 RD | 1 | 2150 | Risk Ratio (IV, Random, 95% CI) | 1.62 [1.27, 2.06] |
| 54.6 Excisional Treatment NOS | 5 | 20321 | Risk Ratio (IV, Random, 95% CI) | 1.23 [1.07, 1.41] |
| 54.7 Ablative Treatment NOS | 2 | 9470 | Risk Ratio (IV, Random, 95% CI) | 1.00 [0.74, 1.36] |
| 55 PTB (<37w)‐Untreated HSIL Comparison Group Show forest plot | 3 | 3764 | Risk Ratio (IV, Random, 95% CI) | 1.37 [0.85, 2.19] |
| 55.1 CKC | 1 | 103 | Risk Ratio (IV, Random, 95% CI) | 3.76 [0.48, 29.39] |
| 55.2 NETZ | 1 | 109 | Risk Ratio (IV, Random, 95% CI) | 4.55 [1.11, 18.66] |
| 55.3 LLETZ | 1 | 881 | Risk Ratio (IV, Random, 95% CI) | 2.48 [1.35, 4.55] |
| 55.4 Excisional Treatment NOS | 2 | 2274 | Risk Ratio (IV, Random, 95% CI) | 1.06 [0.71, 1.59] |
| 55.5 Ablative Treatment NOS | 2 | 397 | Risk Ratio (IV, Random, 95% CI) | 0.68 [0.28, 1.68] |
| 56 PTB (<37w)‐All Comparison Groups Show forest plot | 58 | 5.292724E6 | Risk Ratio (IV, Random, 95% CI) | 1.76 [1.58, 1.97] |
| 56.1 Treatment vs Untreated External Comparison Group | 43 | 5.165466E6 | Risk Ratio (IV, Random, 95% CI) | 1.97 [1.71, 2.26] |
| 56.2 Treatment vs Untreated Internal Comparison Group (pre‐treatment pregnancies) | 13 | 62519 | Risk Ratio (IV, Random, 95% CI) | 1.66 [1.24, 2.22] |
| 56.3 Treatment vs Untreated Internal Comparison Group (self‐matching) | 6 | 1263 | Risk Ratio (IV, Random, 95% CI) | 1.91 [1.19, 3.08] |
| 56.4 Treatment vs Untreated Colposcopy+/‐CIN+/‐Biopsy Comparison Group | 12 | 62702 | Risk Ratio (IV, Random, 95% CI) | 1.33 [1.17, 1.50] |
| 56.5 Treatment vs Untreated HSIL Comparison Group | 3 | 774 | Risk Ratio (IV, Random, 95% CI) | 1.46 [0.62, 3.42] |
| 57 PTB (<37w)‐Untreated High‐risk Population vs General Population Show forest plot | 15 | 4.357998E6 | Risk Ratio (IV, Random, 95% CI) | 1.24 [1.14, 1.34] |
| 57.1 Pre‐treatment pregnancies vs General Population | 10 | 3.132723E6 | Risk Ratio (IV, Random, 95% CI) | 1.23 [1.07, 1.42] |
| 57.2 Untreated Colposcopy+/‐CIN+/‐Biopsy vs General Population | 4 | 1.046823E6 | Risk Ratio (IV, Random, 95% CI) | 1.22 [1.11, 1.34] |
| 57.3 Untreated HSIL vs General Population | 3 | 178452 | Risk Ratio (IV, Random, 95% CI) | 1.40 [0.94, 2.10] |
| 58 PTB (<37w)‐Depth≤10‐12mm vs Untreated External Comparison Group Show forest plot | 6 | 1.026243E6 | Risk Ratio (IV, Random, 95% CI) | 1.64 [1.11, 2.42] |
| 58.1 LCp | 1 | 105 | Risk Ratio (IV, Random, 95% CI) | 0.52 [0.06, 4.83] |
| 58.2 LLETZ | 2 | 512896 | Risk Ratio (IV, Random, 95% CI) | 2.06 [1.10, 3.84] |
| 58.3 Excisional Treatment NOS | 3 | 513242 | Risk Ratio (IV, Random, 95% CI) | 1.57 [0.72, 3.41] |
| 59 PTB (<37w)‐Depth≤10‐12mm vs Untreated Internal Comparison Group Show forest plot | 2 | 3550 | Risk Ratio (IV, Random, 95% CI) | 0.90 [0.71, 1.14] |
| 59.1 LC | 1 | 70 | Risk Ratio (IV, Random, 95% CI) | 0.71 [0.05, 10.85] |
| 59.2 Excisional Treatment NOS | 1 | 3480 | Risk Ratio (IV, Random, 95% CI) | 0.90 [0.71, 1.14] |
| 60 PTB (<37w)‐Depth≤10‐12mm vs Untreated Colposcopy+/‐CIN+/‐Biopsy Show forest plot | 4 | 43145 | Risk Ratio (IV, Random, 95% CI) | 1.11 [0.85, 1.43] |
| 60.1 LLETZ | 2 | 33033 | Risk Ratio (IV, Random, 95% CI) | 1.38 [0.94, 2.02] |
| 60.2 Excisional Treatment NOS | 2 | 10112 | Risk Ratio (IV, Random, 95% CI) | 0.93 [0.80, 1.09] |
| 61 PTB (<37w)‐Depth≤15‐17mm vs Untreated External Comparison Group Show forest plot | 2 | 513145 | Risk Ratio (IV, Random, 95% CI) | 1.43 [1.19, 1.73] |
| 61.1 LC | 1 | 164 | Risk Ratio (IV, Random, 95% CI) | 0.67 [0.04, 11.18] |
| 61.2 LLETZ | 1 | 512981 | Risk Ratio (IV, Random, 95% CI) | 1.44 [1.19, 1.74] |
| 62 PTB (<37w)‐Depth≤15‐17mm vs Untreated Colposcopy+/‐CIN+/‐Biopsy Show forest plot | 3 | 34934 | Risk Ratio (IV, Random, 95% CI) | 1.18 [1.00, 1.40] |
| 62.1 LLETZ | 2 | 34278 | Risk Ratio (IV, Random, 95% CI) | 1.30 [0.85, 1.98] |
| 62.2 Excisional Treatment NOS | 1 | 656 | Risk Ratio (IV, Random, 95% CI) | 1.14 [0.76, 1.72] |
| 63 PTB (<37w)‐Depth≤20mm vs Untreated External Comparison Group Show forest plot | 2 | 513814 | Risk Ratio (IV, Random, 95% CI) | 1.60 [1.37, 1.87] |
| 63.1 LC | 1 | 183 | Risk Ratio (IV, Random, 95% CI) | 1.30 [0.28, 5.97] |
| 63.2 LLETZ | 1 | 513631 | Risk Ratio (IV, Random, 95% CI) | 1.61 [1.37, 1.88] |
| 64 PTB (<37w)‐Depth≤20mm vs Untreated Colposcopy+/‐CIN+/‐Biopsy Show forest plot | 2 | 34968 | Risk Ratio (IV, Random, 95% CI) | 1.52 [0.92, 2.51] |
| 64.1 LLETZ | 2 | 34968 | Risk Ratio (IV, Random, 95% CI) | 1.52 [0.92, 2.51] |
| 65 PTB (<37w)‐Depth≥10‐12mm vs Untreated External Comparison Group Show forest plot | 6 | 1.027812E6 | Risk Ratio (IV, Random, 95% CI) | 1.96 [1.66, 2.32] |
| 65.1 LC | 1 | 87 | Risk Ratio (IV, Random, 95% CI) | 4.64 [1.20, 17.88] |
| 65.2 LLETZ | 2 | 514051 | Risk Ratio (IV, Random, 95% CI) | 2.40 [1.30, 4.43] |
| 65.3 Excisional Treatment NOS | 3 | 513674 | Risk Ratio (IV, Random, 95% CI) | 1.82 [1.49, 2.22] |
| 66 PTB (<37w)‐Depth≥10‐12mm vs Untreated Internal Comparison Group Show forest plot | 2 | 3944 | Risk Ratio (IV, Random, 95% CI) | 2.05 [0.56, 7.48] |
| 66.1 LC | 1 | 52 | Risk Ratio (IV, Random, 95% CI) | 6.30 [0.79, 50.27] |
| 66.2 Excisional Treatment NOS | 1 | 3892 | Risk Ratio (IV, Random, 95% CI) | 1.39 [1.12, 1.73] |
| 67 PTB (<37w)‐Depth≥10‐12mm vs Untreated Colposcopy+/‐CIN+/‐Biopsy Show forest plot | 4 | 45275 | Risk Ratio (IV, Random, 95% CI) | 1.52 [1.37, 1.68] |
| 67.1 LLETZ | 2 | 34652 | Risk Ratio (IV, Random, 95% CI) | 1.80 [1.13, 2.87] |
| 67.2 Excisional Treatment NOS | 2 | 10623 | Risk Ratio (IV, Random, 95% CI) | 1.46 [1.29, 1.65] |
| 68 PTB (<37w)‐Depth≥15‐17mm vs Untreated External Comparison Group Show forest plot | 2 | 512503 | Risk Ratio (IV, Random, 95% CI) | 3.04 [1.62, 5.73] |
| 68.1 LC | 1 | 211 | Risk Ratio (IV, Random, 95% CI) | 4.92 [2.09, 11.59] |
| 68.2 LLETZ | 1 | 512292 | Risk Ratio (IV, Random, 95% CI) | 2.45 [2.06, 2.91] |
| 69 PTB (<37w)‐Depth≥15‐17mm vs Untreated Colposcopy+/‐CIN+/‐Biopsy Show forest plot | 3 | 33934 | Risk Ratio (IV, Random, 95% CI) | 2.30 [1.57, 3.35] |
| 69.1 LLETZ | 2 | 33407 | Risk Ratio (IV, Random, 95% CI) | 2.92 [1.14, 7.46] |
| 69.2 Excisional Treatment NOS | 1 | 527 | Risk Ratio (IV, Random, 95% CI) | 2.03 [1.33, 3.10] |
| 70 PTB (<37w)‐Depth≥20mm vs Untreated External Comparison Group Show forest plot | 2 | 511834 | Risk Ratio (IV, Random, 95% CI) | 3.63 [1.67, 7.90] |
| 70.1 LC | 1 | 192 | Risk Ratio (IV, Random, 95% CI) | 6.12 [2.57, 14.57] |
| 70.2 LLETZ | 1 | 511642 | Risk Ratio (IV, Random, 95% CI) | 2.68 [2.15, 3.35] |
| 71 PTB (<37w)‐Depth≥20mm vs Untreated Colposcopy+/‐CIN+/‐Biopsy Show forest plot | 2 | 32717 | Risk Ratio (IV, Random, 95% CI) | 4.32 [0.93, 20.03] |
| 71.1 LLETZ | 2 | 32717 | Risk Ratio (IV, Random, 95% CI) | 4.32 [0.93, 20.03] |
| 72 PTB (<37w)‐Depth 10/13‐15/16mm vs Untreated External Comparison Group Show forest plot | 1 | 511959 | Risk Ratio (IV, Random, 95% CI) | 1.31 [0.99, 1.72] |
| 72.1 LLETZ | 1 | 511959 | Risk Ratio (IV, Random, 95% CI) | 1.31 [0.99, 1.72] |
| 73 PTB (<37w)‐Depth 10/13‐15/16mm vs Untreated Colposcopy+/‐CIN+/‐Biopsy Show forest plot | 3 | 33693 | Risk Ratio (IV, Random, 95% CI) | 1.14 [0.90, 1.44] |
| 73.1 LLETZ | 2 | 33153 | Risk Ratio (IV, Random, 95% CI) | 1.12 [0.80, 1.57] |
| 73.2 Excisional Treatment NOS | 1 | 540 | Risk Ratio (IV, Random, 95% CI) | 1.29 [0.79, 2.12] |
| 74 PTB (<37w)‐Depth 15/16‐19/20mm vs Untreated External Comparison Group Show forest plot | 2 | 511660 | Risk Ratio (IV, Random, 95% CI) | 2.16 [1.65, 2.84] |
| 74.1 LC | 1 | 169 | Risk Ratio (IV, Random, 95% CI) | 2.26 [0.50, 10.08] |
| 74.2 LLETZ | 1 | 511491 | Risk Ratio (IV, Random, 95% CI) | 2.16 [1.64, 2.84] |
| 75 PTB (<37w)‐Depth 15/16‐19/20mm vs Untreated Colposcopy+/‐CIN+/‐Biopsy Show forest plot | 2 | 32598 | Risk Ratio (IV, Random, 95% CI) | 2.38 [1.04, 5.42] |
| 75.1 LLETZ | 2 | 32598 | Risk Ratio (IV, Random, 95% CI) | 2.38 [1.04, 5.42] |
| Outcome or subgroup title | No. of studies | No. of participants | Statistical method | Effect size |
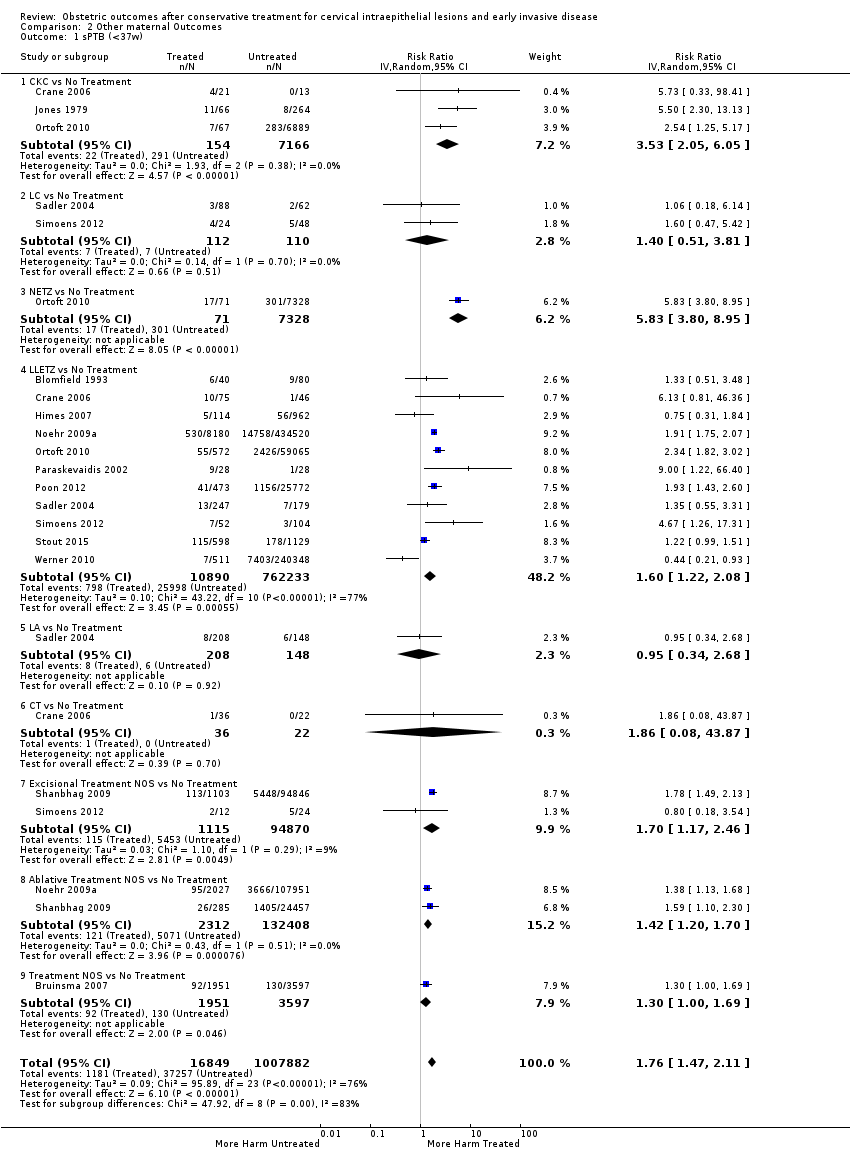
| 1 sPTB (<37w) Show forest plot | 14 | 1.024731E6 | Risk Ratio (IV, Random, 95% CI) | 1.76 [1.47, 2.11] |
| 1.1 CKC vs No Treatment | 3 | 7320 | Risk Ratio (IV, Random, 95% CI) | 3.53 [2.05, 6.05] |
| 1.2 LC vs No Treatment | 2 | 222 | Risk Ratio (IV, Random, 95% CI) | 1.40 [0.51, 3.81] |
| 1.3 NETZ vs No Treatment | 1 | 7399 | Risk Ratio (IV, Random, 95% CI) | 5.83 [3.80, 8.95] |
| 1.4 LLETZ vs No Treatment | 11 | 773123 | Risk Ratio (IV, Random, 95% CI) | 1.60 [1.22, 2.08] |
| 1.5 LA vs No Treatment | 1 | 356 | Risk Ratio (IV, Random, 95% CI) | 0.95 [0.34, 2.68] |
| 1.6 CT vs No Treatment | 1 | 58 | Risk Ratio (IV, Random, 95% CI) | 1.86 [0.08, 43.87] |
| 1.7 Excisional Treatment NOS vs No Treatment | 2 | 95985 | Risk Ratio (IV, Random, 95% CI) | 1.70 [1.17, 2.46] |
| 1.8 Ablative Treatment NOS vs No Treatment | 2 | 134720 | Risk Ratio (IV, Random, 95% CI) | 1.42 [1.20, 1.70] |
| 1.9 Treatment NOS vs No Treatment | 1 | 5548 | Risk Ratio (IV, Random, 95% CI) | 1.30 [1.00, 1.69] |
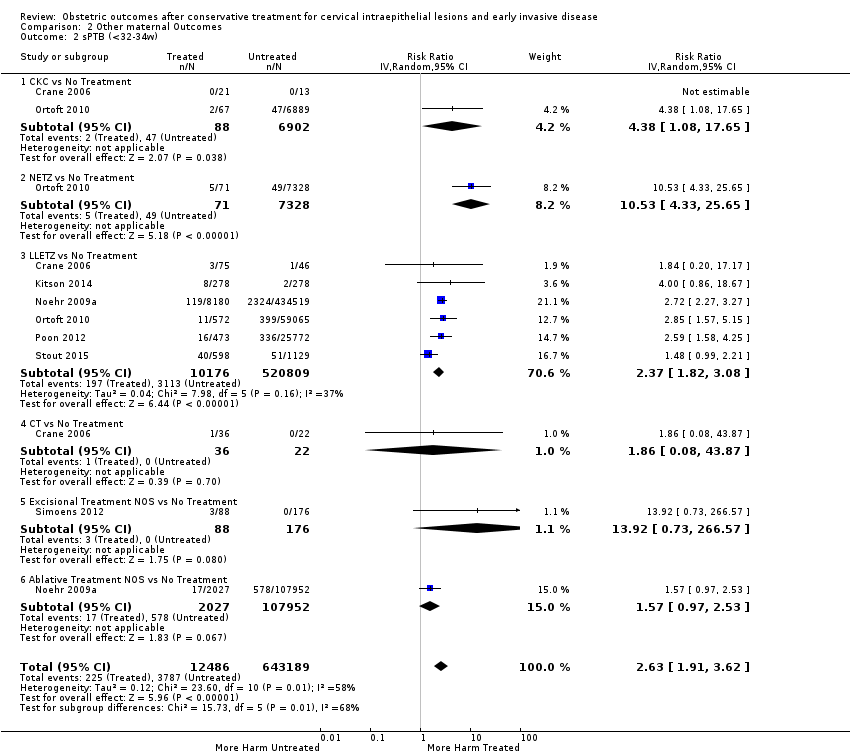
| 2 sPTB (<32‐34w) Show forest plot | 7 | 655675 | Risk Ratio (IV, Random, 95% CI) | 2.63 [1.91, 3.62] |
| 2.1 CKC vs No Treatment | 2 | 6990 | Risk Ratio (IV, Random, 95% CI) | 4.38 [1.08, 17.65] |
| 2.2 NETZ vs No Treatment | 1 | 7399 | Risk Ratio (IV, Random, 95% CI) | 10.53 [4.33, 25.65] |
| 2.3 LLETZ vs No Treatment | 6 | 530985 | Risk Ratio (IV, Random, 95% CI) | 2.37 [1.82, 3.08] |
| 2.4 CT vs No Treatment | 1 | 58 | Risk Ratio (IV, Random, 95% CI) | 1.86 [0.08, 43.87] |
| 2.5 Excisional Treatment NOS vs No Treatment | 1 | 264 | Risk Ratio (IV, Random, 95% CI) | 13.92 [0.73, 266.57] |
| 2.6 Ablative Treatment NOS vs No Treatment | 1 | 109979 | Risk Ratio (IV, Random, 95% CI) | 1.57 [0.97, 2.53] |
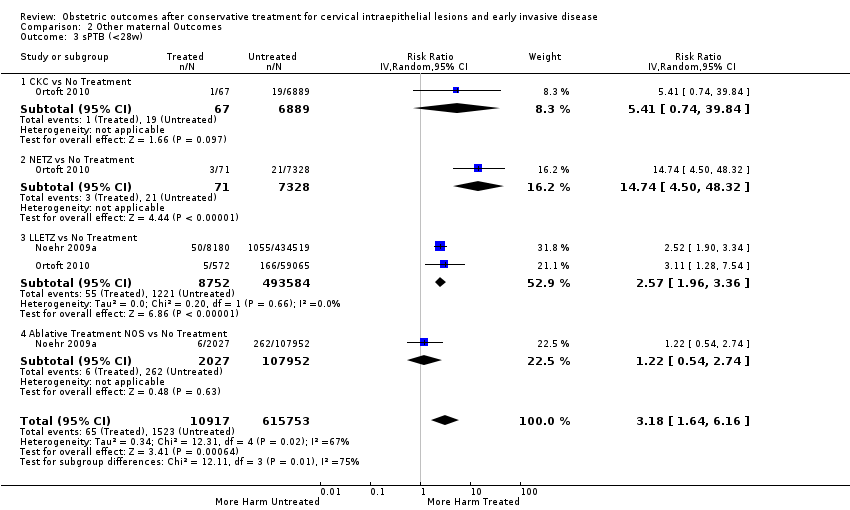
| 3 sPTB (<28w) Show forest plot | 2 | 626670 | Risk Ratio (IV, Random, 95% CI) | 3.18 [1.64, 6.16] |
| 3.1 CKC vs No Treatment | 1 | 6956 | Risk Ratio (IV, Random, 95% CI) | 5.41 [0.74, 39.84] |
| 3.2 NETZ vs No Treatment | 1 | 7399 | Risk Ratio (IV, Random, 95% CI) | 14.74 [4.50, 48.32] |
| 3.3 LLETZ vs No Treatment | 2 | 502336 | Risk Ratio (IV, Random, 95% CI) | 2.57 [1.96, 3.36] |
| 3.4 Ablative Treatment NOS vs No Treatment | 1 | 109979 | Risk Ratio (IV, Random, 95% CI) | 1.22 [0.54, 2.74] |
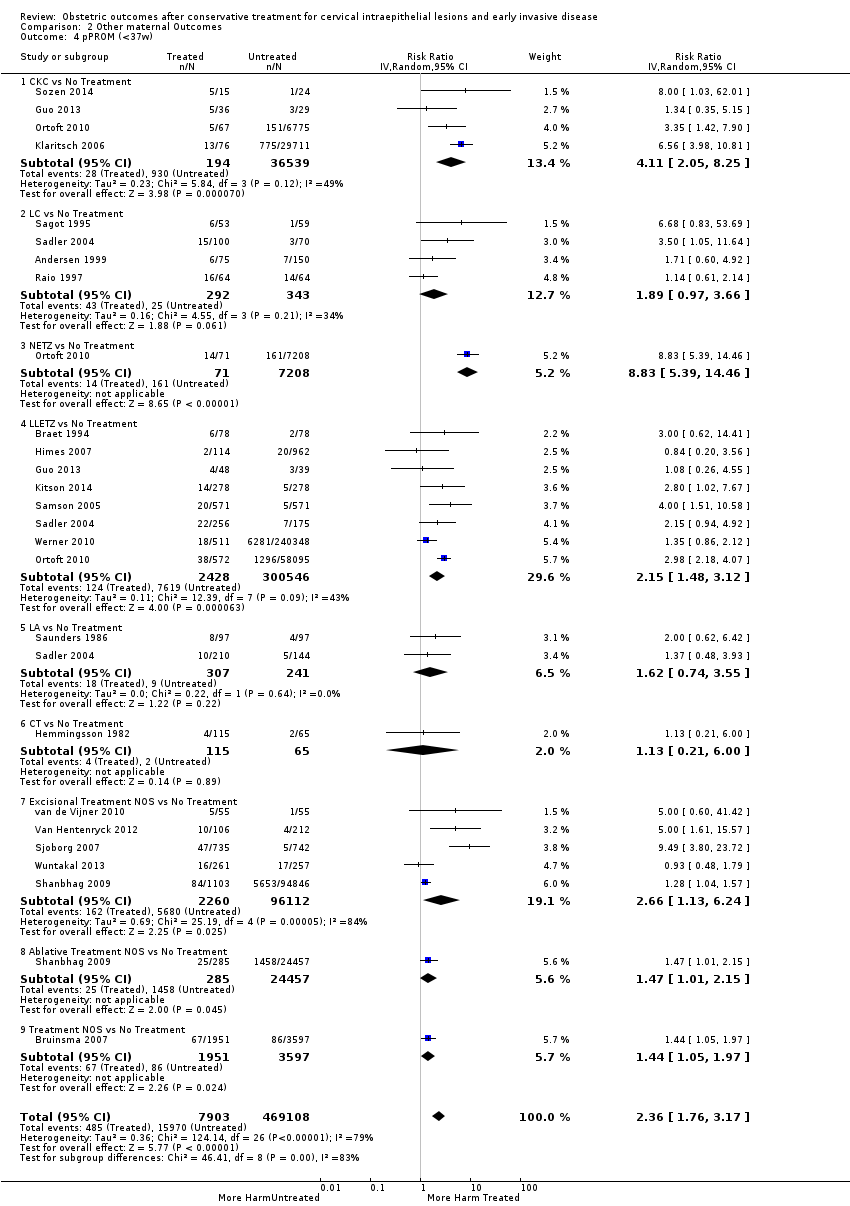
| 4 pPROM (<37w) Show forest plot | 21 | 477011 | Risk Ratio (IV, Random, 95% CI) | 2.36 [1.76, 3.17] |
| 4.1 CKC vs No Treatment | 4 | 36733 | Risk Ratio (IV, Random, 95% CI) | 4.11 [2.05, 8.25] |
| 4.2 LC vs No Treatment | 4 | 635 | Risk Ratio (IV, Random, 95% CI) | 1.89 [0.97, 3.66] |
| 4.3 NETZ vs No Treatment | 1 | 7279 | Risk Ratio (IV, Random, 95% CI) | 8.83 [5.39, 14.46] |
| 4.4 LLETZ vs No Treatment | 8 | 302974 | Risk Ratio (IV, Random, 95% CI) | 2.15 [1.48, 3.12] |
| 4.5 LA vs No Treatment | 2 | 548 | Risk Ratio (IV, Random, 95% CI) | 1.62 [0.74, 3.55] |
| 4.6 CT vs No Treatment | 1 | 180 | Risk Ratio (IV, Random, 95% CI) | 1.13 [0.21, 6.00] |
| 4.7 Excisional Treatment NOS vs No Treatment | 5 | 98372 | Risk Ratio (IV, Random, 95% CI) | 2.66 [1.13, 6.24] |
| 4.8 Ablative Treatment NOS vs No Treatment | 1 | 24742 | Risk Ratio (IV, Random, 95% CI) | 1.47 [1.01, 2.15] |
| 4.9 Treatment NOS vs No Treatment | 1 | 5548 | Risk Ratio (IV, Random, 95% CI) | 1.44 [1.05, 1.97] |
| 5 pPROM (<32w) Show forest plot | 1 | 72788 | Risk Ratio (IV, Random, 95% CI) | 8.30 [2.03, 33.98] |
| 5.1 CKC vs No Treatment | 1 | 6842 | Risk Ratio (IV, Random, 95% CI) | 5.32 [0.72, 39.19] |
| 5.2 NETZ vs No Treatment | 1 | 7279 | Risk Ratio (IV, Random, 95% CI) | 25.38 [9.80, 65.74] |
| 5.3 LLETZ vs No Treatment | 1 | 58667 | Risk Ratio (IV, Random, 95% CI) | 3.74 [1.66, 8.41] |
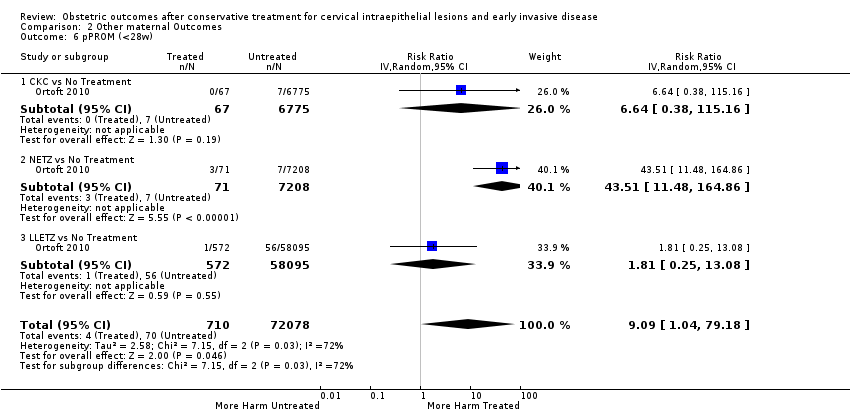
| 6 pPROM (<28w) Show forest plot | 1 | 72788 | Risk Ratio (IV, Random, 95% CI) | 9.09 [1.04, 79.18] |
| 6.1 CKC vs No Treatment | 1 | 6842 | Risk Ratio (IV, Random, 95% CI) | 6.64 [0.38, 115.16] |
| 6.2 NETZ vs No Treatment | 1 | 7279 | Risk Ratio (IV, Random, 95% CI) | 43.51 [11.48, 164.86] |
| 6.3 LLETZ vs No Treatment | 1 | 58667 | Risk Ratio (IV, Random, 95% CI) | 1.81 [0.25, 13.08] |
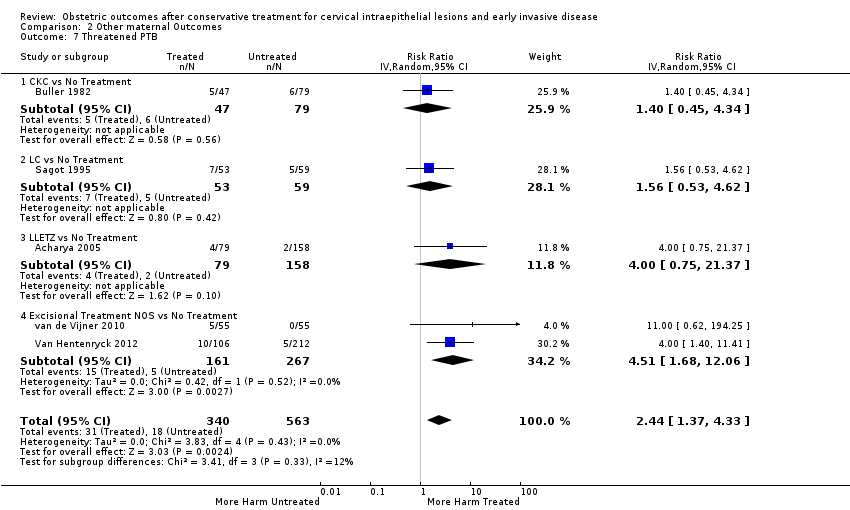
| 7 Threatened PTB Show forest plot | 5 | 903 | Risk Ratio (IV, Random, 95% CI) | 2.44 [1.37, 4.33] |
| 7.1 CKC vs No Treatment | 1 | 126 | Risk Ratio (IV, Random, 95% CI) | 1.40 [0.45, 4.34] |
| 7.2 LC vs No Treatment | 1 | 112 | Risk Ratio (IV, Random, 95% CI) | 1.56 [0.53, 4.62] |
| 7.3 LLETZ vs No Treatment | 1 | 237 | Risk Ratio (IV, Random, 95% CI) | 4.0 [0.75, 21.37] |
| 7.4 Excisional Treatment NOS vs No Treatment | 2 | 428 | Risk Ratio (IV, Random, 95% CI) | 4.51 [1.68, 12.06] |
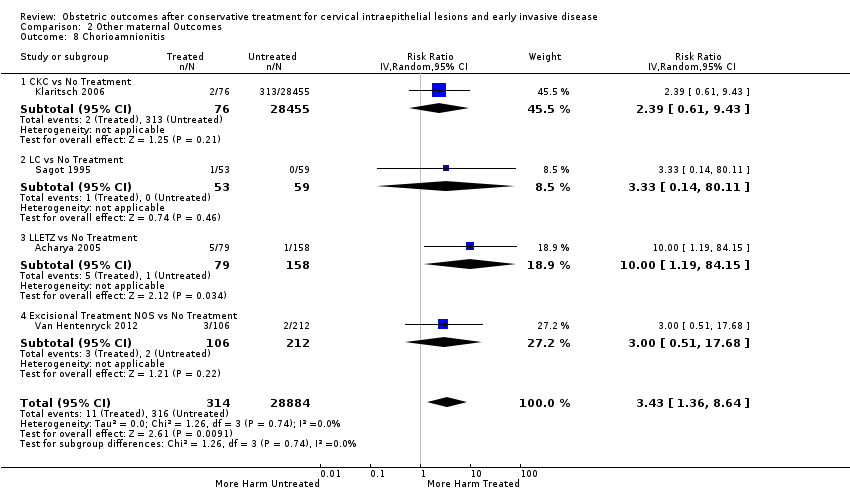
| 8 Chorioamnionitis Show forest plot | 4 | 29198 | Risk Ratio (IV, Random, 95% CI) | 3.43 [1.36, 8.64] |
| 8.1 CKC vs No Treatment | 1 | 28531 | Risk Ratio (IV, Random, 95% CI) | 2.39 [0.61, 9.43] |
| 8.2 LC vs No Treatment | 1 | 112 | Risk Ratio (IV, Random, 95% CI) | 3.33 [0.14, 80.11] |
| 8.3 LLETZ vs No Treatment | 1 | 237 | Risk Ratio (IV, Random, 95% CI) | 10.00 [1.19, 84.15] |
| 8.4 Excisional Treatment NOS vs No Treatment | 1 | 318 | Risk Ratio (IV, Random, 95% CI) | 3.0 [0.51, 17.68] |
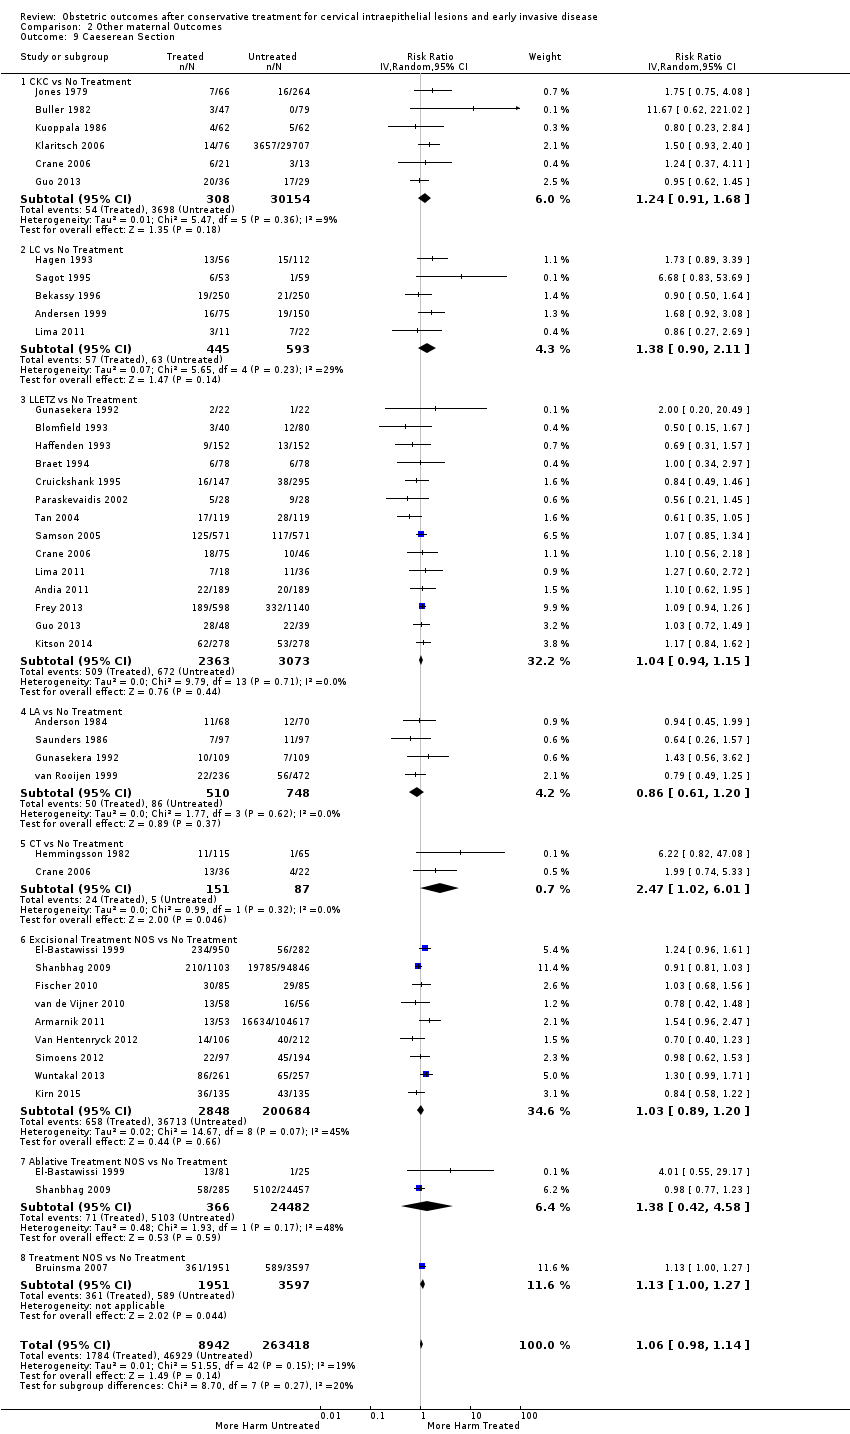
| 9 Caeserean Section Show forest plot | 36 | 272360 | Risk Ratio (IV, Random, 95% CI) | 1.06 [0.98, 1.14] |
| 9.1 CKC vs No Treatment | 6 | 30462 | Risk Ratio (IV, Random, 95% CI) | 1.24 [0.91, 1.68] |
| 9.2 LC vs No Treatment | 5 | 1038 | Risk Ratio (IV, Random, 95% CI) | 1.38 [0.90, 2.11] |
| 9.3 LLETZ vs No Treatment | 14 | 5436 | Risk Ratio (IV, Random, 95% CI) | 1.04 [0.94, 1.15] |
| 9.4 LA vs No Treatment | 4 | 1258 | Risk Ratio (IV, Random, 95% CI) | 0.86 [0.61, 1.20] |
| 9.5 CT vs No Treatment | 2 | 238 | Risk Ratio (IV, Random, 95% CI) | 2.47 [1.02, 6.01] |
| 9.6 Excisional Treatment NOS vs No Treatment | 9 | 203532 | Risk Ratio (IV, Random, 95% CI) | 1.03 [0.89, 1.20] |
| 9.7 Ablative Treatment NOS vs No Treatment | 2 | 24848 | Risk Ratio (IV, Random, 95% CI) | 1.38 [0.42, 4.58] |
| 9.8 Treatment NOS vs No Treatment | 1 | 5548 | Risk Ratio (IV, Random, 95% CI) | 1.13 [1.00, 1.27] |
| 10 Instrumental Deliveries (ventouse/forceps) Show forest plot | 16 | 9588 | Risk Ratio (IV, Random, 95% CI) | 0.97 [0.88, 1.08] |
| 10.1 CKC vs No Treatment | 2 | 454 | Risk Ratio (IV, Random, 95% CI) | 1.33 [0.66, 2.70] |
| 10.2 LC vs No Treatment | 2 | 668 | Risk Ratio (IV, Random, 95% CI) | 1.16 [0.65, 2.07] |
| 10.3 LLETZ vs No Treatment | 6 | 1418 | Risk Ratio (IV, Random, 95% CI) | 0.89 [0.68, 1.17] |
| 10.4 LA vs No Treatment | 3 | 550 | Risk Ratio (IV, Random, 95% CI) | 0.94 [0.62, 1.41] |
| 10.5 Excisional Treatment NOS vs No Treatment | 3 | 950 | Risk Ratio (IV, Random, 95% CI) | 0.71 [0.46, 1.10] |
| 10.6 Treatment NOS vs No Treatment | 1 | 5548 | Risk Ratio (IV, Random, 95% CI) | 1.01 [0.89, 1.15] |
| 11 Precipitous Labour (<2hours) Show forest plot | 5 | 1059 | Risk Ratio (IV, Random, 95% CI) | 1.26 [0.80, 1.96] |
| 11.1 CKC vs No Treatment | 2 | 289 | Risk Ratio (IV, Random, 95% CI) | 1.24 [0.47, 3.27] |
| 11.2 LLETZ vs No Treatment | 4 | 770 | Risk Ratio (IV, Random, 95% CI) | 1.26 [0.76, 2.08] |
| 12 Prolonged labour (>12hours) Show forest plot | 7 | 1854 | Risk Ratio (IV, Random, 95% CI) | 1.25 [0.92, 1.69] |
| 12.1 CKC vs No Treatment | 2 | 325 | Risk Ratio (IV, Random, 95% CI) | 1.99 [0.89, 4.45] |
| 12.2 LC vs No Treatment | 1 | 500 | Risk Ratio (IV, Random, 95% CI) | 0.92 [0.41, 2.04] |
| 12.3 LLETZ vs No Treatment | 4 | 673 | Risk Ratio (IV, Random, 95% CI) | 0.96 [0.55, 1.70] |
| 12.4 LA vs No Treatment | 2 | 356 | Risk Ratio (IV, Random, 95% CI) | 1.41 [0.88, 2.26] |
| 13 Induction of Labour Show forest plot | 11 | 4668 | Risk Ratio (IV, Random, 95% CI) | 1.01 [0.89, 1.15] |
| 13.1 CKC vs No Treatment | 2 | 137 | Risk Ratio (IV, Random, 95% CI) | 1.11 [0.54, 2.29] |
| 13.2 LLETZ vs No treatment | 8 | 4056 | Risk Ratio (IV, Random, 95% CI) | 0.99 [0.82, 1.20] |
| 13.3 CT vs No Treatment | 1 | 58 | Risk Ratio (IV, Random, 95% CI) | 0.61 [0.22, 1.66] |
| 13.4 Excisional Treatment NOS vs No Treatment | 2 | 417 | Risk Ratio (IV, Random, 95% CI) | 0.90 [0.64, 1.28] |
| 14 Oxytocin Use Show forest plot | 6 | 2006 | Risk Ratio (IV, Random, 95% CI) | 0.90 [0.64, 1.26] |
| 14.1 CKC vs No Treatment | 1 | 103 | Risk Ratio (IV, Random, 95% CI) | 0.98 [0.59, 1.63] |
| 14.2 LLETZ vs No Treatment | 4 | 1804 | Risk Ratio (IV, Random, 95% CI) | 0.76 [0.43, 1.34] |
| 14.3 Excisional Treatment NOS vs No Treatment | 1 | 99 | Risk Ratio (IV, Random, 95% CI) | 1.18 [0.67, 2.05] |
| 15 Epidural Use Show forest plot | 5 | 105488 | Risk Ratio (IV, Random, 95% CI) | 1.02 [0.68, 1.53] |
| 15.1 LLETZ vs No Treatment | 4 | 818 | Risk Ratio (IV, Random, 95% CI) | 0.86 [0.64, 1.16] |
| 15.2 Excisional Treatment NOS vs No Treatment | 1 | 104670 | Risk Ratio (IV, Random, 95% CI) | 1.79 [1.29, 2.50] |
| 16 Pethidine Use Show forest plot | 2 | 394 | Risk Ratio (IV, Random, 95% CI) | 0.94 [0.72, 1.24] |
| 16.1 LLETZ vs No treatment | 2 | 394 | Risk Ratio (IV, Random, 95% CI) | 0.94 [0.72, 1.24] |
| 17 Analgesia Use NOS Show forest plot | 1 | 103 | Risk Ratio (IV, Random, 95% CI) | 1.11 [0.62, 1.98] |
| 17.1 CKC vs No Treatment | 1 | 103 | Risk Ratio (IV, Random, 95% CI) | 1.11 [0.62, 1.98] |
| 18 Cervical stenosis Show forest plot | 2 | 680 | Risk Ratio (IV, Random, 95% CI) | 2.26 [0.24, 21.59] |
| 18.1 LC vs No Treatment | 1 | 500 | Risk Ratio (IV, Random, 95% CI) | 3.0 [0.12, 73.29] |
| 18.2 CT vs No Treatment | 1 | 180 | Risk Ratio (IV, Random, 95% CI) | 1.71 [0.07, 41.31] |
| 19 Antepartum Haemorrhage Show forest plot | 4 | 1245 | Risk Ratio (IV, Random, 95% CI) | 1.11 [0.40, 3.12] |
| 19.1 CKC vs No Treatment | 1 | 34 | Risk Ratio (IV, Random, 95% CI) | 1.24 [0.26, 5.83] |
| 19.2 LC vs No Treatment | 1 | 168 | Risk Ratio (IV, Random, 95% CI) | 17.84 [0.98, 325.68] |
| 19.3 LLETZ vs No Treatment | 2 | 277 | Risk Ratio (IV, Random, 95% CI) | 0.52 [0.16, 1.67] |
| 19.4 LA vs No Treatment | 1 | 708 | Risk Ratio (IV, Random, 95% CI) | 8.00 [0.90, 71.18] |
| 19.5 CT vs No Treatment | 1 | 58 | Risk Ratio (IV, Random, 95% CI) | 0.41 [0.07, 2.25] |
| 20 Postpartum Haemorrhage (>600ml) Show forest plot | 1 | 149 | Risk Ratio (IV, Random, 95% CI) | 4.60 [1.38, 15.36] |
| 20.1 CKC vs No Treatment | 1 | 149 | Risk Ratio (IV, Random, 95% CI) | 4.60 [1.38, 15.36] |
| 21 Massive Obstetric Haemorrhage (>1000ml) Show forest plot | 1 | 149 | Risk Ratio (IV, Random, 95% CI) | 3.95 [0.45, 34.48] |
| 21.1 CKC vs No Treatment | 1 | 149 | Risk Ratio (IV, Random, 95% CI) | 3.95 [0.45, 34.48] |
| 22 Cervical cerclage Show forest plot | 8 | 141300 | Risk Ratio (IV, Random, 95% CI) | 14.29 [2.85, 71.65] |
| 22.1 CKC vs No Treatment | 3 | 30744 | Risk Ratio (IV, Random, 95% CI) | 31.42 [2.32, 426.22] |
| 22.2 LC vs No Treatment | 1 | 112 | Risk Ratio (IV, Random, 95% CI) | 6.68 [0.83, 53.69] |
| 22.3 LLETZ vs No Treatment | 1 | 56 | Risk Ratio (IV, Random, 95% CI) | 11.00 [0.64, 189.96] |
| 22.4 Excisional Treatment NOS vs No Treatment | 2 | 104840 | Risk Ratio (IV, Random, 95% CI) | 42.45 [28.99, 62.16] |
| 22.5 Treatment NOS vs No Treatment | 1 | 5548 | Risk Ratio (IV, Random, 95% CI) | 2.16 [1.24, 3.76] |
| Outcome or subgroup title | No. of studies | No. of participants | Statistical method | Effect size |
| 1 LBW (<2500g) Show forest plot | 30 | 1.348206E6 | Risk Ratio (IV, Random, 95% CI) | 1.81 [1.58, 2.07] |
| 1.1 CKC vs No Treatment | 5 | 30304 | Risk Ratio (IV, Random, 95% CI) | 2.51 [1.78, 3.53] |
| 1.2 LC vs No Treatment | 4 | 786 | Risk Ratio (IV, Random, 95% CI) | 1.76 [0.72, 4.35] |
| 1.3 LLETZ vs No Treatment | 12 | 3357 | Risk Ratio (IV, Random, 95% CI) | 2.11 [1.51, 2.94] |
| 1.4 LA vs No Treatment | 4 | 1104 | Risk Ratio (IV, Random, 95% CI) | 1.07 [0.59, 1.92] |
| 1.5 CT vs No Treatment | 1 | 58 | Risk Ratio (IV, Random, 95% CI) | 3.67 [0.47, 28.47] |
| 1.6 Excisional Treatment NOS vs No Treatment | 10 | 823648 | Risk Ratio (IV, Random, 95% CI) | 2.01 [1.62, 2.49] |
| 1.7 Ablative Treatment NOS vs No Treatment | 4 | 483402 | Risk Ratio (IV, Random, 95% CI) | 1.36 [1.19, 1.55] |
| 1.8 Treatment NOS vs No Treatment | 1 | 5547 | Risk Ratio (IV, Random, 95% CI) | 1.35 [1.14, 1.60] |
| 2 LBW (<2000g) Show forest plot | 3 | 74981 | Risk Ratio (IV, Random, 95% CI) | 2.49 [0.97, 6.36] |
| 2.1 LC vs No Treatment | 1 | 181 | Risk Ratio (IV, Random, 95% CI) | 4.46 [1.36, 14.59] |
| 2.2 LA vs No Treatment | 2 | 772 | Risk Ratio (IV, Random, 95% CI) | 0.95 [0.39, 2.29] |
| 2.3 Excisional Treatment NOS vs No Treatment | 1 | 74028 | Risk Ratio (IV, Random, 95% CI) | 4.60 [3.32, 6.37] |
| 3 LBW (<1500g) Show forest plot | 5 | 76836 | Risk Ratio (IV, Random, 95% CI) | 3.00 [1.54, 5.85] |
| 3.1 LC vs No Treatment | 1 | 181 | Risk Ratio (IV, Random, 95% CI) | 12.75 [1.53, 106.44] |
| 3.2 LLETZ vs No Treatment | 1 | 378 | Risk Ratio (IV, Random, 95% CI) | 7.0 [0.36, 134.59] |
| 3.3 LA vs No Treatment | 2 | 772 | Risk Ratio (IV, Random, 95% CI) | 0.68 [0.16, 2.80] |
| 3.4 Excisional Treatment NOS vs No Treatment | 2 | 75505 | Risk Ratio (IV, Random, 95% CI) | 3.34 [2.02, 5.54] |
| 4 LBW (<1000g) Show forest plot | 2 | 2185 | Risk Ratio (IV, Random, 95% CI) | 2.09 [0.06, 74.71] |
| 4.1 LA vs No Treatment | 1 | 708 | Risk Ratio (IV, Random, 95% CI) | 0.29 [0.01, 5.50] |
| 4.2 Excisional Treatment NOS vs No Treatment | 1 | 1477 | Risk Ratio (IV, Random, 95% CI) | 11.10 [1.44, 85.79] |
| 5 NICU Admission Show forest plot | 8 | 2557 | Risk Ratio (IV, Random, 95% CI) | 1.45 [1.16, 1.81] |
| 5.1 CKC vs No Treatment | 2 | 71 | Risk Ratio (IV, Random, 95% CI) | 1.40 [0.52, 3.75] |
| 5.2 LLETZ vs No Treatment | 5 | 1994 | Risk Ratio (IV, Random, 95% CI) | 1.42 [1.01, 1.99] |
| 5.3 CT vs No Treatment | 1 | 58 | Risk Ratio (IV, Random, 95% CI) | 2.44 [0.29, 20.49] |
| 5.4 Excisional Treatment NOS vs No Treatment | 2 | 434 | Risk Ratio (IV, Random, 95% CI) | 1.76 [1.13, 2.75] |
| 6 Perinatal Mortality Show forest plot | 23 | 1.659433E6 | Risk Ratio (IV, Random, 95% CI) | 1.51 [1.13, 2.03] |
| 6.1 CKC vs No Treatment | 7 | 50588 | Risk Ratio (IV, Random, 95% CI) | 1.46 [0.83, 2.57] |
| 6.2 LC vs No Treatment | 3 | 906 | Risk Ratio (IV, Random, 95% CI) | 1.89 [0.26, 13.87] |
| 6.3 NETZ vs No Treatment | 1 | 7399 | Risk Ratio (IV, Random, 95% CI) | 9.99 [3.13, 31.92] |
| 6.4 LLETZ vs No Treatment | 7 | 302271 | Risk Ratio (IV, Random, 95% CI) | 1.53 [0.88, 2.67] |
| 6.5 LA vs No Treatment | 2 | 258 | Risk Ratio (IV, Random, 95% CI) | 3.0 [0.12, 72.74] |
| 6.6 CT vs No Treatment | 2 | 238 | Risk Ratio (IV, Random, 95% CI) | 0.19 [0.01, 4.59] |
| 6.7 Excisional Treatment NOS vs No Treatment | 5 | 820028 | Risk Ratio (IV, Random, 95% CI) | 1.85 [1.02, 3.36] |
| 6.8 Ablative Treatment NOS vs No Treatment | 2 | 472197 | Risk Ratio (IV, Random, 95% CI) | 0.69 [0.42, 1.13] |
| 6.9 Treatment NOS vs No Treatment | 1 | 5548 | Risk Ratio (IV, Random, 95% CI) | 1.00 [0.63, 1.58] |
| 7 Perinatal Mortality (<37w) Show forest plot | 1 | 73992 | Risk Ratio (IV, Random, 95% CI) | 9.40 [2.01, 43.89] |
| 7.1 CKC vs No Treatment | 1 | 6956 | Risk Ratio (IV, Random, 95% CI) | 5.33 [0.31, 90.71] |
| 7.2 NETZ vs No Treatment | 1 | 7399 | Risk Ratio (IV, Random, 95% CI) | 30.96 [8.71, 110.13] |
| 7.3 LLETZ vs No Treatment | 1 | 59637 | Risk Ratio (IV, Random, 95% CI) | 3.92 [1.24, 12.38] |
| 8 Perinatal Mortality (<32w) Show forest plot | 1 | 73992 | Risk Ratio (IV, Random, 95% CI) | 12.81 [2.70, 60.87] |
| 8.1 CKC vs No Treatment | 1 | 6956 | Risk Ratio (IV, Random, 95% CI) | 6.75 [0.39, 117.10] |
| 8.2 NETZ vs No Treatment | 1 | 7399 | Risk Ratio (IV, Random, 95% CI) | 44.23 [11.67, 167.61] |
| 8.3 LLETZ vs No Treatment | 1 | 59637 | Risk Ratio (IV, Random, 95% CI) | 5.43 [1.71, 17.30] |
| 9 Perinatal Mortality (<28w) Show forest plot | 1 | 73992 | Risk Ratio (IV, Random, 95% CI) | 13.76 [2.37, 79.89] |
| 9.1 CKC vs No Treatment | 1 | 6956 | Risk Ratio (IV, Random, 95% CI) | 9.21 [0.51, 164.95] |
| 9.2 NETZ vs No Treatment | 1 | 7399 | Risk Ratio (IV, Random, 95% CI) | 51.61 [13.17, 202.29] |
| 9.3 LLETZ vs No Treatment | 1 | 59637 | Risk Ratio (IV, Random, 95% CI) | 4.49 [1.09, 18.45] |
| 10 Stillbirth Show forest plot | 12 | 249855 | Risk Ratio (IV, Random, 95% CI) | 0.98 [0.63, 1.52] |
| 10.1 CKC vs No Treatment | 3 | 935 | Risk Ratio (IV, Random, 95% CI) | 1.61 [0.48, 5.40] |
| 10.2 LC vs No Treatment | 2 | 725 | Risk Ratio (IV, Random, 95% CI) | 0.33 [0.03, 3.18] |
| 10.3 LLETZ vs No Treatment | 4 | 242473 | Risk Ratio (IV, Random, 95% CI) | 1.42 [0.62, 3.26] |
| 10.4 LA vs No Treatment | 1 | 64 | Risk Ratio (IV, Random, 95% CI) | 0.0 [0.0, 0.0] |
| 10.5 Excisional Treatment NOS vs No Treatment | 1 | 110 | Risk Ratio (IV, Random, 95% CI) | 0.0 [0.0, 0.0] |
| 10.6 Treatment NOS vs No Treatment | 1 | 5548 | Risk Ratio (IV, Random, 95% CI) | 0.77 [0.42, 1.40] |
| 11 Apgar score (≤5)(1min) Show forest plot | 1 | 225 | Risk Ratio (IV, Random, 95% CI) | 0.57 [0.12, 2.68] |
| 11.1 LC vs No Treatment | 1 | 225 | Risk Ratio (IV, Random, 95% CI) | 0.57 [0.12, 2.68] |
| 12 Apgar score (<7)(1min) Show forest plot | 1 | 152 | Risk Ratio (IV, Random, 95% CI) | 0.63 [0.07, 5.71] |
| 12.1 LLETZ vs No Treatment | 1 | 87 | Risk Ratio (IV, Random, 95% CI) | 0.16 [0.01, 3.30] |
| 12.2 CKC vs No Treatment | 1 | 65 | Risk Ratio (IV, Random, 95% CI) | 1.61 [0.15, 16.90] |
| 13 Apgar score (<7)(5min) Show forest plot | 2 | 297 | Risk Ratio (IV, Random, 95% CI) | 0.82 [0.19, 3.59] |
| 13.1 CKC vs No Treatment | 1 | 32 | Risk Ratio (IV, Random, 95% CI) | 0.0 [0.0, 0.0] |
| 13.2 LLETZ vs No Treatment | 1 | 120 | Risk Ratio (IV, Random, 95% CI) | 0.93 [0.16, 5.37] |
| 13.3 CT vs No Treatment | 1 | 58 | Risk Ratio (IV, Random, 95% CI) | 0.61 [0.04, 9.28] |
| 13.4 Excisional Treatment NOS vs No Treatment | 1 | 87 | Risk Ratio (IV, Random, 95% CI) | 0.0 [0.0, 0.0] |