Resultados obstétricos después del tratamiento conservador para las lesiones intraepiteliales cervicales y la enfermedad invasiva temprana
Resumen
Antecedentes
La edad promedio de las pacientes que reciben tratamiento local por enfermedad cervical preinvasiva (neoplasia intraepitelial cervical; NIC) o cáncer de cuello de útero en estadio temprano (estadio IA1) está alrededor de los 30 años y es similar a la edad en la que las mujeres tienen su primer hijo. El tratamiento cervical local se ha relacionado con una morbilidad reproductiva adversa en un embarazo posterior; sin embargo, los estudios y metanálisis publicados han establecido conclusiones contradictorias.
Objetivos
Evaluar el efecto del tratamiento cervical local para la NIC y el cáncer de cuello de útero en estadio temprano sobre los resultados obstétricos (después de las 24 semanas de gestación) y relacionarlos con la profundidad del cono y el grupo de comparación utilizado.
Métodos de búsqueda
Se hicieron búsquedas en las siguientes bases de datos: Registro Cochrane Central de Ensayos Controlados (Cochrane Central Register of Controlled Trials, CENTRAL; The Cochrane Library, número 2017, 5), MEDLINE (hasta junio, semana 4, 2017) y en EMBASE (hasta semana 26, 2017). En un intento por identificar artículos omitidos por la búsqueda o datos no publicados, se contactó con expertos en el tema y se buscaron manualmente las referencias de los artículos recuperados y las actas de congresos.
Criterios de selección
Se incluyeron todos los estudios que informaron sobre los resultados obstétricos (más de 24 semanas de gestación) en pacientes con o sin tratamiento cervical local anterior para cualquier grado de NIC o cáncer de cuello de útero en estadio temprano (estadio IA1). El tratamiento incluyó métodos escisionales y ablativos. Se excluyeron los estudios que no tuvieron una población de referencia sin tratar, informaron resultados de pacientes que habían recibido el tratamiento durante el embarazo o tuvieron un grupo de alto riesgo tratado o de comparación, o ambos
Obtención y análisis de los datos
Los estudios se clasificaron según el tipo de tratamiento y la variable de evaluación obstétrica. Los estudios se clasificaron según el método y la variable de evaluación obstétrica. Los cocientes de riesgos (CR) agrupados y los intervalos de confianza (IC) del 95% se calcularon mediante un modelo de efectos aleatorios y la varianza inversa. La heterogeneidad interestudio se evaluó con la estadística I2. Se evaluaron los resultados maternos que incluyeron el parto prematuro (PP) (espontáneo y amenaza), la rotura prematura de membranas antes del parto (RPMap), la corioamnionitis, la forma del parto, la duración de trabajo de parto, la inducción del parto, la administración de oxitocina, la hemorragia, la analgesia, el cerclaje cervical y la estenosis cervical. Los resultados neonatales incluyeron bajo peso al nacer (BPN), ingreso a la unidad de cuidados intensivos neonatales (UCIN), mortinatos, mortalidad perinatal y puntuaciones de Apgar.
Resultados principales
Se incluyeron 69 estudios (6 357 823 embarazos: 65 098 embarazos de pacientes tratadas y 6 292 725 embarazos de pacientes sin tratar). Muchos de los estudios solo incluyeron un escaso número de pacientes, tuvieron un diseño heterogéneo y fueron en su mayoría retrospectivos, por lo que tuvieron alto riesgo de sesgo. Muchos resultados se consideraron de baja o muy baja calidad (evaluación GRADE), por lo que se deben interpretar con precaución. Las pacientes que recibieron tratamiento tuvieron un aumento en el riesgo general de parto prematuro (PP) (menos de 37 semanas) (10,7% versus 5,4%; CR 1,75; IC del 95%: 1,57 a 1,96; 59 estudios, 5 242 917 participantes, muy baja calidad), prematurez grave (menos de 32 a 34 semanas) (3,5% versus 1,4%; CR 2,25; IC del 95%: 1,79 a 2,82), 24 estudios, 3 793 874 participantes, muy baja calidad) y extrema (menos de 28 a 30 semanas) (1,0% versus 0,3%; CR 2,23; IC del 95%: 1,55 a 3,22; ocho estudios, 3 910 629 participantes, muy baja calidad), en comparación con las pacientes que no recibieron tratamiento.
El riesgo de prematurez general fue mayor con los tratamientos escisionales (escisión versus ningún tratamiento: 11,2% versus 5,5%; CR 1,87; IC del 95%: 1,64 a 2,12; 53 estudios, 4 599 416 participantes) que ablativos (ablación versus ningún tratamiento: 7,7% versus 4,6%; CR 1,35; IC del 95%: 1,20 a 1,52; 14 estudios, 602 370 participantes) y el efecto fue mayor con las técnicas escisionales más radicales (menos de 37 semanas: conización con bisturí (CB) (CR 2,70; IC del 95%: 2,14 a 3,40; 12 estudios, 39 102 participantes), conización con láser (CL) (CR 2,11; IC del 95%: 1,26 a 3,54; nueve estudios, 1509 participantes), escisión amplia con asa de la zona de transformación (EAAZT) (CR 1,58; IC del 95%: 1,37 a 1,81; 25 estudios, 1 445 104 participantes). El tratamiento repetido multiplicó el riesgo de prematurez general (repetido versus ningún tratamiento: 13,2% versus 4,1%; CR 3,78; IC del 95%: 2,65 a 5,39; 11 estudios, 1 317 284 participantes, muy baja calidad). El riesgo de prematurez general aumentó con el aumento en la profundidad del cono (menos de 10 mm a 12 mm versus ningún tratamiento: 7,1% versus 3,4%; CR 1,54; IC del 95%: 1,09 a 2,18; ocho estudios, 550 929 participantes, muy baja calidad; más de 10 mm a 12 mm versus ningún tratamiento: 9,8% versus 3,4%; CR 1,93; IC del 95%: 1,62 a 2,31; ocho estudios, 552 711 participantes, baja calidad; más de 15 mm a 17 mm versus ningún tratamiento: 10,1 versus un 3,4%; CR 2,77; IC del 95%: 1,95 a 3,93; cuatro estudios, 544 986 participantes, muy baja calidad; 20 mm o más versus ningún tratamiento: 10,2% versus 3,4%; CR 4,91; IC del 95%: 2,06 a 11,68; tres estudios, 543 750 participantes, muy baja calidad). El grupo de comparación afectó la magnitud del efecto, que fue mayor para los comparadores externo, seguidos de los internos, y al final las pacientes con enfermedad pero sin tratamiento. Las pacientes con enfermedad sin tratar y los embarazos previos al tratamiento en pacientes que fueron tratadas posteriormente tuvieron un mayor riesgo de prematurez general que la población general (5,9% versus 5,6%; CR 1,24; IC del 95%: 1,14 a 1,34; 15 estudios, 4 357 998 participantes, muy baja calidad).
La RPMap (6,1% versus 3,4%; CR 2,36; IC del 95%: 1,76 a 3,17; 21 estudios, 477 011 participantes, muy baja calidad), el bajo peso al nacer (7,9% versus 3,7%; CR 1,81; IC del 95%: 1,58 a 2,07; 30 estudios, 1 348 206 participantes, muy baja calidad), la tasa de ingreso en la UCIN (12,6% versus 8,9%; CR 1,45; IC del 95%: 1,16 a 1,81; ocho estudios, 2557 participantes, baja calidad) y la mortalidad perinatal (0,9% versus 0,7%; CR 1,51; IC del 95%: 1,13 a 2,03; 23 estudios, 1 659 433 participantes, baja calidad) también aumentaron después del tratamiento.
Conclusiones de los autores
Las pacientes con NIC tienen un riesgo inicial mayor de prematurez. El tratamiento escisional y ablativo parece aumentar aún más ese riesgo. La frecuencia y la gravedad de las secuelas adversas se incrementan con el aumento en la profundidad del cono y es mayor con la escisión que con la ablación. Sin embargo, los resultados se deben interpretar con cuidado ya que se basaron en estudios observacionales de baja o muy baja calidad (evaluación GRADE), que en su mayoría fueron retrospectivos.
PICOs
Resumen en términos sencillos
Resultados obstétricos después del tratamiento conservador para las lesiones intraepiteliales cervicales
El problema
La neoplasia intraepitelial cervical (NIC) es una lesión precancerosa del cuello del útero (cuello de la matriz) causada por el virus del papiloma humano (HPV), que se puede convertir en cáncer de cuello de útero si no se trata. El tratamiento local incluye destruir o eliminar el área anormal del cuello del útero y dejar la mayoría del cuello del útero y el útero en su sitio, lo que conserva la capacidad de un embarazo en el futuro, si se desea. Ciertos tipos de tratamiento local también pueden ser apropiados para el cáncer de cuello de útero en estadio muy temprano (estadio IA1) si el tumor es muy pequeño y es muy poco probable que se haya diseminado más allá del cuello del útero. Hay muchos estudios que investigan si el tratamiento local de la NIC y del cáncer de cuello de útero en estadio temprano aumenta el riesgo de parto prematuro (PP) en los embarazos posteriores. Sin embargo, no hay una conclusión definitiva, lo que crea confusión en el personal médico y en las pacientes a las que se les puede recomendar el tratamiento pero que también desean tener niños en el futuro.
Objetivo de la revisión
El objetivo fue evaluar si las técnicas locales de tratamiento conservador para el precáncer de cuello de útero (NIC) y el cáncer de cuello de útero en estadio temprano aumentaron el riesgo de complicaciones en la madre y el recién nacido durante el embarazo que ocurría después del tratamiento, y en especial si el tratamiento se asocia con un aumento en el riesgo de PP. También se estudió si el riesgo de PP se incrementa con el aumento en la cantidad de tejido cervical eliminado.
Criterios de selección
Se incluyeron todos los estudios que investigaron el efecto del tratamiento de la NIC y del cáncer de cuello de útero en estadio temprano sobre los resultados de la última etapa del embarazo (después de las 24 semanas de gestación) en pacientes que habían sido tratadas previamente por NIC y cáncer de cuello de útero en estadio temprano, en comparación con pacientes que no habían sido tratadas. Se excluyeron los estudios que no tenían un grupo de comparación sin tratar, informaron resultados del embarazo en pacientes que habían recibido el tratamiento durante el embarazo, o tuvieron un grupo de alto riesgo tratado, de comparación, o ambos.
¿Cuáles son los principales hallazgos?
Se incluyeron 69 estudios (6 357 823 embarazos: 65 098 embarazos de pacientes tratadas y 6 292 725 embarazos de pacientes sin tratar). El tratamiento se asoció con un aumento en el riesgo de PP antes de las 37 semanas de embarazo, así como un aumento en el riesgo de PP grave (menos de 32 a 34 semanas de embarazo), PP extremo (menos de 28 a 30 semanas de embarazo) y RPMap (rotura prematura de membranas antes del trabajo de parto) en comparación con las pacientes sin tratar. El riesgo de PP general fue mayor en las pacientes tratadas con métodos escisionales (donde el tejido se corta por completo) que con los tratamientos ablativos (donde el tejido se destruye en vez de cortarse por completo). Los tratamientos múltiples, así como mayores cantidades de tejido eliminado en el momento del tratamiento, se asociaron con un mayor riesgo de PP general. Sin embargo, las pacientes con NIC que no fueron tratadas también tuvieron un riesgo mayor de PP general que la población general. También se encontró que el bajo peso al nacer (BPN < 2500 g), el ingreso a la unidad de cuidados intensivos neonatales (UCIN) y las tasas de mortalidad perinatal aumentaron después del tratamiento.
¿Cuál es la calidad de la evidencia?
Debido a la naturaleza de la intervención y a los resultados estudiados solo se pudieron incluir estudios observacionales, en su mayoría retrospectivos. Estos tipos de estudios son de baja calidad con un nivel alto de variabilidad entre los estudios, por lo que el nivel de la evidencia para la mayoría de los resultados solo se puede considerar de baja o muy baja calidad.
¿Cuáles son las conclusiones?
Las pacientes con NIC tienen un riesgo inicial mayor de PP que la población general y el tratamiento de la NIC probablemente aumenta aún más este riesgo. El riesgo de PP es probablemente mayor cuando se utilizan técnicas escisionales en lugar de tratamientos ablativos. Además, el riesgo de PP parece aumentar con los tratamientos múltiples y cuando se eliminan mayores cantidades de tejido. Sin embargo, estos resultados deben interpretarse con precaución debido a la baja y muy baja calidad de los estudios incluidos.
Conclusiones de los autores
Summary of findings
| The effect of treatment for CIN on maternal outcomes | ||||||
| Patient or population: women with known obstetric outcomes | ||||||
| Outcomes | Anticipated absolute effects* (95% CI) | Relative effect | № of participants | Quality of the evidence | Comments | |
| Risk with [comparison] | Risk with [intervention] | |||||
| PTB (< 37 w) | Study population | RR 1.75 | 5,242,917 | ⊕⊝⊝⊝ | ||
| 54 per 1000 | 95 per 1000 | |||||
| PTB (< 32 to 34 w) | Study population | RR 2.25 | 3,793,874 | ⊕⊝⊝⊝ | ||
| 14 per 1000 | 32 per 1000 | |||||
| PTB (< 28 to 30 w) | Study population | RR 2.23 | 3,910,629 | ⊕⊝⊝⊝ | ||
| 3 per 1000 | 7 per 1000 | |||||
| PTB (< 37 w) ‐ Repeat cones versus No Treatment | Study population | RR 3.78 | 1,317,284 | ⊕⊝⊝⊝ | ||
| 41 per 1000 | 156 per 1000 | |||||
| pPROM (<3 7 w) | Study population | RR 2.36 | 477,011 | ⊕⊝⊝⊝ | ||
| 34 per 1000 | 80 per 1000 | |||||
| PTB (< 37 w) ‐ Depth ≤ 10 mm to 12 mm versus No Treatment | Study population | RR 1.54 | 550,929 | ⊕⊝⊝⊝ | ||
| 34 per 1000 | 53 per 1000 | |||||
| PTB (< 37 w) ‐ PTB (< 37 w) ‐ Depth ≥10 mm to 12 mm versus No Treatment | Study population | RR 1.93 | 552,711 | ⊕⊕⊕⊝ | ||
| 34 per 1000 | 66 per 1000 | |||||
| PTB (< 37w) ‐ PTB (<37w) ‐ Depth ≥15 to 17mm versus No Treatment | Study population | RR 2.77 | 544,986 | ⊕⊕⊕⊕ | ||
| 34 per 1000 | 94 per 1000 | |||||
| PTB (< 37 w) ‐ PTB (< 37 w) ‐ Depth ≥ 20 mm versus No Treatment | Study population | RR 4.91 | 543,750 | ⊕⊕⊕⊕ | ||
| 34 per 1000 | 167 per 1000 | |||||
| *The risk in the intervention group (and its 95% confidence interval) is based on the assumed risk in the comparison group and the relative effect of the intervention (and its 95% CI). | ||||||
| GRADE Working Group grades of evidence | ||||||
| 1 Low‐quality evidence (based on observational studies only) is downgraded one level because of considerable heterogeneity (I2 90%) 2 Low‐quality evidence (based on observational studies only) is downgraded one level because of considerable heterogeneity (I2 83%) and suspected publication bias 3 Low‐quality evidence (based on observational studies only) is downgraded one level because of considerable heterogeneity (I2 84%) 4 Low‐quality evidence (based on observational studies only) is downgraded one level because of considerable heterogeneity (I2 75%) 5 Low‐quality evidence (based on observational studies only) is downgraded one level because of considerable heterogeneity (I2 79%) 6 Low‐quality evidence (based on observational studies only) is downgraded one level because of substantial heterogeneity (I2 67%) 7 Low‐quality evidence (based on observational studies only); heterogeneity was low (I2 37%) 8 Low‐quality evidence (based on observational studies only) is downgraded one level because of moderate heterogeneity (I2 53%) 9 Low‐quality evidence (based on observational studies only) is downgraded one level because of considerable heterogeneity (I2 77%) | ||||||
| The effect of treatment for CIN on neonatal outcomes | ||||||
| Patient or population: women with known obstetric outcomes | ||||||
| Outcomes | Anticipated absolute effects* (95% CI) | Relative effect | № of participants | Quality of the evidence | Comments | |
| Risk with No Treatment | Risk with Treatment | |||||
| LBW (< 2500 g) ‐ Treatment versus No Treatment | Study population | RR 1.81 | 1,348,206 | ⊕⊝⊝⊝ | ||
| 37 per 1000 | 66 per 1000 | |||||
| NICU Admission ‐ Treatment versus No Treatment | Study population | RR 1.45 | 2557 | ⊕⊕⊝⊝ | ||
| 89 per 1000 | 130 per 1000 | |||||
| Perinatal Mortality ‐ Treatment versus No Treatment | Study population | RR 1.51 | 1,659,433 | ⊕⊕⊝⊝ | ||
| 7 per 1000 | 11 per 1000 | |||||
| *The risk in the intervention group (and its 95% confidence interval) is based on the assumed risk in the comparison group and the relative effect of the intervention (and its 95% CI). | ||||||
| GRADE Working Group grades of evidence | ||||||
| 1 Low‐quality evidence (based on observational studies only) is downgraded one level because of substantial heterogeneity (I2 63%) | ||||||
Antecedentes
Descripción de la afección
El cáncer de cuello de útero todavía es la neoplasia maligna ginecológica más frecuente en todo el mundo, y representa el 7,5% de las muertes por cáncer en las mujeres. Cada año en todo el mundo se diagnostica más de medio millón de nuevos casos y una gran mayoría ocurre en países en desarrollo, donde el riesgo de cáncer de cuello de útero de una mujer a los 74 años de edad es casi el doble que en el mundo desarrollado (1,6% versus 0,9%) (Ferlay 2015).La introducción de los programas de cribado cervical durante los últimos 20 años ha producido una disminución extrema en la incidencia y la mortalidad por cáncer de cuello de útero(Arbyn 2009; Quinn 1999). Lo anterior se debe al tratamiento de las lesiones preinvasivas, la neoplasia intraepitelial cervical (NIC), detectada por el cribado (IARC 2005).
La NIC es una anomalía en las células escamosas del cuello del útero y, si no se trata, se puede desarrollar el cáncer de cuello de útero. La afección es asintomática y las intervenciones por lo general sólo se realizan en las pacientes con una NIC de mayor grado (NIC 2 ó 3). Lo anterior se debe a que el tratamiento cervical se ha relacionado con secuelas obstétricas adversas(Kyrgiou 2006), aunque muchas de las lesiones de grado bajo (también conocidas como LSIL por sus siglas en inglés, lesiones escamosas intraepiteliales de grado bajo o NIC 1) se solucionan espontáneamente en las pacientes jóvenes (NHS Cervical Screening Programme 2016).
La edad promedio de que una mujer sea diagnosticada y tratada por NIC está entre los 25 y 30 años de edad, aunque puede ocurrir en mujeres considerablemente más jóvenes (NHS Cervical Screening Programme 2016). Como las lesiones precancerosas ocurren habitualmente en mujeres jóvenes en edad reproductiva, la repercusión del tratamiento sobre los resultados de los embarazos posteriores ha sido un área de la investigación activa durante la última década. Aunque es primordial que se proporcione un tratamiento efectivo, también es importante que este tratamiento tenga efectos adversos mínimos sobre la fertilidad futura y los resultados del embarazo en esta población femenina joven.
Descripción de la intervención
Los métodos conservadores para el tratamiento de la NIC se clasifican en escisionales y ablativos. Estas técnicas eliminan o destruyen la zona de transformación (ZT) que contiene las células anormales a la vez que preservan la función cervical. Los métodos escisionales incluyen la conización con bisturí (CB), la conización con láser (CL), la escisión con agujas de la zona de transformación (EAZT), también conocida como escisión con alambre recto de la zona de transformación (EARZT), la escisión amplia con asa de la zona de transformación (EAAZT) (Kitchener 1995; Prendiville 1989), también conocida como procedimiento escisional con asa electroquirúrgica (PEAE) y excisor para biopsia en cono de Fischer (EBCF). Los métodos ablativos incluyen ablación con láser (AL), diatermia radical (DR), coagulación en frío (CF) y crioterapia (CT).
La edad promedio de las pacientes que reciben tratamiento local por enfermedad cervical preinvasiva está alrededor de los 30 años y es similar a la edad en que las mujeres tienen su primer hijo (Herbert 2000; Paraskevaidis 1992). El tratamiento cervical local se ha relacionado con un mayor riesgo de parto prematuro, morbilidad perinatal y mortalidad en un embarazo posterior (Albrechtsen 2008; Arbyn 2008; Bruinsma 2011; Kyrgiou 2006; Kyrgiou 2014; Noehr 2009a). El mecanismo subyacente no está claro; las hipótesis incluyen inmunomodulación relacionada con la infección por virus del papiloma humano (HPV) que afecta las vías del parto, factores de confusión no explicados en las pacientes con NIC y "debilidad mecánica" adquirida secundaria a la pérdida del tejido cervical (Kyrgiou 2012).
Sólo en Inglaterra, de 2013 a 2014, 3 600 000 mujeres con edades entre 25 y 64 años asistieron a cribado cervical y se realizaron más de 23 800 procedimientos cervicales (CervicalCancerScreening 2015), la gran mayoría en un ámbito de pacientes ambulatorios. Por el contrario, en los EE.UU. hay aproximadamente 400 000 casos de enfermedad preinvasiva por año (Henk 2010). Las regulaciones en la colposcopia son más liberales que en el Reino Unido, lo que da lugar a una variación amplia en la práctica clínica. En Alemania, el tratamiento para la NIC habitualmente todavía se realiza con bisturí bajo analgesia general(Petry 2008). Por lo tanto, las secuelas a largo plazo del tratamiento todavía son un problema internacional importante para los profesionales sanitarios y las pacientes, cualquiera que sea el contexto clínico.
De qué manera podría funcionar la intervención
Las características de los métodos conservadores de tratamiento están bien descritas y establecidas en la bibliografía médica (Martin‐Hirsch 2013). La EAAZT, la CL y la AL se realizan generalmente bajo anestesia local en un ámbito de pacientes ambulatorios, mientras la CB requiere anestesia general y hospitalización. Teóricamente, las técnicas escisionales (CB, CL, EAZT, EAAZT, EBCF) son superiores sobre las técnicas ablativas (AL, DR, CF, CT) ya que permiten una evaluación histológica integral del tejido extirpado y de la ZT completa, con una evaluación precisa de los márgenes de escisión. Las técnicas ablativas destruyen el epitelio de la ZT e impiden la evaluación histológica y, por lo tanto, la requieren una biopsia exacta pretratamiento en una consulta adicional. La EAAZT es la técnica de mayor preferencia (Kitchener 1995), al combinar todas las ventajas de las técnicas escisionales mencionadas anteriormente junto con una duración relativamente más corta, bajo costo, buen cumplimiento, sencillez y una curva de aprendizaje más fácil para los profesionales sanitarios.
La mejor evidencia disponible indica que estos métodos (CB, CL, EAAZT, AL) presentan una morbilidad baja similar y son igualmente exitosos en cuanto a la erradicación de la NIC (Martin‐Hirsch 2013; Nuovo 2000) y en la prevención del cáncer invasivo del cuello del útero (Chew 1999; Paraskevaidis 1991; Soutter 1997). Sin embargo, los datos existentes con respecto a la fertilidad futura y los resultados del embarazo son contradictorios.
Por qué es importante realizar esta revisión
Los estudios observacionales han indicado que el tratamiento de la NIC podría tener efectos perjudiciales sobre la fertilidad y el resultado del embarazo; sin embargo, las conclusiones generalmente son ambiguas, quizás debido a la flaqueza asociada con los tamaños pequeños de la muestra utilizada en los estudios. No se han encontrado en la bibliografía ensayos controlados aleatorios (ECA) publicados que comparen el resultado del embarazo entre las pacientes tratadas y sin tratar, y debido a la naturaleza premaligna de la afección tratada, quizás es poco probable que alguna vez se realicen. Por lo tanto, el único nivel disponible de evidencia sobre este tema lo podrán proporcionar las revisiones sistemáticas y metanálisis de estudios observacionales.
La publicidad en los medios de comunicación ha aumentado el conocimiento del público de que el tratamiento para el cáncer de cuello de útero se asocia con una mayor morbilidad reproductiva. Ha habido un aumento significativo de las averiguaciones de las pacientes y los médicos sobre los riesgos asociados con diferentes técnicas de tratamiento y profundidades del cono (Founta 2010; Kyrgiou 2015a), y sobre cómo este riesgo se puede controlar y prevenir. Con una base de evidencia rápidamente en evolución y la falta de una síntesis consistente de la bibliografía publicada, estas preguntas se vuelven cada vez más difíciles de responder.
Desde la primera revisión sistemática del riesgo reproductivo asociado con el tratamiento hace casi una década (Kyrgiou 2006), se han publicado más de 50 estudios observacionales que confirman (Jakobsson 2007; Ortoft 2010) o ponen en duda estas asociaciones (Castanon 2012; Reilly 2012); algunos informan datos provenientes de grandes bases de datos poblacionales. Los intentos individuales de sintetizar partes de esta base de evidencia rápidamente en evolución en revisiones sistemáticas pequeñas y metanálisis establecieron conclusiones contradictorias (Arbyn 2008; Bruinsma 2011; Conner 2014; Crane 2003; Danhof 2015; Jin 2014; Kyrgiou 2006; Kyrgiou 2014;) y suscitaron debates y confusión dentro de la comunidad científica (Arbyn 2008; Conner 2014; Crane 2003; Danhof 2015; Jin 2014). Ya sea que estas discrepancias se debieran a la calidad dudosa de algunos de estos estudios primarios y secundarios, o a diferencias en las comparaciones estudiadas (Bruinsma 2011; Conner 2014; Danhof 2015; Jin 2014), el tema está abierto a una síntesis definitiva, integral y de alta calidad de la evidencia existente que será muy informativa para las pacientes, los médicos y los elaboradores de políticas (Arbyn 2008; Bruinsma 2011; Conner 2014; Danhof 2015; Jin 2014; Kyrgiou 2014). Debido a que muchos estudios grandes(Albrechtsen 2008; Bruinsma 2007; Bruinsma 2007; Heinonen 2013; Jakobsson 2007; Jakobsson 2007; Noehr 2009a; Ortoft 2010; Reilly 2012; Shanbhag 2009) se han publicado desde el primer metanálisis de Kyrgiou(Kyrgiou 2006), se decidió actualizarlo para incorporar los estudios más recientes y prestar atención especial al efecto del grupo de comparación y a la profundidad del cono extirpado; dos áreas en las cuales otros metanálisis no han puesto énfasis.
Objetivos
Evaluar el efecto del tratamiento cervical local para la NIC y el cáncer de cuello de útero en estadio temprano sobre los resultados obstétricos (después de las 24 semanas de gestación) y relacionarlos con la profundidad del cono y el grupo de comparación utilizado.
Métodos
Criterios de inclusión de estudios para esta revisión
Tipos de estudios
Se incluyeron todos los estudios que informaron sobre resultados obstétricos tardíos (más allá de las 24 semanas de gestación) en pacientes con uno o más tratamientos cervicales locales previos para la NIC o la enfermedad invasiva temprana (estadio IA1), en comparación con pacientes sin tratamiento. Las intervenciones incluyeron cualquier tipo de tratamiento conservador, ya sea escisional o ablativo (Ver: Tipos de intervenciones).
Los estudios se incluyeron independientemente del tipo de grupo control sin tratar, que se podría haber obtenido de una de las fuentes siguientes: a) grupo externo a partir de la población general que por lo general se pareó o ajustó para los factores de confusión; b) grupo interno con autopareo de los embarazos para las mismas mujeres antes y después del tratamiento; c) grupo interno con embarazos previos al tratamiento y posteriores al tratamiento de una población determinada; d) pacientes que asisten a colposcopia con o sin NIC/biopsia pero sin tratamiento; e) pacientes con enfermedad de grado alto pero sin tratamiento (lesión intraepitelial escamosa de grado alto). Como los estudios son no aleatorios, la elección del grupo de comparación puede repercutir en la magnitud del efecto de las comparaciones propuestas. Se sabe que las pacientes con NIC pueden tener características demográficas y conductuales o incluso antecedentes de desequilibrios inmunológicos que las colocan en un riesgo inicial mayor de resultados reproductivos adversos. Los diferentes grupos de comparación tienen ventajas y desventajas y los análisis de subgrupos de los diferentes grupos permitirán una mejor evaluación de los efectos verdaderos del tratamiento. Se describen más detalles en "Evaluación del riesgo de sesgo de los estudios incluidos".
Se excluyeron los estudios que no incluyeron un grupo control sin tratar, compararon diferentes técnicas de tratamiento sin un control sin tratar, informaron solamente sobre la fertilidad o los resultados obstétricos tempranos (antes de las 24 semanas de gestación), informaron solamente sobre los resultados obstétricos más allá de las 24 semanas de gestación que no se enumeran debajo (ver: "Tipos de medidas de resultado"), compararon los resultados de tratamientos realizados durante el embarazo, o los estudios que describieron resultados en pacientes con alto riesgo (es decir, pacientes con antecedentes de aborto espontáneo o pacientes que concebían mediante tecnología de reproducción asistida [TRA])
Tipos de participantes
Se incluyeron las pacientes que tenían un embarazo con o sin un tratamiento conservador previo por NIC/cáncer de cuello de útero en estadio temprano (estadio IA1). Las pacientes se incluyeron independientemente del grado de la lesión para la neoplasia intraepitelial escamosa y glandular. Tampoco hubo restricciones de edad.
Tipos de intervenciones
Cualquier comparación de intervenciones para el tratamiento de la NIC o el cáncer de cuello de útero estadio IA1 por métodos conservadores de:
-
escisión (conización con bisturí [CB]); conización con láser (CL); escisión con agujas de la zona de transformación (EAZT), también conocida como escisión con alambre recto de la zona de transformación (EARZT); escisión amplia con asa de la zona de transformación (EAAZT), también conocida como procedimiento escisional con asa electroquirúrgica (PEAE); excisor para biopsia en cono de Fischer [EBCF]) ;
-
ablación (ablación con láser [AL]); diatermia radical (DR); coagulación en frío (CF); crioterapia (CT).
En los estudios que informaron la repercusión de varias técnicas de tratamiento se extrajeron los datos de cada método específico, cuando fue posible. Si los resultados no se informaron por separado para cada técnica, la intervención según los términos más amplios, es decir, el tratamiento escisional no especificado de otra manera (NE), tratamiento ablativo NE y el tratamiento NE.
Tipos de medida de resultado
Resultados primarios
-
Resultados maternos
-
-
prematurez general (menos de 37 semanas) (iatrogénica y espontánea)
-
prematurez grave (menos de 32 a 34 semanas)
-
prematurez extrema (menos de 28 a 30 semanas)
-
prematurez general en embarazos únicos y múltiples
-
prematurez general en pacientes nulíparas y multíparas
-
prematurez general para conos únicos y múltiples
-
prematurez general para diferentes profundidades y volúmenes del cono
-
prematurez general para diferentes grupos de comparación
-
Resultados secundarios
-
Resultados maternos
-
-
prematurez general espontánea (es decir, no iatrogénica)
-
prematurez espontánea grave
-
prematurez espontánea extrema
-
amenaza de parto prematuro
-
rotura prematura de membranas
-
corioamnionitis
-
forma del parto (cesárea, partos instrumentales)
-
duración del trabajo de parto (precipitado, prolongado)
-
inducción del trabajo de parto o uso de oxitocina
-
hemorragia (antes del parto, posparto)
-
analgesia (epidural, petidina, no especificada de otra manera)
-
estenosis cervical
-
cerclaje cervical
-
-
Resultados neonatales
-
-
bajo peso al nacer (menos de 2500 g, menos de 2000 g, menos de 1500 g, menos de 1000 g)
-
ingreso a la unidad de cuidados intensivos neonatales (UCIN)
-
mortalidad perinatal
-
mortinatos
-
Puntuación de Apgar
-
En los casos de heterogeneidad en los valores de corte utilizados para la profundidad del cono y la clasificación de prematurez, estos se agruparon cuando fue posible (es decir, 32 a 34 semanas para incluir ambos valores de corte, 10 a 12 mm de profundidad del cono para incluir los estudios que agruparon ambos valores de corte con la inclusión o no de valores iguales a estos números).
Results
Description of studies
The characteristics of the included and excluded studies and the outcomes examined are described in the Characteristics of included studies and in the Characteristics of excluded studies, respectively.
Results of the search
We retrieved 3219 citations from the literature search. Of those, 2849 were excluded based on the title or abstract; 370 were retrieved in full text for evaluation. We identified 69 studies that fulfilled the inclusion criteria and 289 were excluded (of these 289 studies, 242 were reviews/meta‐analyses, conference proceedings, letters or duplicates; the remaining 47 studies are listed in detail in Excluded studies and Characteristics of excluded studies); 12 studies are awaiting classification. No unpublished studies could be identified. The details, including reasons for exclusion, are present in the PRISMA flowchart (Moher 2009; Figure 1).

Flow diagram.
Included studies
Sixty‐nine studies fulfilled the inclusion criteria of this systematic review and were also included in the meta‐analysis. We identified no unpublished studies. The detailed characteristics of the included studies are shown in Characteristics of included studies. All studies were cohorts and retrospective, except for five prospective studies (Fischer 2010; Frega 2013; Guo 2013; Poon 2012; Simoens 2012). Fifteen studies were population‐based (the data were drawn from registers, or they included a large number of hospitals covering a large area) (Albrechtsen 2008; Andia 2011; El‐Bastawissi 1999; Frega 2013; Heinonen 2013; Jakobsson 2007; Jones 1979; Kristensen 1985; Kristensen 1993; Larsson 1982; Noehr 2009a; Noehr 2009b; Reilly 2012; Shanbhag 2009; Sjoborg 2007) and the remaining studies were hospital‐based (the data were drawn from hospital records). There were no RCTs.
Seven studies were identified in non‐English language and were not included (He 2007; Kalitsaris 1991; Kasum 1991; Lund 1986; Praest 1979; Spuhler 1995; Zornoza‐Garcia 2009) given the large number of included studies and the low quality of these small studies we considered that their inclusion would not alter the conclusions of the review. In future updates we will consider the inclusion of these reports (Characteristics of studies awaiting classification). Five studies published after April 2016, week 2 are awaiting classification in future updates of this review (Aleman 2016; Bjorge 2016; Brie 2016; Jancar 2016; Zebitay 2017).
Many of the included studies included cohorts treated with a variety of treatment modalities. Specifically, 14 studies examined the impact of cold knife conisation; (CKC) (Bruinsma 2007; Buller 1982; Crane 2006; Ehsanipoor 2014; Guo 2013; Jones 1979; Klaritsch 2006; Kuoppala 1986; Larsson 1982; Ludviksson 1982; Moinian 1982; Ortoft 2010; Sozen 2014; Weber 1979), 10 of laser conisation (LC) (Andersen 1999; Bekassy 1996; Forsmo 1996; Hagen 1993; Lima 2011; Raio 1997; Sadler 2004; Sagot 1995; Simoens 2012; Spitzer 1995), one of needle excision of the transformation zone (NETZ) (Ortoft 2010), 32 of large loop excision of the transformation zone (LLETZ) (Acharya 2005; Andia 2011; Blomfield 1993; Braet 1994; Bruinsma 2007; Crane 2006; Cruickshank 1995; Ehsanipoor 2014; Frega 2013; Frey 2013; Gunasekera 1992; Guo 2013; Haffenden 1993; Heinonen 2013; Himes 2007; Jakobsson 2009; Kitson 2014; Lima 2011; Martyn 2015; Noehr 2009a; Noehr 2009b; Ortoft 2010; Paraskevaidis 2002; Parikh 2008; Poon 2012; Sadler 2004; Samson 2005; Simoens 2012; Stout 2015; Tan 2004; Turlington 1996; Werner 2010), one of Fischer cone biopsy Excisor (FCBE) (Anwar 2016), eight of laser ablation (LA) (Anderson 1984; Bruinsma 2007; Forsmo 1996; Gunasekera 1992; Sadler 2004; Saunders 1986; Spitzer 1995; van Rooijen 1999), one of radical diathermy (RD) (Bruinsma 2007), two of cryotherapy (CT) (Crane 2006; Hemmingsson 1982), 15 of excision not otherwise specified (NOS) (Albrechtsen 2008; Armarnik 2011; Castanon 2012; El‐Bastawissi 1999; Fischer 2010; Jakobsson 2007; Martyn 2015; Miller 2015; Reilly 2012; Shanbhag 2009; Simoens 2012; Sjoborg 2007; van de Vijner 2010; Van Hentenryck 2012; Wuntakal 2013), five of ablation NOS (Ehsanipoor 2014; El‐Bastawissi 1999; Jakobsson 2007; Reilly 2012; Shanbhag 2009) and three of treatment NOS (Kirn 2015; Kristensen 1985; Kristensen 1993).
There were five types of comparison groups: external (general population) (Acharya 2005; Albrechtsen 2008; Andersen 1999; Anderson 1984; Andia 2011; Armarnik 2011; Bekassy 1996; Blomfield 1993; Braet 1994; Castanon 2012; Crane 2006; Cruickshank 1995; Ehsanipoor 2014; El‐Bastawissi 1999; Fischer 2010; Forsmo 1996; Frega 2013; Frey 2013; Gunasekera 1992; Haffenden 1993; Hagen 1993; Heinonen 2013; Jakobsson 2007; Jakobsson 2009; Jones 1979; Kirn 2015; Klaritsch 2006; Kristensen 1985; Kristensen 1993; Kuoppala 1986; Lima 2011; Ludviksson 1982; Miller 2015; Noehr 2009a; Noehr 2009b; Ortoft 2010; Paraskevaidis 2002; Parikh 2008; Poon 2012; Raio 1997; Reilly 2012; Samson 2005; Saunders 1986; Shanbhag 2009; Simoens 2012; Sjoborg 2007; Sozen 2014; Tan 2004; van de Vijner 2010; Van Hentenryck 2012; van Rooijen 1999; Weber 1979; Werner 2010); internal (pre‐treatment pregnancies) (Acharya 2005; Albrechtsen 2008; Andia 2011; Buller 1982; Castanon 2012; Cruickshank 1995; Hemmingsson 1982; Larsson 1982; Moinian 1982; Sagot 1995; Spitzer 1995; Stout 2015; Werner 2010; Wuntakal 2013); internal (self‐matching) (Anwar 2016; Bekassy 1996; Castanon 2012; Jakobsson 2009; Kristensen 1993; Ortoft 2010; Raio 1997; Sjoborg 2007); women who attended colposcopy with or without biopsy who did not undergo treatment (Bruinsma 2007; Castanon 2012; Frey 2013; Guo 2013; Himes 2007; Kitson 2014; Martyn 2015; Miller 2015; Noehr 2009a; Poon 2012; Sadler 2004; Stout 2015; Wuntakal 2013), and women with untreated high‐grade squamous intra‐epithelial lesion (HSIL) (El‐Bastawissi 1999; Ortoft 2010; Shanbhag 2009).
As many studies were old, dating back to the 1980s, we ensured that we avoided overlapping the same patients in different reports, particularly those from the Scandinavian countries. More specifically, seven studies were identified from Denmark. Weber 1979 was an old hospital‐based study (delivery during 1974 to 1975), with no overlapping with the other more recent studies. Kristensen 1985 identified treated women from the registry of a Danish county (1973 to1980), but only women delivering in a specific university hospital (up to 1982) were included. Kristensen 1993 was a population‐based study from the whole of Denmark including only parous women, with their first infant delivered in 1982, and their second during 1982 to 1987 (treatment during 1977 to 1987). There was no overlapping with Kristensen 1985. Andersen 1999 was a hospital‐based study including women treated during 1985 to 1989. There was a negligible degree of overlapping with Kristensen 1993 (for women with delivery in 1982, treatment during 1985 to 1987 and subsequent delivery until 1987). Noehr 2009a was a population‐based study from the whole of Denmark that was comprised of women treated during 1997 to 2005 with subsequent singleton pregnancy at the same time period. There was no overlapping with the previous studies. Noehr 2009b had the same design with Noehr 2009a and the only difference was that only women with twin pregnancies were included. Ortoft 2010 identified treated women from the Danish nationwide pathology database (1989 to 2007), but only women delivering at Aarhus University Hospital until 2007 were included. Approximately 8% of all Danish births take place in this hospital. Women delivering during 1997 to 2005 (nine years) were also included in Noehr 2009a, but women delivering during 1989 to 1996 and 2006 to 2007 (10 years) were not included in Noehr 2009a. Because there was no way to eliminate the overlapping, we decided to include both studies.
Four studies were identified from Finland. Some of the authors in Jakobsson 2007 (population‐based study from the whole of Finland), Jakobsson 2009 (hospital‐based study) and Heinonen 2013 (population‐based study from the whole of Finland) were common, and we carefully avoided duplication. More details about the outcomes extracted from each study are listed in Characteristics of included studies. Kuoppala 1986 was another hospital‐based study from Finland, but there was no overlapping with the aforementioned population‐based studies.
Five studies were identified from Norway. Albrechtsen 2008 was a population‐based study from the whole of Norway (excisional treatment during 1953 to 1979 or 1986 to 2003 and subsequent pregnancy during 1967 to 2003). All participants in Acharya 2005 and Sjoborg 2007 were also included in Albrechtsen 2008, thus we excluded Acharya 2005 and Sjoborg 2007 from the analyses, which also included Albrechtsen 2008. There was no overlapping between Acharya 2005 and Sjoborg 2007. Forsmo 1996 was a hospital‐based study which included women treated with LLETZ or LA during 1983 to 1988. There was overlapping with Albrechtsen 2008 for women treated with LLETZ during 1986 to 1988, but there was no way to eliminate this overlapping. In Hagen 1993, all women had received LLETZ during 1983to 1985 and there was no overlapping with Albrechtsen 2008.
Six studies were identified from Sweden. Five of these studies were hospital‐based (Bekassy 1996; Hemmingsson 1982; Ludviksson 1982; Moinian 1982; van Rooijen 1999). Larsson 1982 identified women from the South Swedish Regional Tumour Registry, but only women delivering in two hospitals were included. One of these hospitals was also included in Bekassy 1996, but the studies took place in different periods with no overlapping.
Although case‐control studies and studies assessing the impact of treatment performed during pregnancy were excluded, we included the study by Ortoft 2010, as only 18 women (2.5%) were treated during pregnancy, and the case‐control study by Castanon 2012, as additional data were provided by the authors.
There was no risk of overlapping for studies from other countries.
Excluded studies
The characteristics of the 47 excluded studies (not including reviews/meta‐analyses, conference proceedings, letters or duplicates) are shown in Characteristics of excluded studies. The PRISMA flowchart is shown in Figure 1 . We excluded studies without an untreated comparison group (Althuisius 2001; Berghella 2004; Berretta 2013; Bull‐Phelps 2007; Chevreau 2017; Conner 2013; Ferenczy 1995; Gordon 1991; Gronroos 1979; Khalid 2012; Kim 2016; Kindinger 2016; Kullander 1971; Leiman 1980; Liu 2014; Liverani 2016; Macvicar 1968; Mariya 2016; Masamoto 2008; Michelin 2009; Monaghan 1982; Nam 2010; Novikova 1994; Patrelli 2008; Radha Bai Prabhu 2010; Rafaeli‐Yehudai 2014; Sangkarat 2014; Shin 2010; Wakita 1990; Wongtiraporn 2014), studies with women treated during pregnancy (Mitsuhashi 2000; Rosen 1991; Seki 2010; Sljivancanin 2013), or late obstetric outcomes (beyond 24 weeks) that we did not study in this meta‐analysis (Ciavattini 2015; Gentry 2000; Kalliala 2012; Naleway 2015; Ricciotti 1995; Spracklen 2013), case‐control studies (Watson 2012), studies with a high‐risk treated and/or comparison group (i.e. previous history of mid trimester loss (Pils 2014), conceived through assisted reproductive technology (ART) (Ciavattini 2014; Pinborg 2015)), and studies assessing the impact of CIN on outcomes without information as to whether treatment was performed (Al‐Halal 2013; Smaldone 2010; Zuo 2011).
Risk of bias in included studies
The included studies were non‐randomised studies (NRS); they were prospective or retrospective cohorts and were therefore at high risk of underlying bias. The included studies varied with regard to design, the data source, the study and comparison populations, the reported outcomes, the length of follow‐up and the matching for possible confounders, as described above.
The summary of the authors' judgements about each 'Risk of bias' item is presented in Figure 2 and the detailed evaluation of 'Risk of bias' domains separately for each included study in Figure 3.
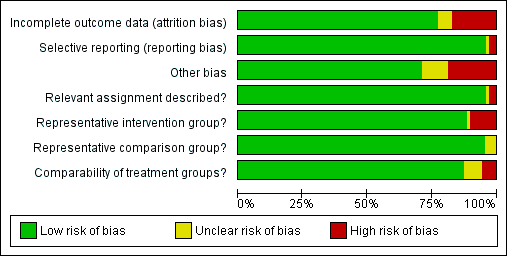
'Risk of bias' graph: review authors' judgements about each risk of bias item presented as percentages across all included studies.
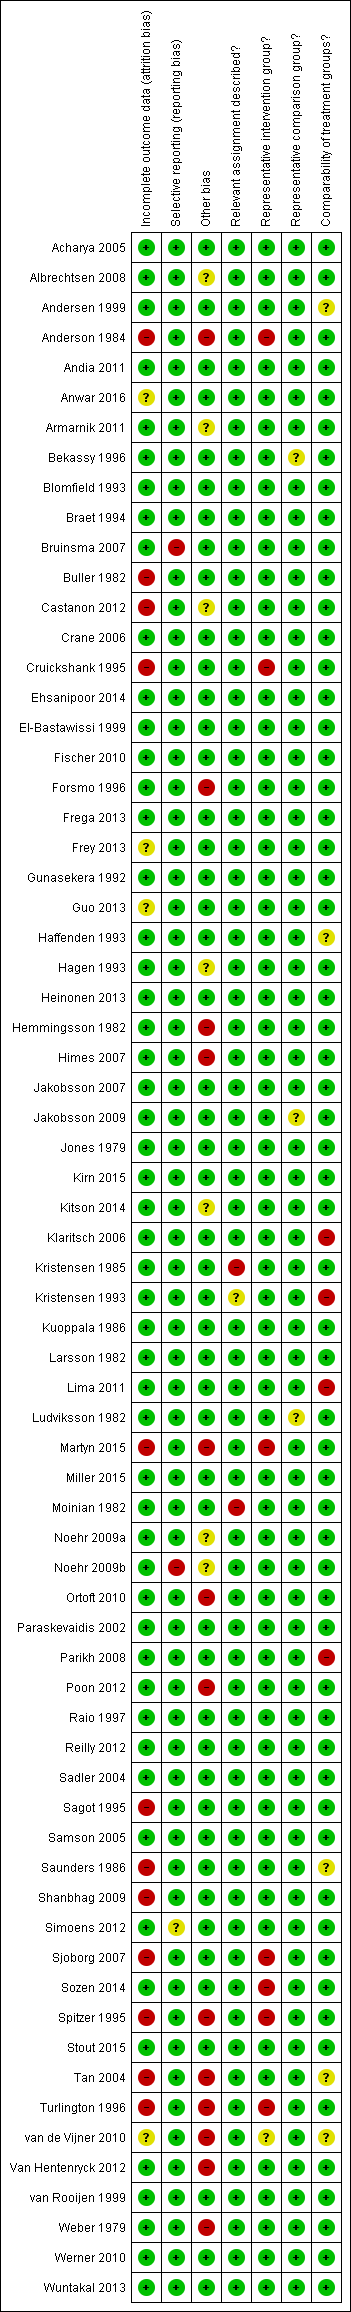
'Risk of bias' summary: review authors' judgements about each risk of bias item for each included study.
A description of the quality of the evidence is provided based on the GRADE assessment on maternal outcomes (summary of findings Table for the main comparison) and on fetal outcomes (summary of findings Table 2).
Allocation
Representativeness of intervention group
Risk of bias due to unrepresentative intervention group was generally considered low. In six studies (Anderson 1984; Cruickshank 1995; Martyn 2015; Sjoborg 2007; Spitzer 1995; Turlington 1996), the representativeness of the intervention group was considered inadequate due to considerable, over 20%, non‐responder rate to follow‐up questionnaires, which might result in selection bias due to women in higher social classes being more prone to answer. In one study (Sozen 2014), the intervention group was considered unrepresentative due to the very small number of participants (15 patients) and in one study (van de Vijner 2010), the representativeness was unclear due to lack of information regarding the number of women providing questionnaire‐based follow‐up data.
Representativeness of comparison group
The representativeness of the comparison group was considered good in all but three studies. In two studies (Bekassy 1996; Jakobsson 2009), the untreated external comparison group was not drawn from the same source as the treated population and in one study (Ludviksson 1982), the source of reference population was unclear.
Comparability of the groups
The comparison group used and the adjustment for possible risk factors are important measures of study quality and risk of bias. Of the studies that used an external comparison group (n = 53, Included studies), 49 matched for known risk factors or performed a regression analysis to control for known confounders. Only four studies did not include any measures to control for confounders (Klaritsch 2006; Kristensen 1993; Lima 2011; Parikh 2008) and were hence considered to be of high risk of bias. Of the remaining 49 studies, 29 studies used matching (Acharya 2005; Andersen 1999; Anderson 1984; Bekassy 1996; Blomfield 1993; Braet 1994; Cruickshank 1995; Fischer 2010; Forsmo 1996; Frega 2013; Gunasekera 1992; Haffenden 1993; Hagen 1993; Jones 1979; Kirn 2015; Kristensen 1985; Kuoppala 1986; Ludviksson 1982; Paraskevaidis 2002; Raio 1997; Samson 2005; Saunders 1986; Simoens 2012; Sozen 2014; Tan 2004; van de Vijner 2010; Van Hentenryck 2012; van Rooijen 1999; Weber 1979), 17 studies used regression analysis (Albrechtsen 2008; Andia 2011; Armarnik 2011; Castanon 2012; Crane 2006; Ehsanipoor 2014; Heinonen 2013; Jakobsson 2007; Jakobsson 2009; Miller 2015; Noehr 2009a; Noehr 2009b; Ortoft 2010; Poon 2012; Reilly 2012; Shanbhag 2009; Werner 2010) and three studies used both matching and regression analysis (El‐Bastawissi 1999; Frey 2013; Sjoborg 2007). In five studies (Andersen 1999; Haffenden 1993; Saunders 1986; Tan 2004; van de Vijner 2010), the risk was considered unclear due to incomplete matching between the two groups.
Of the 13 studies that had an internal comparison group (pre‐treatment pregnancies), two used matching (Larsson 1982; Spitzer 1995) and four studies also performed regression analysis (Albrechtsen 2008; Castanon 2012; Werner 2010; Wuntakal 2013). Of the eight studies that had an internal comparison group (self‐matching), three studies also performed regression analysis (Castanon 2012; Jakobsson 2009; Sjoborg 2007).
Of the 15 studies that used as a comparison group women who attended colposcopy with or without biopsy who did not undergo treatment or untreated HSIL, 10 studies performed regression analysis (Bruinsma 2007; Castanon 2012; El‐Bastawissi 1999; Miller 2015; Noehr 2009a; Ortoft 2010; Poon 2012; Sadler 2004; Shanbhag 2009; Wuntakal 2013), four studies used matching for confounders (Guo 2013; Kitson 2014; Martyn 2015; Stout 2015), and one study (Frey 2013) used both matching and regression analysis. The most common confounding factors that were used in matching or regression analysis were age, parity, smoking, race/ethnicity and social class.
Blinding
Relevant assignment described (Performance bias)
Bias due to unclear or inappropriate treatment assignment was considered low in most studies. In two studies the risk was deemed high, due to the conisation type not being described (Kristensen 1985) and the CKC treatment being described to be more radical than as usual (Moinian 1982). In one study (Kristensen 1993), the risk was unclear as the method of treatment was not specified but could have included three different types of treatment.
Incomplete outcome data
Overall 12/69 studies (17%) were considered to be at high risk of attrition bias due to incomplete outcome data. In 10 studies information about the subsequent pregnancies was missing for more than 20% of the study population (Anderson 1984; Buller 1982; Castanon 2012; Cruickshank 1995; Martyn 2015; Sagot 1995; Sjoborg 2007; Spitzer 1995; Tan 2004; Turlington 1996), in one study (Saunders 1986), the method to retrieve subsequent pregnancy data was deemed non‐systematic, i.e. contacting local general practitioners, and in one study (Shanbhag 2009), the method of CIN treatment was unclear for more than 50% and these women were excluded from all analyses. In four studies (Anwar 2016; Frey 2013; Guo 2013; van de Vijner 2010), the number of women lost to follow‐up and therefore the risk of attrition bias was unclear and for all other studies the risk was deemed to be low.
Selective reporting
Reporting bias due to selective reporting was considered low in almost all included studies. For two studies (Bruinsma 2007; Noehr 2009b), the risk was deemed high due to the results being reported only for the whole treated‐group, not stratified according to the treatment type. For one study (Simoens 2012), the risk was considered to be unclear due to reporting the outcomes only after some, not all included treatments.
Other potential sources of bias
The outcome ascertainment was made with a questionnaire in seven studies (Martyn 2015; Ortoft 2010; Poon 2012; Spitzer 1995; Turlington 1996; van de Vijner 2010; Weber 1979), which might predispose to recall bias and misclassification and the risk of other bias was hence considered high in these studies. A further five studies were as well considered to be of high risk of other bias, due to contradictions between the tables and the text (Himes 2007; Tan 2004; Van Hentenryck 2012), due to including treated women in comparison groups (Forsmo 1996), and marked temporal differences in outcomes between the exposed and unexposed groups (Hemmingsson 1982). The risk of other bias was considered unclear in six studies. In two studies (Albrechtsen 2008; Castanon 2012), some women in the comparison group might have been being treated but the effect of this possible misclassification was deemed unclear, in one study some of the data were discrepant but the possible effect of this again deemed unclear (Armarnik 2011), and in two studies (Noehr 2009a; Noehr 2009b), the LLETZ group might have included women treated with LC as well, but the number was considered negligible and unclear whether it would introduce bias.
We assessed the presence of publication bias for the outcomes presented in the 'Summary of findings' tables if more than 10 studies were included. There was evidence of publication bias only for PTB at < 32 to 34 weeks of gestation. None of the other outcomes showed any evidence of publication bias.
Effects of interventions
See: Summary of findings for the main comparison The effect of treatment for CIN on maternal outcomes; Summary of findings 2 The effect of treatment for CIN on neonatal outcomes
MATERNAL OUTCOMES
Preterm birth
The risk of preterm birth was increased after cervical treatment. This was the case for prematurity rate overall at less than 37 weeks of gestation (Analysis 1.1: 59 studies, 5,242,917 women, 10.7% versus 5.4%, risk ratio (RR) 1.75, 95% confidence interval (CI) 1.57 to 1.96; Analysis 1.2: 59 studies, 5,242,917 women, 10.7% versus 5.4%, RR 1.78, 95% CI 1.60 to 1.98, very low quality of evidence because of considerable (I2 90% and 88%, respectively) heterogeneity (summary of findings Table for the main comparison)); for severe prematurity less than 32 to 34 weeks of gestation (Analysis 1.3: 24 studies, 3,793,874 women, 3.5% versus 1.4%, RR 2.25, 95% CI 1.79 to 2.82; Analysis 1.4: 24 studies, 3,793,874 women, 3.5% versus 1.4%, RR 2.35, 95% CI 1.88 to 2.95, very low quality of evidence because of considerable (I2 83% and 82%, respectively) heterogeneity and suspected publication bias (summary of findings Table for the main comparison)); and extreme prematurity less than 28 to 30 weeks of gestation (Analysis 1.5: 8 studies, 3,910,629 women, 1.0% versus 0.3%, RR 2.23, 95% CI 1.55 to 3.22; Analysis 1.6: 8 studies, 3,910,629 women, 1.0% versus 0.3%, RR 2.43, 95% CI 1.69 to 3.49, very low quality of evidence because of considerable (I2 84% and 82%, respectively) heterogeneity (summary of findings Table for the main comparison)). We further conducted analyses for more specific gestational ages cut‐offs (i.e. 34 weeks or less (Analysis 1.7 (RR 2.59, 95% CI 1.78 to 3.77); Analysis 1.8 (RR 2.56, 95% CI 1.78 to 3.69)), less than 32 to 33 weeks (Analysis 1.9 (RR 2.08, 95% CI 1.55 to 2.79); Analysis 1.10 (RR 2.26, 95% CI 1.70 to 3.01)), less than 30 weeks (Analysis 1.11 (RR 2.86, 95% CI 0.12 to 69.11); Analysis 1.12 (RR 2.86, 95% CI 0.12 to 69.11)), less than 28 weeks (Analysis 1.13 (RR 2.22, 95% CI 1.54 to 3.22); Analysis 1.14 (RR 2.52, 95% CI 1.71 to 3.72)) for broader treatment groups as well as individual techniques. The impact of treatment was not different for nulliparous (Analysis 1.15) and multiparous (Analysis 1.16) women. The effect of multiple treatment on the risk of prematurity was substantially higher than the effect of single treatments (single treatment versus no treatment (Analysis 1.17): 17 studies, 1,367,023 women, 7.5% versus 4.2%, RR 1.75, 95% CI 1.49 to 2.06; repeat treatment versus no treatment (Analysis 1.18): 11 studies, 1,317,284 women, 13.2% versus 4.1%, RR 3.78, 95% CI 2.65 to 5.39, very low quality of evidence because of considerable (I2 75%) heterogeneity (summary of findings Table for the main comparison)). The relative risk of preterm birth for two excisional treatments not otherwise specified (NOS) was as high as 5.48 (95% CI 2.68 to 11.24) and that of two loop excisions as high as 2.81 (95% CI 2.33 to 3.39), as compared to no treatment.
The magnitude of the effect of treatment was higher for excision (Analysis 1.1.1: RR 1.87, 95% CI 1.64 to 2.12) rather than ablation (Analysis 1.1.2: RR 1.35, 95% CI 1.20 to 1.52) and for more radical treatment techniques. The risk of preterm birth at less than 37 weeks of gestation for individual treatment techniques varied: cold knife conisation (CKC) (Analysis 1.2.1: RR 2.70, 95% CI 2.14 to 3.40); laser conisation (LC) (Analysis 1.2.2: RR 2.11, 95% CI 1.26 to 3.54); large loop excision of the transformation zone (LLETZ) (Analysis 1.2.4: RR 1.58, 95% CI 1.37 to 1.81); laser ablation (LA) (Analysis 1.2.6: RR 1.04, 95% CI 0.86 to 1.26); CT (Analysis 1.2.7: RR 1.02, 95% CI 0.22 to 4.77); excision NOS (Analysis 1.2.9: RR 1.90, 95% CI 1.50 to 2.41); ablation NOS (Analysis 1.2.10: RR 1.46, 95% CI 1.27 to 1.66) and treatment NOS (Analysis 1.2.11: (RR 2.57, 95% CI 1.39 to 4.77). Similar trends were noted for severe (Analysis 1.4) and extreme (Analysis 1.6) prematurity. Some, but not all, types of treatments were also associated with an increased risk of preterm birth for women with singleton (Analysis 1.19) or multiple pregnancies (Analysis 1.20; Analysis 1.21; Analysis 1.22), but the results were inconsistent due to the small number of studies.
Preterm birth — dimensions of excised cone
We further analysed the data on the risk of preterm birth at less than 37 weeks of gestation for different cone depths. The risk for treated versus untreated women was greater for women with cone depth ≤ 10 mm to 12 mm (Analysis 1.23: 8 studies, 550,929 women, 7.1 % versus 3.4%, RR 1.54, 95% CI 1.09 to 2.18, very low quality of evidence because of substantial (I2 67%) heterogeneity (summary of findings Table for the main comparison)), and the magnitude of effect increased with increasing cone depth (≥ 10 mm to 12 mm (Analysis 1.24): 8 studies, 552,711 women, 9.8 % versus 3.4%, RR 1.93, 95% CI 1.62 to 2.31, low quality of evidence (summary of findings Table for the main comparison); ≥ 15 mm to 17 mm (Analysis 1.25): 4 studies, 544,986 women, 10.1 % versus 3.4%, RR 2.77, 95% CI 1.95 to 3.93, very low quality of evidence because of moderate (I2 53%) heterogeneity (summary of findings Table for the main comparison); ≥ 20 mm (Analysis 1.26): 3 studies, 543,750 women, 10.2 % versus 3.4%, RR 4.91, 95% CI 2.06 to 11.68, very low quality of evidence because of considerable (I2 67%) heterogeneity (summary of findings Table for the main comparison)). A similar increasing effect was observed, although based on only one study, with increasing cone volume (less than 6 cc (Analysis 1.27): 1 study, 550 women, 8.1% versus 3.6%, RR 2.25, 95%CI 1.09 to 4.66; > 6 cc (Analysis 1.28): 1 study, 284 women, 50.0% versus 3.6%, RR 13.90, 95% CI 5.09 to 37.98). We have performed additional analyses assessing several more specific cone depths/volumes without merging these in broader groups (Analysis 1.29; Analysis 1.30; Analysis 1.31; Analysis 1.32; Analysis 1.33; Analysis 1.34; Analysis 1.35; Analysis 1.36; Analysis 1.37; Analysis 1.38; Analysis 1.39; Analysis 1.40; Analysis 1.41; Analysis 1.42).
The comparison of treated women for different cone depths revealed that deep excisions increased the risk of preterm birth (less than 37 weeks) as opposed to less deep excisions and the magnitude of the effect increased in longer cones (≥ 10 mm to 12 mm versus ≤ 10 mm to 12 mm (Analysis 1.43): 7 studies, 6359 women, 12.3 % versus 7.8%, RR 1.54, 95% CI 1.31 to 1.80; ≥ 15 mm to 17 mm versus ≤ 15 mm to 17 mm (Analysis 1.44): 4 studies, 4275 women, 10.1 % versus 5.7%, RR 1.82, 95% CI 1.47 to 2.26; ≥ 20 mm versus ≤ 20 mm (Analysis 1.45): 3 studies, 3944 women, 10.2 % versus 5.6%, RR 2.79, 95% CI 1.24 to 6.27). The findings were similar for the comparison of cone volumes (> 3 cc versus less than 3 cc (Analysis 1.46): 1 study, 278 women, 15.0 % versus 7.3%, RR 2.04, 95% CI 0.95 to 4.39; > 6 cc versus less than 6 cc (Analysis 1.47): 1 study, 278 women, 50.0% versus 8.1%, RR 6.18, 95% CI 2.53 to 15.13). Further subgroup analyses of comparisons of more specific cone depths are also shown (Analysis 1.48; Analysis 1.49; Analysis 1.50).
Preterm birth — effect of the comparison group
The impact that the choice of comparison group may have on the magnitude of effect was assessed by additional analysis that classified different studies according to the comparator used. The magnitude of effect was higher when an external comparison group was used (Analysis 1.51: 44 studies, 5,192,047 women, 10.5% versus 5.4%, RR 1.92, 95% CI 1.70 to 2.16), followed by internal comparators (self‐matching (Analysis 1.52): 8 studies, 2987 women, 10.9% versus 7.0%, RR 1.59, 95% CI 1.19 to 2.13; pre‐treatment pregnancies (Analysis 1.53): 13 studies, 83,404 women, 14.1% versus 6.4%, RR 1.39, 95% CI 0.98 to 1.96) and ultimately women with disease but no treatment (Analysis 1.54: 13 studies, 74,958 women, 8.8% versus 6.0%, RR 1.27, 95% CI 1.14 to 1.41). A further analysis of treated women versus those with untreated HSIL was also explored although this included only three studies (Analysis 1.55: 3 studies, 3764 women, 12% versus 7.8%, RR 1.37, 95% CI 0.85 to 2.19). The forest plot where we compared treatment in general to the different comparison groups can be seen in Analysis 1.56. When women with disease but no treatment and the pregnancies of the parous women before treatment were compared to the general population, the risk of preterm birth was higher (Analysis 1.57: 15 studies, 4,357,998 women, 5.9% versus 5.6%, RR 1.24, 95% CI 1.14 to 1.34) based on very low‐quality evidence. These groups were also analysed separately (Analysis 1.57.1; Analysis 1.57.2; Analysis 1.57.3).
Furthermore, we performed a series of analyses for different cone depths and comparison groups with particularly emphasis on the comparisons of different depths of treatment versus untreated women with CIN (Analysis 1.58; Analysis 1.59; Analysis 1.60; Analysis 1.61; Analysis 1.62; Analysis 1.63; Analysis 1.64; Analysis 1.65; Analysis 1.66; Analysis 1.67; Analysis 1.68; Analysis 1.69; Analysis 1.70; Analysis 1.71; Analysis 1.72; Analysis 1.73; Analysis 1.74; Analysis 1.75). The subgroup analysis of the risk of preterm birth (less than 37 weeks of gestation) according to cone depth when compared to women with CIN but not treated revealed similar direction of effect although for cone depth ≤ 10 mm to 12 mm, the difference was less marked. The number of the studies was however small for many comparisons (treatment versus women with untreated CIN = cone depth ≤ 10 mm to 12 mm (Analysis 1.60): 4 studies, 43,145 women, 7.0% versus 5.0%, RR 1.11, 95% CI 0.85 to 1.43; ≥ 10 mm to 12 mm (Analysis 1.67): 4 studies, 45,275 women, 9.6% versus 5.0%, RR 1.52, 95% CI 1.37 to 1.68; ≥ 15 mm to 17 mm (Analysis 1.69): 3 studies, 33,934 women, 9.6% versus 4.3%, RR 2.30, 95% CI 1.57 to 3.35; ≥ 20 mm (Analysis 1.71): 2 studies, 32,717 women, 9.3% versus 4.2%, RR 4.32, 95% CI 0.93, 20.03) based on low‐ or very low‐quality evidence.
Preterm birth ‐ sensitivity and meta‐regression analysis
The mono‐variate meta‐regression analysis suggested that the type of treatment and comparator affected the risk of preterm birth, although the year of study did not. Type of treatment and comparison group remained important factors for risk of preterm birth (PTB) in a multivariate regression analysis. When we performed further meta‐regression restricting only to excisional treatments and using as a comparator women with colposcopy/biopsy, we found that all treatments were associated with an increased risk of PTB (RR 1.34, 95% CI 1.10 to 1.64, for LLETZ; RR 2.3, 95% CI 1.39 to 3.85, for CKC; RR 1.6, 95% CI 0.91 to 2.87, for LC; and RR 4.26, 95% CI 1.96 to 9.33, for needle excision of the transformation zone) (data not shown).
Other Maternal outcomes
Maternal outcomes other than preterm birth were assessed in several studies and many of these were found to be increased after cervical treatment. This increase was more frequent for excisional as opposed to ablative techniques and with increasing treatment radicality, although the number of studies assessing each individual treatment method was frequently small.
Cervical treatment increased the risk of spontaneous overall, severe and extreme preterm birth (less than 37 weeks (Analysis 2.1): 14 studies, 1,024,731 women, 7.0% versus 3.7%, RR 1.76, 95% CI 1.47 to 2.11; less than 32 to 34 weeks (Analysis 2.2): 7 studies, 655,675 women, 1.8% versus 0.6%, RR 2.63, 95% CI 1.91 to 3.62; less than 28 weeks (Analysis 2.3): 2 studies, 626,670 women, 0.6% versus 0.2%, RR 3.18, 95% CI 1.64 to 6.16). The risk of spontaneous preterm birth (less than 37 weeks) was higher for CKC (Analysis 2.1.1: RR 3.53, 95% CI 2.05 to 6.05) followed by excision NOS (Analysis 2.1.7: RR 1.70, 95% CI 1.17 to 2.46), LLETZ (Analysis 2.1.4: RR 1.60, 95% CI 1.22 to 2.08) and ablation NOS (Analysis 2.1.8: RR 1.42, 95% CI 1.20 to 1.70). Needle excision of the transformation zone (NETZ) (Analysis 2.1.3) and LA (Analysis 2.1.5) were only assessed in one study, respectively. There was substantial heterogeneity for the comparisons assessing spontaneous preterm birth at all cut‐offs (P value less than 0.05) based on low‐ or very low‐quality evidence.
The risk of pPROM less than 37 weeks (Analysis 2.4: 21 studies, 477,011 women, 6.1% versus 3.4%, RR 2.36, 95% CI 1.76 to 3.17, very low quality of evidence because of considerable (I2 79%) heterogeneity (summary of findings Table for the main comparison)) was also increased after treatment. The risk of pPROM was higher for CKC (Analysis 2.4.1: RR 4.11, 95% CI 2.05 to 8.25) followed by LLETZ (Analysis 2.4.4: RR 2.15, 95% CI 1.48 to 3.12). NETZ (Analysis 2.4.3) was only assessed in one study and LA (Analysis 2.4.5) did not significantly affect the risk but was only assessed in two studies based on low‐ or very low‐quality evidence. We also included analyses at different gestational cut‐offs (Analysis 2.5; Analysis 2.6)
Treatment increased the risk of admission for threatened preterm birth (Analysis 2.7; 5 studies, 903 women, 9.1% versus 3.2%, RR 2.44, 95% CI 1.37 to 4.33) and chorioamnionitis (Analysis 2.8; 4 studies, 29,198 women, 3.5% versus 1.1%, RR 3.43, 95% CI 1.36 to 8.64).The mode of delivery (caesarean section (Analysis 2.9; very low quality of evidence because of imprecision and strongly suspected publication bias (summary of findings Table 2)) or instrumental delivery (Analysis 2.10)), the length of labour (precipitous (Analysis 2.11) or prolonged (Analysis 2.12)), the rate of induction of labour with or without oxytocin to (Analysis 2.13), the use of oxytocin (Analysis 2.14), the use of analgesia (epidural (Analysis 2.15), pethidine (Analysis 2.16) or NOS (Analysis 2.17)), cervical stenosis (Analysis 2.18) or antepartum haemorrhage (Analysis 2.19). was not affected by treatment. The risk of postpartum haemorrhage was increased after treatment, but this outcome included just one study (Analysis 2.20; 1 study, 149 women, 18.7% versus 4.1%, RR 4.60, 95% CI 1.38 to 15.36). The risk of massive obstetric haemorrhage was not increased but there was only one small study (Analysis 2.21). As expected, the rate of cervical cerclage insertion was higher for treated as opposed to non‐treated women (Analysis 2.22; 8 studies, 141,300 women, 4.0% versus 0.7%, RR 14.29, 95% CI 2.85 to 71.65) and more so for CKC (Analysis 2.22.1: RR 31.42, 95% CI 2.32 to 426.22) and excisional treatment NOS (Analysis 2.22.4: RR 42.45, 95% CI 28.99 to 62.16) based on low‐ or very low‐quality evidence.
Neonatal outcomes
More than 30 studies assessed one or more neonatal outcomes. Cervical treatment (excisional or ablative) was associated with a higher frequency of adverse neonatal outcomes as opposed to women who had not been treated (comparison group not specified). The association with adverse neonatal events was stronger and more frequent for excisional as opposed to ablative techniques and with increasing treatment radicality, although the number of studies for each individual treatment technique was often limited.
More specifically, cervical treatment overall increased the risk of low birth weight (LBW) for some, but not all, cut‐offs, although the number of studies was small for most cut‐offs (less than 2500 g (Analysis 3.1): 30 studies, 1,348,206 women, 7.9% versus 3.7%, RR 1.81, 95% CI 1.58 to 2.07, very low quality of evidence because of substantial (I2 63%) heterogeneity (summary of findings Table 2); less than 2000 g (Analysis 3.2): 3 studies, 74,981 women, 4.7% versus 1.1%, RR 2.49, 95% CI 0.97 to 6.36; less than 1500 g (Analysis 3.3)): 5 studies, 76,836 women, 2.0% versus 0.5%, RR 3.00, 95% CI 1.54 to 5.85; less than 1000 g (Analysis 3.4): 2 studies, 2185 women, 1.1% versus 0.3%, RR 2.09, 95% CI 0.06 to 74.71). Treatment also increased the risk of neonatal intensive care unit (NICU) admission (Analysis 3.5: 8 studies, 2557 women, 12.6% versus 8.9%, RR 1.45, 95% CI 1.16 to 1.81, low quality of evidence (summary of findings Table 2)) and perinatal mortality (Analysis 3.6: 23 studies, 1,659,433 women, 0.9% versus 0.7%, RR 1.51, 95% CI 1.13 to 2.03, low quality of evidence (summary of findings Table 2)). Subgroup analyses of the perinatal mortality for different gestational ages at delivery was also included (Analysis 3.7; Analysis 3.8; Analysis 3.9). The rate of stillbirth was not affected by treatment (Analysis 3.10), while the analysis on the impact of treatment on the Apgar scores only included a small number of studies (Analysis 3.11; Analysis 3.12; Analysis 3.13).
The rate of neonates born with A birth weight of less than 2500 g was more frequently observed in women treated with CKC (Analysis 3.1.1: 5 studies, 30,304 women, RR 2.51, 95% CI 1.78 to 3.53), LLETZ (Analysis 3.1.3: 12 studies, 3357 women, RR 2.11, 95% CI 1.51 to 2.94), excisional (Analysis 3.1.6: 10 studies, 823,648 women, RR 2.01, 95% CI 1.62 to 2.49) or ablative (Analysis 3.1.7: 4 studies, 483,402 women, RR 1.36, 95% CI 1.19 to 1.55) treatment NOS, but not so for laser ablation (Analysis 3.1.4: RR 1.07, 95% CI 0.59 to 1.92), although only four studies with a total of 1104 participants assessed that comparison. The rate of NICU admission was increased overall (Analysis 3.5), and for LLETZ (Analysis 3.5.2: 5 studies, 1994 women, RR 1.42, 95% CI 1.01 to 1.99) and excisional technique NOS (Analysis 3.5.4: 2 studies, 434 women, RR 1.76, 95% CI 1.13 to 2.75). Perinatal mortality was greater for treated women overall (Analysis 3.6), and for excisional technique NOS (Analysis 3.6.7: 5 studies, 820,028 women, RR 1.85, 95% CI 1.02 to 3.36), but not for the individual techniques, possibly due to the limited number of studies and the low prevalence of the outcome. Subgroup analysis according to the different comparison groups or cone depths was not possible due to the limited number of studies assessing each outcome based on low‐ or very low‐quality evidence.
Discusión
Resumen de los resultados principales
Los resultados de esta revisión sistemática indican que todos los tipos de técnicas de tratamiento cervical local (escisionales o destructivas) se asocian con un aumento en el riesgo de parto prematuro (PP) y secuelas obstétricas adversas. Esta es la primera revisión sistemática que incluye análisis de subgrupos según la profundidad (y el volumen) del tratamiento, el número de tratamientos y el grupo de comparación utilizado.
El conocimiento de que el tratamiento local para el precáncer cervical, particularmente el tratamiento escisional, aumenta el riesgo de PP ha dado lugar a cambios importantes en la práctica clínica. Con una base de evidencia rápidamente en evolución y las inconsistencias en la bibliografía publicada(Castanon 2012; Conner 2013; Danhof 2015; Jakobsson 2009; Jin 2014; Reilly 2012), debe estar disponible una síntesis de alta calidad de la evidencia para la orientación efectiva de las pacientes en los consultorios de colposcopia y prenatales.
Este metanálisis documenta que cualquier tratamiento cervical local para la enfermedad cervical preinvasiva o invasiva temprana aumenta el riesgo de PP y las secuelas adversas en un embarazo posterior, aunque la repercusión de las escisiones pequeñas, en contraposición con solamente tener la enfermedad, todavía no está clara y es probable que sea pequeña. Se encontró que el tratamiento cervical se asoció con un aumento en el riesgo de prematurez general, grave y extrema, PP espontáneo, amenaza de trabajo de parto prematuro, RPMap, corioamnionitis, bajo peso al nacer, ingreso neonatal y muerte perinatal. La tasa de cerclaje cervical, como era de esperar, aumentó de manera significativa en las pacientes tratadas en contraposición con los controles sin tratar. El tratamiento afectó por igual los resultados de las pacientes nulíparas y multíparas, y los embarazos únicos y múltiples. El análisis indicó que el tratamiento local no tuvo repercusión sobre la forma del parto, la duración del trabajo de parto, la tasa de inducción, el uso de analgesia, la tasa de estenosis y la hemorragia.
La magnitud del efecto del tratamiento fue mayor para las técnicas más radicales (es decir, conización con bisturí [CB] > escisión amplia con asa de la zona de transformación [EAAZT] > ablación con láser [AL]) y para la escisión en lugar de la ablación. Las conizaciones múltiples aumentaron cuatro veces el riesgo de PP en comparación con los controles sin tratar. Los análisis de subgrupos demostraron claramente que el riesgo de PP se relaciona directamente con las dimensiones del cono (profundidad y volumen) y se incrementa progresivamente con el aumento en la profundidad del cono ("dosis‐efecto"). Aunque el riesgo aumentó incluso para las escisiones que midieron menos de 10 mm de profundidad, este fue casi dos veces mayor en las escisiones de más de 10 mm, tres veces mayor en las de más de 15 mm a 17 mm y casi cinco veces mayor en las escisiones que excedían los 20 mm de profundidad.
Se ha indicado previamente que la repercusión del tratamiento en el riesgo de PP puede no ser una consecuencia del tratamiento, sino el resultado de otros factores de confusión presentes en las pacientes con enfermedad cervical (Castanon 2012; Kyrgiou 2012; Reilly 2012). Los análisis de subgrupos de la presente revisión que estratificaron el riesgo para el comparador utilizado, documentaron claramente que aunque el riesgo de PP aumenta después del tratamiento, independientemente del grupo de comparación utilizado, la elección del comparador puede sobrestimar o subestimar el efecto del tratamiento. La magnitud del efecto fue mayor cuando se utilizaron controles externos, seguidos del control interno, seguidos de las pacientes que presentaron neoplasia intraepitelial cervical (NIC) pero no fueron tratadas. Los análisis en las pacientes con lesión intraepitelial escamosa de grado alto pero ningún tratamiento solamente incluyeron tres estudios y 3764 participantes; no se pudieron extraer conclusiones firmes de esta comparación. Cuando se evaluó el riesgo de PP según la profundidad del cono en comparación con las pacientes con NIC pero ningún tratamiento, se observó la misma dirección del efecto. Aunque la diferencia en el riesgo de PP con las escisiones pequeñas (10 mm a 12 mm o menos) en contraposición con solamente presentar NIC pero ningún tratamiento no difirió mucho; sin embargo, el número de estudios que evaluó esa comparación fue pequeño y no se pueden establecer conclusiones firmes. También se encontró que las pacientes con NIC tienen un riesgo inicial mayor de prematurez en comparación con la población general.
Compleción y aplicabilidad general de las pruebas
Para algunos de los resultados de interés, sólo se identificó un pequeño número de estudios y un número limitado de participantes. El valor de corte utilizado para las definiciones de prematurez grave y extrema y para diferentes profundidades del cono varió ligeramente entre los estudios; estos se fusionaron en grupos más grandes para el análisis. Se requieren datos de metanálisis de pacientes individuales para describir con mayor precisión el riesgo estratificado de PP para las profundidades individuales del cono. Los datos sobre las dimensiones del cono dependieron de datos retrospectivos de documentación registrados en informes histopatológicos de muestras fijadas con formalina, con limitaciones obvias. Las fórmulas utilizadas para el cálculo del volumen también variaron entre los estudios. Los estudios de investigación futuros deben tener como objetivo relacionar los resultados con mediciones prospectivas precisas de la profundidad y cervicales.
Los estudios incluidos y excluidos demostraron una variedad amplia de criterios de inclusión/exclusión y medidas de resultado que limitaron el agrupamiento estadístico de todos los estudios primarios. Debe haber un acuerdo entre los colposcopistas y los obstetras académicos en medidas de resultado de investigación clínica fundamentales en consonancia con la iniciativa CROWN de las principales revistas de salud reproductiva (http://www.crown‐initiative.org/aims‐and‐scope/). Este acuerdo mejoraría la aplicabilidad de los resultados de los estudios de investigación primaria y secundaria internacionalmente.
Calidad de la evidencia
Este metanálisis incluyó un gran número de estudios (69 cohortes) con tamaño de la muestra y poder estadístico suficientes para explorar varias comparaciones de las técnicas de tratamiento y las profundidades del cono. Se realizaron análisis de los diferentes grupos de comparación utilizados entre los estudios y se hicieron observaciones acerca de su repercusión sobre los resultados.
Sin embargo, los resultados deben interpretarse con cautela. Debido a la naturaleza premaligna de la enfermedad, no fue posible identificar ensayos controlados aleatorios (ECA). Todos los estudios incluidos fueron cohortes, en su gran mayoría retrospectivas. Dichos informes tienen un riesgo conocido de sesgo de recuerdo y un ajuste inadecuado de los factores de confusión conocidos y desconocidos, mientras que algunos de los resultados de interés fueron difíciles de medir de manera objetiva. Muchos de los estudios dependieron de datos recopilados en entrevistas estructuradas y cuestionarios enviados por correo y, en algunos de estos, la tasa de respuesta fue pequeña, lo que también aumenta el riesgo de datos incompletos de resultado (desgaste). En general 13 estudios se consideraron de muy baja calidad debido al sesgo de desgaste o al sesgo de recuerdo o al número pequeño de participantes, pero fue posible aumentar la calidad a moderada de 31 estudios porque fueron poblacionales, tuvieron un gran número de participantes o fueron prospectivos. De todos modos, la calidad de la evidencia sobre la base de la evaluación GRADE fue baja o muy baja para los resultados maternos o fetales evaluados ("Resumen de los hallazgos para la comparación principal") y baja o alta para los análisis con respecto al efecto de la profundidad del cono (Resumen de los hallazgos 2). Aunque el número general de estudios fue grande, para algunos resultados y comparaciones el número de estudios fue pequeño y los análisis no tuvieron tamaños de la muestra suficientes para apoyar conclusiones definitivas.
La metarregresión fue posible para algunos factores de confusión posibles, pero no para todos. Para muchos moderadores, los datos se informaron solamente en una proporción de los estudios incluidos. Cuando estos estudios no se consideraron representativos de toda la población de los estudios, no se realizó metarregresión ya que introduciría sesgo. Los análisis de sensibilidad y de subgrupos según la calidad de los estudios no cambiaron el efecto del metanálisis.
Sesgos potenciales en el proceso de revisión
Esta revisión depende de estudios no aleatorios y, por lo tanto, con alto riesgo de sesgo. Muchos de los estudios incluidos fueron de baja o muy baja calidad.
Se optó por el uso de datos no ajustados para el análisis que se recomendó durante el protocolo y en las etapas iniciales de esta revisión. La guía más reciente recomienda el uso de datos ajustados en contraposición con los no ajustados. Lo anterior se debe a que los datos no ajustados pueden sobrestimar o subestimar el efecto del tratamiento debido a otros factores de confusión. A pesar de las controversias existentes, es posible que el uso de datos ajustados pueda mejorar el control de factores de confusión existentes que pueden afectar la magnitud del efecto en los estudios observacionales. En las actualizaciones futuras de esta revisión se incorporarán datos ajustados para cumplir las recomendaciones más recientes.
No hubo evidencia de sesgo de publicación, excepto para un resultado (PP < 32 a 34 semanas de gestación).
Una de las fortalezas principales de esta revisión sistemática es que proporciona una evaluación completa de la bibliografía actualizada de todos los resultados clínicamente relevantes. Sin embargo, el informe de un gran número de resultados aumenta las probabilidades de error estadístico tipo 1 (se encontrará que los resultados son estadísticamente significativos solo por casualidad; el rechazo incorrecto de una hipótesis nula verdadera).
Acuerdos y desacuerdos con otros estudios o revisiones
El conocimiento de que el tratamiento local para el cáncer de cuello de útero, en particular el escisional, aumenta el riesgo de PP ha dado lugar a cambios importantes en la práctica clínica. Con el aumento en la base de evidencia que indica que este riesgo es mayor con las técnicas más radicales, ha habido una tendencia a utilizar tratamientos menos agresivos. Aunque previamente se pensó que las diferentes técnicas tenían una eficacia equivalente (Martin‐Hirsch 2013), la evidencia de un estudio poblacional suscitó inquietudes de que un tratamiento menos radical puede aumentar el riesgo de invasión después del tratamiento (Arbyn 2014; Strander 2014). Aunque la disminución del número de histerectomías puede explicar este aumento, el cambio a métodos menos conservadores es otra explicación convincente. Además, aunque la primera documentación del riesgo reproductivo asociado con el tratamiento tiene casi una década (Kyrgiou 2006), los estudios observacionales posteriores e incluso los metanálisis establecieron conclusiones contradictorias (Arbyn 2008; Bruinsma 2011; Conner 2014; Danhof 2015; Jin 2014; Kyrgiou 2014) e iniciaron los debates dentro de la comunidad científica. Debido a que algunos autores plantean inquietudes con respecto a que la reducción progresiva en la radicalidad del tratamiento ha dado lugar a un aumento en el riesgo de una invasión futura (Arbyn 2014; Strander 2014) y a que otros recomiendan el cambio a técnicas menos radicales como la ablación con láser (AL) para la prevención de la morbilidad y la mortalidad perinatales futuras asociadas con el tratamiento (Paraskevaidis 2007), un resumen de alta calidad de la evidencia se ha convertido en una necesidad urgente no satisfecha. Algunos de los metanálisis pequeños anteriores presentaron deficiencias metodológicas y se intentó el análisis de técnicas de tratamiento individuales o subgrupos que redujera al mínimo la validez de los hallazgos de esta revisión en contexto con el resto de la bibliografía (Conner 2014; Danhof 2015; Jin 2014). Los metanálisis publicados no lograron analizar los datos según los principales factores de confusión y de estratificación del riesgo, el grupo de comparación y la profundidad de la escisión. Aunque Bruinsma y colegas abordaron por primera vez el grupo de comparación como un posible factor de confusión, los datos sobre la profundidad y las dimensiones del tratamiento no estaban disponibles (Bruinsma 2011).
El parto prematuro es una causa importante de muerte neonatal y discapacidad y representa un costo enorme para los servicios sanitarios y la sociedad. Durante el embarazo, estas pacientes constituyen una gran parte de las remisiones a consultorios antes del término. Estas referencias han aumentado de casi ninguna en 1999, a más del 40% en 2012 (Kindinger 2016). La monitorización por ecografía requiere mucha mano de obra, es costosa y se puede asociar con ansiedad materna, más aún porque el 85% de las pacientes a las que se les ha realizado escisión en efecto son de bajo riesgo y tendrán un parto a término (Bruinsma 2011; Kyrgiou 2006).
Con la acumulación rápida de evidencia que relaciona el tratamiento cervical con morbilidad reproductiva adversa, se requiere la cuantificación de la morbilidad obstétrica comparativa de diferentes técnicas de tratamiento y profundidades del cono para ayudar en la toma de decisiones y en el asesoramiento a los médicos. Los resultados de este metanálisis permitirán a los médicos, a las pacientes y a los elaboradores de políticas equilibrar el aumento absoluto de la morbilidad reproductiva con el aumento de la radicalidad del tratamiento. A las pacientes se les debe informar que el tratamiento aumenta el riesgo de PP, en contraposición con solamente tener NIC, pero el aumento absoluto del riesgo en escisiones pequeñas tipo 1 tiene la probabilidad de ser bajo, de haber alguno.
Además, el riesgo individual cuantificado estratificado por el tratamiento y la profundidad del cono permitiría a los obstetras la selección de las pacientes consideradas con alto riesgo de PP que se beneficiarían de la monitorización prenatal intensiva y reduciría al mínimo las intervenciones innecesarias en las pacientes con bajo riesgo. El tratamiento prenatal de las pacientes después del tratamiento no ha sido consistente y ha dependido en gran parte de la institución o del médico (Buller 1982). Los efectos beneficiosos y perjudiciales asociados con diversas intervenciones en las embarazadas con antecedentes de tratamiento cervical no se han evaluado completamente en estudios con diseño adecuado (Kindinger 2016). Los estudios de investigación futuros deben evaluar el valor en este grupo clínico diferenciado y concebir una estrategia de prevención lógica.
'Risk of bias' graph: review authors' judgements about each risk of bias item presented as percentages across all included studies.
'Risk of bias' summary: review authors' judgements about each risk of bias item for each included study.
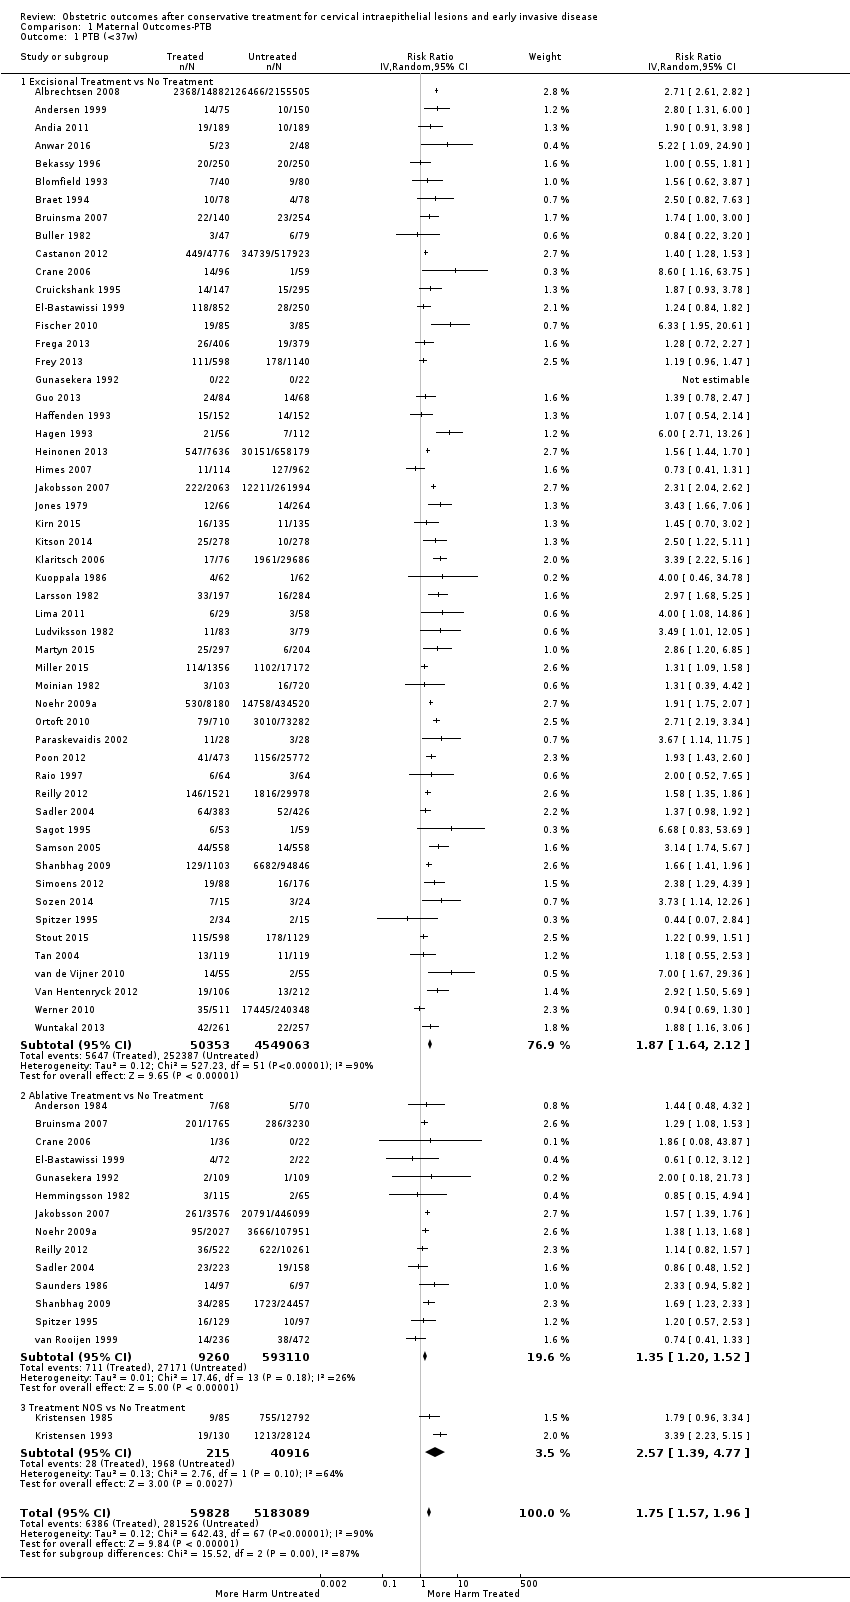
Comparison 1 Maternal Outcomes‐PTB, Outcome 1 PTB (<37w).

Comparison 1 Maternal Outcomes‐PTB, Outcome 2 PTB (<37w)‐Analysis by treatment modality.
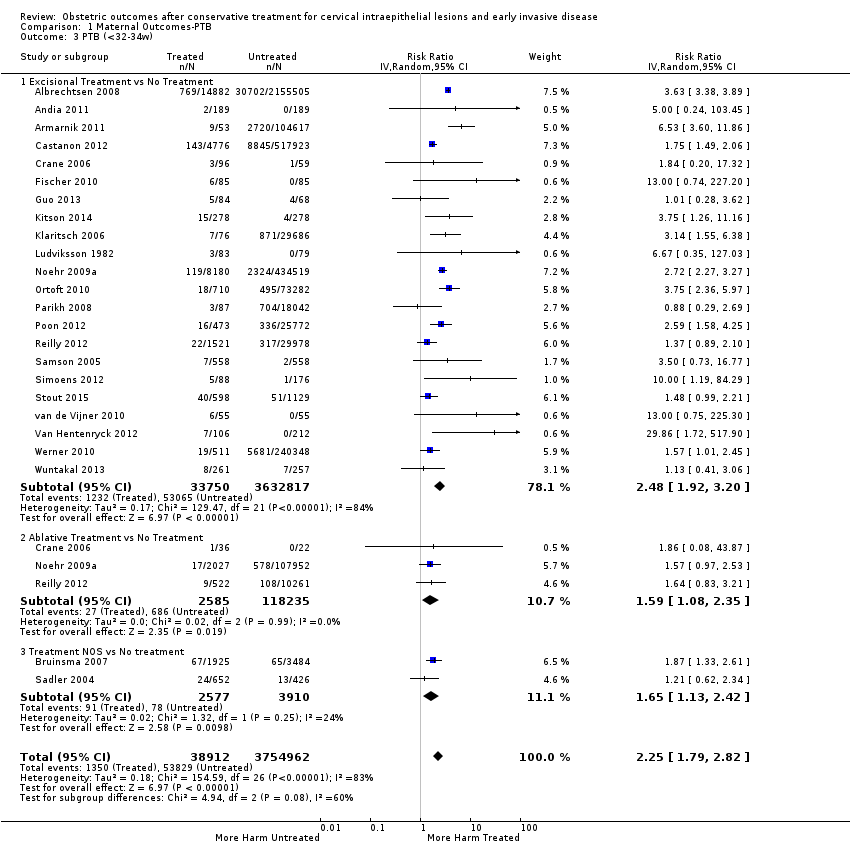
Comparison 1 Maternal Outcomes‐PTB, Outcome 3 PTB (<32‐34w).

Comparison 1 Maternal Outcomes‐PTB, Outcome 4 PTB (<32‐34w)‐Analysis by treatment modality.
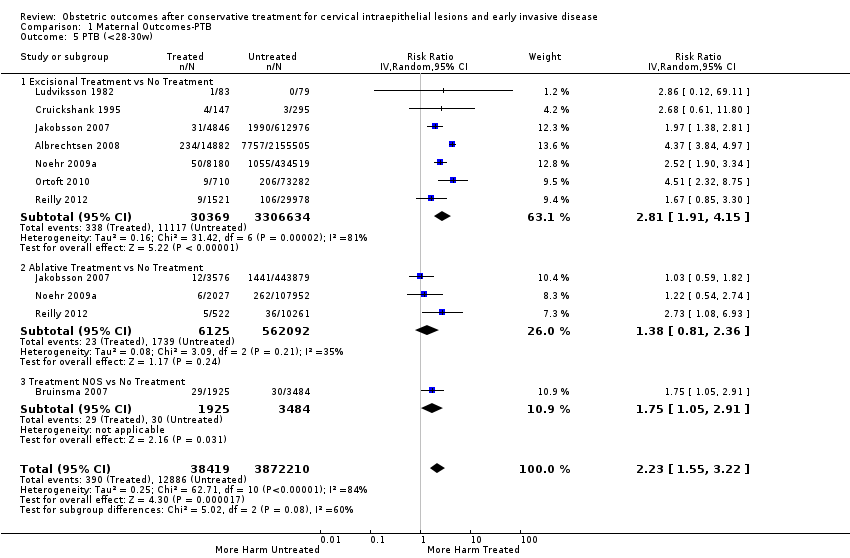
Comparison 1 Maternal Outcomes‐PTB, Outcome 5 PTB (<28‐30w).
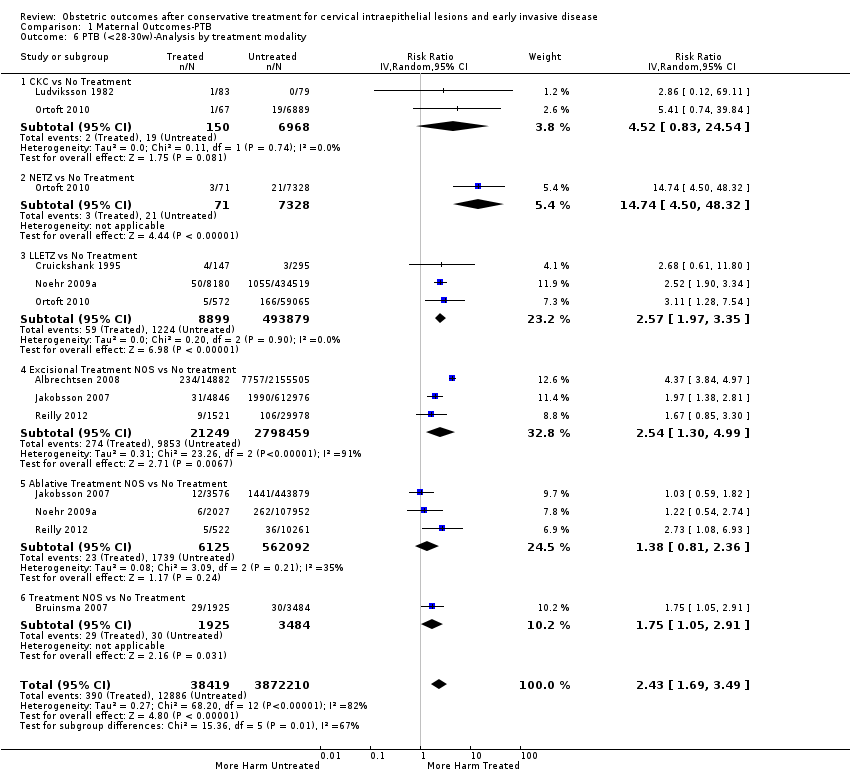
Comparison 1 Maternal Outcomes‐PTB, Outcome 6 PTB (<28‐30w)‐Analysis by treatment modality.
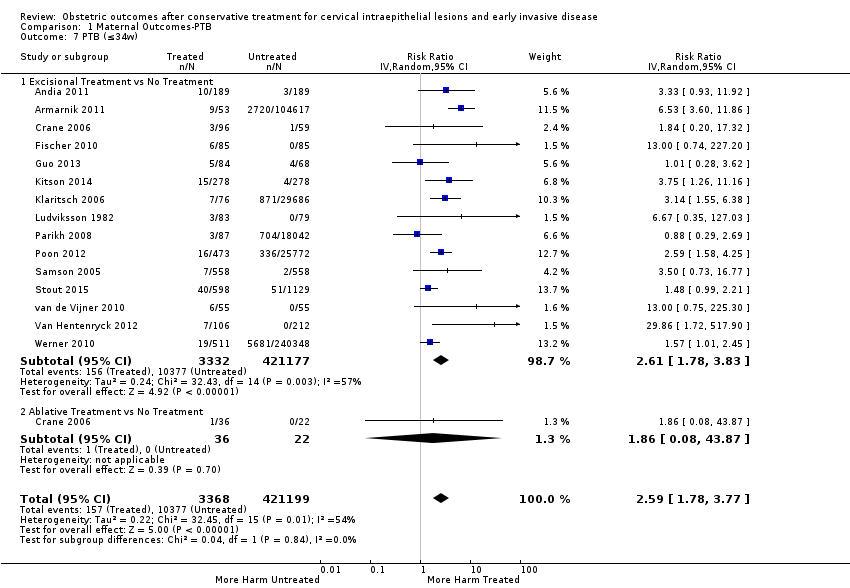
Comparison 1 Maternal Outcomes‐PTB, Outcome 7 PTB (≤34w).

Comparison 1 Maternal Outcomes‐PTB, Outcome 8 PTB (≤34w)‐Analysis by treatment modality.
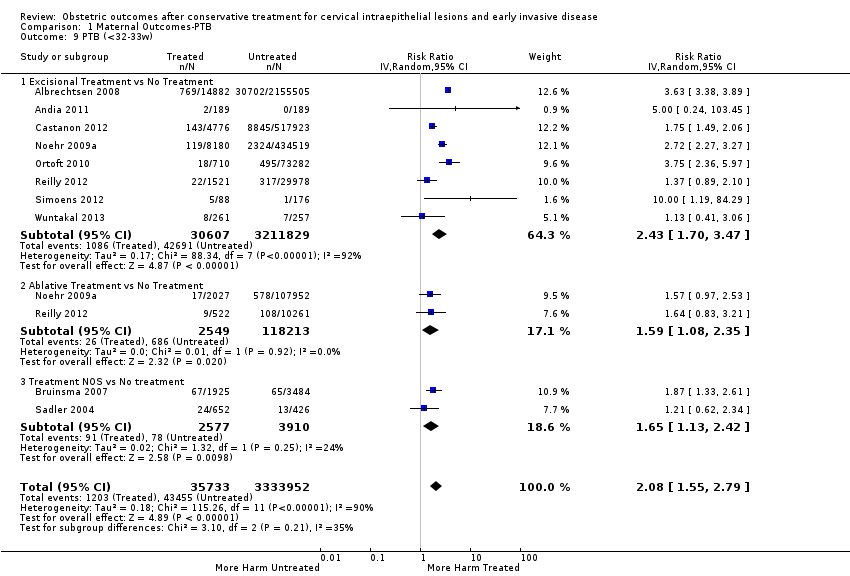
Comparison 1 Maternal Outcomes‐PTB, Outcome 9 PTB (<32‐33w).

Comparison 1 Maternal Outcomes‐PTB, Outcome 10 PTB (<32‐33w)‐Analysis by treatment modality.
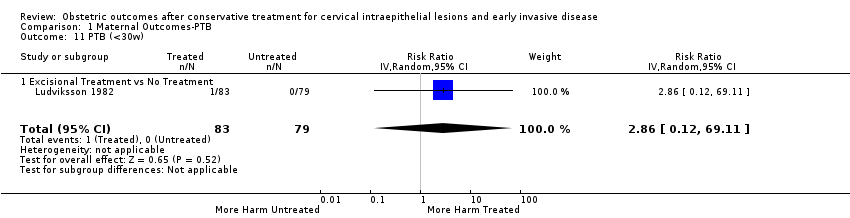
Comparison 1 Maternal Outcomes‐PTB, Outcome 11 PTB (<30w).

Comparison 1 Maternal Outcomes‐PTB, Outcome 12 PTB (<30w)‐Analysis by treatment modality.
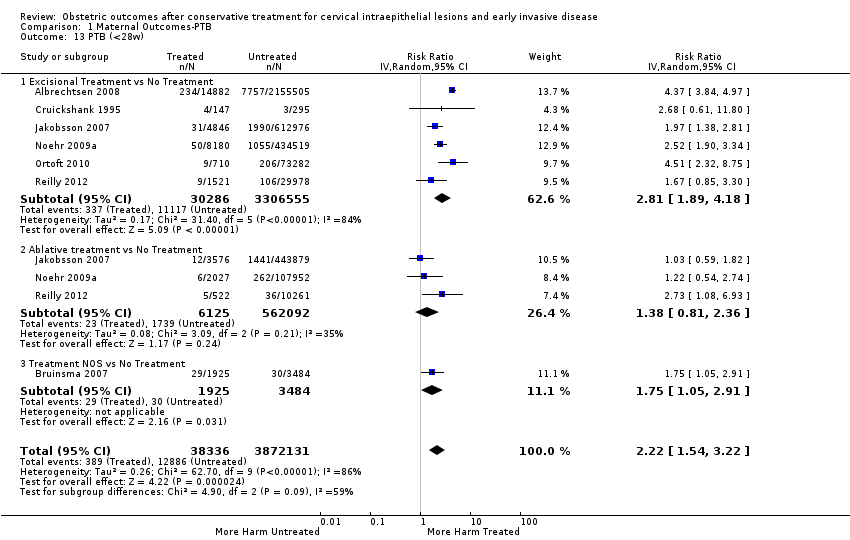
Comparison 1 Maternal Outcomes‐PTB, Outcome 13 PTB (<28w).
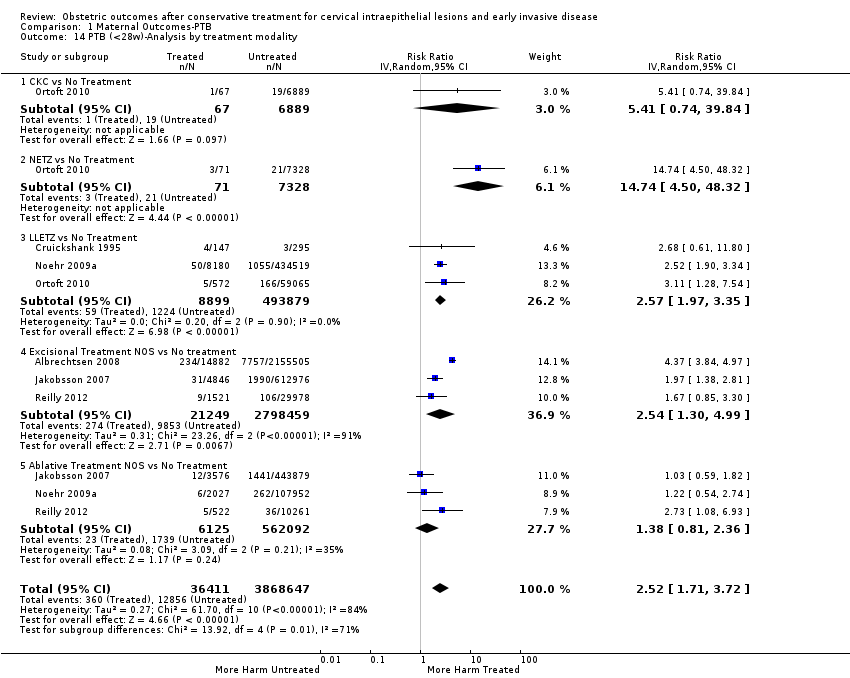
Comparison 1 Maternal Outcomes‐PTB, Outcome 14 PTB (<28w)‐Analysis by treatment modality.
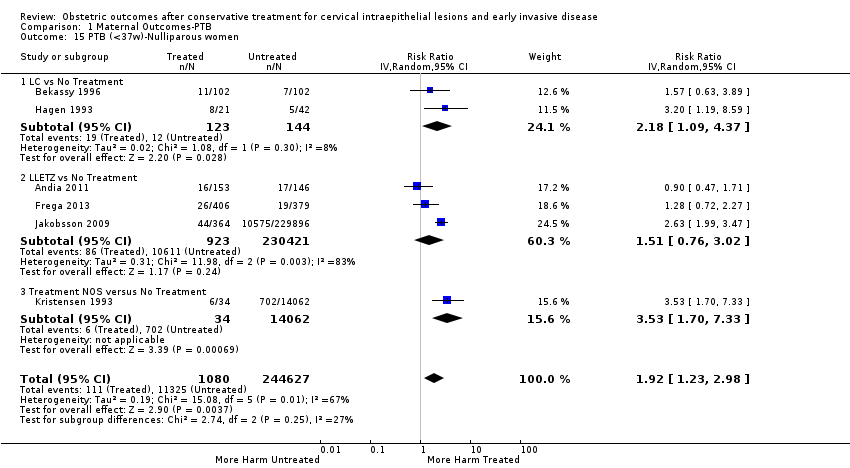
Comparison 1 Maternal Outcomes‐PTB, Outcome 15 PTB (<37w)‐Nulliparous women.

Comparison 1 Maternal Outcomes‐PTB, Outcome 16 PTB (<37w)‐Parous women.

Comparison 1 Maternal Outcomes‐PTB, Outcome 17 PTB (<37w)‐Single cone.

Comparison 1 Maternal Outcomes‐PTB, Outcome 18 PTB (<37w)‐Repeat cones.

Comparison 1 Maternal Outcomes‐PTB, Outcome 19 PTB (<37w)‐Singleton pregnancies.
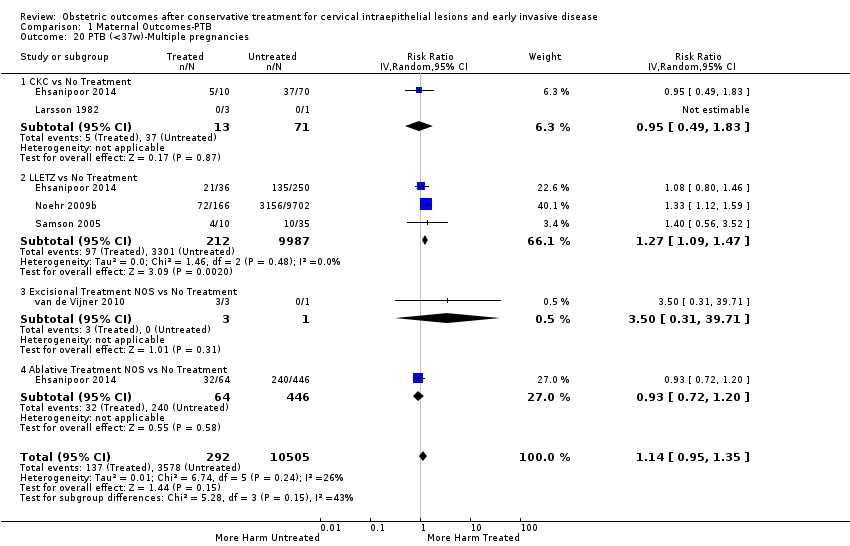
Comparison 1 Maternal Outcomes‐PTB, Outcome 20 PTB (<37w)‐Multiple pregnancies.

Comparison 1 Maternal Outcomes‐PTB, Outcome 21 PTB (<32‐34w)‐Multiple pregnancies.
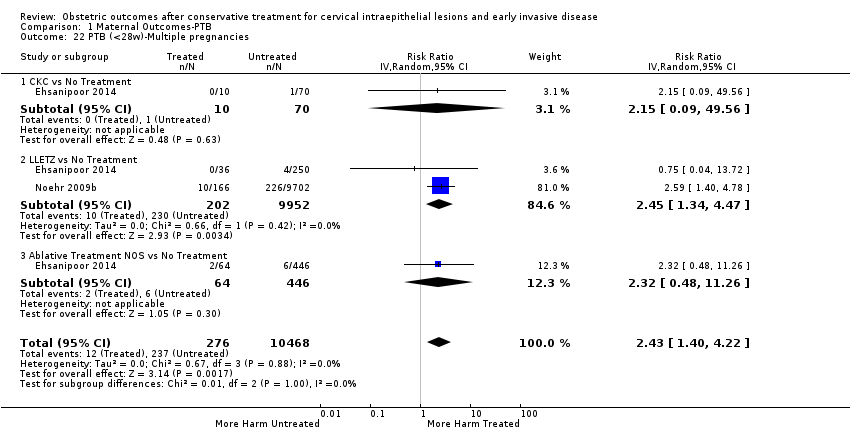
Comparison 1 Maternal Outcomes‐PTB, Outcome 22 PTB (<28w)‐Multiple pregnancies.

Comparison 1 Maternal Outcomes‐PTB, Outcome 23 PTB (<37w)‐Depth≤10‐12mm.

Comparison 1 Maternal Outcomes‐PTB, Outcome 24 PTB (<37w)‐Depth≥10‐12mm.

Comparison 1 Maternal Outcomes‐PTB, Outcome 25 PTB (<37w)‐Depth≥15‐17mm.

Comparison 1 Maternal Outcomes‐PTB, Outcome 26 PTB (<37w)‐Depth≥20mm.
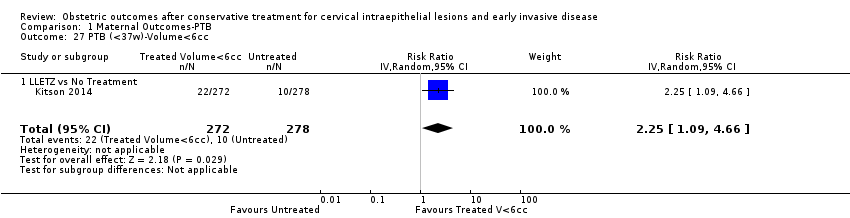
Comparison 1 Maternal Outcomes‐PTB, Outcome 27 PTB (<37w)‐Volume<6cc.
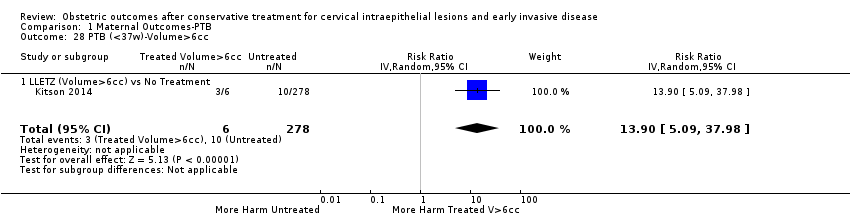
Comparison 1 Maternal Outcomes‐PTB, Outcome 28 PTB (<37w)‐Volume>6cc.
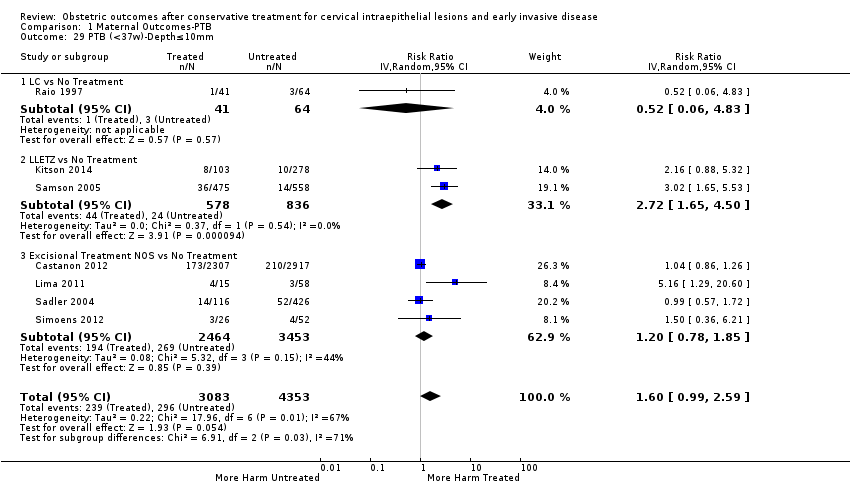
Comparison 1 Maternal Outcomes‐PTB, Outcome 29 PTB (<37w)‐Depth≤10mm.
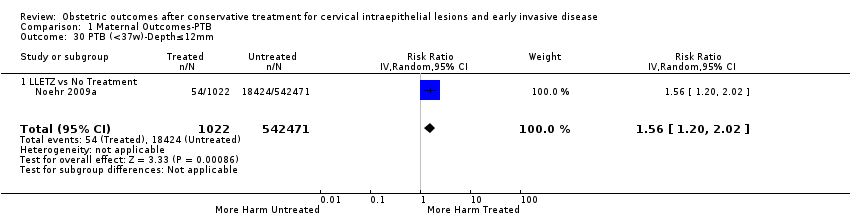
Comparison 1 Maternal Outcomes‐PTB, Outcome 30 PTB (<37w)‐Depth≤12mm.
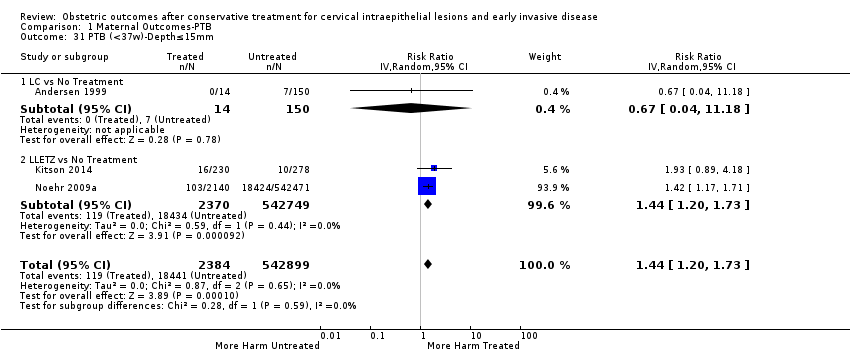
Comparison 1 Maternal Outcomes‐PTB, Outcome 31 PTB (<37w)‐Depth≤15mm.

Comparison 1 Maternal Outcomes‐PTB, Outcome 32 PTB (<37w)‐Depth≤17mm.

Comparison 1 Maternal Outcomes‐PTB, Outcome 33 PTB (<37w)‐Depth≤15‐17mm.
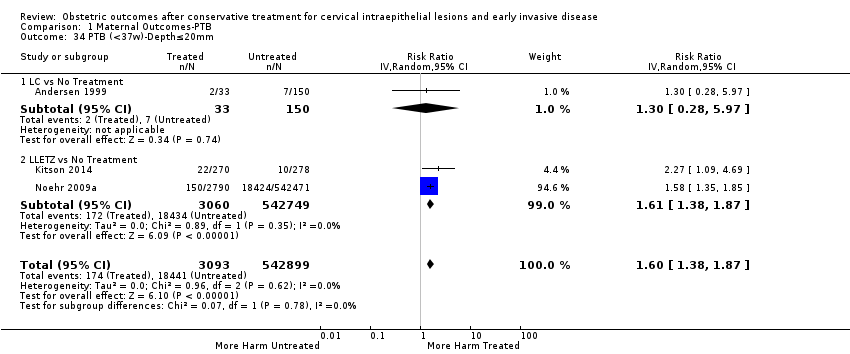
Comparison 1 Maternal Outcomes‐PTB, Outcome 34 PTB (<37w)‐Depth≤20mm.

Comparison 1 Maternal Outcomes‐PTB, Outcome 35 PTB (<37w)‐Depth≥10mm.
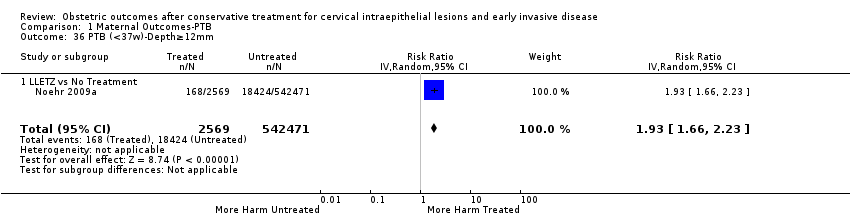
Comparison 1 Maternal Outcomes‐PTB, Outcome 36 PTB (<37w)‐Depth≥12mm.
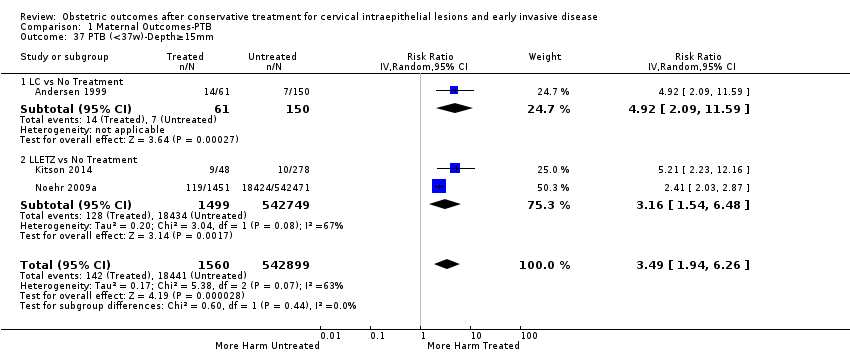
Comparison 1 Maternal Outcomes‐PTB, Outcome 37 PTB (<37w)‐Depth≥15mm.

Comparison 1 Maternal Outcomes‐PTB, Outcome 38 PTB (<37w)‐Depth≥17mm.
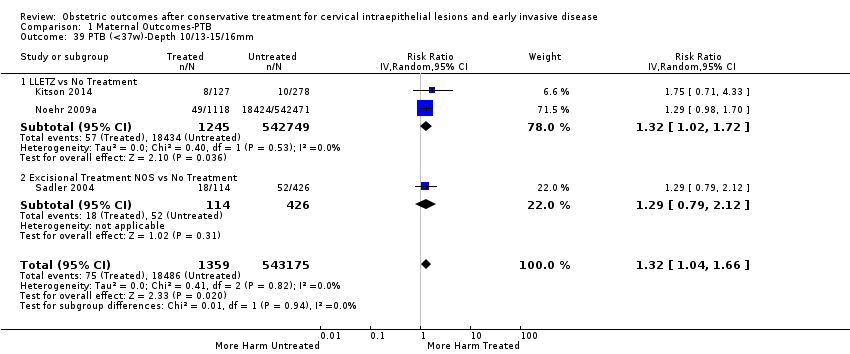
Comparison 1 Maternal Outcomes‐PTB, Outcome 39 PTB (<37w)‐Depth 10/13‐15/16mm.
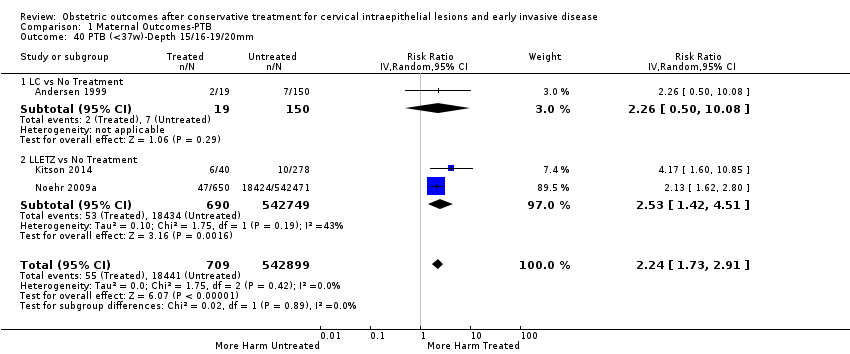
Comparison 1 Maternal Outcomes‐PTB, Outcome 40 PTB (<37w)‐Depth 15/16‐19/20mm.

Comparison 1 Maternal Outcomes‐PTB, Outcome 41 PTB (<37w)‐Volume<3cc.
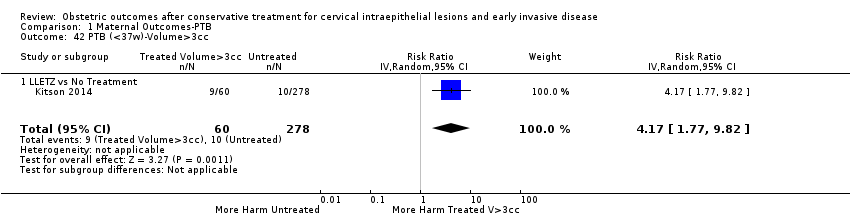
Comparison 1 Maternal Outcomes‐PTB, Outcome 42 PTB (<37w)‐Volume>3cc.

Comparison 1 Maternal Outcomes‐PTB, Outcome 43 PTB (<37w)‐Depth≥10‐12mm vs ≤10‐12mm.
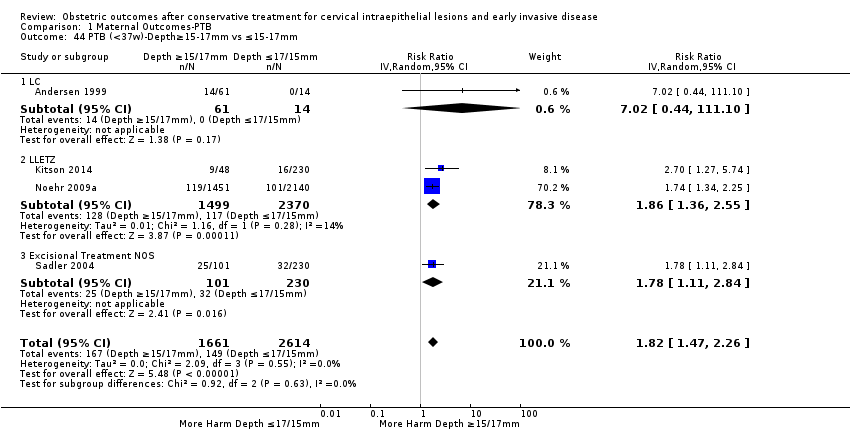
Comparison 1 Maternal Outcomes‐PTB, Outcome 44 PTB (<37w)‐Depth≥15‐17mm vs ≤15‐17mm.

Comparison 1 Maternal Outcomes‐PTB, Outcome 45 PTB (<37w)‐Depth≥20mm vs ≤20mm.

Comparison 1 Maternal Outcomes‐PTB, Outcome 46 PTB (<37w)‐Volume>3cc vs <3cc.
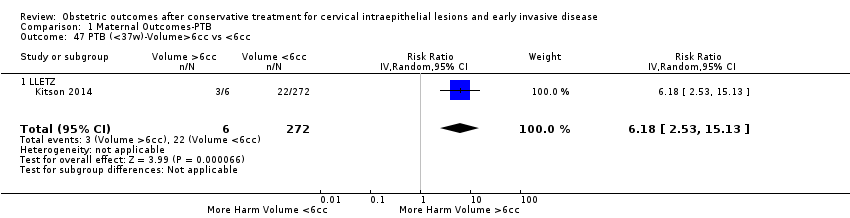
Comparison 1 Maternal Outcomes‐PTB, Outcome 47 PTB (<37w)‐Volume>6cc vs <6cc.

Comparison 1 Maternal Outcomes‐PTB, Outcome 48 PTB (<37w)‐Depth 11/13‐15/16mm vs ≤10‐12mm.

Comparison 1 Maternal Outcomes‐PTB, Outcome 49 PTB (<37w)‐Depth 16‐19mm vs 13‐15mm.
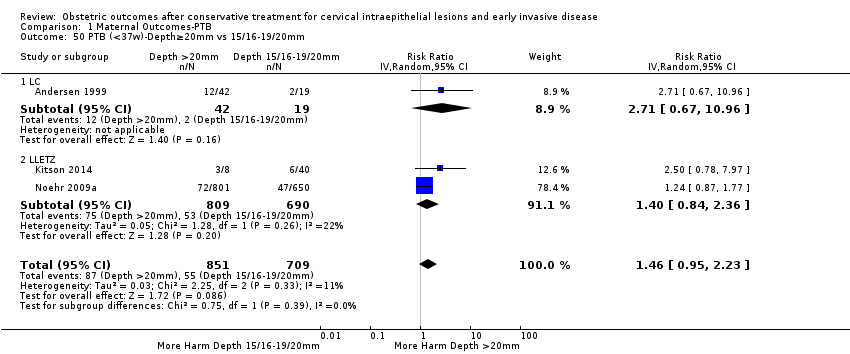
Comparison 1 Maternal Outcomes‐PTB, Outcome 50 PTB (<37w)‐Depth≥20mm vs 15/16‐19/20mm.

Comparison 1 Maternal Outcomes‐PTB, Outcome 51 PTB (<37w)‐Untreated External Comparison Group.

Comparison 1 Maternal Outcomes‐PTB, Outcome 52 PTB (<37w)‐Untreated Internal Comparison Group (self‐matching).
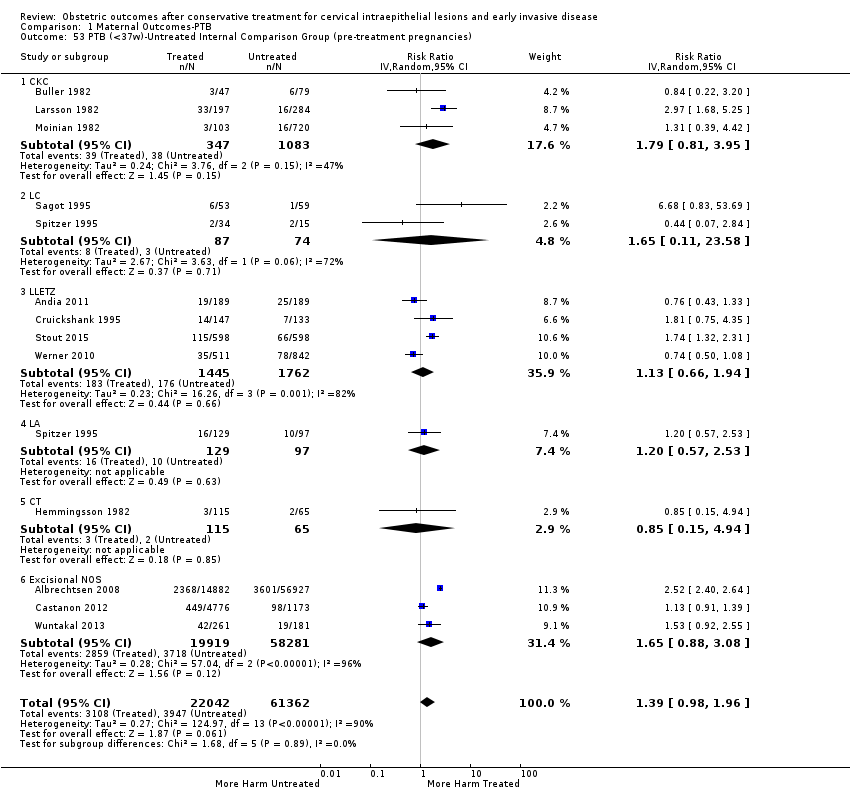
Comparison 1 Maternal Outcomes‐PTB, Outcome 53 PTB (<37w)‐Untreated Internal Comparison Group (pre‐treatment pregnancies).

Comparison 1 Maternal Outcomes‐PTB, Outcome 54 PTB (<37w)‐Untreated Colposcopy+/‐CIN+/‐Biopsy Comparison Group.

Comparison 1 Maternal Outcomes‐PTB, Outcome 55 PTB (<37w)‐Untreated HSIL Comparison Group.

Comparison 1 Maternal Outcomes‐PTB, Outcome 56 PTB (<37w)‐All Comparison Groups.

Comparison 1 Maternal Outcomes‐PTB, Outcome 57 PTB (<37w)‐Untreated High‐risk Population vs General Population.
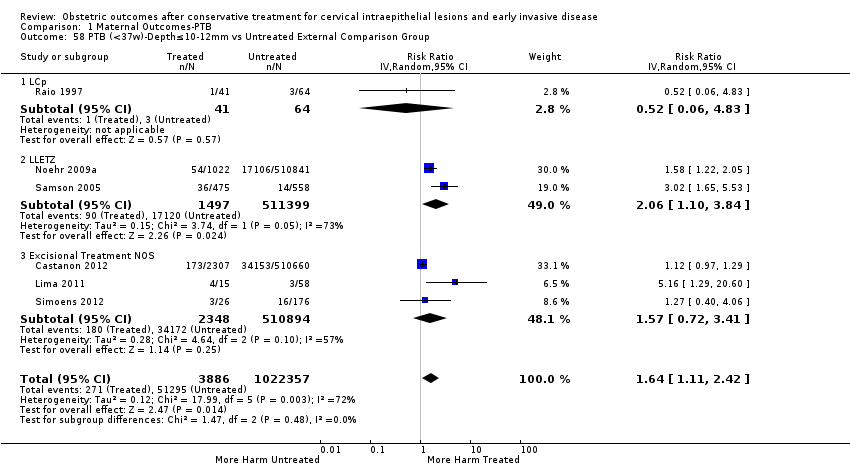
Comparison 1 Maternal Outcomes‐PTB, Outcome 58 PTB (<37w)‐Depth≤10‐12mm vs Untreated External Comparison Group.

Comparison 1 Maternal Outcomes‐PTB, Outcome 59 PTB (<37w)‐Depth≤10‐12mm vs Untreated Internal Comparison Group.
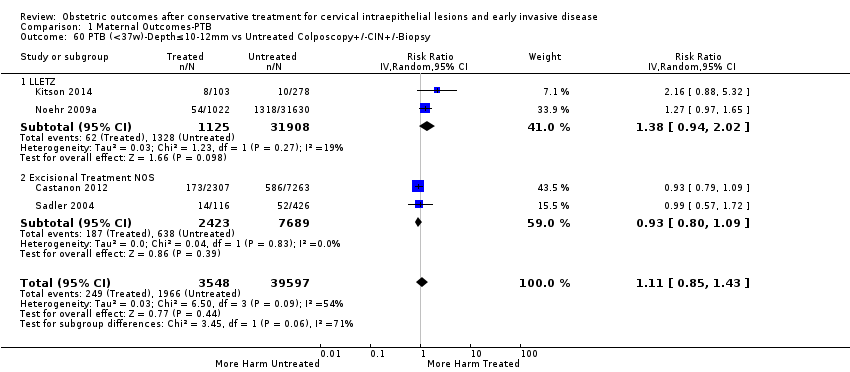
Comparison 1 Maternal Outcomes‐PTB, Outcome 60 PTB (<37w)‐Depth≤10‐12mm vs Untreated Colposcopy+/‐CIN+/‐Biopsy.

Comparison 1 Maternal Outcomes‐PTB, Outcome 61 PTB (<37w)‐Depth≤15‐17mm vs Untreated External Comparison Group.
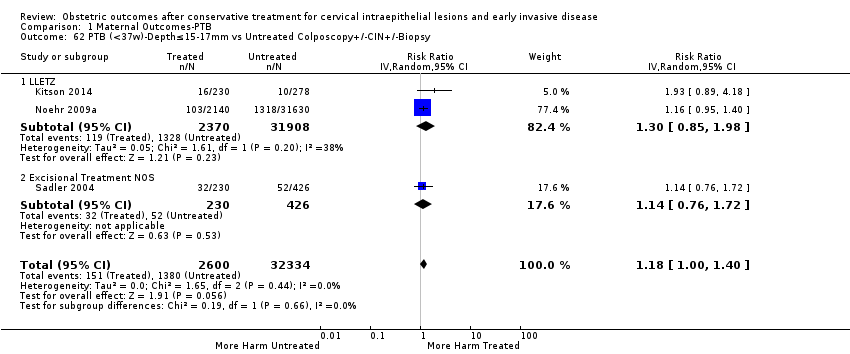
Comparison 1 Maternal Outcomes‐PTB, Outcome 62 PTB (<37w)‐Depth≤15‐17mm vs Untreated Colposcopy+/‐CIN+/‐Biopsy.
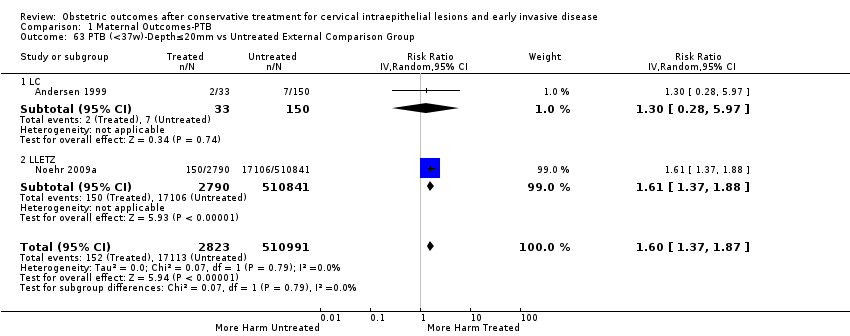
Comparison 1 Maternal Outcomes‐PTB, Outcome 63 PTB (<37w)‐Depth≤20mm vs Untreated External Comparison Group.

Comparison 1 Maternal Outcomes‐PTB, Outcome 64 PTB (<37w)‐Depth≤20mm vs Untreated Colposcopy+/‐CIN+/‐Biopsy.
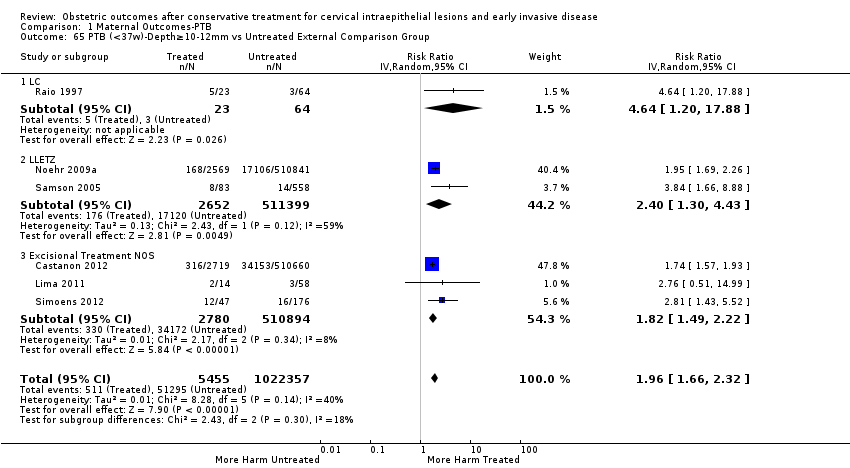
Comparison 1 Maternal Outcomes‐PTB, Outcome 65 PTB (<37w)‐Depth≥10‐12mm vs Untreated External Comparison Group.
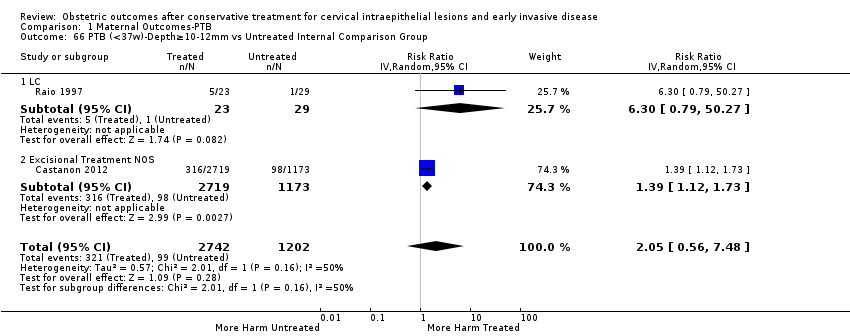
Comparison 1 Maternal Outcomes‐PTB, Outcome 66 PTB (<37w)‐Depth≥10‐12mm vs Untreated Internal Comparison Group.
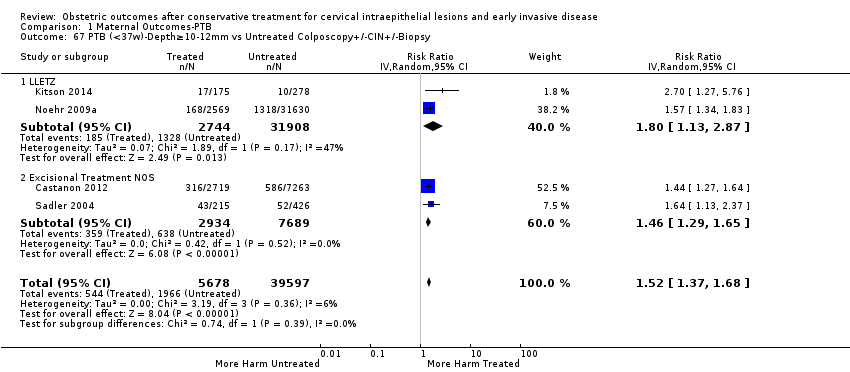
Comparison 1 Maternal Outcomes‐PTB, Outcome 67 PTB (<37w)‐Depth≥10‐12mm vs Untreated Colposcopy+/‐CIN+/‐Biopsy.

Comparison 1 Maternal Outcomes‐PTB, Outcome 68 PTB (<37w)‐Depth≥15‐17mm vs Untreated External Comparison Group.

Comparison 1 Maternal Outcomes‐PTB, Outcome 69 PTB (<37w)‐Depth≥15‐17mm vs Untreated Colposcopy+/‐CIN+/‐Biopsy.

Comparison 1 Maternal Outcomes‐PTB, Outcome 70 PTB (<37w)‐Depth≥20mm vs Untreated External Comparison Group.

Comparison 1 Maternal Outcomes‐PTB, Outcome 71 PTB (<37w)‐Depth≥20mm vs Untreated Colposcopy+/‐CIN+/‐Biopsy.
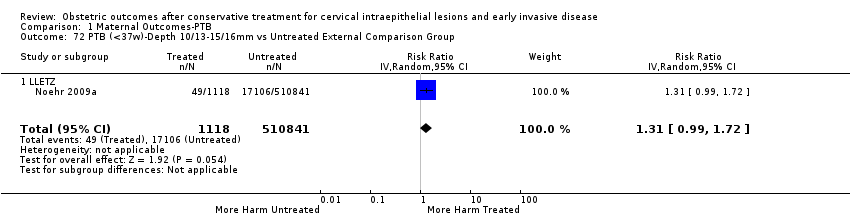
Comparison 1 Maternal Outcomes‐PTB, Outcome 72 PTB (<37w)‐Depth 10/13‐15/16mm vs Untreated External Comparison Group.
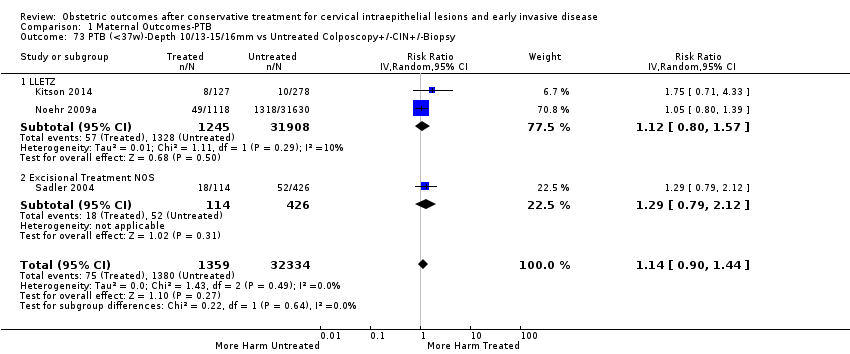
Comparison 1 Maternal Outcomes‐PTB, Outcome 73 PTB (<37w)‐Depth 10/13‐15/16mm vs Untreated Colposcopy+/‐CIN+/‐Biopsy.
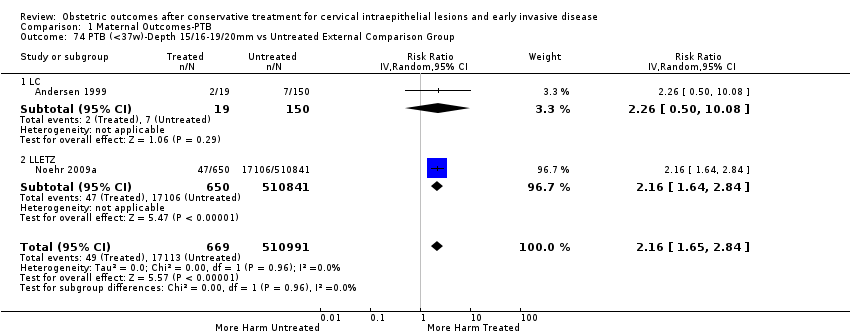
Comparison 1 Maternal Outcomes‐PTB, Outcome 74 PTB (<37w)‐Depth 15/16‐19/20mm vs Untreated External Comparison Group.
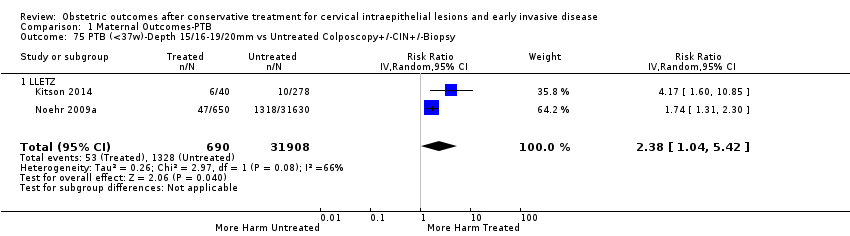
Comparison 1 Maternal Outcomes‐PTB, Outcome 75 PTB (<37w)‐Depth 15/16‐19/20mm vs Untreated Colposcopy+/‐CIN+/‐Biopsy.

Comparison 2 Other maternal Outcomes, Outcome 1 sPTB (<37w).
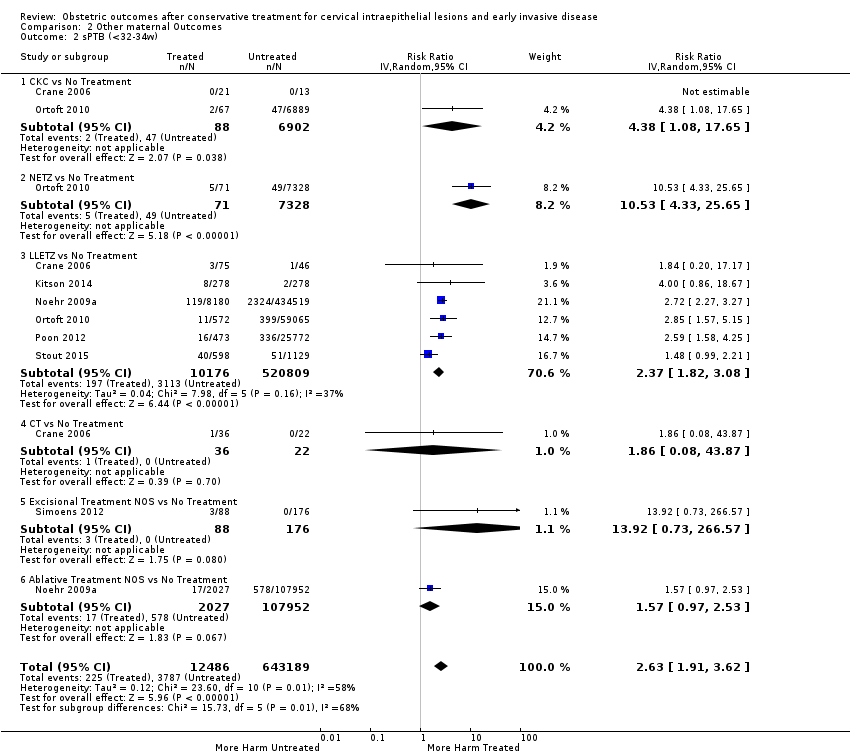
Comparison 2 Other maternal Outcomes, Outcome 2 sPTB (<32‐34w).
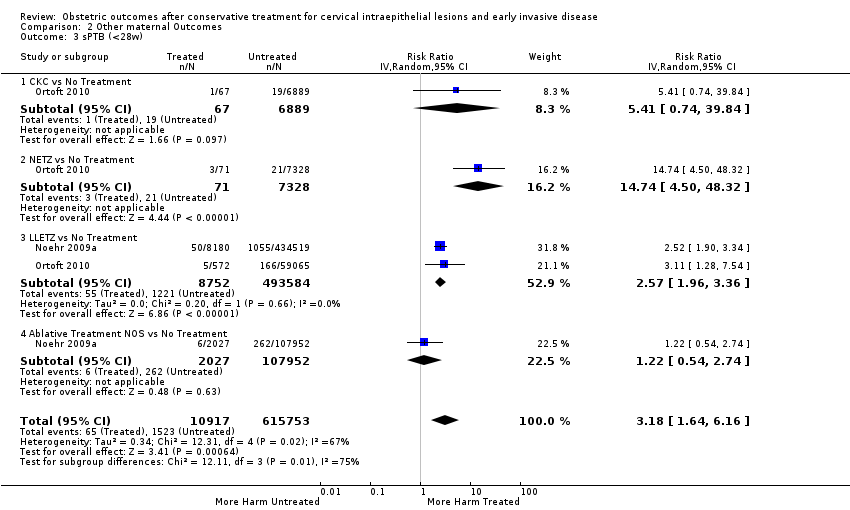
Comparison 2 Other maternal Outcomes, Outcome 3 sPTB (<28w).
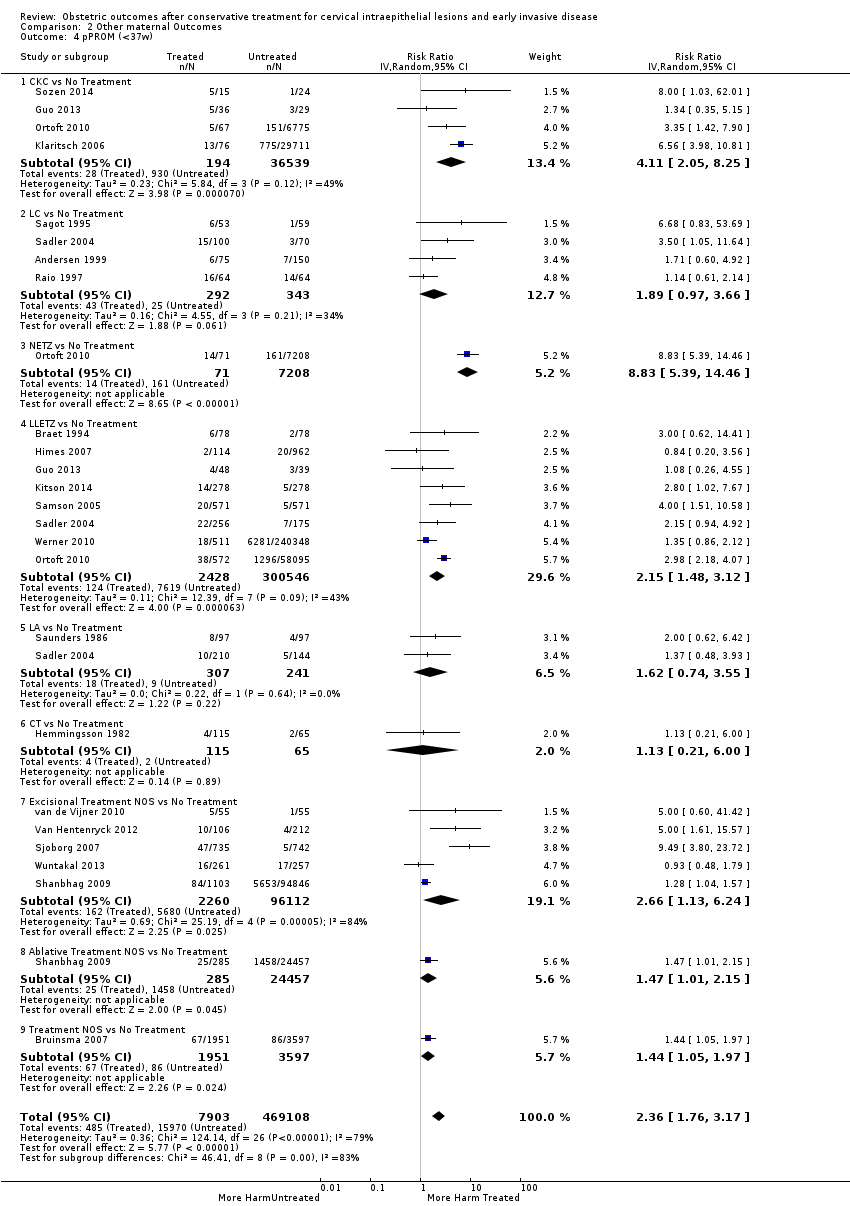
Comparison 2 Other maternal Outcomes, Outcome 4 pPROM (<37w).

Comparison 2 Other maternal Outcomes, Outcome 5 pPROM (<32w).

Comparison 2 Other maternal Outcomes, Outcome 6 pPROM (<28w).
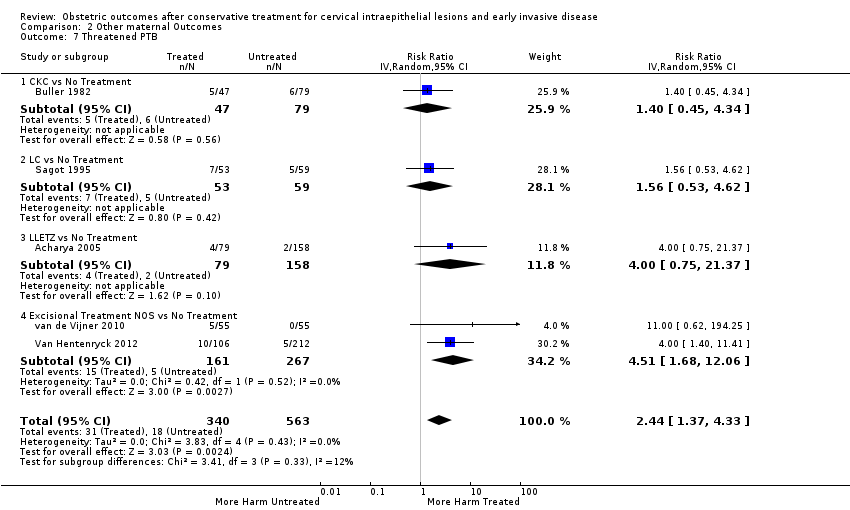
Comparison 2 Other maternal Outcomes, Outcome 7 Threatened PTB.

Comparison 2 Other maternal Outcomes, Outcome 8 Chorioamnionitis.
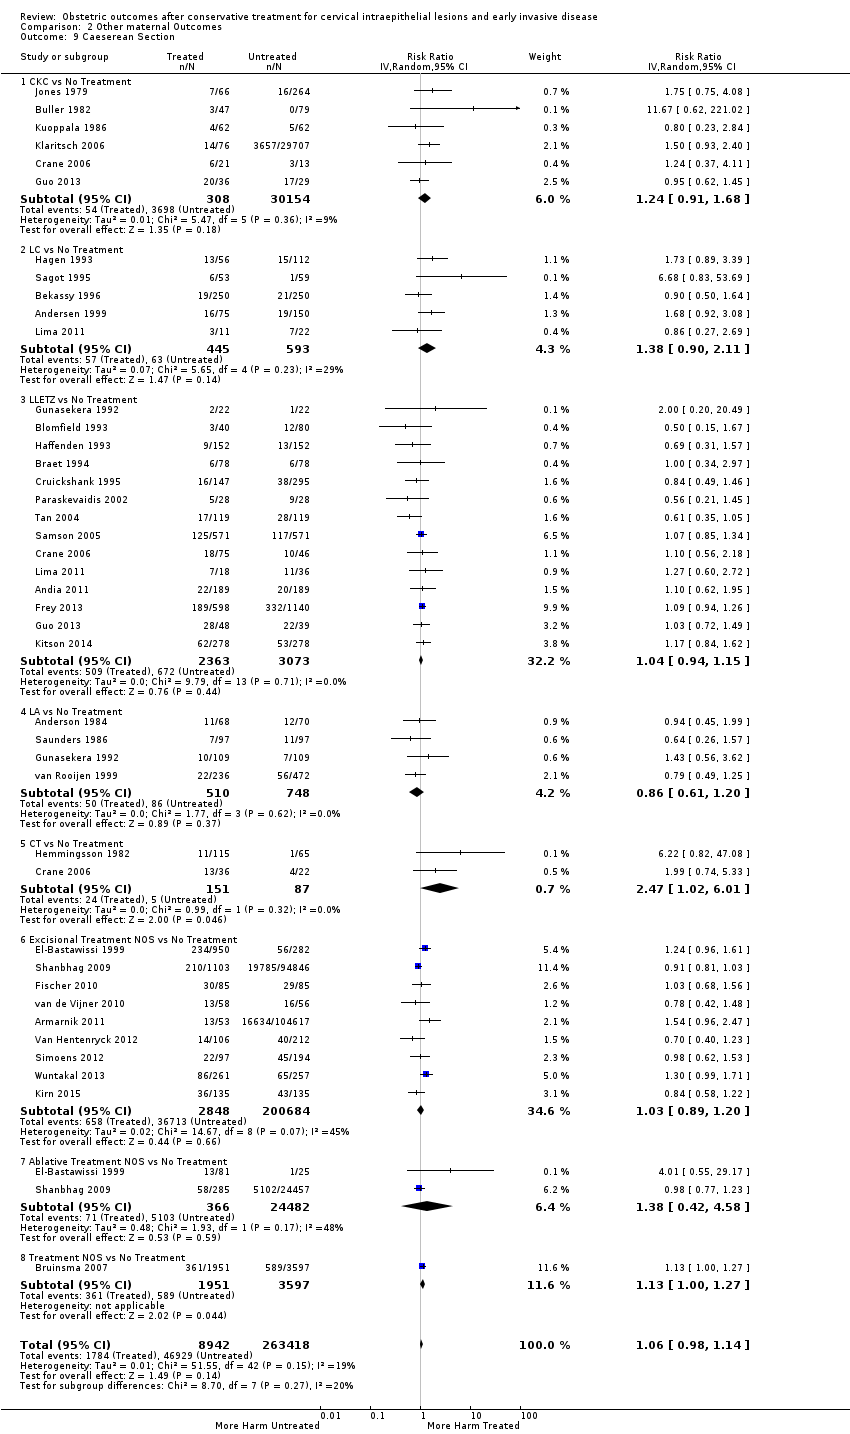
Comparison 2 Other maternal Outcomes, Outcome 9 Caeserean Section.
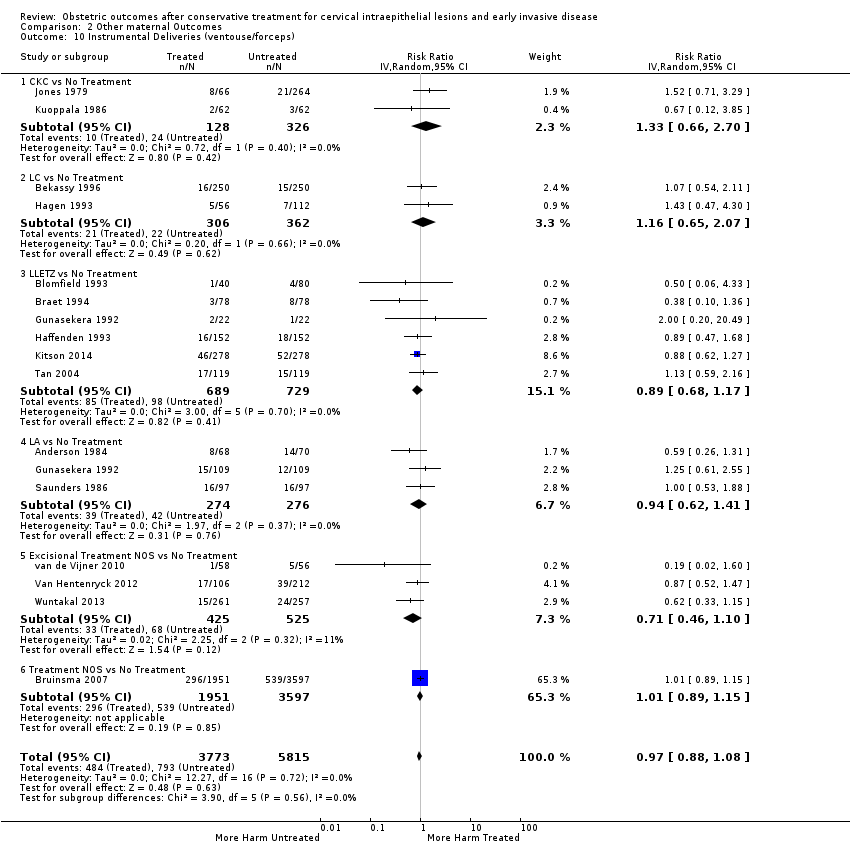
Comparison 2 Other maternal Outcomes, Outcome 10 Instrumental Deliveries (ventouse/forceps).

Comparison 2 Other maternal Outcomes, Outcome 11 Precipitous Labour (<2hours).
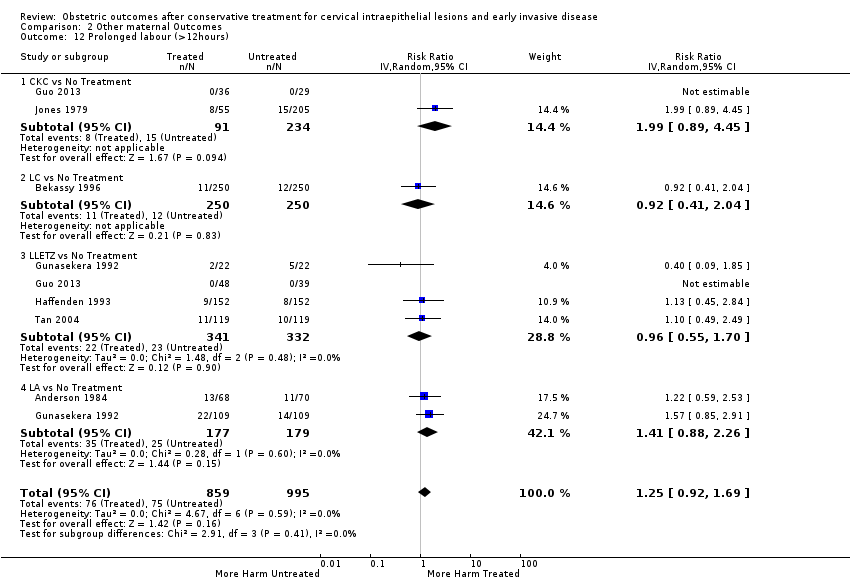
Comparison 2 Other maternal Outcomes, Outcome 12 Prolonged labour (>12hours).
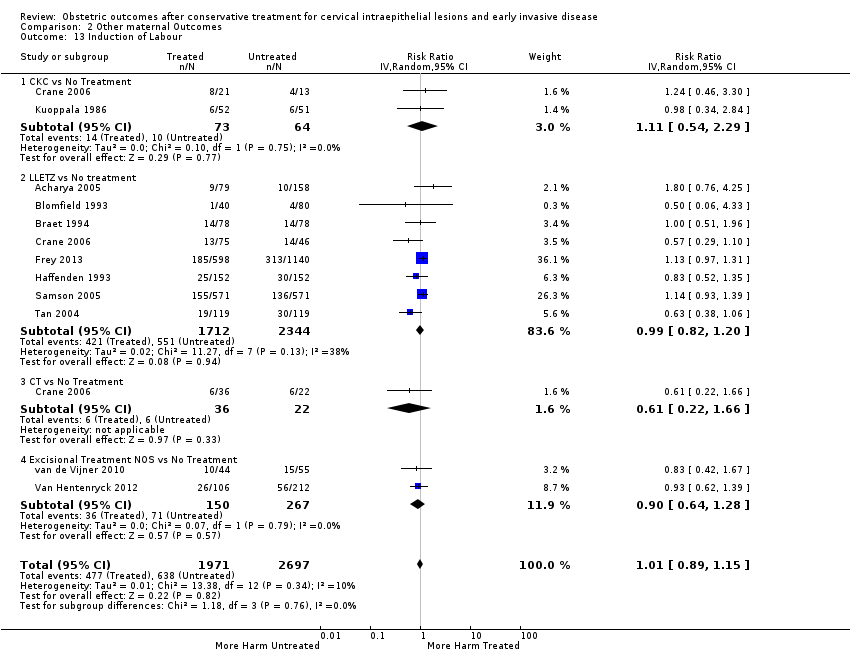
Comparison 2 Other maternal Outcomes, Outcome 13 Induction of Labour.

Comparison 2 Other maternal Outcomes, Outcome 14 Oxytocin Use.

Comparison 2 Other maternal Outcomes, Outcome 15 Epidural Use.

Comparison 2 Other maternal Outcomes, Outcome 16 Pethidine Use.

Comparison 2 Other maternal Outcomes, Outcome 17 Analgesia Use NOS.

Comparison 2 Other maternal Outcomes, Outcome 18 Cervical stenosis.
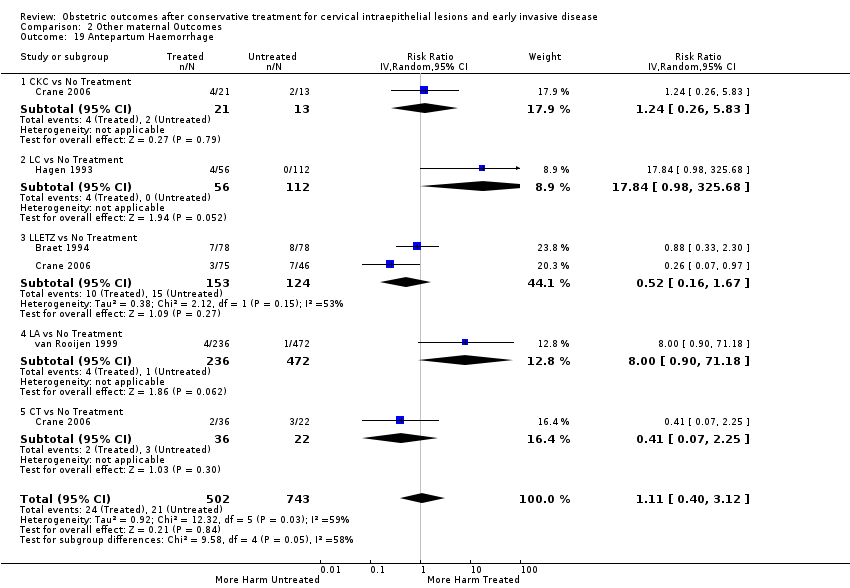
Comparison 2 Other maternal Outcomes, Outcome 19 Antepartum Haemorrhage.

Comparison 2 Other maternal Outcomes, Outcome 20 Postpartum Haemorrhage (>600ml).

Comparison 2 Other maternal Outcomes, Outcome 21 Massive Obstetric Haemorrhage (>1000ml).

Comparison 2 Other maternal Outcomes, Outcome 22 Cervical cerclage.

Comparison 3 Neonatal Outcomes, Outcome 1 LBW (<2500g).
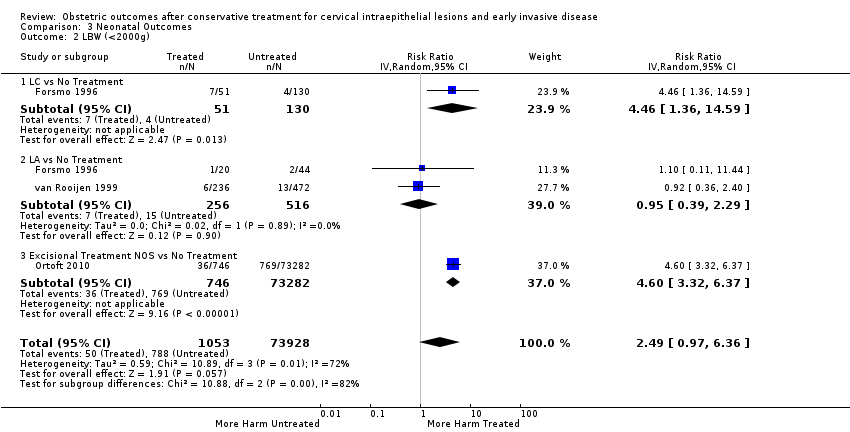
Comparison 3 Neonatal Outcomes, Outcome 2 LBW (<2000g).

Comparison 3 Neonatal Outcomes, Outcome 3 LBW (<1500g).
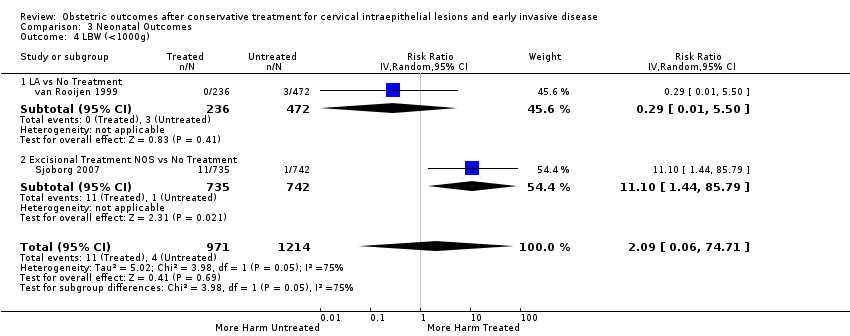
Comparison 3 Neonatal Outcomes, Outcome 4 LBW (<1000g).
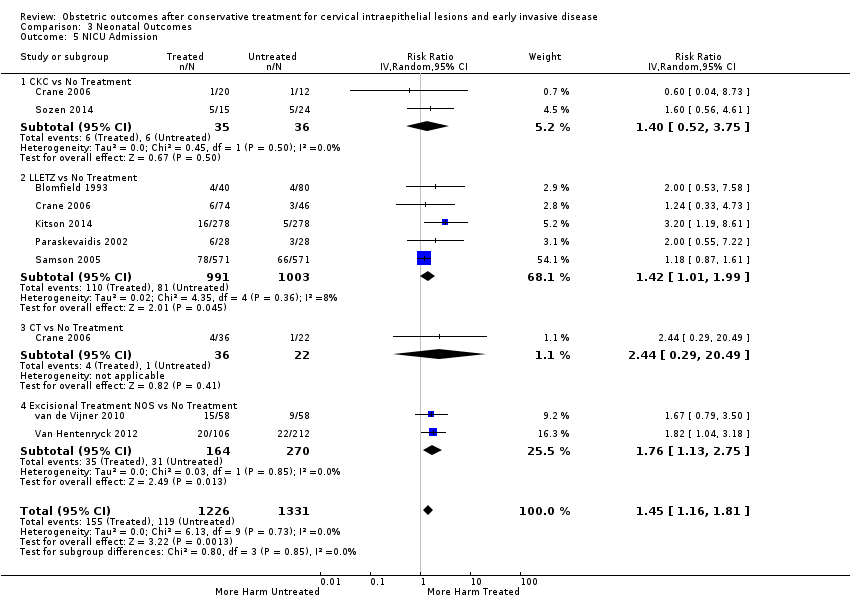
Comparison 3 Neonatal Outcomes, Outcome 5 NICU Admission.
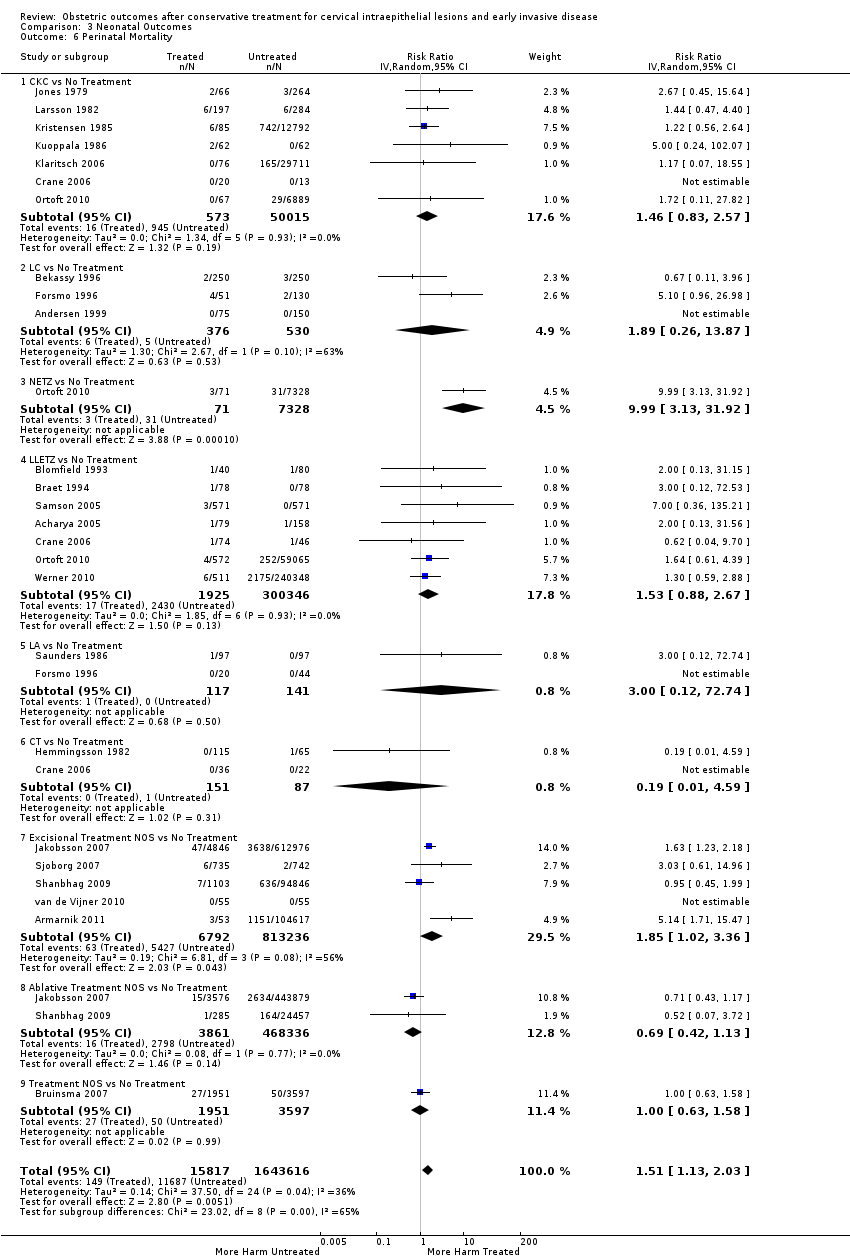
Comparison 3 Neonatal Outcomes, Outcome 6 Perinatal Mortality.

Comparison 3 Neonatal Outcomes, Outcome 7 Perinatal Mortality (<37w).

Comparison 3 Neonatal Outcomes, Outcome 8 Perinatal Mortality (<32w).
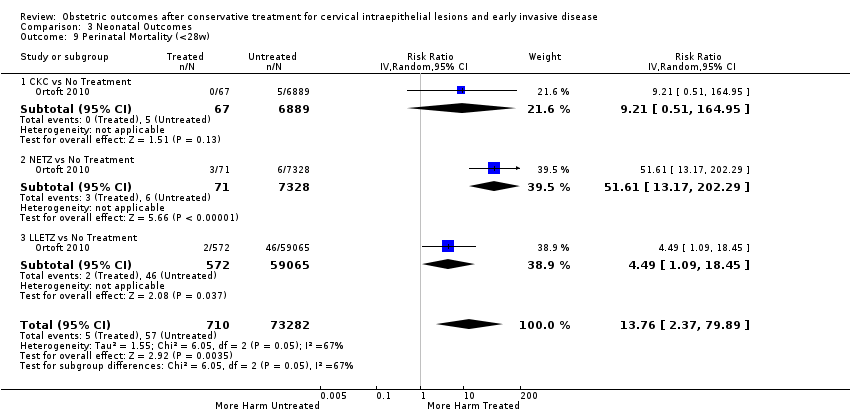
Comparison 3 Neonatal Outcomes, Outcome 9 Perinatal Mortality (<28w).

Comparison 3 Neonatal Outcomes, Outcome 10 Stillbirth.
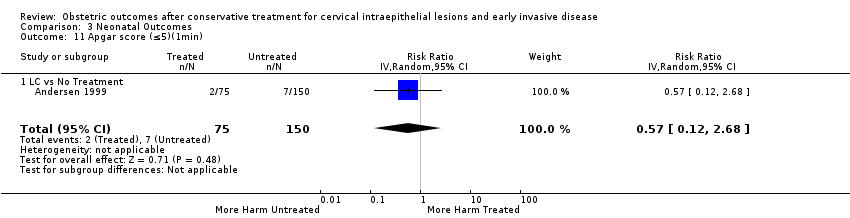
Comparison 3 Neonatal Outcomes, Outcome 11 Apgar score (≤5)(1min).

Comparison 3 Neonatal Outcomes, Outcome 12 Apgar score (<7)(1min).
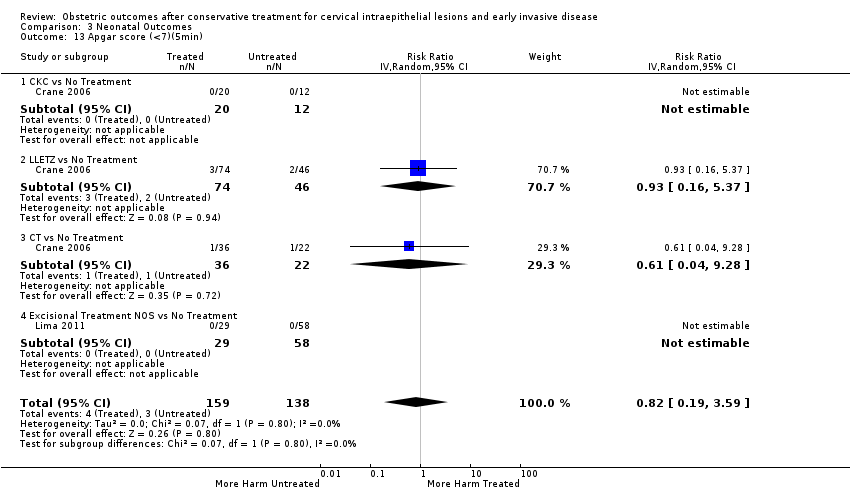
Comparison 3 Neonatal Outcomes, Outcome 13 Apgar score (<7)(5min).
| The effect of treatment for CIN on maternal outcomes | ||||||
| Patient or population: women with known obstetric outcomes | ||||||
| Outcomes | Anticipated absolute effects* (95% CI) | Relative effect | № of participants | Quality of the evidence | Comments | |
| Risk with [comparison] | Risk with [intervention] | |||||
| PTB (< 37 w) | Study population | RR 1.75 | 5,242,917 | ⊕⊝⊝⊝ | ||
| 54 per 1000 | 95 per 1000 | |||||
| PTB (< 32 to 34 w) | Study population | RR 2.25 | 3,793,874 | ⊕⊝⊝⊝ | ||
| 14 per 1000 | 32 per 1000 | |||||
| PTB (< 28 to 30 w) | Study population | RR 2.23 | 3,910,629 | ⊕⊝⊝⊝ | ||
| 3 per 1000 | 7 per 1000 | |||||
| PTB (< 37 w) ‐ Repeat cones versus No Treatment | Study population | RR 3.78 | 1,317,284 | ⊕⊝⊝⊝ | ||
| 41 per 1000 | 156 per 1000 | |||||
| pPROM (<3 7 w) | Study population | RR 2.36 | 477,011 | ⊕⊝⊝⊝ | ||
| 34 per 1000 | 80 per 1000 | |||||
| PTB (< 37 w) ‐ Depth ≤ 10 mm to 12 mm versus No Treatment | Study population | RR 1.54 | 550,929 | ⊕⊝⊝⊝ | ||
| 34 per 1000 | 53 per 1000 | |||||
| PTB (< 37 w) ‐ PTB (< 37 w) ‐ Depth ≥10 mm to 12 mm versus No Treatment | Study population | RR 1.93 | 552,711 | ⊕⊕⊕⊝ | ||
| 34 per 1000 | 66 per 1000 | |||||
| PTB (< 37w) ‐ PTB (<37w) ‐ Depth ≥15 to 17mm versus No Treatment | Study population | RR 2.77 | 544,986 | ⊕⊕⊕⊕ | ||
| 34 per 1000 | 94 per 1000 | |||||
| PTB (< 37 w) ‐ PTB (< 37 w) ‐ Depth ≥ 20 mm versus No Treatment | Study population | RR 4.91 | 543,750 | ⊕⊕⊕⊕ | ||
| 34 per 1000 | 167 per 1000 | |||||
| *The risk in the intervention group (and its 95% confidence interval) is based on the assumed risk in the comparison group and the relative effect of the intervention (and its 95% CI). | ||||||
| GRADE Working Group grades of evidence | ||||||
| 1 Low‐quality evidence (based on observational studies only) is downgraded one level because of considerable heterogeneity (I2 90%) 2 Low‐quality evidence (based on observational studies only) is downgraded one level because of considerable heterogeneity (I2 83%) and suspected publication bias 3 Low‐quality evidence (based on observational studies only) is downgraded one level because of considerable heterogeneity (I2 84%) 4 Low‐quality evidence (based on observational studies only) is downgraded one level because of considerable heterogeneity (I2 75%) 5 Low‐quality evidence (based on observational studies only) is downgraded one level because of considerable heterogeneity (I2 79%) 6 Low‐quality evidence (based on observational studies only) is downgraded one level because of substantial heterogeneity (I2 67%) 7 Low‐quality evidence (based on observational studies only); heterogeneity was low (I2 37%) 8 Low‐quality evidence (based on observational studies only) is downgraded one level because of moderate heterogeneity (I2 53%) 9 Low‐quality evidence (based on observational studies only) is downgraded one level because of considerable heterogeneity (I2 77%) | ||||||
| The effect of treatment for CIN on neonatal outcomes | ||||||
| Patient or population: women with known obstetric outcomes | ||||||
| Outcomes | Anticipated absolute effects* (95% CI) | Relative effect | № of participants | Quality of the evidence | Comments | |
| Risk with No Treatment | Risk with Treatment | |||||
| LBW (< 2500 g) ‐ Treatment versus No Treatment | Study population | RR 1.81 | 1,348,206 | ⊕⊝⊝⊝ | ||
| 37 per 1000 | 66 per 1000 | |||||
| NICU Admission ‐ Treatment versus No Treatment | Study population | RR 1.45 | 2557 | ⊕⊕⊝⊝ | ||
| 89 per 1000 | 130 per 1000 | |||||
| Perinatal Mortality ‐ Treatment versus No Treatment | Study population | RR 1.51 | 1,659,433 | ⊕⊕⊝⊝ | ||
| 7 per 1000 | 11 per 1000 | |||||
| *The risk in the intervention group (and its 95% confidence interval) is based on the assumed risk in the comparison group and the relative effect of the intervention (and its 95% CI). | ||||||
| GRADE Working Group grades of evidence | ||||||
| 1 Low‐quality evidence (based on observational studies only) is downgraded one level because of substantial heterogeneity (I2 63%) | ||||||
| Outcome or subgroup title | No. of studies | No. of participants | Statistical method | Effect size |
| 1 PTB (<37w) Show forest plot | 59 | 5.242917E6 | Risk Ratio (IV, Random, 95% CI) | 1.75 [1.57, 1.96] |
| 1.1 Excisional Treatment vs No Treatment | 53 | 4.599416E6 | Risk Ratio (IV, Random, 95% CI) | 1.87 [1.64, 2.12] |
| 1.2 Ablative Treatment vs No Treatment | 14 | 602370 | Risk Ratio (IV, Random, 95% CI) | 1.35 [1.20, 1.52] |
| 1.3 Treatment NOS vs No Treatment | 2 | 41131 | Risk Ratio (IV, Random, 95% CI) | 2.57 [1.39, 4.77] |
| 2 PTB (<37w)‐Analysis by treatment modality Show forest plot | 59 | 5.242917E6 | Risk Ratio (IV, Random, 95% CI) | 1.78 [1.60, 1.98] |
| 2.1 CKC vs No Treatment | 12 | 39102 | Risk Ratio (IV, Random, 95% CI) | 2.70 [2.14, 3.40] |
| 2.2 LC vs No Treatment | 9 | 1509 | Risk Ratio (IV, Random, 95% CI) | 2.11 [1.26, 3.54] |
| 2.3 NETZ vs No Treatment | 1 | 7399 | Risk Ratio (IV, Random, 95% CI) | 5.83 [3.80, 8.95] |
| 2.4 LLETZ vs No Treatment | 25 | 1.445104E6 | Risk Ratio (IV, Random, 95% CI) | 1.58 [1.37, 1.81] |
| 2.5 FCBE vs No Treatment | 1 | 71 | Risk Ratio (IV, Random, 95% CI) | 5.22 [1.09, 24.90] |
| 2.6 LA vs No Treatment | 7 | 4710 | Risk Ratio (IV, Random, 95% CI) | 1.04 [0.86, 1.26] |
| 2.7 CT vs No Treatment | 2 | 238 | Risk Ratio (IV, Random, 95% CI) | 1.02 [0.22, 4.77] |
| 2.8 RD vs No Treatment | 1 | 2150 | Risk Ratio (IV, Random, 95% CI) | 1.62 [1.27, 2.06] |
| 2.9 Excisional Treatment NOS vs No Treatment | 15 | 3.106231E6 | Risk Ratio (IV, Random, 95% CI) | 1.90 [1.50, 2.41] |
| 2.10 Ablative Treatment NOS vs No Treatment | 5 | 595272 | Risk Ratio (IV, Random, 95% CI) | 1.46 [1.27, 1.66] |
| 2.11 Treatment NOS vs No Treatment | 2 | 41131 | Risk Ratio (IV, Random, 95% CI) | 2.57 [1.39, 4.77] |
| 3 PTB (<32‐34w) Show forest plot | 24 | 3.793874E6 | Risk Ratio (IV, Random, 95% CI) | 2.25 [1.79, 2.82] |
| 3.1 Excisional Treatment vs No Treatment | 22 | 3.666567E6 | Risk Ratio (IV, Random, 95% CI) | 2.48 [1.92, 3.20] |
| 3.2 Ablative Treatment vs No Treatment | 3 | 120820 | Risk Ratio (IV, Random, 95% CI) | 1.59 [1.08, 2.35] |
| 3.3 Treatment NOS vs No treatment | 2 | 6487 | Risk Ratio (IV, Random, 95% CI) | 1.65 [1.13, 2.42] |
| 4 PTB (<32‐34w)‐Analysis by treatment modality Show forest plot | 24 | 3.793874E6 | Risk Ratio (IV, Random, 95% CI) | 2.35 [1.88, 2.95] |
| 4.1 CKC vs No Treatment | 5 | 36979 | Risk Ratio (IV, Random, 95% CI) | 3.07 [1.72, 5.49] |
| 4.2 NETZ vs No Treatment | 1 | 7399 | Risk Ratio (IV, Random, 95% CI) | 10.53 [4.33, 25.65] |
| 4.3 LLETZ vs No Treatment | 11 | 791554 | Risk Ratio (IV, Random, 95% CI) | 2.13 [1.66, 2.75] |
| 4.4 CT vs No Treatment | 1 | 58 | Risk Ratio (IV, Random, 95% CI) | 1.86 [0.08, 43.87] |
| 4.5 Excisional Treatment NOS vs No Treatment | 9 | 2.830635E6 | Risk Ratio (IV, Random, 95% CI) | 2.94 [1.82, 4.77] |
| 4.6 Ablative Treatment NOS vs No Treatment | 2 | 120762 | Risk Ratio (IV, Random, 95% CI) | 1.59 [1.08, 2.35] |
| 4.7 Treatment NOS vs No treatment | 2 | 6487 | Risk Ratio (IV, Random, 95% CI) | 1.65 [1.13, 2.42] |
| 5 PTB (<28‐30w) Show forest plot | 8 | 3.910629E6 | Risk Ratio (IV, Random, 95% CI) | 2.23 [1.55, 3.22] |
| 5.1 Excisional Treatment vs No Treatment | 7 | 3.337003E6 | Risk Ratio (IV, Random, 95% CI) | 2.81 [1.91, 4.15] |
| 5.2 Ablative Treatment vs No Treatment | 3 | 568217 | Risk Ratio (IV, Random, 95% CI) | 1.38 [0.81, 2.36] |
| 5.3 Treatment NOS vs No Treatment | 1 | 5409 | Risk Ratio (IV, Random, 95% CI) | 1.75 [1.05, 2.91] |
| 6 PTB (<28‐30w)‐Analysis by treatment modality Show forest plot | 8 | 3.910629E6 | Risk Ratio (IV, Random, 95% CI) | 2.43 [1.69, 3.49] |
| 6.1 CKC vs No Treatment | 2 | 7118 | Risk Ratio (IV, Random, 95% CI) | 4.52 [0.83, 24.54] |
| 6.2 NETZ vs No Treatment | 1 | 7399 | Risk Ratio (IV, Random, 95% CI) | 14.74 [4.50, 48.32] |
| 6.3 LLETZ vs No Treatment | 3 | 502778 | Risk Ratio (IV, Random, 95% CI) | 2.57 [1.97, 3.35] |
| 6.4 Excisional Treatment NOS vs No treatment | 3 | 2.819708E6 | Risk Ratio (IV, Random, 95% CI) | 2.54 [1.30, 4.99] |
| 6.5 Ablative Treatment NOS vs No Treatment | 3 | 568217 | Risk Ratio (IV, Random, 95% CI) | 1.38 [0.81, 2.36] |
| 6.6 Treatment NOS vs No Treatment | 1 | 5409 | Risk Ratio (IV, Random, 95% CI) | 1.75 [1.05, 2.91] |
| 7 PTB (≤34w) Show forest plot | 15 | 424567 | Risk Ratio (IV, Random, 95% CI) | 2.59 [1.78, 3.77] |
| 7.1 Excisional Treatment vs No Treatment | 15 | 424509 | Risk Ratio (IV, Random, 95% CI) | 2.61 [1.78, 3.83] |
| 7.2 Ablative Treatment vs No Treatment | 1 | 58 | Risk Ratio (IV, Random, 95% CI) | 1.86 [0.08, 43.87] |
| 8 PTB (≤34w)‐Analysis by treatment modality Show forest plot | 15 | 424567 | Risk Ratio (IV, Random, 95% CI) | 2.56 [1.78, 3.69] |
| 8.1 CKC vs No Treatment | 4 | 30023 | Risk Ratio (IV, Random, 95% CI) | 2.85 [1.50, 5.41] |
| 8.2 LLETZ vs No Treatment | 9 | 289218 | Risk Ratio (IV, Random, 95% CI) | 1.83 [1.41, 2.39] |
| 8.3 CT vs No Treatment | 1 | 58 | Risk Ratio (IV, Random, 95% CI) | 1.86 [0.08, 43.87] |
| 8.4 Excisional Treatment NOS vs No Treatment | 4 | 105268 | Risk Ratio (IV, Random, 95% CI) | 7.30 [4.17, 12.80] |
| 9 PTB (<32‐33w) Show forest plot | 10 | 3.369685E6 | Risk Ratio (IV, Random, 95% CI) | 2.08 [1.55, 2.79] |
| 9.1 Excisional Treatment vs No Treatment | 8 | 3.242436E6 | Risk Ratio (IV, Random, 95% CI) | 2.43 [1.70, 3.47] |
| 9.2 Ablative Treatment vs No Treatment | 2 | 120762 | Risk Ratio (IV, Random, 95% CI) | 1.59 [1.08, 2.35] |
| 9.3 Treatment NOS vs No treatment | 2 | 6487 | Risk Ratio (IV, Random, 95% CI) | 1.65 [1.13, 2.42] |
| 10 PTB (<32‐33w)‐Analysis by treatment modality Show forest plot | 10 | 3.369685E6 | Risk Ratio (IV, Random, 95% CI) | 2.26 [1.70, 3.01] |
| 10.1 CKC vs No Treatment | 1 | 6956 | Risk Ratio (IV, Random, 95% CI) | 4.38 [1.08, 17.65] |
| 10.2 NETZ vs No Treatment | 1 | 7399 | Risk Ratio (IV, Random, 95% CI) | 10.53 [4.33, 25.65] |
| 10.3 LLETZ vs No Treatment | 3 | 502714 | Risk Ratio (IV, Random, 95% CI) | 2.74 [2.30, 3.26] |
| 10.4 Excisional Treatment NOS vs No Treatment | 5 | 2.725367E6 | Risk Ratio (IV, Random, 95% CI) | 2.09 [1.20, 3.63] |
| 10.5 Ablative Treatment NOS vs No Treatment | 2 | 120762 | Risk Ratio (IV, Random, 95% CI) | 1.59 [1.08, 2.35] |
| 10.6 Treatment NOS vs No treatment | 2 | 6487 | Risk Ratio (IV, Random, 95% CI) | 1.65 [1.13, 2.42] |
| 11 PTB (<30w) Show forest plot | 1 | 162 | Risk Ratio (IV, Random, 95% CI) | 2.86 [0.12, 69.11] |
| 11.1 Excisional Treatment vs No Treatment | 1 | 162 | Risk Ratio (IV, Random, 95% CI) | 2.86 [0.12, 69.11] |
| 12 PTB (<30w)‐Analysis by treatment modality Show forest plot | 1 | 162 | Risk Ratio (IV, Random, 95% CI) | 2.86 [0.12, 69.11] |
| 12.1 CKC vs No Treatment | 1 | 162 | Risk Ratio (IV, Random, 95% CI) | 2.86 [0.12, 69.11] |
| 13 PTB (<28w) Show forest plot | 7 | 3.910467E6 | Risk Ratio (IV, Random, 95% CI) | 2.22 [1.54, 3.22] |
| 13.1 Excisional Treatment vs No Treatment | 6 | 3.336841E6 | Risk Ratio (IV, Random, 95% CI) | 2.81 [1.89, 4.18] |
| 13.2 Ablative treatment vs No Treatment | 3 | 568217 | Risk Ratio (IV, Random, 95% CI) | 1.38 [0.81, 2.36] |
| 13.3 Treatment NOS vs No Treatment | 1 | 5409 | Risk Ratio (IV, Random, 95% CI) | 1.75 [1.05, 2.91] |
| 14 PTB (<28w)‐Analysis by treatment modality Show forest plot | 6 | 3.905058E6 | Risk Ratio (IV, Random, 95% CI) | 2.52 [1.71, 3.72] |
| 14.1 CKC vs No Treatment | 1 | 6956 | Risk Ratio (IV, Random, 95% CI) | 5.41 [0.74, 39.84] |
| 14.2 NETZ vs No Treatment | 1 | 7399 | Risk Ratio (IV, Random, 95% CI) | 14.74 [4.50, 48.32] |
| 14.3 LLETZ vs No Treatment | 3 | 502778 | Risk Ratio (IV, Random, 95% CI) | 2.57 [1.97, 3.35] |
| 14.4 Excisional Treatment NOS vs No treatment | 3 | 2.819708E6 | Risk Ratio (IV, Random, 95% CI) | 2.54 [1.30, 4.99] |
| 14.5 Ablative Treatment NOS vs No Treatment | 3 | 568217 | Risk Ratio (IV, Random, 95% CI) | 1.38 [0.81, 2.36] |
| 15 PTB (<37w)‐Nulliparous women Show forest plot | 6 | 245707 | Risk Ratio (IV, Random, 95% CI) | 1.92 [1.23, 2.98] |
| 15.1 LC vs No Treatment | 2 | 267 | Risk Ratio (IV, Random, 95% CI) | 2.18 [1.09, 4.37] |
| 15.2 LLETZ vs No Treatment | 3 | 231344 | Risk Ratio (IV, Random, 95% CI) | 1.51 [0.76, 3.02] |
| 15.3 Treatment NOS versus No Treatment | 1 | 14096 | Risk Ratio (IV, Random, 95% CI) | 3.53 [1.70, 7.33] |
| 16 PTB (<37w)‐Parous women Show forest plot | 5 | 339507 | Risk Ratio (IV, Random, 95% CI) | 2.05 [0.95, 4.43] |
| 16.1 LC vs No Treatment | 2 | 401 | Risk Ratio (IV, Random, 95% CI) | 2.82 [0.16, 49.84] |
| 16.2 LLETZ vs No Treatment | 2 | 324948 | Risk Ratio (IV, Random, 95% CI) | 1.20 [0.22, 6.65] |
| 16.3 Treatment NOS vs No Treatment | 1 | 14158 | Risk Ratio (IV, Random, 95% CI) | 3.73 [2.23, 6.22] |
| 17 PTB (<37w)‐Single cone Show forest plot | 17 | 1.367023E6 | Risk Ratio (IV, Random, 95% CI) | 1.75 [1.49, 2.06] |
| 17.1 CKC vs No Treatment | 3 | 36783 | Risk Ratio (IV, Random, 95% CI) | 2.89 [2.08, 4.03] |
| 17.2 LC vs No Treatment | 2 | 657 | Risk Ratio (IV, Random, 95% CI) | 1.06 [0.54, 2.09] |
| 17.3 NETZ vs No Treatment | 1 | 7399 | Risk Ratio (IV, Random, 95% CI) | 5.83 [3.80, 8.95] |
| 17.4 LLETZ vs No Treatment | 9 | 1.277874E6 | Risk Ratio (IV, Random, 95% CI) | 1.74 [1.45, 2.10] |
| 17.5 LA vs No Treatment | 4 | 1421 | Risk Ratio (IV, Random, 95% CI) | 1.07 [0.66, 1.74] |
| 17.6 Excisional Treatment NOS vs No Treatment | 3 | 32106 | Risk Ratio (IV, Random, 95% CI) | 1.88 [1.20, 2.93] |
| 17.7 Ablative Treatment NOS vs No Treatment | 1 | 10783 | Risk Ratio (IV, Random, 95% CI) | 1.14 [0.82, 1.57] |
| 18 PTB (<37w)‐Repeat cones Show forest plot | 11 | 1.317284E6 | Risk Ratio (IV, Random, 95% CI) | 3.78 [2.65, 5.39] |
| 18.1 CKC/LA vs No Treatment | 1 | 99 | Risk Ratio (IV, Random, 95% CI) | 12.56 [5.11, 30.87] |
| 18.2 LC/LC vs No Treatment | 1 | 270 | Risk Ratio (IV, Random, 95% CI) | 3.75 [1.70, 8.27] |
| 18.3 LLETZ/LLETZ vs No Treatment | 4 | 1.202174E6 | Risk Ratio (IV, Random, 95% CI) | 2.81 [2.33, 3.39] |
| 18.4 LLETZ/Treatment NOS vs No Treatment | 1 | 298 | Risk Ratio (IV, Random, 95% CI) | 9.40 [3.53, 25.03] |
| 18.5 Excisional Treatment NOS/Excisional Treatment NOS vs No Treatment | 3 | 73651 | Risk Ratio (IV, Random, 95% CI) | 5.48 [2.68, 11.24] |
| 18.6 Treatment NOS/Treatment NOS vs No Treatment | 2 | 40792 | Risk Ratio (IV, Random, 95% CI) | 1.71 [1.10, 2.67] |
| 19 PTB (<37w)‐Singleton pregnancies Show forest plot | 32 | 2.18962E6 | Risk Ratio (IV, Random, 95% CI) | 1.76 [1.57, 1.98] |
| 19.1 CKC vs No Treatment | 6 | 37759 | Risk Ratio (IV, Random, 95% CI) | 2.89 [2.22, 3.77] |
| 19.2 LC vs No Treatment | 4 | 545 | Risk Ratio (IV, Random, 95% CI) | 2.54 [1.24, 5.20] |
| 19.3 NETZ vs No Treatment | 1 | 7399 | Risk Ratio (IV, Random, 95% CI) | 5.83 [3.80, 8.95] |
| 19.4 LLETZ vs No Treatment | 18 | 1.444175E6 | Risk Ratio (IV, Random, 95% CI) | 1.61 [1.39, 1.87] |
| 19.5 LA vs No Treatment | 3 | 3420 | Risk Ratio (IV, Random, 95% CI) | 1.10 [0.75, 1.62] |
| 19.6 CT vs No Treatment | 1 | 58 | Risk Ratio (IV, Random, 95% CI) | 1.86 [0.08, 43.87] |
| 19.7 RD vs No Treatment | 1 | 2150 | Risk Ratio (IV, Random, 95% CI) | 1.62 [1.27, 2.06] |
| 19.8 Excisional Treatment NOS vs No Treatment | 7 | 542892 | Risk Ratio (IV, Random, 95% CI) | 1.42 [1.17, 1.72] |
| 19.9 Ablative Treatment NOS vs No Treatment | 2 | 110091 | Risk Ratio (IV, Random, 95% CI) | 1.14 [0.56, 2.32] |
| 19.10 Treatment NOS vs No Treatment | 2 | 41131 | Risk Ratio (IV, Random, 95% CI) | 2.57 [1.39, 4.77] |
| 20 PTB (<37w)‐Multiple pregnancies Show forest plot | 5 | 10797 | Risk Ratio (IV, Random, 95% CI) | 1.14 [0.95, 1.35] |
| 20.1 CKC vs No Treatment | 2 | 84 | Risk Ratio (IV, Random, 95% CI) | 0.95 [0.49, 1.83] |
| 20.2 LLETZ vs No Treatment | 3 | 10199 | Risk Ratio (IV, Random, 95% CI) | 1.27 [1.09, 1.47] |
| 20.3 Excisional Treatment NOS vs No Treatment | 1 | 4 | Risk Ratio (IV, Random, 95% CI) | 3.5 [0.31, 39.71] |
| 20.4 Ablative Treatment NOS vs No Treatment | 1 | 510 | Risk Ratio (IV, Random, 95% CI) | 0.93 [0.72, 1.20] |
| 21 PTB (<32‐34w)‐Multiple pregnancies Show forest plot | 3 | 10789 | Risk Ratio (IV, Random, 95% CI) | 1.68 [0.95, 2.98] |
| 21.1 CKC vs No Treatment | 1 | 80 | Risk Ratio (IV, Random, 95% CI) | 3.5 [1.29, 9.52] |
| 21.2 LLETZ vs No Treatment | 3 | 10199 | Risk Ratio (IV, Random, 95% CI) | 1.76 [0.88, 3.50] |
| 21.3 Ablative Treatment NOS vs No Treatment | 1 | 510 | Risk Ratio (IV, Random, 95% CI) | 0.85 [0.38, 1.91] |
| 22 PTB (<28w)‐Multiple pregnancies Show forest plot | 2 | 10744 | Risk Ratio (IV, Random, 95% CI) | 2.43 [1.40, 4.22] |
| 22.1 CKC vs No Treatment | 1 | 80 | Risk Ratio (IV, Random, 95% CI) | 2.15 [0.09, 49.56] |
| 22.2 LLETZ vs No Treatment | 2 | 10154 | Risk Ratio (IV, Random, 95% CI) | 2.45 [1.34, 4.47] |
| 22.3 Ablative Treatment NOS vs No Treatment | 1 | 510 | Risk Ratio (IV, Random, 95% CI) | 2.32 [0.48, 11.26] |
| 23 PTB (<37w)‐Depth≤10‐12mm Show forest plot | 8 | 550929 | Risk Ratio (IV, Random, 95% CI) | 1.54 [1.09, 2.18] |
| 23.1 LC vs No Treatment | 1 | 105 | Risk Ratio (IV, Random, 95% CI) | 0.52 [0.06, 4.83] |
| 23.2 LLETZ vs No Treatment | 3 | 544907 | Risk Ratio (IV, Random, 95% CI) | 2.01 [1.28, 3.15] |
| 23.3 Excisional Treatment NOS vs No Treatment | 4 | 5917 | Risk Ratio (IV, Random, 95% CI) | 1.20 [0.78, 1.85] |
| 24 PTB (<37w)‐Depth≥10‐12mm Show forest plot | 8 | 552711 | Risk Ratio (IV, Random, 95% CI) | 1.93 [1.62, 2.31] |
| 24.1 LC vs No Treatment | 1 | 87 | Risk Ratio (IV, Random, 95% CI) | 4.64 [1.20, 17.88] |
| 24.2 LLETZ vs No Treatment | 3 | 546134 | Risk Ratio (IV, Random, 95% CI) | 2.29 [1.57, 3.34] |
| 24.3 Excisional Treatment NOS vs No Treatment | 4 | 6490 | Risk Ratio (IV, Random, 95% CI) | 1.68 [1.41, 1.99] |
| 25 PTB (<37w)‐Depth≥15‐17mm Show forest plot | 4 | 544986 | Risk Ratio (IV, Random, 95% CI) | 2.77 [1.95, 3.93] |
| 25.1 LC vs No Treatment | 1 | 211 | Risk Ratio (IV, Random, 95% CI) | 4.92 [2.09, 11.59] |
| 25.2 LLETZ vs No Treatment | 2 | 544248 | Risk Ratio (IV, Random, 95% CI) | 3.16 [1.54, 6.48] |
| 25.3 Excisional Treatment NOS vs No Treatment | 1 | 527 | Risk Ratio (IV, Random, 95% CI) | 2.03 [1.33, 3.10] |
| 26 PTB (<37w)‐Depth≥20mm Show forest plot | 3 | 543750 | Risk Ratio (IV, Random, 95% CI) | 4.91 [2.06, 11.68] |
| 26.1 LC vs No Treatment | 1 | 192 | Risk Ratio (IV, Random, 95% CI) | 6.12 [2.57, 14.57] |
| 26.2 LLETZ vs No Treatment | 2 | 543558 | Risk Ratio (IV, Random, 95% CI) | 4.72 [1.25, 17.80] |
| 27 PTB (<37w)‐Volume<6cc Show forest plot | 1 | 550 | Risk Ratio (IV, Random, 95% CI) | 2.25 [1.09, 4.66] |
| 27.1 LLETZ vs No Treatment | 1 | 550 | Risk Ratio (IV, Random, 95% CI) | 2.25 [1.09, 4.66] |
| 28 PTB (<37w)‐Volume>6cc Show forest plot | 1 | 284 | Risk Ratio (IV, Random, 95% CI) | 13.90 [5.09, 37.98] |
| 28.1 LLETZ (Volume>6cc) vs No Treatment | 1 | 284 | Risk Ratio (IV, Random, 95% CI) | 13.90 [5.09, 37.98] |
| 29 PTB (<37w)‐Depth≤10mm Show forest plot | 7 | 7436 | Risk Ratio (IV, Random, 95% CI) | 1.60 [0.99, 2.59] |
| 29.1 LC vs No Treatment | 1 | 105 | Risk Ratio (IV, Random, 95% CI) | 0.52 [0.06, 4.83] |
| 29.2 LLETZ vs No Treatment | 2 | 1414 | Risk Ratio (IV, Random, 95% CI) | 2.72 [1.65, 4.50] |
| 29.3 Excisional Treatment NOS vs No Treatment | 4 | 5917 | Risk Ratio (IV, Random, 95% CI) | 1.20 [0.78, 1.85] |
| 30 PTB (<37w)‐Depth≤12mm Show forest plot | 1 | 543493 | Risk Ratio (IV, Random, 95% CI) | 1.56 [1.20, 2.02] |
| 30.1 LLETZ vs No Treatment | 1 | 543493 | Risk Ratio (IV, Random, 95% CI) | 1.56 [1.20, 2.02] |
| 31 PTB (<37w)‐Depth≤15mm Show forest plot | 3 | 545283 | Risk Ratio (IV, Random, 95% CI) | 1.44 [1.20, 1.73] |
| 31.1 LC vs No Treatment | 1 | 164 | Risk Ratio (IV, Random, 95% CI) | 0.67 [0.04, 11.18] |
| 31.2 LLETZ vs No Treatment | 2 | 545119 | Risk Ratio (IV, Random, 95% CI) | 1.44 [1.20, 1.73] |
| 32 PTB (<37w)‐Depth≤17mm Show forest plot | 1 | 656 | Risk Ratio (IV, Random, 95% CI) | 1.14 [0.76, 1.72] |
| 32.1 Excisional Treatment NOS vs No Treatment | 1 | 656 | Risk Ratio (IV, Random, 95% CI) | 1.14 [0.76, 1.72] |
| 33 PTB (<37w)‐Depth≤15‐17mm Show forest plot | 4 | 545939 | Risk Ratio (IV, Random, 95% CI) | 1.38 [1.17, 1.64] |
| 33.1 LC vs No Treatment | 1 | 164 | Risk Ratio (IV, Random, 95% CI) | 0.67 [0.04, 11.18] |
| 33.2 LLETZ vs No Treatment | 2 | 545119 | Risk Ratio (IV, Random, 95% CI) | 1.44 [1.20, 1.73] |
| 33.3 Excisional Treatment NOS vs No Treatment | 1 | 656 | Risk Ratio (IV, Random, 95% CI) | 1.14 [0.76, 1.72] |
| 34 PTB (<37w)‐Depth≤20mm Show forest plot | 3 | 545992 | Risk Ratio (IV, Random, 95% CI) | 1.60 [1.38, 1.87] |
| 34.1 LC vs No Treatment | 1 | 183 | Risk Ratio (IV, Random, 95% CI) | 1.30 [0.28, 5.97] |
| 34.2 LLETZ vs No Treatment | 2 | 545809 | Risk Ratio (IV, Random, 95% CI) | 1.61 [1.38, 1.87] |
| 35 PTB (<37w)‐Depth≥10mm Show forest plot | 7 | 7671 | Risk Ratio (IV, Random, 95% CI) | 2.12 [1.58, 2.85] |
| 35.1 LC vs No Treatment | 1 | 87 | Risk Ratio (IV, Random, 95% CI) | 4.64 [1.20, 17.88] |
| 35.2 LLETZ vs No Treatment | 2 | 1094 | Risk Ratio (IV, Random, 95% CI) | 3.16 [1.80, 5.55] |
| 35.3 Excisional Treatment NOS vs No Treatment | 4 | 6490 | Risk Ratio (IV, Random, 95% CI) | 1.68 [1.41, 1.99] |
| 36 PTB (<37w)‐Depth≥12mm Show forest plot | 1 | 545040 | Risk Ratio (IV, Random, 95% CI) | 1.93 [1.66, 2.23] |
| 36.1 LLETZ vs No Treatment | 1 | 545040 | Risk Ratio (IV, Random, 95% CI) | 1.93 [1.66, 2.23] |
| 37 PTB (<37w)‐Depth≥15mm Show forest plot | 3 | 544459 | Risk Ratio (IV, Random, 95% CI) | 3.49 [1.94, 6.26] |
| 37.1 LC vs No Treatment | 1 | 211 | Risk Ratio (IV, Random, 95% CI) | 4.92 [2.09, 11.59] |
| 37.2 LLETZ vs No Treatment | 2 | 544248 | Risk Ratio (IV, Random, 95% CI) | 3.16 [1.54, 6.48] |
| 38 PTB (<37w)‐Depth≥17mm Show forest plot | 1 | 527 | Risk Ratio (IV, Random, 95% CI) | 2.03 [1.33, 3.10] |
| 38.1 Excisional Treatment NOS vs No Treatment | 1 | 527 | Risk Ratio (IV, Random, 95% CI) | 2.03 [1.33, 3.10] |
| 39 PTB (<37w)‐Depth 10/13‐15/16mm Show forest plot | 3 | 544534 | Risk Ratio (IV, Random, 95% CI) | 1.32 [1.04, 1.66] |
| 39.1 LLETZ vs No Treatment | 2 | 543994 | Risk Ratio (IV, Random, 95% CI) | 1.32 [1.02, 1.72] |
| 39.2 Excisional Treatment NOS vs No Treatment | 1 | 540 | Risk Ratio (IV, Random, 95% CI) | 1.29 [0.79, 2.12] |
| 40 PTB (<37w)‐Depth 15/16‐19/20mm Show forest plot | 3 | 543608 | Risk Ratio (IV, Random, 95% CI) | 2.24 [1.73, 2.91] |
| 40.1 LC vs No Treatment | 1 | 169 | Risk Ratio (IV, Random, 95% CI) | 2.26 [0.50, 10.08] |
| 40.2 LLETZ vs No Treatment | 2 | 543439 | Risk Ratio (IV, Random, 95% CI) | 2.53 [1.42, 4.51] |
| 41 PTB (<37w)‐Volume<3cc Show forest plot | 1 | 496 | Risk Ratio (IV, Random, 95% CI) | 2.04 [0.94, 4.41] |
| 41.1 LLETZ vs No Treatment | 1 | 496 | Risk Ratio (IV, Random, 95% CI) | 2.04 [0.94, 4.41] |
| 42 PTB (<37w)‐Volume>3cc Show forest plot | 1 | 338 | Risk Ratio (IV, Random, 95% CI) | 4.17 [1.77, 9.82] |
| 42.1 LLETZ vs No Treatment | 1 | 338 | Risk Ratio (IV, Random, 95% CI) | 4.17 [1.77, 9.82] |
| 43 PTB (<37w)‐Depth≥10‐12mm vs ≤10‐12mm Show forest plot | 7 | 6359 | Risk Ratio (IV, Random, 95% CI) | 1.54 [1.31, 1.80] |
| 43.1 LC | 1 | 64 | Risk Ratio (IV, Random, 95% CI) | 8.91 [1.11, 71.73] |
| 43.2 LLETZ | 2 | 836 | Risk Ratio (IV, Random, 95% CI) | 1.26 [0.74, 2.17] |
| 43.3 Excision NOS | 4 | 5459 | Risk Ratio (IV, Random, 95% CI) | 1.55 [1.31, 1.83] |
| 44 PTB (<37w)‐Depth≥15‐17mm vs ≤15‐17mm Show forest plot | 4 | 4275 | Risk Ratio (IV, Random, 95% CI) | 1.82 [1.47, 2.26] |
| 44.1 LC | 1 | 75 | Risk Ratio (IV, Random, 95% CI) | 7.02 [0.44, 111.10] |
| 44.2 LLETZ | 2 | 3869 | Risk Ratio (IV, Random, 95% CI) | 1.86 [1.36, 2.55] |
| 44.3 Excisional Treatment NOS | 1 | 331 | Risk Ratio (IV, Random, 95% CI) | 1.78 [1.11, 2.84] |
| 45 PTB (<37w)‐Depth≥20mm vs ≤20mm Show forest plot | 3 | 3944 | Risk Ratio (IV, Random, 95% CI) | 2.79 [1.24, 6.27] |
| 45.1 LC | 1 | 75 | Risk Ratio (IV, Random, 95% CI) | 4.71 [1.13, 19.62] |
| 45.2 LLETZ | 2 | 3869 | Risk Ratio (IV, Random, 95% CI) | 2.47 [0.94, 6.51] |
| 46 PTB (<37w)‐Volume>3cc vs <3cc Show forest plot | 1 | 278 | Risk Ratio (IV, Random, 95% CI) | 2.04 [0.95, 4.39] |
| 46.1 LLETZ | 1 | 278 | Risk Ratio (IV, Random, 95% CI) | 2.04 [0.95, 4.39] |
| 47 PTB (<37w)‐Volume>6cc vs <6cc Show forest plot | 1 | 278 | Risk Ratio (IV, Random, 95% CI) | 6.18 [2.53, 15.13] |
| 47.1 LLETZ | 1 | 278 | Risk Ratio (IV, Random, 95% CI) | 6.18 [2.53, 15.13] |
| 48 PTB (<37w)‐Depth 11/13‐15/16mm vs ≤10‐12mm Show forest plot | 3 | 2600 | Risk Ratio (IV, Random, 95% CI) | 0.92 [0.67, 1.25] |
| 48.1 LLETZ | 2 | 2370 | Risk Ratio (IV, Random, 95% CI) | 0.83 [0.58, 1.17] |
| 48.2 Excisional Treatment NOS | 1 | 230 | Risk Ratio (IV, Random, 95% CI) | 1.31 [0.68, 2.50] |
| 49 PTB (<37w)‐Depth 16‐19mm vs 13‐15mm Show forest plot | 1 | 1768 | Risk Ratio (IV, Random, 95% CI) | 1.65 [1.12, 2.43] |
| 49.1 LLETZ | 1 | 1768 | Risk Ratio (IV, Random, 95% CI) | 1.65 [1.12, 2.43] |
| 50 PTB (<37w)‐Depth≥20mm vs 15/16‐19/20mm Show forest plot | 3 | 1560 | Risk Ratio (IV, Random, 95% CI) | 1.46 [0.95, 2.23] |
| 50.1 LC | 1 | 61 | Risk Ratio (IV, Random, 95% CI) | 2.71 [0.67, 10.96] |
| 50.2 LLETZ | 2 | 1499 | Risk Ratio (IV, Random, 95% CI) | 1.40 [0.84, 2.36] |
| 51 PTB (<37w)‐Untreated External Comparison Group Show forest plot | 44 | 5.192047E6 | Risk Ratio (IV, Random, 95% CI) | 1.92 [1.70, 2.16] |
| 51.1 CKC | 7 | 37370 | Risk Ratio (IV, Random, 95% CI) | 3.28 [2.44, 4.42] |
| 51.2 LC | 6 | 1126 | Risk Ratio (IV, Random, 95% CI) | 2.39 [1.24, 4.61] |
| 51.3 NETZ | 1 | 7361 | Risk Ratio (IV, Random, 95% CI) | 5.82 [3.79, 8.94] |
| 51.4 LLETZ | 19 | 1.414769E6 | Risk Ratio (IV, Random, 95% CI) | 1.72 [1.48, 2.00] |
| 51.5 LA] | 4 | 1258 | Risk Ratio (IV, Random, 95% CI) | 1.27 [0.67, 2.40] |
| 51.6 CT | 1 | 58 | Risk Ratio (IV, Random, 95% CI) | 1.86 [0.08, 43.87] |
| 51.7 Excisional Treatment NOS | 12 | 3.100025E6 | Risk Ratio (IV, Random, 95% CI) | 1.91 [1.50, 2.44] |
| 51.8 Ablative Treatment NOS | 5 | 588949 | Risk Ratio (IV, Random, 95% CI) | 1.45 [1.26, 1.67] |
| 51.9 Treatment NOS | 2 | 41131 | Risk Ratio (IV, Random, 95% CI) | 2.57 [1.39, 4.77] |
| 52 PTB (<37w)‐Untreated Internal Comparison Group (self‐matching) Show forest plot | 8 | 2987 | Risk Ratio (IV, Random, 95% CI) | 1.59 [1.19, 2.13] |
| 52.1 LC | 2 | 354 | Risk Ratio (IV, Random, 95% CI) | 1.30 [0.56, 3.06] |
| 52.2 LLETZ | 1 | 516 | Risk Ratio (IV, Random, 95% CI) | 1.82 [1.04, 3.21] |
| 52.3 FCBE | 1 | 71 | Risk Ratio (IV, Random, 95% CI) | 5.22 [1.09, 24.90] |
| 52.4 Excisional Treatment NOS | 3 | 1922 | Risk Ratio (IV, Random, 95% CI) | 1.46 [0.89, 2.39] |
| 52.5 Treatment NOS | 1 | 124 | Risk Ratio (IV, Random, 95% CI) | 2.0 [0.73, 5.51] |
| 53 PTB (<37w)‐Untreated Internal Comparison Group (pre‐treatment pregnancies) Show forest plot | 13 | 83404 | Risk Ratio (IV, Random, 95% CI) | 1.39 [0.98, 1.96] |
| 53.1 CKC | 3 | 1430 | Risk Ratio (IV, Random, 95% CI) | 1.79 [0.81, 3.95] |
| 53.2 LC | 2 | 161 | Risk Ratio (IV, Random, 95% CI) | 1.65 [0.11, 23.58] |
| 53.3 LLETZ | 4 | 3207 | Risk Ratio (IV, Random, 95% CI) | 1.13 [0.66, 1.94] |
| 53.4 LA | 1 | 226 | Risk Ratio (IV, Random, 95% CI) | 1.20 [0.57, 2.53] |
| 53.5 CT | 1 | 180 | Risk Ratio (IV, Random, 95% CI) | 0.85 [0.15, 4.94] |
| 53.6 Excisional NOS | 3 | 78200 | Risk Ratio (IV, Random, 95% CI) | 1.65 [0.88, 3.08] |
| 54 PTB (<37w)‐Untreated Colposcopy+/‐CIN+/‐Biopsy Comparison Group Show forest plot | 13 | 74958 | Risk Ratio (IV, Random, 95% CI) | 1.27 [1.14, 1.41] |
| 54.1 CKC | 2 | 265 | Risk Ratio (IV, Random, 95% CI) | 1.76 [1.01, 3.08] |
| 54.2 LC | 1 | 177 | Risk Ratio (IV, Random, 95% CI) | 1.52 [0.74, 3.15] |
| 54.3 LLETZ | 9 | 39249 | Risk Ratio (IV, Random, 95% CI) | 1.33 [1.11, 1.60] |
| 54.4 LA | 2 | 3326 | Risk Ratio (IV, Random, 95% CI) | 1.05 [0.84, 1.31] |
| 54.5 RD | 1 | 2150 | Risk Ratio (IV, Random, 95% CI) | 1.62 [1.27, 2.06] |
| 54.6 Excisional Treatment NOS | 5 | 20321 | Risk Ratio (IV, Random, 95% CI) | 1.23 [1.07, 1.41] |
| 54.7 Ablative Treatment NOS | 2 | 9470 | Risk Ratio (IV, Random, 95% CI) | 1.00 [0.74, 1.36] |
| 55 PTB (<37w)‐Untreated HSIL Comparison Group Show forest plot | 3 | 3764 | Risk Ratio (IV, Random, 95% CI) | 1.37 [0.85, 2.19] |
| 55.1 CKC | 1 | 103 | Risk Ratio (IV, Random, 95% CI) | 3.76 [0.48, 29.39] |
| 55.2 NETZ | 1 | 109 | Risk Ratio (IV, Random, 95% CI) | 4.55 [1.11, 18.66] |
| 55.3 LLETZ | 1 | 881 | Risk Ratio (IV, Random, 95% CI) | 2.48 [1.35, 4.55] |
| 55.4 Excisional Treatment NOS | 2 | 2274 | Risk Ratio (IV, Random, 95% CI) | 1.06 [0.71, 1.59] |
| 55.5 Ablative Treatment NOS | 2 | 397 | Risk Ratio (IV, Random, 95% CI) | 0.68 [0.28, 1.68] |
| 56 PTB (<37w)‐All Comparison Groups Show forest plot | 58 | 5.292724E6 | Risk Ratio (IV, Random, 95% CI) | 1.76 [1.58, 1.97] |
| 56.1 Treatment vs Untreated External Comparison Group | 43 | 5.165466E6 | Risk Ratio (IV, Random, 95% CI) | 1.97 [1.71, 2.26] |
| 56.2 Treatment vs Untreated Internal Comparison Group (pre‐treatment pregnancies) | 13 | 62519 | Risk Ratio (IV, Random, 95% CI) | 1.66 [1.24, 2.22] |
| 56.3 Treatment vs Untreated Internal Comparison Group (self‐matching) | 6 | 1263 | Risk Ratio (IV, Random, 95% CI) | 1.91 [1.19, 3.08] |
| 56.4 Treatment vs Untreated Colposcopy+/‐CIN+/‐Biopsy Comparison Group | 12 | 62702 | Risk Ratio (IV, Random, 95% CI) | 1.33 [1.17, 1.50] |
| 56.5 Treatment vs Untreated HSIL Comparison Group | 3 | 774 | Risk Ratio (IV, Random, 95% CI) | 1.46 [0.62, 3.42] |
| 57 PTB (<37w)‐Untreated High‐risk Population vs General Population Show forest plot | 15 | 4.357998E6 | Risk Ratio (IV, Random, 95% CI) | 1.24 [1.14, 1.34] |
| 57.1 Pre‐treatment pregnancies vs General Population | 10 | 3.132723E6 | Risk Ratio (IV, Random, 95% CI) | 1.23 [1.07, 1.42] |
| 57.2 Untreated Colposcopy+/‐CIN+/‐Biopsy vs General Population | 4 | 1.046823E6 | Risk Ratio (IV, Random, 95% CI) | 1.22 [1.11, 1.34] |
| 57.3 Untreated HSIL vs General Population | 3 | 178452 | Risk Ratio (IV, Random, 95% CI) | 1.40 [0.94, 2.10] |
| 58 PTB (<37w)‐Depth≤10‐12mm vs Untreated External Comparison Group Show forest plot | 6 | 1.026243E6 | Risk Ratio (IV, Random, 95% CI) | 1.64 [1.11, 2.42] |
| 58.1 LCp | 1 | 105 | Risk Ratio (IV, Random, 95% CI) | 0.52 [0.06, 4.83] |
| 58.2 LLETZ | 2 | 512896 | Risk Ratio (IV, Random, 95% CI) | 2.06 [1.10, 3.84] |
| 58.3 Excisional Treatment NOS | 3 | 513242 | Risk Ratio (IV, Random, 95% CI) | 1.57 [0.72, 3.41] |
| 59 PTB (<37w)‐Depth≤10‐12mm vs Untreated Internal Comparison Group Show forest plot | 2 | 3550 | Risk Ratio (IV, Random, 95% CI) | 0.90 [0.71, 1.14] |
| 59.1 LC | 1 | 70 | Risk Ratio (IV, Random, 95% CI) | 0.71 [0.05, 10.85] |
| 59.2 Excisional Treatment NOS | 1 | 3480 | Risk Ratio (IV, Random, 95% CI) | 0.90 [0.71, 1.14] |
| 60 PTB (<37w)‐Depth≤10‐12mm vs Untreated Colposcopy+/‐CIN+/‐Biopsy Show forest plot | 4 | 43145 | Risk Ratio (IV, Random, 95% CI) | 1.11 [0.85, 1.43] |
| 60.1 LLETZ | 2 | 33033 | Risk Ratio (IV, Random, 95% CI) | 1.38 [0.94, 2.02] |
| 60.2 Excisional Treatment NOS | 2 | 10112 | Risk Ratio (IV, Random, 95% CI) | 0.93 [0.80, 1.09] |
| 61 PTB (<37w)‐Depth≤15‐17mm vs Untreated External Comparison Group Show forest plot | 2 | 513145 | Risk Ratio (IV, Random, 95% CI) | 1.43 [1.19, 1.73] |
| 61.1 LC | 1 | 164 | Risk Ratio (IV, Random, 95% CI) | 0.67 [0.04, 11.18] |
| 61.2 LLETZ | 1 | 512981 | Risk Ratio (IV, Random, 95% CI) | 1.44 [1.19, 1.74] |
| 62 PTB (<37w)‐Depth≤15‐17mm vs Untreated Colposcopy+/‐CIN+/‐Biopsy Show forest plot | 3 | 34934 | Risk Ratio (IV, Random, 95% CI) | 1.18 [1.00, 1.40] |
| 62.1 LLETZ | 2 | 34278 | Risk Ratio (IV, Random, 95% CI) | 1.30 [0.85, 1.98] |
| 62.2 Excisional Treatment NOS | 1 | 656 | Risk Ratio (IV, Random, 95% CI) | 1.14 [0.76, 1.72] |
| 63 PTB (<37w)‐Depth≤20mm vs Untreated External Comparison Group Show forest plot | 2 | 513814 | Risk Ratio (IV, Random, 95% CI) | 1.60 [1.37, 1.87] |
| 63.1 LC | 1 | 183 | Risk Ratio (IV, Random, 95% CI) | 1.30 [0.28, 5.97] |
| 63.2 LLETZ | 1 | 513631 | Risk Ratio (IV, Random, 95% CI) | 1.61 [1.37, 1.88] |
| 64 PTB (<37w)‐Depth≤20mm vs Untreated Colposcopy+/‐CIN+/‐Biopsy Show forest plot | 2 | 34968 | Risk Ratio (IV, Random, 95% CI) | 1.52 [0.92, 2.51] |
| 64.1 LLETZ | 2 | 34968 | Risk Ratio (IV, Random, 95% CI) | 1.52 [0.92, 2.51] |
| 65 PTB (<37w)‐Depth≥10‐12mm vs Untreated External Comparison Group Show forest plot | 6 | 1.027812E6 | Risk Ratio (IV, Random, 95% CI) | 1.96 [1.66, 2.32] |
| 65.1 LC | 1 | 87 | Risk Ratio (IV, Random, 95% CI) | 4.64 [1.20, 17.88] |
| 65.2 LLETZ | 2 | 514051 | Risk Ratio (IV, Random, 95% CI) | 2.40 [1.30, 4.43] |
| 65.3 Excisional Treatment NOS | 3 | 513674 | Risk Ratio (IV, Random, 95% CI) | 1.82 [1.49, 2.22] |
| 66 PTB (<37w)‐Depth≥10‐12mm vs Untreated Internal Comparison Group Show forest plot | 2 | 3944 | Risk Ratio (IV, Random, 95% CI) | 2.05 [0.56, 7.48] |
| 66.1 LC | 1 | 52 | Risk Ratio (IV, Random, 95% CI) | 6.30 [0.79, 50.27] |
| 66.2 Excisional Treatment NOS | 1 | 3892 | Risk Ratio (IV, Random, 95% CI) | 1.39 [1.12, 1.73] |
| 67 PTB (<37w)‐Depth≥10‐12mm vs Untreated Colposcopy+/‐CIN+/‐Biopsy Show forest plot | 4 | 45275 | Risk Ratio (IV, Random, 95% CI) | 1.52 [1.37, 1.68] |
| 67.1 LLETZ | 2 | 34652 | Risk Ratio (IV, Random, 95% CI) | 1.80 [1.13, 2.87] |
| 67.2 Excisional Treatment NOS | 2 | 10623 | Risk Ratio (IV, Random, 95% CI) | 1.46 [1.29, 1.65] |
| 68 PTB (<37w)‐Depth≥15‐17mm vs Untreated External Comparison Group Show forest plot | 2 | 512503 | Risk Ratio (IV, Random, 95% CI) | 3.04 [1.62, 5.73] |
| 68.1 LC | 1 | 211 | Risk Ratio (IV, Random, 95% CI) | 4.92 [2.09, 11.59] |
| 68.2 LLETZ | 1 | 512292 | Risk Ratio (IV, Random, 95% CI) | 2.45 [2.06, 2.91] |
| 69 PTB (<37w)‐Depth≥15‐17mm vs Untreated Colposcopy+/‐CIN+/‐Biopsy Show forest plot | 3 | 33934 | Risk Ratio (IV, Random, 95% CI) | 2.30 [1.57, 3.35] |
| 69.1 LLETZ | 2 | 33407 | Risk Ratio (IV, Random, 95% CI) | 2.92 [1.14, 7.46] |
| 69.2 Excisional Treatment NOS | 1 | 527 | Risk Ratio (IV, Random, 95% CI) | 2.03 [1.33, 3.10] |
| 70 PTB (<37w)‐Depth≥20mm vs Untreated External Comparison Group Show forest plot | 2 | 511834 | Risk Ratio (IV, Random, 95% CI) | 3.63 [1.67, 7.90] |
| 70.1 LC | 1 | 192 | Risk Ratio (IV, Random, 95% CI) | 6.12 [2.57, 14.57] |
| 70.2 LLETZ | 1 | 511642 | Risk Ratio (IV, Random, 95% CI) | 2.68 [2.15, 3.35] |
| 71 PTB (<37w)‐Depth≥20mm vs Untreated Colposcopy+/‐CIN+/‐Biopsy Show forest plot | 2 | 32717 | Risk Ratio (IV, Random, 95% CI) | 4.32 [0.93, 20.03] |
| 71.1 LLETZ | 2 | 32717 | Risk Ratio (IV, Random, 95% CI) | 4.32 [0.93, 20.03] |
| 72 PTB (<37w)‐Depth 10/13‐15/16mm vs Untreated External Comparison Group Show forest plot | 1 | 511959 | Risk Ratio (IV, Random, 95% CI) | 1.31 [0.99, 1.72] |
| 72.1 LLETZ | 1 | 511959 | Risk Ratio (IV, Random, 95% CI) | 1.31 [0.99, 1.72] |
| 73 PTB (<37w)‐Depth 10/13‐15/16mm vs Untreated Colposcopy+/‐CIN+/‐Biopsy Show forest plot | 3 | 33693 | Risk Ratio (IV, Random, 95% CI) | 1.14 [0.90, 1.44] |
| 73.1 LLETZ | 2 | 33153 | Risk Ratio (IV, Random, 95% CI) | 1.12 [0.80, 1.57] |
| 73.2 Excisional Treatment NOS | 1 | 540 | Risk Ratio (IV, Random, 95% CI) | 1.29 [0.79, 2.12] |
| 74 PTB (<37w)‐Depth 15/16‐19/20mm vs Untreated External Comparison Group Show forest plot | 2 | 511660 | Risk Ratio (IV, Random, 95% CI) | 2.16 [1.65, 2.84] |
| 74.1 LC | 1 | 169 | Risk Ratio (IV, Random, 95% CI) | 2.26 [0.50, 10.08] |
| 74.2 LLETZ | 1 | 511491 | Risk Ratio (IV, Random, 95% CI) | 2.16 [1.64, 2.84] |
| 75 PTB (<37w)‐Depth 15/16‐19/20mm vs Untreated Colposcopy+/‐CIN+/‐Biopsy Show forest plot | 2 | 32598 | Risk Ratio (IV, Random, 95% CI) | 2.38 [1.04, 5.42] |
| 75.1 LLETZ | 2 | 32598 | Risk Ratio (IV, Random, 95% CI) | 2.38 [1.04, 5.42] |
| Outcome or subgroup title | No. of studies | No. of participants | Statistical method | Effect size |
| 1 sPTB (<37w) Show forest plot | 14 | 1.024731E6 | Risk Ratio (IV, Random, 95% CI) | 1.76 [1.47, 2.11] |
| 1.1 CKC vs No Treatment | 3 | 7320 | Risk Ratio (IV, Random, 95% CI) | 3.53 [2.05, 6.05] |
| 1.2 LC vs No Treatment | 2 | 222 | Risk Ratio (IV, Random, 95% CI) | 1.40 [0.51, 3.81] |
| 1.3 NETZ vs No Treatment | 1 | 7399 | Risk Ratio (IV, Random, 95% CI) | 5.83 [3.80, 8.95] |
| 1.4 LLETZ vs No Treatment | 11 | 773123 | Risk Ratio (IV, Random, 95% CI) | 1.60 [1.22, 2.08] |
| 1.5 LA vs No Treatment | 1 | 356 | Risk Ratio (IV, Random, 95% CI) | 0.95 [0.34, 2.68] |
| 1.6 CT vs No Treatment | 1 | 58 | Risk Ratio (IV, Random, 95% CI) | 1.86 [0.08, 43.87] |
| 1.7 Excisional Treatment NOS vs No Treatment | 2 | 95985 | Risk Ratio (IV, Random, 95% CI) | 1.70 [1.17, 2.46] |
| 1.8 Ablative Treatment NOS vs No Treatment | 2 | 134720 | Risk Ratio (IV, Random, 95% CI) | 1.42 [1.20, 1.70] |
| 1.9 Treatment NOS vs No Treatment | 1 | 5548 | Risk Ratio (IV, Random, 95% CI) | 1.30 [1.00, 1.69] |
| 2 sPTB (<32‐34w) Show forest plot | 7 | 655675 | Risk Ratio (IV, Random, 95% CI) | 2.63 [1.91, 3.62] |
| 2.1 CKC vs No Treatment | 2 | 6990 | Risk Ratio (IV, Random, 95% CI) | 4.38 [1.08, 17.65] |
| 2.2 NETZ vs No Treatment | 1 | 7399 | Risk Ratio (IV, Random, 95% CI) | 10.53 [4.33, 25.65] |
| 2.3 LLETZ vs No Treatment | 6 | 530985 | Risk Ratio (IV, Random, 95% CI) | 2.37 [1.82, 3.08] |
| 2.4 CT vs No Treatment | 1 | 58 | Risk Ratio (IV, Random, 95% CI) | 1.86 [0.08, 43.87] |
| 2.5 Excisional Treatment NOS vs No Treatment | 1 | 264 | Risk Ratio (IV, Random, 95% CI) | 13.92 [0.73, 266.57] |
| 2.6 Ablative Treatment NOS vs No Treatment | 1 | 109979 | Risk Ratio (IV, Random, 95% CI) | 1.57 [0.97, 2.53] |
| 3 sPTB (<28w) Show forest plot | 2 | 626670 | Risk Ratio (IV, Random, 95% CI) | 3.18 [1.64, 6.16] |
| 3.1 CKC vs No Treatment | 1 | 6956 | Risk Ratio (IV, Random, 95% CI) | 5.41 [0.74, 39.84] |
| 3.2 NETZ vs No Treatment | 1 | 7399 | Risk Ratio (IV, Random, 95% CI) | 14.74 [4.50, 48.32] |
| 3.3 LLETZ vs No Treatment | 2 | 502336 | Risk Ratio (IV, Random, 95% CI) | 2.57 [1.96, 3.36] |
| 3.4 Ablative Treatment NOS vs No Treatment | 1 | 109979 | Risk Ratio (IV, Random, 95% CI) | 1.22 [0.54, 2.74] |
| 4 pPROM (<37w) Show forest plot | 21 | 477011 | Risk Ratio (IV, Random, 95% CI) | 2.36 [1.76, 3.17] |
| 4.1 CKC vs No Treatment | 4 | 36733 | Risk Ratio (IV, Random, 95% CI) | 4.11 [2.05, 8.25] |
| 4.2 LC vs No Treatment | 4 | 635 | Risk Ratio (IV, Random, 95% CI) | 1.89 [0.97, 3.66] |
| 4.3 NETZ vs No Treatment | 1 | 7279 | Risk Ratio (IV, Random, 95% CI) | 8.83 [5.39, 14.46] |
| 4.4 LLETZ vs No Treatment | 8 | 302974 | Risk Ratio (IV, Random, 95% CI) | 2.15 [1.48, 3.12] |
| 4.5 LA vs No Treatment | 2 | 548 | Risk Ratio (IV, Random, 95% CI) | 1.62 [0.74, 3.55] |
| 4.6 CT vs No Treatment | 1 | 180 | Risk Ratio (IV, Random, 95% CI) | 1.13 [0.21, 6.00] |
| 4.7 Excisional Treatment NOS vs No Treatment | 5 | 98372 | Risk Ratio (IV, Random, 95% CI) | 2.66 [1.13, 6.24] |
| 4.8 Ablative Treatment NOS vs No Treatment | 1 | 24742 | Risk Ratio (IV, Random, 95% CI) | 1.47 [1.01, 2.15] |
| 4.9 Treatment NOS vs No Treatment | 1 | 5548 | Risk Ratio (IV, Random, 95% CI) | 1.44 [1.05, 1.97] |
| 5 pPROM (<32w) Show forest plot | 1 | 72788 | Risk Ratio (IV, Random, 95% CI) | 8.30 [2.03, 33.98] |
| 5.1 CKC vs No Treatment | 1 | 6842 | Risk Ratio (IV, Random, 95% CI) | 5.32 [0.72, 39.19] |
| 5.2 NETZ vs No Treatment | 1 | 7279 | Risk Ratio (IV, Random, 95% CI) | 25.38 [9.80, 65.74] |
| 5.3 LLETZ vs No Treatment | 1 | 58667 | Risk Ratio (IV, Random, 95% CI) | 3.74 [1.66, 8.41] |
| 6 pPROM (<28w) Show forest plot | 1 | 72788 | Risk Ratio (IV, Random, 95% CI) | 9.09 [1.04, 79.18] |
| 6.1 CKC vs No Treatment | 1 | 6842 | Risk Ratio (IV, Random, 95% CI) | 6.64 [0.38, 115.16] |
| 6.2 NETZ vs No Treatment | 1 | 7279 | Risk Ratio (IV, Random, 95% CI) | 43.51 [11.48, 164.86] |
| 6.3 LLETZ vs No Treatment | 1 | 58667 | Risk Ratio (IV, Random, 95% CI) | 1.81 [0.25, 13.08] |
| 7 Threatened PTB Show forest plot | 5 | 903 | Risk Ratio (IV, Random, 95% CI) | 2.44 [1.37, 4.33] |
| 7.1 CKC vs No Treatment | 1 | 126 | Risk Ratio (IV, Random, 95% CI) | 1.40 [0.45, 4.34] |
| 7.2 LC vs No Treatment | 1 | 112 | Risk Ratio (IV, Random, 95% CI) | 1.56 [0.53, 4.62] |
| 7.3 LLETZ vs No Treatment | 1 | 237 | Risk Ratio (IV, Random, 95% CI) | 4.0 [0.75, 21.37] |
| 7.4 Excisional Treatment NOS vs No Treatment | 2 | 428 | Risk Ratio (IV, Random, 95% CI) | 4.51 [1.68, 12.06] |
| 8 Chorioamnionitis Show forest plot | 4 | 29198 | Risk Ratio (IV, Random, 95% CI) | 3.43 [1.36, 8.64] |
| 8.1 CKC vs No Treatment | 1 | 28531 | Risk Ratio (IV, Random, 95% CI) | 2.39 [0.61, 9.43] |
| 8.2 LC vs No Treatment | 1 | 112 | Risk Ratio (IV, Random, 95% CI) | 3.33 [0.14, 80.11] |
| 8.3 LLETZ vs No Treatment | 1 | 237 | Risk Ratio (IV, Random, 95% CI) | 10.00 [1.19, 84.15] |
| 8.4 Excisional Treatment NOS vs No Treatment | 1 | 318 | Risk Ratio (IV, Random, 95% CI) | 3.0 [0.51, 17.68] |
| 9 Caeserean Section Show forest plot | 36 | 272360 | Risk Ratio (IV, Random, 95% CI) | 1.06 [0.98, 1.14] |
| 9.1 CKC vs No Treatment | 6 | 30462 | Risk Ratio (IV, Random, 95% CI) | 1.24 [0.91, 1.68] |
| 9.2 LC vs No Treatment | 5 | 1038 | Risk Ratio (IV, Random, 95% CI) | 1.38 [0.90, 2.11] |
| 9.3 LLETZ vs No Treatment | 14 | 5436 | Risk Ratio (IV, Random, 95% CI) | 1.04 [0.94, 1.15] |
| 9.4 LA vs No Treatment | 4 | 1258 | Risk Ratio (IV, Random, 95% CI) | 0.86 [0.61, 1.20] |
| 9.5 CT vs No Treatment | 2 | 238 | Risk Ratio (IV, Random, 95% CI) | 2.47 [1.02, 6.01] |
| 9.6 Excisional Treatment NOS vs No Treatment | 9 | 203532 | Risk Ratio (IV, Random, 95% CI) | 1.03 [0.89, 1.20] |
| 9.7 Ablative Treatment NOS vs No Treatment | 2 | 24848 | Risk Ratio (IV, Random, 95% CI) | 1.38 [0.42, 4.58] |
| 9.8 Treatment NOS vs No Treatment | 1 | 5548 | Risk Ratio (IV, Random, 95% CI) | 1.13 [1.00, 1.27] |
| 10 Instrumental Deliveries (ventouse/forceps) Show forest plot | 16 | 9588 | Risk Ratio (IV, Random, 95% CI) | 0.97 [0.88, 1.08] |
| 10.1 CKC vs No Treatment | 2 | 454 | Risk Ratio (IV, Random, 95% CI) | 1.33 [0.66, 2.70] |
| 10.2 LC vs No Treatment | 2 | 668 | Risk Ratio (IV, Random, 95% CI) | 1.16 [0.65, 2.07] |
| 10.3 LLETZ vs No Treatment | 6 | 1418 | Risk Ratio (IV, Random, 95% CI) | 0.89 [0.68, 1.17] |
| 10.4 LA vs No Treatment | 3 | 550 | Risk Ratio (IV, Random, 95% CI) | 0.94 [0.62, 1.41] |
| 10.5 Excisional Treatment NOS vs No Treatment | 3 | 950 | Risk Ratio (IV, Random, 95% CI) | 0.71 [0.46, 1.10] |
| 10.6 Treatment NOS vs No Treatment | 1 | 5548 | Risk Ratio (IV, Random, 95% CI) | 1.01 [0.89, 1.15] |
| 11 Precipitous Labour (<2hours) Show forest plot | 5 | 1059 | Risk Ratio (IV, Random, 95% CI) | 1.26 [0.80, 1.96] |
| 11.1 CKC vs No Treatment | 2 | 289 | Risk Ratio (IV, Random, 95% CI) | 1.24 [0.47, 3.27] |
| 11.2 LLETZ vs No Treatment | 4 | 770 | Risk Ratio (IV, Random, 95% CI) | 1.26 [0.76, 2.08] |
| 12 Prolonged labour (>12hours) Show forest plot | 7 | 1854 | Risk Ratio (IV, Random, 95% CI) | 1.25 [0.92, 1.69] |
| 12.1 CKC vs No Treatment | 2 | 325 | Risk Ratio (IV, Random, 95% CI) | 1.99 [0.89, 4.45] |
| 12.2 LC vs No Treatment | 1 | 500 | Risk Ratio (IV, Random, 95% CI) | 0.92 [0.41, 2.04] |
| 12.3 LLETZ vs No Treatment | 4 | 673 | Risk Ratio (IV, Random, 95% CI) | 0.96 [0.55, 1.70] |
| 12.4 LA vs No Treatment | 2 | 356 | Risk Ratio (IV, Random, 95% CI) | 1.41 [0.88, 2.26] |
| 13 Induction of Labour Show forest plot | 11 | 4668 | Risk Ratio (IV, Random, 95% CI) | 1.01 [0.89, 1.15] |
| 13.1 CKC vs No Treatment | 2 | 137 | Risk Ratio (IV, Random, 95% CI) | 1.11 [0.54, 2.29] |
| 13.2 LLETZ vs No treatment | 8 | 4056 | Risk Ratio (IV, Random, 95% CI) | 0.99 [0.82, 1.20] |
| 13.3 CT vs No Treatment | 1 | 58 | Risk Ratio (IV, Random, 95% CI) | 0.61 [0.22, 1.66] |
| 13.4 Excisional Treatment NOS vs No Treatment | 2 | 417 | Risk Ratio (IV, Random, 95% CI) | 0.90 [0.64, 1.28] |
| 14 Oxytocin Use Show forest plot | 6 | 2006 | Risk Ratio (IV, Random, 95% CI) | 0.90 [0.64, 1.26] |
| 14.1 CKC vs No Treatment | 1 | 103 | Risk Ratio (IV, Random, 95% CI) | 0.98 [0.59, 1.63] |
| 14.2 LLETZ vs No Treatment | 4 | 1804 | Risk Ratio (IV, Random, 95% CI) | 0.76 [0.43, 1.34] |
| 14.3 Excisional Treatment NOS vs No Treatment | 1 | 99 | Risk Ratio (IV, Random, 95% CI) | 1.18 [0.67, 2.05] |
| 15 Epidural Use Show forest plot | 5 | 105488 | Risk Ratio (IV, Random, 95% CI) | 1.02 [0.68, 1.53] |
| 15.1 LLETZ vs No Treatment | 4 | 818 | Risk Ratio (IV, Random, 95% CI) | 0.86 [0.64, 1.16] |
| 15.2 Excisional Treatment NOS vs No Treatment | 1 | 104670 | Risk Ratio (IV, Random, 95% CI) | 1.79 [1.29, 2.50] |
| 16 Pethidine Use Show forest plot | 2 | 394 | Risk Ratio (IV, Random, 95% CI) | 0.94 [0.72, 1.24] |
| 16.1 LLETZ vs No treatment | 2 | 394 | Risk Ratio (IV, Random, 95% CI) | 0.94 [0.72, 1.24] |
| 17 Analgesia Use NOS Show forest plot | 1 | 103 | Risk Ratio (IV, Random, 95% CI) | 1.11 [0.62, 1.98] |
| 17.1 CKC vs No Treatment | 1 | 103 | Risk Ratio (IV, Random, 95% CI) | 1.11 [0.62, 1.98] |
| 18 Cervical stenosis Show forest plot | 2 | 680 | Risk Ratio (IV, Random, 95% CI) | 2.26 [0.24, 21.59] |
| 18.1 LC vs No Treatment | 1 | 500 | Risk Ratio (IV, Random, 95% CI) | 3.0 [0.12, 73.29] |
| 18.2 CT vs No Treatment | 1 | 180 | Risk Ratio (IV, Random, 95% CI) | 1.71 [0.07, 41.31] |
| 19 Antepartum Haemorrhage Show forest plot | 4 | 1245 | Risk Ratio (IV, Random, 95% CI) | 1.11 [0.40, 3.12] |
| 19.1 CKC vs No Treatment | 1 | 34 | Risk Ratio (IV, Random, 95% CI) | 1.24 [0.26, 5.83] |
| 19.2 LC vs No Treatment | 1 | 168 | Risk Ratio (IV, Random, 95% CI) | 17.84 [0.98, 325.68] |
| 19.3 LLETZ vs No Treatment | 2 | 277 | Risk Ratio (IV, Random, 95% CI) | 0.52 [0.16, 1.67] |
| 19.4 LA vs No Treatment | 1 | 708 | Risk Ratio (IV, Random, 95% CI) | 8.00 [0.90, 71.18] |
| 19.5 CT vs No Treatment | 1 | 58 | Risk Ratio (IV, Random, 95% CI) | 0.41 [0.07, 2.25] |
| 20 Postpartum Haemorrhage (>600ml) Show forest plot | 1 | 149 | Risk Ratio (IV, Random, 95% CI) | 4.60 [1.38, 15.36] |
| 20.1 CKC vs No Treatment | 1 | 149 | Risk Ratio (IV, Random, 95% CI) | 4.60 [1.38, 15.36] |
| 21 Massive Obstetric Haemorrhage (>1000ml) Show forest plot | 1 | 149 | Risk Ratio (IV, Random, 95% CI) | 3.95 [0.45, 34.48] |
| 21.1 CKC vs No Treatment | 1 | 149 | Risk Ratio (IV, Random, 95% CI) | 3.95 [0.45, 34.48] |
| 22 Cervical cerclage Show forest plot | 8 | 141300 | Risk Ratio (IV, Random, 95% CI) | 14.29 [2.85, 71.65] |
| 22.1 CKC vs No Treatment | 3 | 30744 | Risk Ratio (IV, Random, 95% CI) | 31.42 [2.32, 426.22] |
| 22.2 LC vs No Treatment | 1 | 112 | Risk Ratio (IV, Random, 95% CI) | 6.68 [0.83, 53.69] |
| 22.3 LLETZ vs No Treatment | 1 | 56 | Risk Ratio (IV, Random, 95% CI) | 11.00 [0.64, 189.96] |
| 22.4 Excisional Treatment NOS vs No Treatment | 2 | 104840 | Risk Ratio (IV, Random, 95% CI) | 42.45 [28.99, 62.16] |
| 22.5 Treatment NOS vs No Treatment | 1 | 5548 | Risk Ratio (IV, Random, 95% CI) | 2.16 [1.24, 3.76] |
| Outcome or subgroup title | No. of studies | No. of participants | Statistical method | Effect size |
| 1 LBW (<2500g) Show forest plot | 30 | 1.348206E6 | Risk Ratio (IV, Random, 95% CI) | 1.81 [1.58, 2.07] |
| 1.1 CKC vs No Treatment | 5 | 30304 | Risk Ratio (IV, Random, 95% CI) | 2.51 [1.78, 3.53] |
| 1.2 LC vs No Treatment | 4 | 786 | Risk Ratio (IV, Random, 95% CI) | 1.76 [0.72, 4.35] |
| 1.3 LLETZ vs No Treatment | 12 | 3357 | Risk Ratio (IV, Random, 95% CI) | 2.11 [1.51, 2.94] |
| 1.4 LA vs No Treatment | 4 | 1104 | Risk Ratio (IV, Random, 95% CI) | 1.07 [0.59, 1.92] |
| 1.5 CT vs No Treatment | 1 | 58 | Risk Ratio (IV, Random, 95% CI) | 3.67 [0.47, 28.47] |
| 1.6 Excisional Treatment NOS vs No Treatment | 10 | 823648 | Risk Ratio (IV, Random, 95% CI) | 2.01 [1.62, 2.49] |
| 1.7 Ablative Treatment NOS vs No Treatment | 4 | 483402 | Risk Ratio (IV, Random, 95% CI) | 1.36 [1.19, 1.55] |
| 1.8 Treatment NOS vs No Treatment | 1 | 5547 | Risk Ratio (IV, Random, 95% CI) | 1.35 [1.14, 1.60] |
| 2 LBW (<2000g) Show forest plot | 3 | 74981 | Risk Ratio (IV, Random, 95% CI) | 2.49 [0.97, 6.36] |
| 2.1 LC vs No Treatment | 1 | 181 | Risk Ratio (IV, Random, 95% CI) | 4.46 [1.36, 14.59] |
| 2.2 LA vs No Treatment | 2 | 772 | Risk Ratio (IV, Random, 95% CI) | 0.95 [0.39, 2.29] |
| 2.3 Excisional Treatment NOS vs No Treatment | 1 | 74028 | Risk Ratio (IV, Random, 95% CI) | 4.60 [3.32, 6.37] |
| 3 LBW (<1500g) Show forest plot | 5 | 76836 | Risk Ratio (IV, Random, 95% CI) | 3.00 [1.54, 5.85] |
| 3.1 LC vs No Treatment | 1 | 181 | Risk Ratio (IV, Random, 95% CI) | 12.75 [1.53, 106.44] |
| 3.2 LLETZ vs No Treatment | 1 | 378 | Risk Ratio (IV, Random, 95% CI) | 7.0 [0.36, 134.59] |
| 3.3 LA vs No Treatment | 2 | 772 | Risk Ratio (IV, Random, 95% CI) | 0.68 [0.16, 2.80] |
| 3.4 Excisional Treatment NOS vs No Treatment | 2 | 75505 | Risk Ratio (IV, Random, 95% CI) | 3.34 [2.02, 5.54] |
| 4 LBW (<1000g) Show forest plot | 2 | 2185 | Risk Ratio (IV, Random, 95% CI) | 2.09 [0.06, 74.71] |
| 4.1 LA vs No Treatment | 1 | 708 | Risk Ratio (IV, Random, 95% CI) | 0.29 [0.01, 5.50] |
| 4.2 Excisional Treatment NOS vs No Treatment | 1 | 1477 | Risk Ratio (IV, Random, 95% CI) | 11.10 [1.44, 85.79] |
| 5 NICU Admission Show forest plot | 8 | 2557 | Risk Ratio (IV, Random, 95% CI) | 1.45 [1.16, 1.81] |
| 5.1 CKC vs No Treatment | 2 | 71 | Risk Ratio (IV, Random, 95% CI) | 1.40 [0.52, 3.75] |
| 5.2 LLETZ vs No Treatment | 5 | 1994 | Risk Ratio (IV, Random, 95% CI) | 1.42 [1.01, 1.99] |
| 5.3 CT vs No Treatment | 1 | 58 | Risk Ratio (IV, Random, 95% CI) | 2.44 [0.29, 20.49] |
| 5.4 Excisional Treatment NOS vs No Treatment | 2 | 434 | Risk Ratio (IV, Random, 95% CI) | 1.76 [1.13, 2.75] |
| 6 Perinatal Mortality Show forest plot | 23 | 1.659433E6 | Risk Ratio (IV, Random, 95% CI) | 1.51 [1.13, 2.03] |
| 6.1 CKC vs No Treatment | 7 | 50588 | Risk Ratio (IV, Random, 95% CI) | 1.46 [0.83, 2.57] |
| 6.2 LC vs No Treatment | 3 | 906 | Risk Ratio (IV, Random, 95% CI) | 1.89 [0.26, 13.87] |
| 6.3 NETZ vs No Treatment | 1 | 7399 | Risk Ratio (IV, Random, 95% CI) | 9.99 [3.13, 31.92] |
| 6.4 LLETZ vs No Treatment | 7 | 302271 | Risk Ratio (IV, Random, 95% CI) | 1.53 [0.88, 2.67] |
| 6.5 LA vs No Treatment | 2 | 258 | Risk Ratio (IV, Random, 95% CI) | 3.0 [0.12, 72.74] |
| 6.6 CT vs No Treatment | 2 | 238 | Risk Ratio (IV, Random, 95% CI) | 0.19 [0.01, 4.59] |
| 6.7 Excisional Treatment NOS vs No Treatment | 5 | 820028 | Risk Ratio (IV, Random, 95% CI) | 1.85 [1.02, 3.36] |
| 6.8 Ablative Treatment NOS vs No Treatment | 2 | 472197 | Risk Ratio (IV, Random, 95% CI) | 0.69 [0.42, 1.13] |
| 6.9 Treatment NOS vs No Treatment | 1 | 5548 | Risk Ratio (IV, Random, 95% CI) | 1.00 [0.63, 1.58] |
| 7 Perinatal Mortality (<37w) Show forest plot | 1 | 73992 | Risk Ratio (IV, Random, 95% CI) | 9.40 [2.01, 43.89] |
| 7.1 CKC vs No Treatment | 1 | 6956 | Risk Ratio (IV, Random, 95% CI) | 5.33 [0.31, 90.71] |
| 7.2 NETZ vs No Treatment | 1 | 7399 | Risk Ratio (IV, Random, 95% CI) | 30.96 [8.71, 110.13] |
| 7.3 LLETZ vs No Treatment | 1 | 59637 | Risk Ratio (IV, Random, 95% CI) | 3.92 [1.24, 12.38] |
| 8 Perinatal Mortality (<32w) Show forest plot | 1 | 73992 | Risk Ratio (IV, Random, 95% CI) | 12.81 [2.70, 60.87] |
| 8.1 CKC vs No Treatment | 1 | 6956 | Risk Ratio (IV, Random, 95% CI) | 6.75 [0.39, 117.10] |
| 8.2 NETZ vs No Treatment | 1 | 7399 | Risk Ratio (IV, Random, 95% CI) | 44.23 [11.67, 167.61] |
| 8.3 LLETZ vs No Treatment | 1 | 59637 | Risk Ratio (IV, Random, 95% CI) | 5.43 [1.71, 17.30] |
| 9 Perinatal Mortality (<28w) Show forest plot | 1 | 73992 | Risk Ratio (IV, Random, 95% CI) | 13.76 [2.37, 79.89] |
| 9.1 CKC vs No Treatment | 1 | 6956 | Risk Ratio (IV, Random, 95% CI) | 9.21 [0.51, 164.95] |
| 9.2 NETZ vs No Treatment | 1 | 7399 | Risk Ratio (IV, Random, 95% CI) | 51.61 [13.17, 202.29] |
| 9.3 LLETZ vs No Treatment | 1 | 59637 | Risk Ratio (IV, Random, 95% CI) | 4.49 [1.09, 18.45] |
| 10 Stillbirth Show forest plot | 12 | 249855 | Risk Ratio (IV, Random, 95% CI) | 0.98 [0.63, 1.52] |
| 10.1 CKC vs No Treatment | 3 | 935 | Risk Ratio (IV, Random, 95% CI) | 1.61 [0.48, 5.40] |
| 10.2 LC vs No Treatment | 2 | 725 | Risk Ratio (IV, Random, 95% CI) | 0.33 [0.03, 3.18] |
| 10.3 LLETZ vs No Treatment | 4 | 242473 | Risk Ratio (IV, Random, 95% CI) | 1.42 [0.62, 3.26] |
| 10.4 LA vs No Treatment | 1 | 64 | Risk Ratio (IV, Random, 95% CI) | 0.0 [0.0, 0.0] |
| 10.5 Excisional Treatment NOS vs No Treatment | 1 | 110 | Risk Ratio (IV, Random, 95% CI) | 0.0 [0.0, 0.0] |
| 10.6 Treatment NOS vs No Treatment | 1 | 5548 | Risk Ratio (IV, Random, 95% CI) | 0.77 [0.42, 1.40] |
| 11 Apgar score (≤5)(1min) Show forest plot | 1 | 225 | Risk Ratio (IV, Random, 95% CI) | 0.57 [0.12, 2.68] |
| 11.1 LC vs No Treatment | 1 | 225 | Risk Ratio (IV, Random, 95% CI) | 0.57 [0.12, 2.68] |
| 12 Apgar score (<7)(1min) Show forest plot | 1 | 152 | Risk Ratio (IV, Random, 95% CI) | 0.63 [0.07, 5.71] |
| 12.1 LLETZ vs No Treatment | 1 | 87 | Risk Ratio (IV, Random, 95% CI) | 0.16 [0.01, 3.30] |
| 12.2 CKC vs No Treatment | 1 | 65 | Risk Ratio (IV, Random, 95% CI) | 1.61 [0.15, 16.90] |
| 13 Apgar score (<7)(5min) Show forest plot | 2 | 297 | Risk Ratio (IV, Random, 95% CI) | 0.82 [0.19, 3.59] |
| 13.1 CKC vs No Treatment | 1 | 32 | Risk Ratio (IV, Random, 95% CI) | 0.0 [0.0, 0.0] |
| 13.2 LLETZ vs No Treatment | 1 | 120 | Risk Ratio (IV, Random, 95% CI) | 0.93 [0.16, 5.37] |
| 13.3 CT vs No Treatment | 1 | 58 | Risk Ratio (IV, Random, 95% CI) | 0.61 [0.04, 9.28] |
| 13.4 Excisional Treatment NOS vs No Treatment | 1 | 87 | Risk Ratio (IV, Random, 95% CI) | 0.0 [0.0, 0.0] |