Monoterapia con pembrolizumab versus quimioterapia para el tratamiento del carcinoma urotelial avanzado con evolución de la enfermedad durante o después de la quimioterapia con platino. una revisión Cochrane rápida
Referencias
References to studies included in this review
References to studies excluded from this review
Additional references
References to other published versions of this review
Characteristics of studies
Characteristics of included studies [ordered by study ID]
Ir a:
| Methods | Parallel RCT Randomisation ratio: 1:1 Superiority design | |
| Participants | Inclusion criteria:
Exclusion criteria:
Characteristics:
| |
| Interventions | Number of study centres: 748 patients were screened for enrolment in 120 sites in 29 countries (Australia, Austria, Belgium, Canada, Chile, Denmark, France, Germany, Hungary, Ireland, Israel, Italy, Japan, Republic of Korea, Netherlands, New Zealand, Norway, Peru, Poland, Portugal, Puerto Rico, Romania, Singapore, Spain, Sweden, Taiwan, Turkey, United Kingdom, United States). Run‐in period: 11/2014‐11/2015. Extension period: no. Intervention: pembrolizumab 200 mg IV on Day 1 Q3W; 270 randomised patients, 266 patients received treatment. Comparison: paclitaxel 175 mg/m2 IV or docetaxel 75 mg/m2 IV or vinflunine 320 mg/m2 IV, on Day 1 Q3W, 272 randomised patients, 255 received treatment, 84 patients received docetaxel, 84 received paclitaxel, and 87 received vinflunine. Other co‐interventions for both groups: no. | |
| Outcomes | Primary outcome measures Overall survival:
Progression‐free survival:
Secondary outcome measures Objective response rate:
Progression‐free survival per modified RECIST 1.1:
Objective response reaction per modified RECIST 1.1:
Adverse event (time frame: up to 31 months):
Discontinuation of study drug due to an adverse event:
Quality of life:
| |
| Funding sources | Supported by Merck (Kenilworth, NJ) | |
| Declarations of interest |
| |
| Notes |
| |
| Risk of bias | ||
| Bias | Authors' judgement | Support for judgement |
| Random sequence generation (selection bias) | Low risk | Quote from publication: "...central randomisation as described in the protocol". Comment: Randomization was performed adequately. |
| Allocation concealment (selection bias) | Low risk | Quote from publication: "Centrally...interactive voice response system/integrated web response system". Comment: allocation concealment was performed adequately. |
| Blinding of participants and personnel (performance bias) | Unclear risk | Quote from publication: "...there was no blinding". Comment: overall survival was measured and reported. It might be conceivable that even objective outcomes are influenced by lack of blinding. We finally judge that there is an unclear risk of bias. |
| Blinding of participants and personnel (performance bias) | High risk | Quote from publication: "...there was no blinding". Comment: progression‐free survival, treatment‐related mortality, discontinuation due to adverse events, and adverse events were measured and reported (quality of life was not listed as a predefined outcome in ClinicalTrials.gov registry (NCT02256436) and was not reported in the full text publication, but results were presented in abstract form at ASCO GU 2017 conference (Bellmunt 2017)). We judge that subjective outcomes are likely to be influenced by lack of blinding leading to high risk of bias. For response rate, we are uncertain if lack of blinding of participants and personnel might have influenced results, and therefore judged that there is unclear risk of bias for this outcome. |
| Blinding of outcome assessment (detection bias) | Low risk | Quote from publication: no applicable quote. Comment: Not likely that outcome assessment for overall survival would be influenced by lack of blinding. |
| Blinding of outcome assessment (detection bias) | High risk | Quote from publication: no applicable quote. Comment: We judged that the assessment of these subjective outcomes is likely to be influenced by the lack of blinding. |
| Blinding of outcome assessment (detection bias) | Low risk | Quote from publication: "Imaging data were centrally reviewed, central imaging vendor were blinded to the subject treatment, imaging results were blinded to the clinical study team". Comment: Adequate assurance of blinding |
| Incomplete outcome data (attrition bias) | Low risk | All patients randomised were included in the analysis for overall survival, progression‐free survival, and response rate. |
| Incomplete outcome data (attrition bias) | Low risk | Missing outcome data are less than 10% in both groups (randomised: 270 pembrolizumab, 272 chemotherapy; in evaluation: 266 pembrolizumab, 253 chemotherapy). We judge that this number of withdrawals is not enough to have a clinically relevant effect. |
| Incomplete outcome data (attrition bias) | Low risk | Missing outcome data are less than 10% in both groups (randomised: 270 pembrolizumab, 272 chemotherapy; in evaluation: 255 pembrolizumab, 255 chemotherapy). We judge that this number of withdrawals is not enough to have a clinically relevant effect. |
| Selective reporting (reporting bias) | Unclear risk | Quality of life was not listed as a predefined outcome in the ClinicalTrials.gov registry (NCT02256436) |
| Other bias | Low risk | No other potential bias identified. |
ASCO GU: Genitourinary Cancers Symposium of the American Society of Clinical Oncology; CNS: central nervous system; ECOG: Eastern Cooperative Oncology Group; HIV: human immunodeficiency virus; IV: intravenous; mAb: monoclonal antibody; NCT: ClinicalTrials.gov identifier; PD‐1: programmed cell death protein 1; PD‐L1: programmed cell death protein 1 ligand; PSA: prostatic‐specific antigen; Q3W: every three weeks; RCT: randomised controlled trial; RECIST: Response Evaluation Criteria in Solid Tumors.
Characteristics of excluded studies [ordered by study ID]
Ir a:
| Study | Reason for exclusion |
| Wrong comparator. | |
| First‐line therapy. | |
| Comment to another article. | |
| Wrong intervention. | |
| Comment to another article. | |
| First‐line therapy. | |
| Comment to another article. |
Data and analyses
| Outcome or subgroup title | No. of studies | No. of participants | Statistical method | Effect size |
| 1 Overall survival Show forest plot | 1 | 542 | Hazard Ratio (Random, 95% CI) | 0.73 [0.59, 0.90] |
| Analysis 1.1  Comparison 1 Pembrolizumab versus chemotherapy, Outcome 1 Overall survival. | ||||
| 2 Quality of life (change from baseline to week 15) Show forest plot | 1 | 520 | Mean Difference (IV, Random, 95% CI) | 9.05 [4.41, 13.69] |
| Analysis 1.2  Comparison 1 Pembrolizumab versus chemotherapy, Outcome 2 Quality of life (change from baseline to week 15). | ||||
| 3 Progression‐free survival Show forest plot | 1 | 542 | Hazard Ratio (Random, 95% CI) | 0.98 [0.81, 1.19] |
| Analysis 1.3  Comparison 1 Pembrolizumab versus chemotherapy, Outcome 3 Progression‐free survival. | ||||
| 4 Response rate (partial and complete response) Show forest plot | 1 | 542 | Risk Ratio (M‐H, Random, 95% CI) | 1.85 [1.24, 2.77] |
| Analysis 1.4  Comparison 1 Pembrolizumab versus chemotherapy, Outcome 4 Response rate (partial and complete response). | ||||
| 5 Treatment‐related mortality Show forest plot | 1 | 521 | Risk Ratio (M‐H, Random, 95% CI) | 0.96 [0.24, 3.79] |
| Analysis 1.5  Comparison 1 Pembrolizumab versus chemotherapy, Outcome 5 Treatment‐related mortality. | ||||
| 6 Discontinuation due to adverse event (any grade) Show forest plot | 1 | 521 | Risk Ratio (M‐H, Random, 95% CI) | 0.66 [0.39, 1.10] |
| Analysis 1.6  Comparison 1 Pembrolizumab versus chemotherapy, Outcome 6 Discontinuation due to adverse event (any grade). | ||||
| 7 Serious adverse events (irrespective of attribution to treatment) Show forest plot | 1 | Risk Ratio (M‐H, Random, 95% CI) | Subtotals only | |
| Analysis 1.7  Comparison 1 Pembrolizumab versus chemotherapy, Outcome 7 Serious adverse events (irrespective of attribution to treatment). | ||||
| 7.1 Serious adverse events (Grade 3, 4, or 5) | 1 | 521 | Risk Ratio (M‐H, Random, 95% CI) | 0.83 [0.72, 0.97] |
| 8 Serious adverse events (irrespective of attribution to treatment) Show forest plot | 1 | Peto Odds Ratio (Peto, Fixed, 95% CI) | Subtotals only | |
| Analysis 1.8  Comparison 1 Pembrolizumab versus chemotherapy, Outcome 8 Serious adverse events (irrespective of attribution to treatment). | ||||
| 8.1 Pruritus (Grade 3, 4, or 5) | 1 | 521 | Peto Odds Ratio (Peto, Fixed, 95% CI) | 0.13 [0.00, 6.54] |
| 8.2 Fatigue (Grade 3, 4, or 5) | 1 | 521 | Peto Odds Ratio (Peto, Fixed, 95% CI) | 0.63 [0.28, 1.40] |
| 8.3 Diarrhoea (Grade 3, 4, or 5) | 1 | 521 | Peto Odds Ratio (Peto, Fixed, 95% CI) | 0.96 [0.24, 3.87] |
| 8.4 Anaemia (Grade 3, 4, or 5) | 1 | 521 | Peto Odds Ratio (Peto, Fixed, 95% CI) | 0.65 [0.37, 1.15] |
| 8.5 Constipation (Grade 3, 4, or 5) | 1 | 521 | Peto Odds Ratio (Peto, Fixed, 95% CI) | 0.38 [0.11, 1.25] |
| 8.6 Peripheral sensory neuropathy (Grade 3, 4, or 5) | 1 | 521 | Peto Odds Ratio (Peto, Fixed, 95% CI) | 0.13 [0.02, 0.74] |
| 8.7 Neutropenia (Grade 3, 4, or 5) | 1 | 521 | Peto Odds Ratio (Peto, Fixed, 95% CI) | 0.11 [0.06, 0.22] |
| 8.8 Alopecia (Grade 3, 4, or 5) | 1 | 521 | Peto Odds Ratio (Peto, Fixed, 95% CI) | 0.13 [0.01, 1.24] |
| 8.9 Hypothyroidism (Grade 3, 4, or 5) | 1 | 521 | Peto Odds Ratio (Peto, Fixed, 95% CI) | 0.0 [0.0, 0.0] |
| 8.10 Skin reaction (Grade 3, 4, or 5) | 1 | 521 | Peto Odds Ratio (Peto, Fixed, 95% CI) | 0.23 [0.05, 1.00] |
| Outcome or subgroup title | No. of studies | No. of participants | Statistical method | Effect size |
| 1 Overall survival based on performance status Show forest plot | 1 | Hazard Ratio (Random, 95% CI) | 0.74 [0.59, 0.92] | |
| Analysis 2.1  Comparison 2 Pembrolizumab versus chemotherapy (predefined subgroup analyses), Outcome 1 Overall survival based on performance status. | ||||
| 1.1 ECOG 0‐1 | 1 | Hazard Ratio (Random, 95% CI) | 0.74 [0.59, 0.93] | |
| 1.2 ECOG 2 | 1 | Hazard Ratio (Random, 95% CI) | 0.43 [0.04, 4.62] | |
| 2 Overall survival based on time since last chemotherapy Show forest plot | 1 | Hazard Ratio (Random, 95% CI) | 0.72 [0.58, 0.91] | |
| Analysis 2.2  Comparison 2 Pembrolizumab versus chemotherapy (predefined subgroup analyses), Outcome 2 Overall survival based on time since last chemotherapy. | ||||
| 2.1 Less than 3 months | 1 | Hazard Ratio (Random, 95% CI) | 0.82 [0.58, 1.16] | |
| 2.2 Equal or greater than 3 months | 1 | Hazard Ratio (Random, 95% CI) | 0.66 [0.49, 0.89] | |
| 3 Overall survival based on degree of pretreatment Show forest plot | 1 | Hazard Ratio (Random, 95% CI) | 0.72 [0.57, 0.91] | |
| Analysis 2.3  Comparison 2 Pembrolizumab versus chemotherapy (predefined subgroup analyses), Outcome 3 Overall survival based on degree of pretreatment. | ||||
| 3.1 Two prior treatments for metastatic disease | 1 | Hazard Ratio (Random, 95% CI) | 0.83 [0.52, 1.32] | |
| 3.2 One prior treatment for metastatic disease | 1 | Hazard Ratio (Random, 95% CI) | 0.72 [0.54, 0.96] | |
| 3.3 Neoadjuvant | 1 | Hazard Ratio (Random, 95% CI) | 0.53 [0.20, 1.40] | |
| 3.4 Adjuvant | 1 | Hazard Ratio (Random, 95% CI) | 0.53 [0.18, 1.56] | |
| 4 Overall survival based on PD‐L1 tumour expression status Show forest plot | 1 | Hazard Ratio (Random, 95% CI) | 0.75 [0.51, 1.08] | |
| Analysis 2.4  Comparison 2 Pembrolizumab versus chemotherapy (predefined subgroup analyses), Outcome 4 Overall survival based on PD‐L1 tumour expression status. | ||||
| 4.1 PD‐L1 positive (>1% cut off) | 1 | Hazard Ratio (Random, 95% CI) | 0.61 [0.43, 0.87] | |
| 4.2 PD‐L1 negative (<1% cut off) | 1 | Hazard Ratio (Random, 95% CI) | 0.89 [0.66, 1.20] | |
| Outcome or subgroup title | No. of studies | No. of participants | Statistical method | Effect size |
| 1 Overall survival based on age Show forest plot | 1 | Hazard Ratio (Random, 95% CI) | 0.76 [0.60, 0.95] | |
| Analysis 3.1  Comparison 3 Pembrolizumab versus chemotherapy (post‐hoc included subgroup analyses), Outcome 1 Overall survival based on age. | ||||
| 1.1 < 65 years | 1 | Hazard Ratio (Random, 95% CI) | 0.75 [0.53, 1.06] | |
| 1.2 ≥ 65 years | 1 | Hazard Ratio (Random, 95% CI) | 0.76 [0.56, 1.03] | |
| 2 Overall survival based on sex Show forest plot | 1 | Hazard Ratio (Random, 95% CI) | 0.74 [0.59, 0.93] | |
| Analysis 3.2  Comparison 3 Pembrolizumab versus chemotherapy (post‐hoc included subgroup analyses), Outcome 2 Overall survival based on sex. | ||||
| 2.1 Male | 1 | Hazard Ratio (Random, 95% CI) | 0.73 [0.56, 0.95] | |
| 2.2 Female | 1 | Hazard Ratio (Random, 95% CI) | 0.78 [0.49, 1.24] | |
| 3 Overall survival based on smoking status Show forest plot | 1 | Hazard Ratio (Random, 95% CI) | 0.68 [0.41, 1.15] | |
| Analysis 3.3  Comparison 3 Pembrolizumab versus chemotherapy (post‐hoc included subgroup analyses), Outcome 3 Overall survival based on smoking status. | ||||
| 3.1 Current | 1 | Hazard Ratio (Random, 95% CI) | 0.32 [0.15, 0.68] | |
| 3.2 Former | 1 | Hazard Ratio (Random, 95% CI) | 0.71 [0.52, 0.97] | |
| 3.3 Never | 1 | Hazard Ratio (Random, 95% CI) | 1.06 [0.72, 1.56] | |
| 4 Overall survival based on histologic type Show forest plot | 1 | Hazard Ratio (Random, 95% CI) | 0.72 [0.54, 0.97] | |
| Analysis 3.4  Comparison 3 Pembrolizumab versus chemotherapy (post‐hoc included subgroup analyses), Outcome 4 Overall survival based on histologic type. | ||||
| 4.1 Transitional cell | 1 | Hazard Ratio (Random, 95% CI) | 0.80 [0.62, 1.03] | |
| 4.2 Mixed | 1 | Hazard Ratio (Random, 95% CI) | 0.58 [0.37, 0.91] | |
| 5 Overall survival based on PD‐L1 tumour expression status (10% cutoff) Show forest plot | 1 | Hazard Ratio (Random, 95% CI) | 0.71 [0.51, 0.97] | |
| Analysis 3.5  Comparison 3 Pembrolizumab versus chemotherapy (post‐hoc included subgroup analyses), Outcome 5 Overall survival based on PD‐L1 tumour expression status (10% cutoff). | ||||
| 5.1 < 10% | 1 | Hazard Ratio (Random, 95% CI) | 0.80 [0.61, 1.05] | |
| 5.2 ≥ 10% | 1 | Hazard Ratio (Random, 95% CI) | 0.57 [0.37, 0.88] | |
| 6 Overall survival based on location of primary tumour Show forest plot | 1 | Hazard Ratio (Random, 95% CI) | 0.72 [0.54, 0.95] | |
| Analysis 3.6  Comparison 3 Pembrolizumab versus chemotherapy (post‐hoc included subgroup analyses), Outcome 6 Overall survival based on location of primary tumour. | ||||
| 6.1 Upper tract | 1 | Hazard Ratio (Random, 95% CI) | 0.53 [0.28, 1.00] | |
| 6.2 Lower tract | 1 | Hazard Ratio (Random, 95% CI) | 0.77 [0.60, 0.99] | |
| 7 Overall survival based on location of metastases Show forest plot | 1 | Hazard Ratio (Random, 95% CI) | 0.73 [0.59, 0.91] | |
| Analysis 3.7  Comparison 3 Pembrolizumab versus chemotherapy (post‐hoc included subgroup analyses), Outcome 7 Overall survival based on location of metastases. | ||||
| 7.1 Lymph node only | 1 | Hazard Ratio (Random, 95% CI) | 0.46 [0.18, 1.18] | |
| 7.2 Visceral disease | 1 | Hazard Ratio (Random, 95% CI) | 0.75 [0.60, 0.94] | |
| 8 Overall survival based on liver metastases Show forest plot | 1 | Hazard Ratio (Random, 95% CI) | 0.74 [0.59, 0.94] | |
| Analysis 3.8  Comparison 3 Pembrolizumab versus chemotherapy (post‐hoc included subgroup analyses), Outcome 8 Overall survival based on liver metastases. | ||||
| 8.1 Liver metastases | 1 | Hazard Ratio (Random, 95% CI) | 0.85 [0.61, 1.18] | |
| 8.2 No liver metastases | 1 | Hazard Ratio (Random, 95% CI) | 0.67 [0.50, 0.90] | |
| 9 Overall survival based on haemoglobin concentration Show forest plot | 1 | Hazard Ratio (Random, 95% CI) | 0.72 [0.57, 0.90] | |
| Analysis 3.9  Comparison 3 Pembrolizumab versus chemotherapy (post‐hoc included subgroup analyses), Outcome 9 Overall survival based on haemoglobin concentration. | ||||
| 9.1 < 10 g/dl | 1 | Hazard Ratio (Random, 95% CI) | 0.75 [0.46, 1.22] | |
| 9.2 ≥ 10 g/dl | 1 | Hazard Ratio (Random, 95% CI) | 0.71 [0.55, 0.92] | |
| 10 Overall survival based on number of risk factors Show forest plot | 1 | Hazard Ratio (Random, 95% CI) | 0.78 [0.62, 0.98] | |
| Analysis 3.10  Comparison 3 Pembrolizumab versus chemotherapy (post‐hoc included subgroup analyses), Outcome 10 Overall survival based on number of risk factors. | ||||
| 10.1 No risk factor | 1 | Hazard Ratio (Random, 95% CI) | 0.82 [0.42, 1.60] | |
| 10.2 1 risk factor | 1 | Hazard Ratio (Random, 95% CI) | 0.73 [0.49, 1.09] | |
| 10.3 2 risk factors | 1 | Hazard Ratio (Random, 95% CI) | 0.84 [0.56, 1.26] | |
| 10.4 3 or 4 risk factors | 1 | Hazard Ratio (Random, 95% CI) | 0.76 [0.47, 1.23] | |
| 11 Overall survival based on previous platinum therapy Show forest plot | 1 | Hazard Ratio (Random, 95% CI) | 0.73 [0.58, 0.92] | |
| Analysis 3.11  Comparison 3 Pembrolizumab versus chemotherapy (post‐hoc included subgroup analyses), Outcome 11 Overall survival based on previous platinum therapy. | ||||
| 11.1 Cisplatin | 1 | Hazard Ratio (Random, 95% CI) | 0.73 [0.56, 0.95] | |
| 11.2 Carboplatin | 1 | Hazard Ratio (Random, 95% CI) | 0.74 [0.47, 1.17] | |
| 12 Overall survival based on investigator's choice of chemotherapy Show forest plot | 1 | Hazard Ratio (Random, 95% CI) | 0.73 [0.61, 0.88] | |
| Analysis 3.12  Comparison 3 Pembrolizumab versus chemotherapy (post‐hoc included subgroup analyses), Outcome 12 Overall survival based on investigator's choice of chemotherapy. | ||||
| 12.1 Paclitaxel | 1 | Hazard Ratio (Random, 95% CI) | 0.76 [0.55, 1.05] | |
| 12.2 Docetaxel | 1 | Hazard Ratio (Random, 95% CI) | 0.76 [0.55, 1.05] | |
| 12.3 Vinflunine | 1 | Hazard Ratio (Random, 95% CI) | 0.69 [0.51, 0.93] | |

Study flow diagram.

Risk of bias summary: review authors' judgements about each risk of bias item for each included study.

Risk of bias graph: review authors' judgements about each risk of bias item presented as percentages across all included studies.

Forest plot of comparison: 1 Pembrolizumab versus chemotherapy, outcome: 1.1 Overall survival.
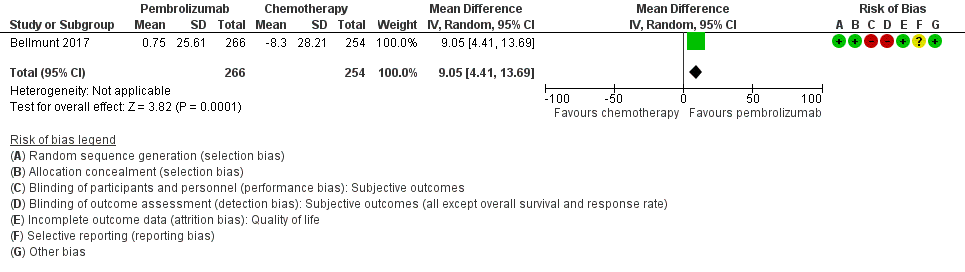
Forest plot of comparison: 1 Pembrolizumab versus chemotherapy, outcome: 1.2 Quality of life (change from baseline to week 15).
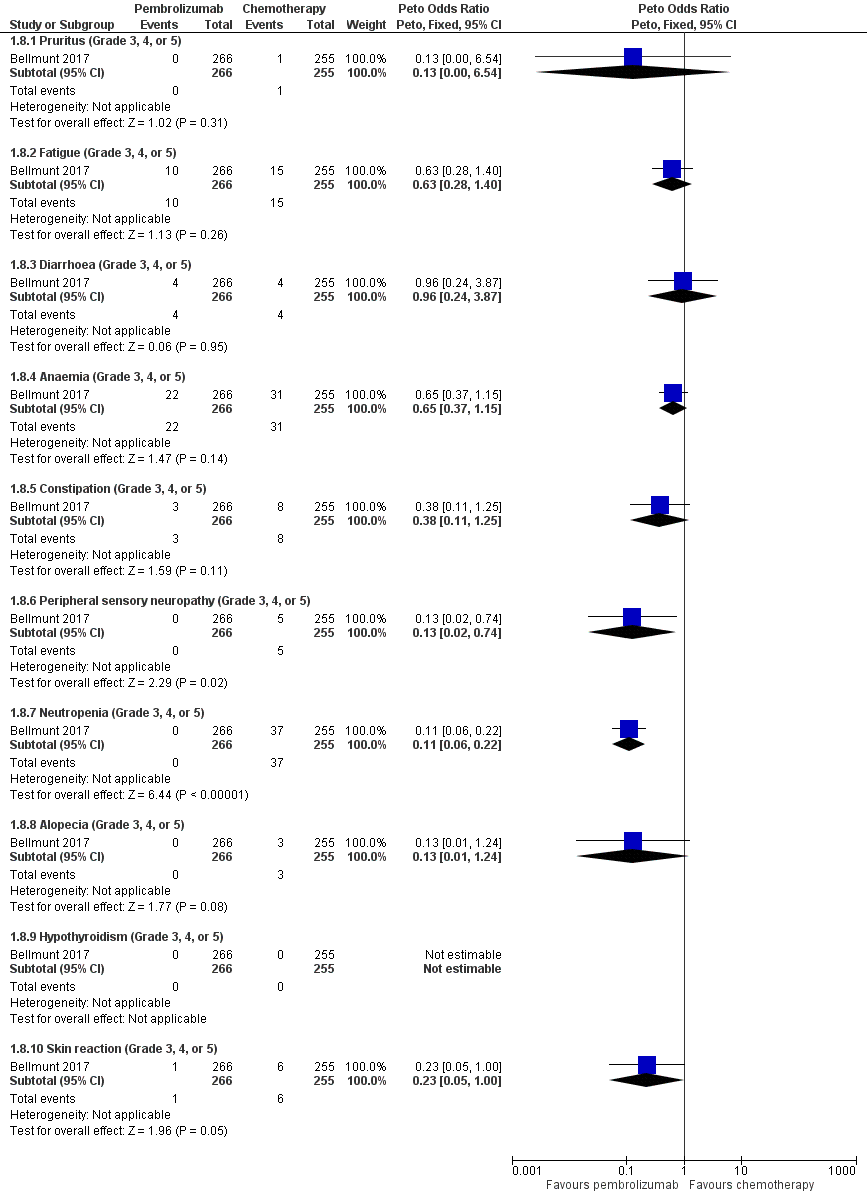
Forest plot of comparison: 1 Pembrolizumab versus chemotherapy, outcome: 1.8 Serious adverse events (irrespective of attribution to treatment).

Comparison 1 Pembrolizumab versus chemotherapy, Outcome 1 Overall survival.

Comparison 1 Pembrolizumab versus chemotherapy, Outcome 2 Quality of life (change from baseline to week 15).
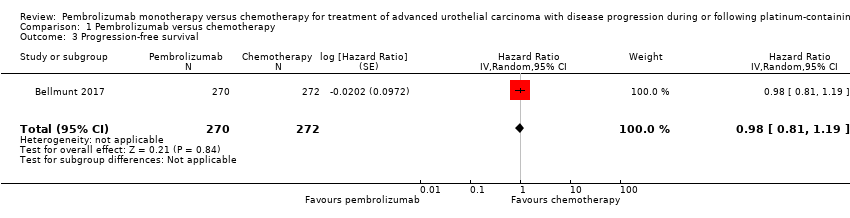
Comparison 1 Pembrolizumab versus chemotherapy, Outcome 3 Progression‐free survival.

Comparison 1 Pembrolizumab versus chemotherapy, Outcome 4 Response rate (partial and complete response).

Comparison 1 Pembrolizumab versus chemotherapy, Outcome 5 Treatment‐related mortality.

Comparison 1 Pembrolizumab versus chemotherapy, Outcome 6 Discontinuation due to adverse event (any grade).

Comparison 1 Pembrolizumab versus chemotherapy, Outcome 7 Serious adverse events (irrespective of attribution to treatment).

Comparison 1 Pembrolizumab versus chemotherapy, Outcome 8 Serious adverse events (irrespective of attribution to treatment).
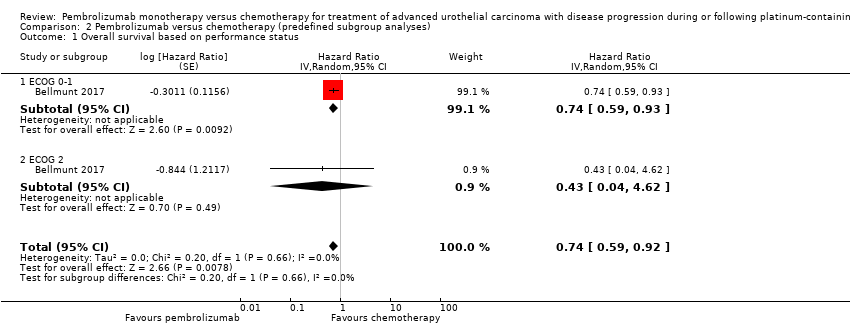
Comparison 2 Pembrolizumab versus chemotherapy (predefined subgroup analyses), Outcome 1 Overall survival based on performance status.

Comparison 2 Pembrolizumab versus chemotherapy (predefined subgroup analyses), Outcome 2 Overall survival based on time since last chemotherapy.
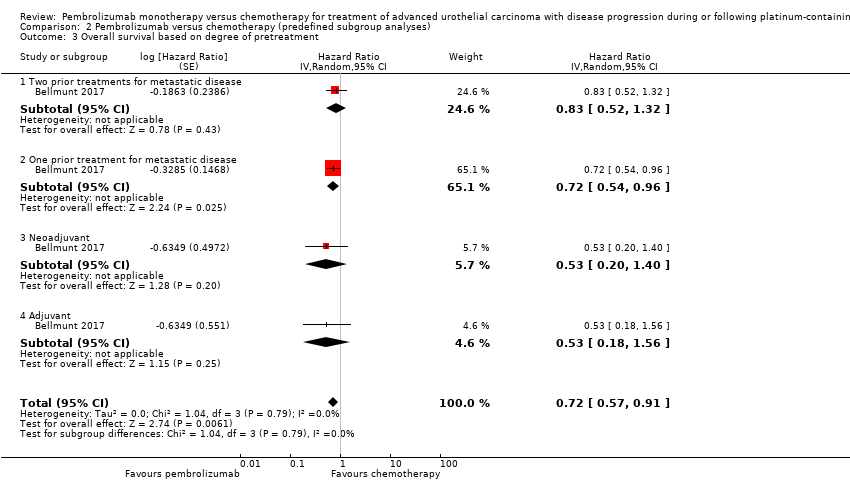
Comparison 2 Pembrolizumab versus chemotherapy (predefined subgroup analyses), Outcome 3 Overall survival based on degree of pretreatment.
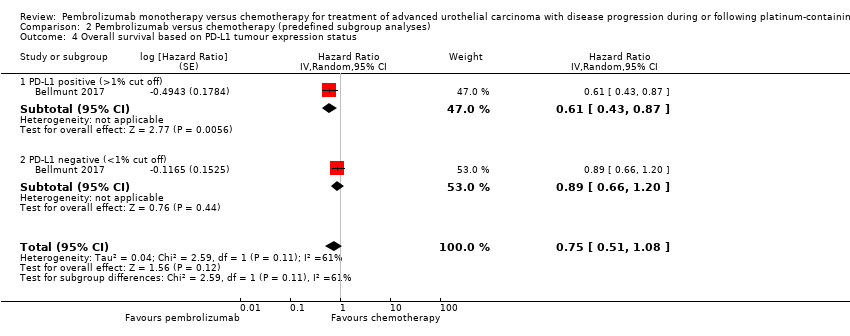
Comparison 2 Pembrolizumab versus chemotherapy (predefined subgroup analyses), Outcome 4 Overall survival based on PD‐L1 tumour expression status.
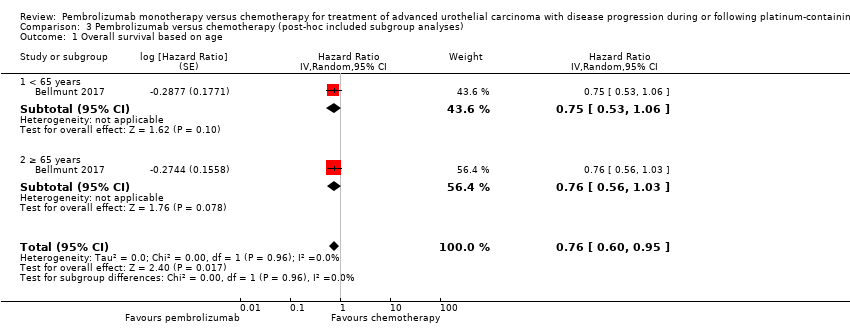
Comparison 3 Pembrolizumab versus chemotherapy (post‐hoc included subgroup analyses), Outcome 1 Overall survival based on age.

Comparison 3 Pembrolizumab versus chemotherapy (post‐hoc included subgroup analyses), Outcome 2 Overall survival based on sex.

Comparison 3 Pembrolizumab versus chemotherapy (post‐hoc included subgroup analyses), Outcome 3 Overall survival based on smoking status.

Comparison 3 Pembrolizumab versus chemotherapy (post‐hoc included subgroup analyses), Outcome 4 Overall survival based on histologic type.

Comparison 3 Pembrolizumab versus chemotherapy (post‐hoc included subgroup analyses), Outcome 5 Overall survival based on PD‐L1 tumour expression status (10% cutoff).
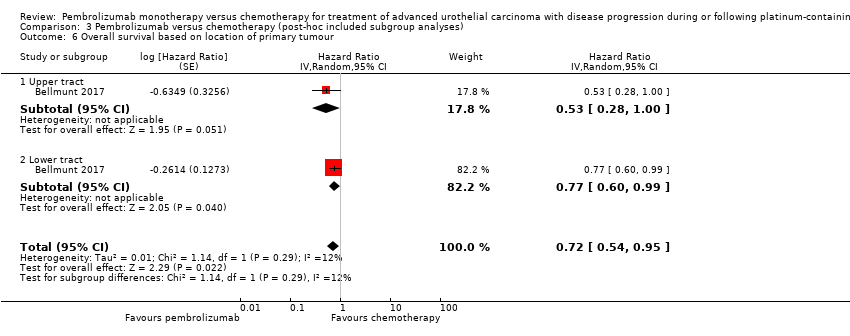
Comparison 3 Pembrolizumab versus chemotherapy (post‐hoc included subgroup analyses), Outcome 6 Overall survival based on location of primary tumour.

Comparison 3 Pembrolizumab versus chemotherapy (post‐hoc included subgroup analyses), Outcome 7 Overall survival based on location of metastases.
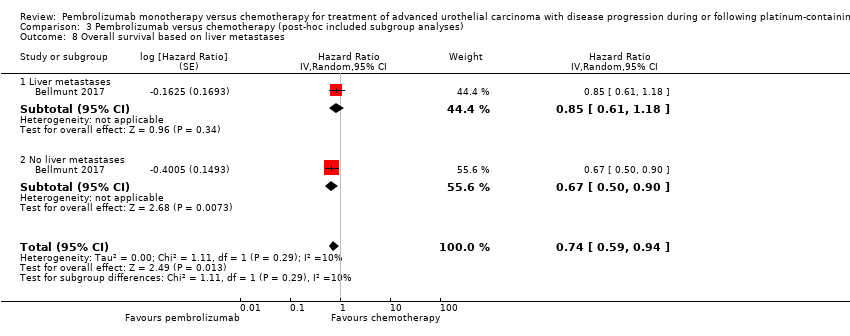
Comparison 3 Pembrolizumab versus chemotherapy (post‐hoc included subgroup analyses), Outcome 8 Overall survival based on liver metastases.

Comparison 3 Pembrolizumab versus chemotherapy (post‐hoc included subgroup analyses), Outcome 9 Overall survival based on haemoglobin concentration.
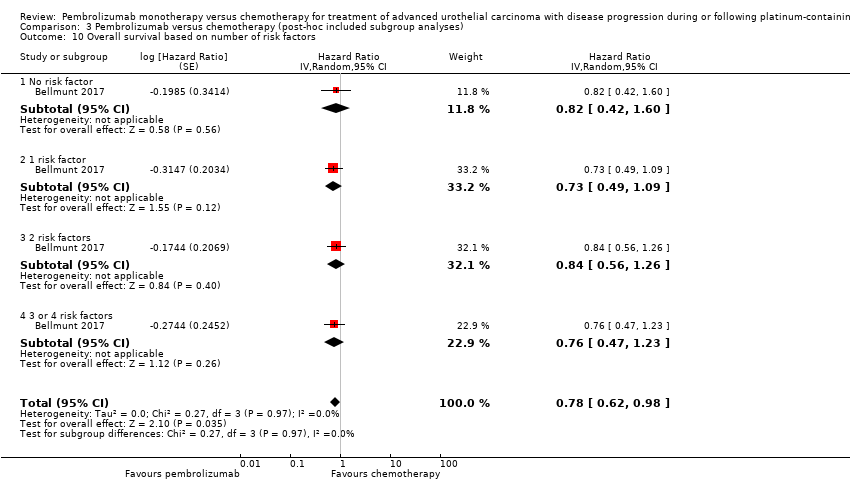
Comparison 3 Pembrolizumab versus chemotherapy (post‐hoc included subgroup analyses), Outcome 10 Overall survival based on number of risk factors.

Comparison 3 Pembrolizumab versus chemotherapy (post‐hoc included subgroup analyses), Outcome 11 Overall survival based on previous platinum therapy.

Comparison 3 Pembrolizumab versus chemotherapy (post‐hoc included subgroup analyses), Outcome 12 Overall survival based on investigator's choice of chemotherapy.
| Pembrolizumab compared to chemotherapy for treatment of advanced urothelial carcinoma with disease progression during or following platinum‐containing chemotherapy. A Cochrane Rapid Review | |||||
| Participants: people with advanced urothelial carcinoma with disease progression during or following platinum‐containing chemotherapy Setting: multicentre; 120 sites in 29 countries Intervention: pembrolizumab Control: chemotherapy (vinflunine or docetaxel or paclitaxel) | |||||
| Outcomes | Number of participants | Certainty of the evidence | Relative effect | Anticipated absolute effects* (95% CI) | |
| Risk with chemotherapy | Risk difference with pembrolizumab | ||||
| Time to death from any cause (here: overall mortality at 12‐month follow‐up) | 542 | ⊕⊕⊕⊝ | HR 0.73 | Study population | |
| 695 per 1000 a | 115 fewer per 1000 | ||||
| Quality of life (Change from baseline to week 15) | 519 | ⊕⊕⊝⊝ | MD 9.05 (4.61 to 13.50) | The mean quality of life (change from baseline to week 15) was ‐8.3 score change b | MD 9.05 score change higher |
| Response rate (partial and complete response) Follow‐up: median 14.1 months | 542 | ⊕⊕⊕⊝ | RR 1.85 | Study population | |
| 114 per 1000 | 97 more per 1000 | ||||
| Treatment‐related mortality | 521 | ⊕⊕⊝⊝ | RR 0.96 | Study population | |
| 16 per 1000 | 1 less per 1000 | ||||
| Discontinuation due to adverse event | 521 | ⊕⊕⊝⊝ | RR 0.66 | Study population | |
| 110 per 1000 | 37 fewer per 1000 | ||||
| Serious adverse events (irrespective of attribution to treatment) Follow‐up: median 14.1 months | 521 | ⊕⊕⊝⊝ | RR 0.83 (0.72 to 0.97) | Study population | |
| 627 per 1000 | 107 fewer per 1000 | ||||
| *The risk in the intervention group (and its 95% confidence interval) is based on the assumed risk in the comparison group and the relative effect of the intervention (and its 95% CI). RR 0.66, 95% CI 0.39 to 1.10 | |||||
| GRADE Working Group grades of evidence | |||||
| 1 Downgraded for imprecision due to wide confidence intervals. 2 Downgraded for study limitations (performance and detection bias) 3 Additonal concerns about selective reporting bias but not downgraded further. 4 Downgraded for imprecision; 95% CI crosses minimal clinically important difference of 10. a The baseline risk for death of any cause in the chemotherapy group was assumed to be 69.3% at 12 months as reported by Bellmunt 2017 (at 12 months, the estimated overall survival rate was 43.9% (95% CI 37.8 to 49.9) for participants treated with pembrolizumab and 30.7% (95% CI 25.9 to 36.7) for participants treated with chemotherapy). b Baseline risk for the chemotherapy group at 15 weeks as reported by Bellmunt 2017 ("From baseline to week 15, scores were stable for pembrolizumab (n = 266) (least squares [LS] mean +0.75 [95% CI –2.34 to +3.83]) but worsened for chemotherapy (n = 254) (LS mean –8.30 [95% CI –11.76 to –4.83]); the difference in LS means between arms was 9.05 (95% CI 4.61‐13.48; nominal 2‐sided P < 0.001)"). | |||||
| Intervention(s) and comparator(s) | Duration of follow‐up | Description of participants | Trial period (year to year) | Country | Setting | Ethnic groups (%) | |
| Bellmunt 2017 | I: pembrolizumab | Median 14.1 months (for quality of life: from randomisation to week 15) | Participants with advanced urothelial carcinoma with disease progression during or following platinum‐containing chemotherapy | 2014‐2015 | International | Multicentre | ‐ |
| C: paclitaxel or docetaxel or vinflunine | ‐ | ||||||
| C: comparator; I: intervention; ‐: not reported. | |||||||
| Intervention(s) and comparator(s) | Sample size | N screened/eligible | N randomised | N ITT | N analysed for overall survival, progression‐frees survival, and response rate | N analysed for quality of life | N analysed for treatment‐related mortality, discontinuation due to adverse events, and adverse events | Follow‐upa | |
| Bellmunt 2017 | I1: Pembrolizumab | 542 | 748 | 270 | 270 | 270 | 266 | 266 | Median 14.1 months (9.9‐22.1; for quality of life: from randomisation to week 15) |
| C1: Paclitaxel or docetaxel or vinflunine | 272 | 272 | 272 | 254 | 255 | ||||
| Total: | 542 | 542 | 542 | 520 | 521 | ||||
| Grand total | All interventions | 270 | |||||||
| All comparators | 272 | ||||||||
| All interventions and comparators | 542 | ||||||||
| aFollow‐up under randomised conditions until end of trial or, if not available, duration of intervention. C: comparator; I: intervention; ITT: intention‐to‐treat. | |||||||||
| Outcome or subgroup title | No. of studies | No. of participants | Statistical method | Effect size |
| 1 Overall survival Show forest plot | 1 | 542 | Hazard Ratio (Random, 95% CI) | 0.73 [0.59, 0.90] |
| 2 Quality of life (change from baseline to week 15) Show forest plot | 1 | 520 | Mean Difference (IV, Random, 95% CI) | 9.05 [4.41, 13.69] |
| 3 Progression‐free survival Show forest plot | 1 | 542 | Hazard Ratio (Random, 95% CI) | 0.98 [0.81, 1.19] |
| 4 Response rate (partial and complete response) Show forest plot | 1 | 542 | Risk Ratio (M‐H, Random, 95% CI) | 1.85 [1.24, 2.77] |
| 5 Treatment‐related mortality Show forest plot | 1 | 521 | Risk Ratio (M‐H, Random, 95% CI) | 0.96 [0.24, 3.79] |
| 6 Discontinuation due to adverse event (any grade) Show forest plot | 1 | 521 | Risk Ratio (M‐H, Random, 95% CI) | 0.66 [0.39, 1.10] |
| 7 Serious adverse events (irrespective of attribution to treatment) Show forest plot | 1 | Risk Ratio (M‐H, Random, 95% CI) | Subtotals only | |
| 7.1 Serious adverse events (Grade 3, 4, or 5) | 1 | 521 | Risk Ratio (M‐H, Random, 95% CI) | 0.83 [0.72, 0.97] |
| 8 Serious adverse events (irrespective of attribution to treatment) Show forest plot | 1 | Peto Odds Ratio (Peto, Fixed, 95% CI) | Subtotals only | |
| 8.1 Pruritus (Grade 3, 4, or 5) | 1 | 521 | Peto Odds Ratio (Peto, Fixed, 95% CI) | 0.13 [0.00, 6.54] |
| 8.2 Fatigue (Grade 3, 4, or 5) | 1 | 521 | Peto Odds Ratio (Peto, Fixed, 95% CI) | 0.63 [0.28, 1.40] |
| 8.3 Diarrhoea (Grade 3, 4, or 5) | 1 | 521 | Peto Odds Ratio (Peto, Fixed, 95% CI) | 0.96 [0.24, 3.87] |
| 8.4 Anaemia (Grade 3, 4, or 5) | 1 | 521 | Peto Odds Ratio (Peto, Fixed, 95% CI) | 0.65 [0.37, 1.15] |
| 8.5 Constipation (Grade 3, 4, or 5) | 1 | 521 | Peto Odds Ratio (Peto, Fixed, 95% CI) | 0.38 [0.11, 1.25] |
| 8.6 Peripheral sensory neuropathy (Grade 3, 4, or 5) | 1 | 521 | Peto Odds Ratio (Peto, Fixed, 95% CI) | 0.13 [0.02, 0.74] |
| 8.7 Neutropenia (Grade 3, 4, or 5) | 1 | 521 | Peto Odds Ratio (Peto, Fixed, 95% CI) | 0.11 [0.06, 0.22] |
| 8.8 Alopecia (Grade 3, 4, or 5) | 1 | 521 | Peto Odds Ratio (Peto, Fixed, 95% CI) | 0.13 [0.01, 1.24] |
| 8.9 Hypothyroidism (Grade 3, 4, or 5) | 1 | 521 | Peto Odds Ratio (Peto, Fixed, 95% CI) | 0.0 [0.0, 0.0] |
| 8.10 Skin reaction (Grade 3, 4, or 5) | 1 | 521 | Peto Odds Ratio (Peto, Fixed, 95% CI) | 0.23 [0.05, 1.00] |
| Outcome or subgroup title | No. of studies | No. of participants | Statistical method | Effect size |
| 1 Overall survival based on performance status Show forest plot | 1 | Hazard Ratio (Random, 95% CI) | 0.74 [0.59, 0.92] | |
| 1.1 ECOG 0‐1 | 1 | Hazard Ratio (Random, 95% CI) | 0.74 [0.59, 0.93] | |
| 1.2 ECOG 2 | 1 | Hazard Ratio (Random, 95% CI) | 0.43 [0.04, 4.62] | |
| 2 Overall survival based on time since last chemotherapy Show forest plot | 1 | Hazard Ratio (Random, 95% CI) | 0.72 [0.58, 0.91] | |
| 2.1 Less than 3 months | 1 | Hazard Ratio (Random, 95% CI) | 0.82 [0.58, 1.16] | |
| 2.2 Equal or greater than 3 months | 1 | Hazard Ratio (Random, 95% CI) | 0.66 [0.49, 0.89] | |
| 3 Overall survival based on degree of pretreatment Show forest plot | 1 | Hazard Ratio (Random, 95% CI) | 0.72 [0.57, 0.91] | |
| 3.1 Two prior treatments for metastatic disease | 1 | Hazard Ratio (Random, 95% CI) | 0.83 [0.52, 1.32] | |
| 3.2 One prior treatment for metastatic disease | 1 | Hazard Ratio (Random, 95% CI) | 0.72 [0.54, 0.96] | |
| 3.3 Neoadjuvant | 1 | Hazard Ratio (Random, 95% CI) | 0.53 [0.20, 1.40] | |
| 3.4 Adjuvant | 1 | Hazard Ratio (Random, 95% CI) | 0.53 [0.18, 1.56] | |
| 4 Overall survival based on PD‐L1 tumour expression status Show forest plot | 1 | Hazard Ratio (Random, 95% CI) | 0.75 [0.51, 1.08] | |
| 4.1 PD‐L1 positive (>1% cut off) | 1 | Hazard Ratio (Random, 95% CI) | 0.61 [0.43, 0.87] | |
| 4.2 PD‐L1 negative (<1% cut off) | 1 | Hazard Ratio (Random, 95% CI) | 0.89 [0.66, 1.20] | |
| Outcome or subgroup title | No. of studies | No. of participants | Statistical method | Effect size |
| 1 Overall survival based on age Show forest plot | 1 | Hazard Ratio (Random, 95% CI) | 0.76 [0.60, 0.95] | |
| 1.1 < 65 years | 1 | Hazard Ratio (Random, 95% CI) | 0.75 [0.53, 1.06] | |
| 1.2 ≥ 65 years | 1 | Hazard Ratio (Random, 95% CI) | 0.76 [0.56, 1.03] | |
| 2 Overall survival based on sex Show forest plot | 1 | Hazard Ratio (Random, 95% CI) | 0.74 [0.59, 0.93] | |
| 2.1 Male | 1 | Hazard Ratio (Random, 95% CI) | 0.73 [0.56, 0.95] | |
| 2.2 Female | 1 | Hazard Ratio (Random, 95% CI) | 0.78 [0.49, 1.24] | |
| 3 Overall survival based on smoking status Show forest plot | 1 | Hazard Ratio (Random, 95% CI) | 0.68 [0.41, 1.15] | |
| 3.1 Current | 1 | Hazard Ratio (Random, 95% CI) | 0.32 [0.15, 0.68] | |
| 3.2 Former | 1 | Hazard Ratio (Random, 95% CI) | 0.71 [0.52, 0.97] | |
| 3.3 Never | 1 | Hazard Ratio (Random, 95% CI) | 1.06 [0.72, 1.56] | |
| 4 Overall survival based on histologic type Show forest plot | 1 | Hazard Ratio (Random, 95% CI) | 0.72 [0.54, 0.97] | |
| 4.1 Transitional cell | 1 | Hazard Ratio (Random, 95% CI) | 0.80 [0.62, 1.03] | |
| 4.2 Mixed | 1 | Hazard Ratio (Random, 95% CI) | 0.58 [0.37, 0.91] | |
| 5 Overall survival based on PD‐L1 tumour expression status (10% cutoff) Show forest plot | 1 | Hazard Ratio (Random, 95% CI) | 0.71 [0.51, 0.97] | |
| 5.1 < 10% | 1 | Hazard Ratio (Random, 95% CI) | 0.80 [0.61, 1.05] | |
| 5.2 ≥ 10% | 1 | Hazard Ratio (Random, 95% CI) | 0.57 [0.37, 0.88] | |
| 6 Overall survival based on location of primary tumour Show forest plot | 1 | Hazard Ratio (Random, 95% CI) | 0.72 [0.54, 0.95] | |
| 6.1 Upper tract | 1 | Hazard Ratio (Random, 95% CI) | 0.53 [0.28, 1.00] | |
| 6.2 Lower tract | 1 | Hazard Ratio (Random, 95% CI) | 0.77 [0.60, 0.99] | |
| 7 Overall survival based on location of metastases Show forest plot | 1 | Hazard Ratio (Random, 95% CI) | 0.73 [0.59, 0.91] | |
| 7.1 Lymph node only | 1 | Hazard Ratio (Random, 95% CI) | 0.46 [0.18, 1.18] | |
| 7.2 Visceral disease | 1 | Hazard Ratio (Random, 95% CI) | 0.75 [0.60, 0.94] | |
| 8 Overall survival based on liver metastases Show forest plot | 1 | Hazard Ratio (Random, 95% CI) | 0.74 [0.59, 0.94] | |
| 8.1 Liver metastases | 1 | Hazard Ratio (Random, 95% CI) | 0.85 [0.61, 1.18] | |
| 8.2 No liver metastases | 1 | Hazard Ratio (Random, 95% CI) | 0.67 [0.50, 0.90] | |
| 9 Overall survival based on haemoglobin concentration Show forest plot | 1 | Hazard Ratio (Random, 95% CI) | 0.72 [0.57, 0.90] | |
| 9.1 < 10 g/dl | 1 | Hazard Ratio (Random, 95% CI) | 0.75 [0.46, 1.22] | |
| 9.2 ≥ 10 g/dl | 1 | Hazard Ratio (Random, 95% CI) | 0.71 [0.55, 0.92] | |
| 10 Overall survival based on number of risk factors Show forest plot | 1 | Hazard Ratio (Random, 95% CI) | 0.78 [0.62, 0.98] | |
| 10.1 No risk factor | 1 | Hazard Ratio (Random, 95% CI) | 0.82 [0.42, 1.60] | |
| 10.2 1 risk factor | 1 | Hazard Ratio (Random, 95% CI) | 0.73 [0.49, 1.09] | |
| 10.3 2 risk factors | 1 | Hazard Ratio (Random, 95% CI) | 0.84 [0.56, 1.26] | |
| 10.4 3 or 4 risk factors | 1 | Hazard Ratio (Random, 95% CI) | 0.76 [0.47, 1.23] | |
| 11 Overall survival based on previous platinum therapy Show forest plot | 1 | Hazard Ratio (Random, 95% CI) | 0.73 [0.58, 0.92] | |
| 11.1 Cisplatin | 1 | Hazard Ratio (Random, 95% CI) | 0.73 [0.56, 0.95] | |
| 11.2 Carboplatin | 1 | Hazard Ratio (Random, 95% CI) | 0.74 [0.47, 1.17] | |
| 12 Overall survival based on investigator's choice of chemotherapy Show forest plot | 1 | Hazard Ratio (Random, 95% CI) | 0.73 [0.61, 0.88] | |
| 12.1 Paclitaxel | 1 | Hazard Ratio (Random, 95% CI) | 0.76 [0.55, 1.05] | |
| 12.2 Docetaxel | 1 | Hazard Ratio (Random, 95% CI) | 0.76 [0.55, 1.05] | |
| 12.3 Vinflunine | 1 | Hazard Ratio (Random, 95% CI) | 0.69 [0.51, 0.93] | |