Monoterapia con pembrolizumab versus quimioterapia para el tratamiento del carcinoma urotelial avanzado con evolución de la enfermedad durante o después de la quimioterapia con platino. una revisión Cochrane rápida
Appendices
Appendix 1. Search strategies
| Search terms for the World Health Organization International Clinical Trials Registry Platform (WHO ICTRP) |
| Pembrolizumab, MK‐3475, Keytruda |
| Search strategy for the Cochrane Library |
| #1 Pembrolizumab #2 MK‐3475 #3 Keytruda #4 Lambrolizumab #5 #1 or #2 or #3 or #4 #6 MeSH descriptor: [Urinary Bladder Neoplasms] explode all trees #7 ((bladder or urothelial) near/3 (cancer* or carcinoma* or neoplas* or tumo?r* or malignan* or adenocarcinoma* or mass*)):ti,ab,kw #8 #6 or #7 #9 #8 and #5 |
Appendix 2. MEDLINE search strategy
| # | Search Statement |
| 1 | |
| 2 | |
| 3 | (MK adj2 "3475").tw. |
| 4 | |
| 5 | |
| 6 | 1 or 2 or 3 or 4 or 5 |
| 7 | exp Urinary Bladder Neoplasms/ |
| 8 | exp Urothelium/ |
| 9 | transitional cell carcinoma.mp. or exp Carcinoma, Transitional Cell/ |
| 10 | exp Neoplasms/ |
| 11 | ((bladder or urotheli* or uninary or transitional) adj4 (carcinoma* or cancer* or neoplas* or adenocarcinoma* or mass or malignan*)).mp. |
| 12 | 7 or 9 or 11 |
| 13 | 6 and 12 |
| 14 | urotheli*.mp. |
| 15 | 6 and 10 and 14 |
| 16 | 13 or 15 |
| 17 | 6 and 9 |
| 18 | 16 or 17 |
| 19 | (("tcc" or transitional) adj3 cell adj3 carcinoma*).mp. |
| 20 | 6 and 19 |
| 21 | 18 or 20 |
| 22 | 7 or 10 |
| 23 | 6 and 8 and 22 |
| 24 | 21 or 23 |

Study flow diagram.

Risk of bias summary: review authors' judgements about each risk of bias item for each included study.

Risk of bias graph: review authors' judgements about each risk of bias item presented as percentages across all included studies.

Forest plot of comparison: 1 Pembrolizumab versus chemotherapy, outcome: 1.1 Overall survival.
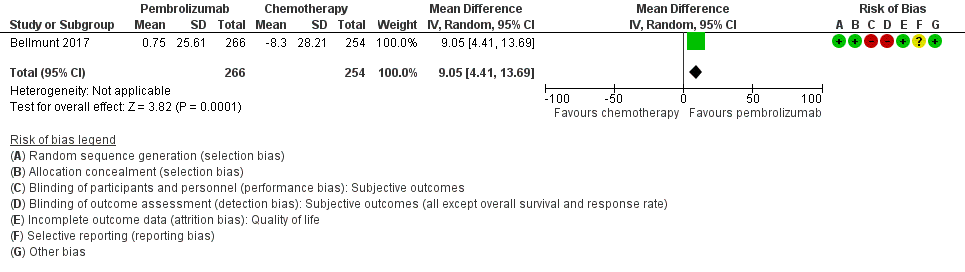
Forest plot of comparison: 1 Pembrolizumab versus chemotherapy, outcome: 1.2 Quality of life (change from baseline to week 15).
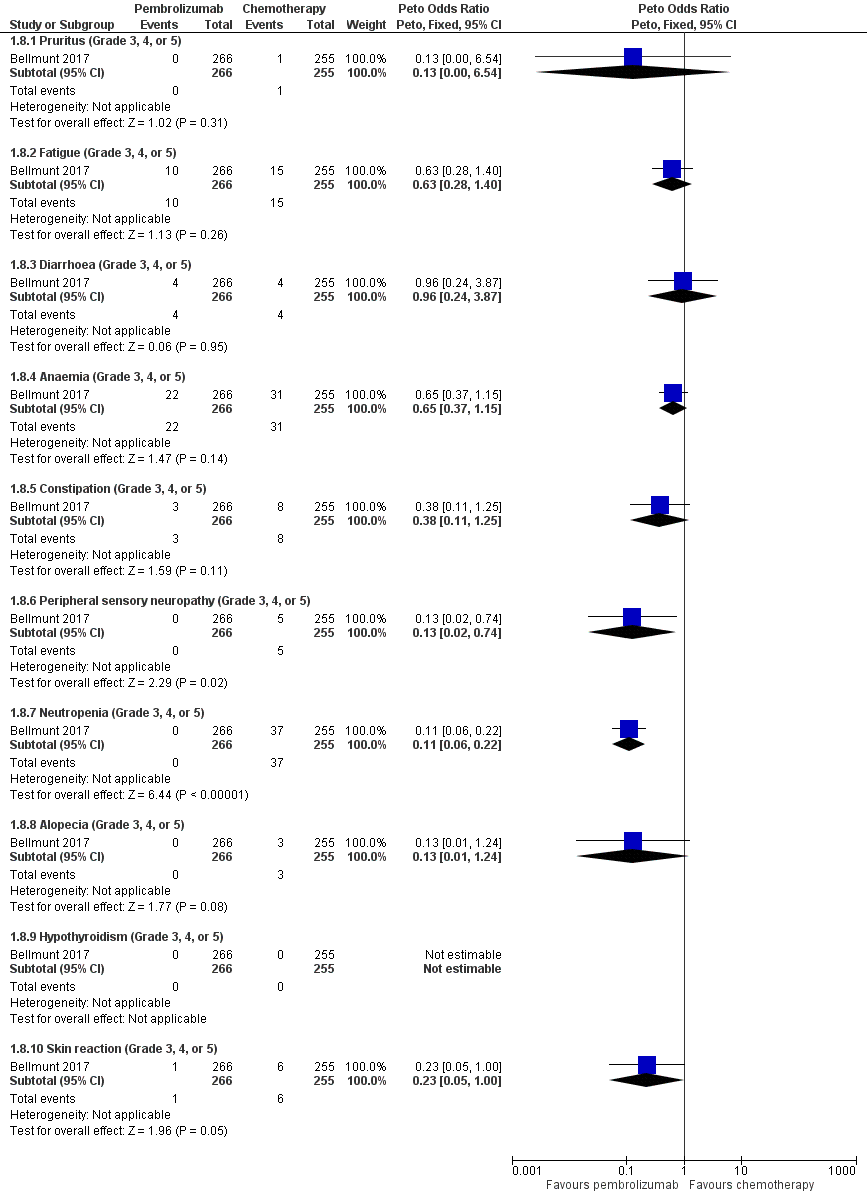
Forest plot of comparison: 1 Pembrolizumab versus chemotherapy, outcome: 1.8 Serious adverse events (irrespective of attribution to treatment).

Comparison 1 Pembrolizumab versus chemotherapy, Outcome 1 Overall survival.

Comparison 1 Pembrolizumab versus chemotherapy, Outcome 2 Quality of life (change from baseline to week 15).
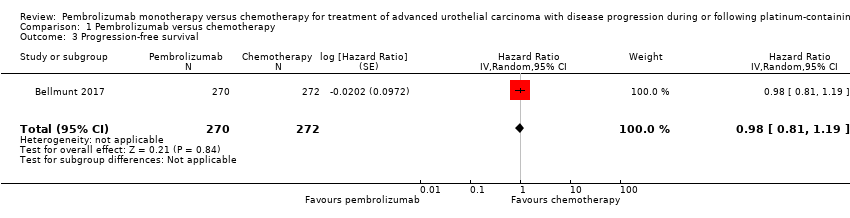
Comparison 1 Pembrolizumab versus chemotherapy, Outcome 3 Progression‐free survival.

Comparison 1 Pembrolizumab versus chemotherapy, Outcome 4 Response rate (partial and complete response).

Comparison 1 Pembrolizumab versus chemotherapy, Outcome 5 Treatment‐related mortality.

Comparison 1 Pembrolizumab versus chemotherapy, Outcome 6 Discontinuation due to adverse event (any grade).

Comparison 1 Pembrolizumab versus chemotherapy, Outcome 7 Serious adverse events (irrespective of attribution to treatment).

Comparison 1 Pembrolizumab versus chemotherapy, Outcome 8 Serious adverse events (irrespective of attribution to treatment).
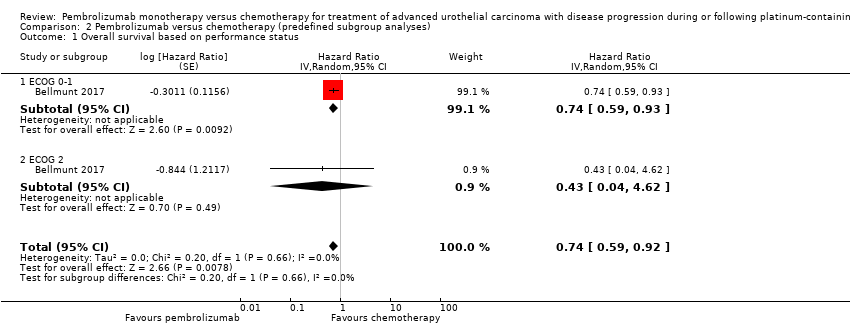
Comparison 2 Pembrolizumab versus chemotherapy (predefined subgroup analyses), Outcome 1 Overall survival based on performance status.

Comparison 2 Pembrolizumab versus chemotherapy (predefined subgroup analyses), Outcome 2 Overall survival based on time since last chemotherapy.
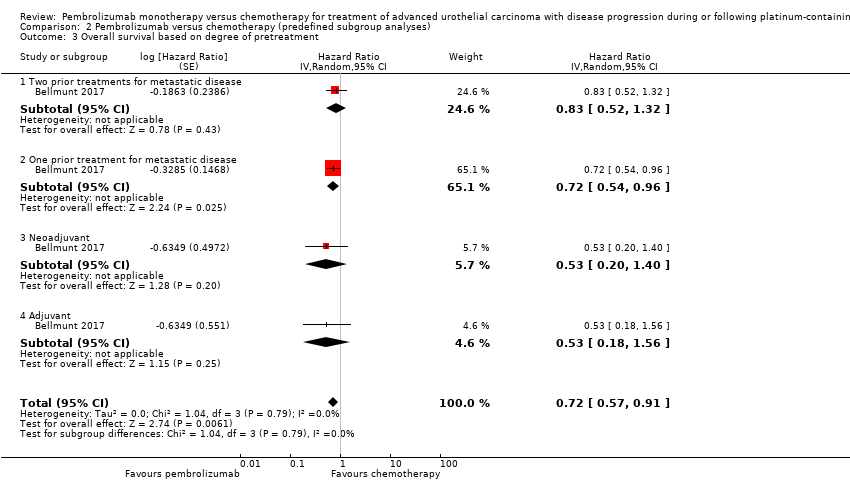
Comparison 2 Pembrolizumab versus chemotherapy (predefined subgroup analyses), Outcome 3 Overall survival based on degree of pretreatment.
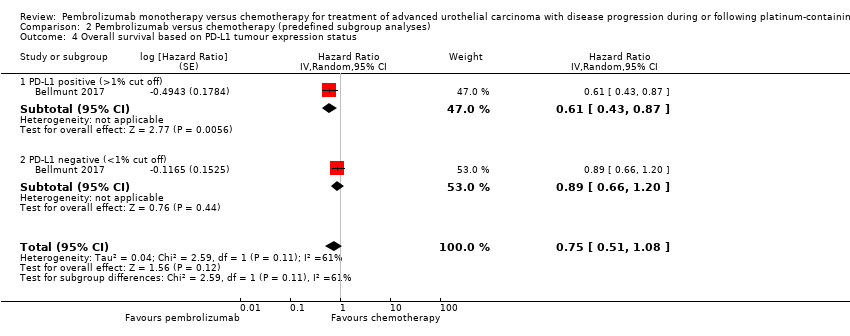
Comparison 2 Pembrolizumab versus chemotherapy (predefined subgroup analyses), Outcome 4 Overall survival based on PD‐L1 tumour expression status.
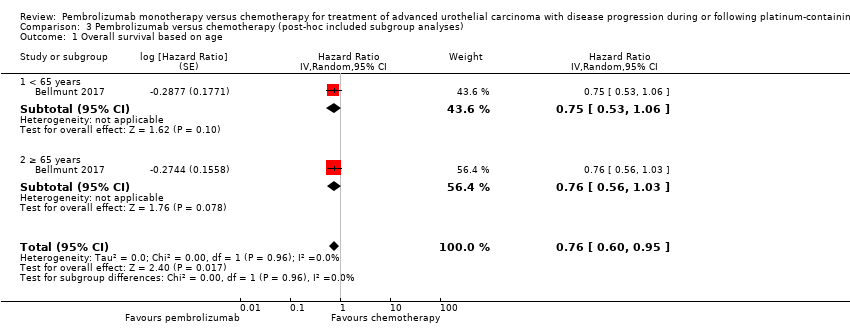
Comparison 3 Pembrolizumab versus chemotherapy (post‐hoc included subgroup analyses), Outcome 1 Overall survival based on age.

Comparison 3 Pembrolizumab versus chemotherapy (post‐hoc included subgroup analyses), Outcome 2 Overall survival based on sex.

Comparison 3 Pembrolizumab versus chemotherapy (post‐hoc included subgroup analyses), Outcome 3 Overall survival based on smoking status.

Comparison 3 Pembrolizumab versus chemotherapy (post‐hoc included subgroup analyses), Outcome 4 Overall survival based on histologic type.

Comparison 3 Pembrolizumab versus chemotherapy (post‐hoc included subgroup analyses), Outcome 5 Overall survival based on PD‐L1 tumour expression status (10% cutoff).
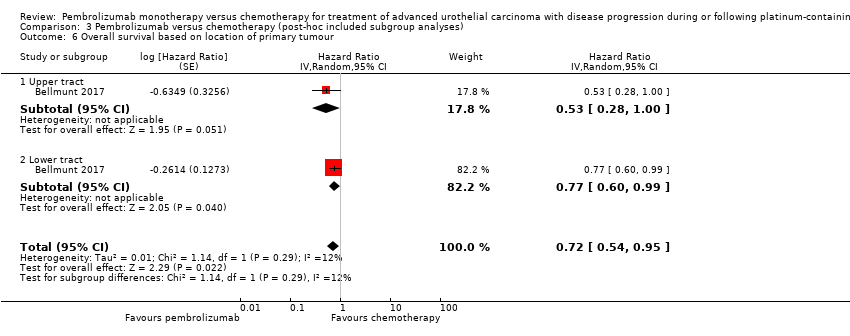
Comparison 3 Pembrolizumab versus chemotherapy (post‐hoc included subgroup analyses), Outcome 6 Overall survival based on location of primary tumour.

Comparison 3 Pembrolizumab versus chemotherapy (post‐hoc included subgroup analyses), Outcome 7 Overall survival based on location of metastases.
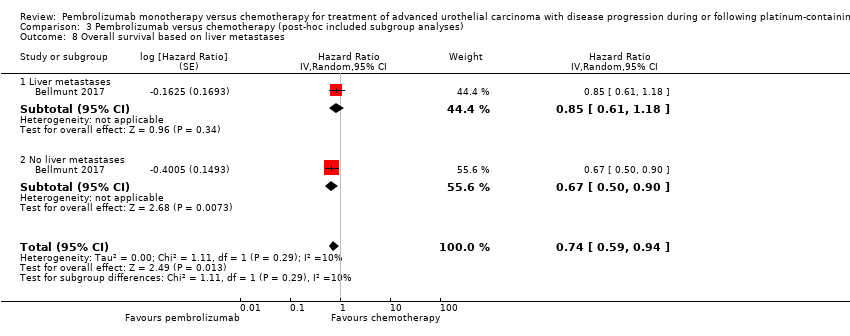
Comparison 3 Pembrolizumab versus chemotherapy (post‐hoc included subgroup analyses), Outcome 8 Overall survival based on liver metastases.

Comparison 3 Pembrolizumab versus chemotherapy (post‐hoc included subgroup analyses), Outcome 9 Overall survival based on haemoglobin concentration.
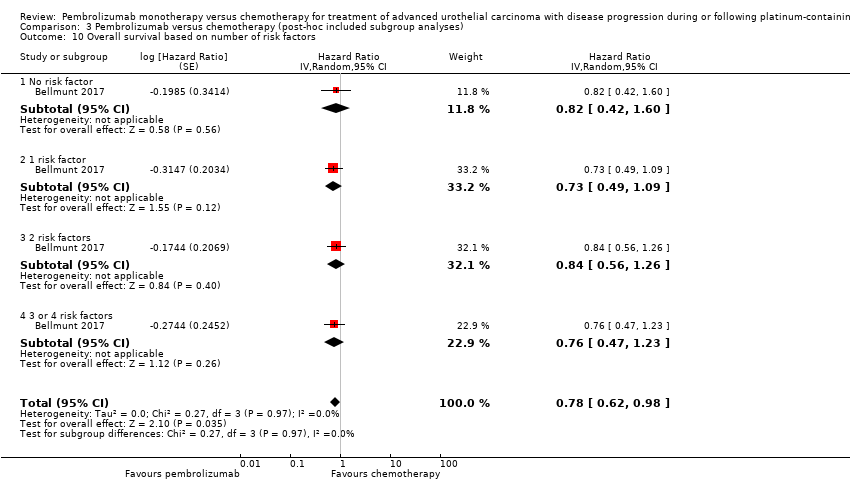
Comparison 3 Pembrolizumab versus chemotherapy (post‐hoc included subgroup analyses), Outcome 10 Overall survival based on number of risk factors.

Comparison 3 Pembrolizumab versus chemotherapy (post‐hoc included subgroup analyses), Outcome 11 Overall survival based on previous platinum therapy.

Comparison 3 Pembrolizumab versus chemotherapy (post‐hoc included subgroup analyses), Outcome 12 Overall survival based on investigator's choice of chemotherapy.
| Pembrolizumab compared to chemotherapy for treatment of advanced urothelial carcinoma with disease progression during or following platinum‐containing chemotherapy. A Cochrane Rapid Review | |||||
| Participants: people with advanced urothelial carcinoma with disease progression during or following platinum‐containing chemotherapy Setting: multicentre; 120 sites in 29 countries Intervention: pembrolizumab Control: chemotherapy (vinflunine or docetaxel or paclitaxel) | |||||
| Outcomes | Number of participants | Certainty of the evidence | Relative effect | Anticipated absolute effects* (95% CI) | |
| Risk with chemotherapy | Risk difference with pembrolizumab | ||||
| Time to death from any cause (here: overall mortality at 12‐month follow‐up) | 542 | ⊕⊕⊕⊝ | HR 0.73 | Study population | |
| 695 per 1000 a | 115 fewer per 1000 | ||||
| Quality of life (Change from baseline to week 15) | 519 | ⊕⊕⊝⊝ | MD 9.05 (4.61 to 13.50) | The mean quality of life (change from baseline to week 15) was ‐8.3 score change b | MD 9.05 score change higher |
| Response rate (partial and complete response) Follow‐up: median 14.1 months | 542 | ⊕⊕⊕⊝ | RR 1.85 | Study population | |
| 114 per 1000 | 97 more per 1000 | ||||
| Treatment‐related mortality | 521 | ⊕⊕⊝⊝ | RR 0.96 | Study population | |
| 16 per 1000 | 1 less per 1000 | ||||
| Discontinuation due to adverse event | 521 | ⊕⊕⊝⊝ | RR 0.66 | Study population | |
| 110 per 1000 | 37 fewer per 1000 | ||||
| Serious adverse events (irrespective of attribution to treatment) Follow‐up: median 14.1 months | 521 | ⊕⊕⊝⊝ | RR 0.83 (0.72 to 0.97) | Study population | |
| 627 per 1000 | 107 fewer per 1000 | ||||
| *The risk in the intervention group (and its 95% confidence interval) is based on the assumed risk in the comparison group and the relative effect of the intervention (and its 95% CI). RR 0.66, 95% CI 0.39 to 1.10 | |||||
| GRADE Working Group grades of evidence | |||||
| 1 Downgraded for imprecision due to wide confidence intervals. 2 Downgraded for study limitations (performance and detection bias) 3 Additonal concerns about selective reporting bias but not downgraded further. 4 Downgraded for imprecision; 95% CI crosses minimal clinically important difference of 10. a The baseline risk for death of any cause in the chemotherapy group was assumed to be 69.3% at 12 months as reported by Bellmunt 2017 (at 12 months, the estimated overall survival rate was 43.9% (95% CI 37.8 to 49.9) for participants treated with pembrolizumab and 30.7% (95% CI 25.9 to 36.7) for participants treated with chemotherapy). b Baseline risk for the chemotherapy group at 15 weeks as reported by Bellmunt 2017 ("From baseline to week 15, scores were stable for pembrolizumab (n = 266) (least squares [LS] mean +0.75 [95% CI –2.34 to +3.83]) but worsened for chemotherapy (n = 254) (LS mean –8.30 [95% CI –11.76 to –4.83]); the difference in LS means between arms was 9.05 (95% CI 4.61‐13.48; nominal 2‐sided P < 0.001)"). | |||||
| Intervention(s) and comparator(s) | Duration of follow‐up | Description of participants | Trial period (year to year) | Country | Setting | Ethnic groups (%) | |
| Bellmunt 2017 | I: pembrolizumab | Median 14.1 months (for quality of life: from randomisation to week 15) | Participants with advanced urothelial carcinoma with disease progression during or following platinum‐containing chemotherapy | 2014‐2015 | International | Multicentre | ‐ |
| C: paclitaxel or docetaxel or vinflunine | ‐ | ||||||
| C: comparator; I: intervention; ‐: not reported. | |||||||
| Intervention(s) and comparator(s) | Sample size | N screened/eligible | N randomised | N ITT | N analysed for overall survival, progression‐frees survival, and response rate | N analysed for quality of life | N analysed for treatment‐related mortality, discontinuation due to adverse events, and adverse events | Follow‐upa | |
| Bellmunt 2017 | I1: Pembrolizumab | 542 | 748 | 270 | 270 | 270 | 266 | 266 | Median 14.1 months (9.9‐22.1; for quality of life: from randomisation to week 15) |
| C1: Paclitaxel or docetaxel or vinflunine | 272 | 272 | 272 | 254 | 255 | ||||
| Total: | 542 | 542 | 542 | 520 | 521 | ||||
| Grand total | All interventions | 270 | |||||||
| All comparators | 272 | ||||||||
| All interventions and comparators | 542 | ||||||||
| aFollow‐up under randomised conditions until end of trial or, if not available, duration of intervention. C: comparator; I: intervention; ITT: intention‐to‐treat. | |||||||||
| Outcome or subgroup title | No. of studies | No. of participants | Statistical method | Effect size |
| 1 Overall survival Show forest plot | 1 | 542 | Hazard Ratio (Random, 95% CI) | 0.73 [0.59, 0.90] |
| 2 Quality of life (change from baseline to week 15) Show forest plot | 1 | 520 | Mean Difference (IV, Random, 95% CI) | 9.05 [4.41, 13.69] |
| 3 Progression‐free survival Show forest plot | 1 | 542 | Hazard Ratio (Random, 95% CI) | 0.98 [0.81, 1.19] |
| 4 Response rate (partial and complete response) Show forest plot | 1 | 542 | Risk Ratio (M‐H, Random, 95% CI) | 1.85 [1.24, 2.77] |
| 5 Treatment‐related mortality Show forest plot | 1 | 521 | Risk Ratio (M‐H, Random, 95% CI) | 0.96 [0.24, 3.79] |
| 6 Discontinuation due to adverse event (any grade) Show forest plot | 1 | 521 | Risk Ratio (M‐H, Random, 95% CI) | 0.66 [0.39, 1.10] |
| 7 Serious adverse events (irrespective of attribution to treatment) Show forest plot | 1 | Risk Ratio (M‐H, Random, 95% CI) | Subtotals only | |
| 7.1 Serious adverse events (Grade 3, 4, or 5) | 1 | 521 | Risk Ratio (M‐H, Random, 95% CI) | 0.83 [0.72, 0.97] |
| 8 Serious adverse events (irrespective of attribution to treatment) Show forest plot | 1 | Peto Odds Ratio (Peto, Fixed, 95% CI) | Subtotals only | |
| 8.1 Pruritus (Grade 3, 4, or 5) | 1 | 521 | Peto Odds Ratio (Peto, Fixed, 95% CI) | 0.13 [0.00, 6.54] |
| 8.2 Fatigue (Grade 3, 4, or 5) | 1 | 521 | Peto Odds Ratio (Peto, Fixed, 95% CI) | 0.63 [0.28, 1.40] |
| 8.3 Diarrhoea (Grade 3, 4, or 5) | 1 | 521 | Peto Odds Ratio (Peto, Fixed, 95% CI) | 0.96 [0.24, 3.87] |
| 8.4 Anaemia (Grade 3, 4, or 5) | 1 | 521 | Peto Odds Ratio (Peto, Fixed, 95% CI) | 0.65 [0.37, 1.15] |
| 8.5 Constipation (Grade 3, 4, or 5) | 1 | 521 | Peto Odds Ratio (Peto, Fixed, 95% CI) | 0.38 [0.11, 1.25] |
| 8.6 Peripheral sensory neuropathy (Grade 3, 4, or 5) | 1 | 521 | Peto Odds Ratio (Peto, Fixed, 95% CI) | 0.13 [0.02, 0.74] |
| 8.7 Neutropenia (Grade 3, 4, or 5) | 1 | 521 | Peto Odds Ratio (Peto, Fixed, 95% CI) | 0.11 [0.06, 0.22] |
| 8.8 Alopecia (Grade 3, 4, or 5) | 1 | 521 | Peto Odds Ratio (Peto, Fixed, 95% CI) | 0.13 [0.01, 1.24] |
| 8.9 Hypothyroidism (Grade 3, 4, or 5) | 1 | 521 | Peto Odds Ratio (Peto, Fixed, 95% CI) | 0.0 [0.0, 0.0] |
| 8.10 Skin reaction (Grade 3, 4, or 5) | 1 | 521 | Peto Odds Ratio (Peto, Fixed, 95% CI) | 0.23 [0.05, 1.00] |
| Outcome or subgroup title | No. of studies | No. of participants | Statistical method | Effect size |
| 1 Overall survival based on performance status Show forest plot | 1 | Hazard Ratio (Random, 95% CI) | 0.74 [0.59, 0.92] | |
| 1.1 ECOG 0‐1 | 1 | Hazard Ratio (Random, 95% CI) | 0.74 [0.59, 0.93] | |
| 1.2 ECOG 2 | 1 | Hazard Ratio (Random, 95% CI) | 0.43 [0.04, 4.62] | |
| 2 Overall survival based on time since last chemotherapy Show forest plot | 1 | Hazard Ratio (Random, 95% CI) | 0.72 [0.58, 0.91] | |
| 2.1 Less than 3 months | 1 | Hazard Ratio (Random, 95% CI) | 0.82 [0.58, 1.16] | |
| 2.2 Equal or greater than 3 months | 1 | Hazard Ratio (Random, 95% CI) | 0.66 [0.49, 0.89] | |
| 3 Overall survival based on degree of pretreatment Show forest plot | 1 | Hazard Ratio (Random, 95% CI) | 0.72 [0.57, 0.91] | |
| 3.1 Two prior treatments for metastatic disease | 1 | Hazard Ratio (Random, 95% CI) | 0.83 [0.52, 1.32] | |
| 3.2 One prior treatment for metastatic disease | 1 | Hazard Ratio (Random, 95% CI) | 0.72 [0.54, 0.96] | |
| 3.3 Neoadjuvant | 1 | Hazard Ratio (Random, 95% CI) | 0.53 [0.20, 1.40] | |
| 3.4 Adjuvant | 1 | Hazard Ratio (Random, 95% CI) | 0.53 [0.18, 1.56] | |
| 4 Overall survival based on PD‐L1 tumour expression status Show forest plot | 1 | Hazard Ratio (Random, 95% CI) | 0.75 [0.51, 1.08] | |
| 4.1 PD‐L1 positive (>1% cut off) | 1 | Hazard Ratio (Random, 95% CI) | 0.61 [0.43, 0.87] | |
| 4.2 PD‐L1 negative (<1% cut off) | 1 | Hazard Ratio (Random, 95% CI) | 0.89 [0.66, 1.20] | |
| Outcome or subgroup title | No. of studies | No. of participants | Statistical method | Effect size |
| 1 Overall survival based on age Show forest plot | 1 | Hazard Ratio (Random, 95% CI) | 0.76 [0.60, 0.95] | |
| 1.1 < 65 years | 1 | Hazard Ratio (Random, 95% CI) | 0.75 [0.53, 1.06] | |
| 1.2 ≥ 65 years | 1 | Hazard Ratio (Random, 95% CI) | 0.76 [0.56, 1.03] | |
| 2 Overall survival based on sex Show forest plot | 1 | Hazard Ratio (Random, 95% CI) | 0.74 [0.59, 0.93] | |
| 2.1 Male | 1 | Hazard Ratio (Random, 95% CI) | 0.73 [0.56, 0.95] | |
| 2.2 Female | 1 | Hazard Ratio (Random, 95% CI) | 0.78 [0.49, 1.24] | |
| 3 Overall survival based on smoking status Show forest plot | 1 | Hazard Ratio (Random, 95% CI) | 0.68 [0.41, 1.15] | |
| 3.1 Current | 1 | Hazard Ratio (Random, 95% CI) | 0.32 [0.15, 0.68] | |
| 3.2 Former | 1 | Hazard Ratio (Random, 95% CI) | 0.71 [0.52, 0.97] | |
| 3.3 Never | 1 | Hazard Ratio (Random, 95% CI) | 1.06 [0.72, 1.56] | |
| 4 Overall survival based on histologic type Show forest plot | 1 | Hazard Ratio (Random, 95% CI) | 0.72 [0.54, 0.97] | |
| 4.1 Transitional cell | 1 | Hazard Ratio (Random, 95% CI) | 0.80 [0.62, 1.03] | |
| 4.2 Mixed | 1 | Hazard Ratio (Random, 95% CI) | 0.58 [0.37, 0.91] | |
| 5 Overall survival based on PD‐L1 tumour expression status (10% cutoff) Show forest plot | 1 | Hazard Ratio (Random, 95% CI) | 0.71 [0.51, 0.97] | |
| 5.1 < 10% | 1 | Hazard Ratio (Random, 95% CI) | 0.80 [0.61, 1.05] | |
| 5.2 ≥ 10% | 1 | Hazard Ratio (Random, 95% CI) | 0.57 [0.37, 0.88] | |
| 6 Overall survival based on location of primary tumour Show forest plot | 1 | Hazard Ratio (Random, 95% CI) | 0.72 [0.54, 0.95] | |
| 6.1 Upper tract | 1 | Hazard Ratio (Random, 95% CI) | 0.53 [0.28, 1.00] | |
| 6.2 Lower tract | 1 | Hazard Ratio (Random, 95% CI) | 0.77 [0.60, 0.99] | |
| 7 Overall survival based on location of metastases Show forest plot | 1 | Hazard Ratio (Random, 95% CI) | 0.73 [0.59, 0.91] | |
| 7.1 Lymph node only | 1 | Hazard Ratio (Random, 95% CI) | 0.46 [0.18, 1.18] | |
| 7.2 Visceral disease | 1 | Hazard Ratio (Random, 95% CI) | 0.75 [0.60, 0.94] | |
| 8 Overall survival based on liver metastases Show forest plot | 1 | Hazard Ratio (Random, 95% CI) | 0.74 [0.59, 0.94] | |
| 8.1 Liver metastases | 1 | Hazard Ratio (Random, 95% CI) | 0.85 [0.61, 1.18] | |
| 8.2 No liver metastases | 1 | Hazard Ratio (Random, 95% CI) | 0.67 [0.50, 0.90] | |
| 9 Overall survival based on haemoglobin concentration Show forest plot | 1 | Hazard Ratio (Random, 95% CI) | 0.72 [0.57, 0.90] | |
| 9.1 < 10 g/dl | 1 | Hazard Ratio (Random, 95% CI) | 0.75 [0.46, 1.22] | |
| 9.2 ≥ 10 g/dl | 1 | Hazard Ratio (Random, 95% CI) | 0.71 [0.55, 0.92] | |
| 10 Overall survival based on number of risk factors Show forest plot | 1 | Hazard Ratio (Random, 95% CI) | 0.78 [0.62, 0.98] | |
| 10.1 No risk factor | 1 | Hazard Ratio (Random, 95% CI) | 0.82 [0.42, 1.60] | |
| 10.2 1 risk factor | 1 | Hazard Ratio (Random, 95% CI) | 0.73 [0.49, 1.09] | |
| 10.3 2 risk factors | 1 | Hazard Ratio (Random, 95% CI) | 0.84 [0.56, 1.26] | |
| 10.4 3 or 4 risk factors | 1 | Hazard Ratio (Random, 95% CI) | 0.76 [0.47, 1.23] | |
| 11 Overall survival based on previous platinum therapy Show forest plot | 1 | Hazard Ratio (Random, 95% CI) | 0.73 [0.58, 0.92] | |
| 11.1 Cisplatin | 1 | Hazard Ratio (Random, 95% CI) | 0.73 [0.56, 0.95] | |
| 11.2 Carboplatin | 1 | Hazard Ratio (Random, 95% CI) | 0.74 [0.47, 1.17] | |
| 12 Overall survival based on investigator's choice of chemotherapy Show forest plot | 1 | Hazard Ratio (Random, 95% CI) | 0.73 [0.61, 0.88] | |
| 12.1 Paclitaxel | 1 | Hazard Ratio (Random, 95% CI) | 0.76 [0.55, 1.05] | |
| 12.2 Docetaxel | 1 | Hazard Ratio (Random, 95% CI) | 0.76 [0.55, 1.05] | |
| 12.3 Vinflunine | 1 | Hazard Ratio (Random, 95% CI) | 0.69 [0.51, 0.93] | |