Piperonyl butoxide (PBO) combined with pyrethroids in insecticide‐treated nets to prevent malaria in Africa
Abstract
Background
Pyrethroid long‐lasting insecticidal nets (LLINs) have been important in the large reductions in malaria cases in Africa, but insecticide resistance in Anopheles mosquitoes threatens their impact. Insecticide synergists may help control insecticide‐resistant populations. Piperonyl butoxide (PBO) is such a synergist; it has been incorporated into pyrethroid‐LLINs to form pyrethroid‐PBO nets, which are currently produced by five LLIN manufacturers and, following a recommendation from the World Health Organization (WHO) in 2017, are being included in distribution campaigns. This review examines epidemiological and entomological evidence on the addition of PBO to pyrethroid nets on their efficacy.
Objectives
To compare effects of pyrethroid‐PBO nets currently in commercial development or on the market with effects of their non‐PBO equivalent in relation to:
1. malaria parasite infection (prevalence or incidence); and
2. entomological outcomes.
Search methods
We searched the Cochrane Infectious Diseases Group (CIDG) Specialized Register, CENTRAL, MEDLINE, Embase, Web of Science, CAB Abstracts, and two clinical trial registers (ClinicalTrials.gov and WHO International Clinical Trials Registry Platform) up to 25 September 2020. We contacted organizations for unpublished data. We checked the reference lists of trials identified by these methods.
Selection criteria
We included experimental hut trials, village trials, and randomized controlled trials (RCTs) with mosquitoes from the Anopheles gambiae complex or the Anopheles funestus group.
Data collection and analysis
Two review authors assessed each trial for eligibility, extracted data, and determined the risk of bias for included trials. We resolved disagreements through discussion with a third review author. We analysed data using Review Manager 5 and assessed the certainty of evidence using the GRADE approach.
Main results
Sixteen trials met the inclusion criteria: 10 experimental hut trials, four village trials, and two cluster‐RCTs (cRCTs). Three trials are awaiting classification, and four trials are ongoing.
Two cRCTs examined the effects of pyrethroid‐PBO nets on parasite prevalence in people living in areas with highly pyrethroid‐resistant mosquitoes (< 30% mosquito mortality in discriminating dose assays). At 21 to 25 months post intervention, parasite prevalence was lower in the intervention arm (odds ratio (OR) 0.79, 95% confidence interval (CI) 0.67 to 0.95; 2 trials, 2 comparisons; moderate‐certainty evidence).
In highly pyrethroid‐resistant areas, unwashed pyrethroid‐PBO nets led to higher mosquito mortality compared to unwashed standard‐LLINs (risk ratio (RR) 1.84, 95% CI 1.60 to 2.11; 14,620 mosquitoes, 5 trials, 9 comparisons; high‐certainty evidence) and lower blood feeding success (RR 0.60, 95% CI 0.50 to 0.71; 14,000 mosquitoes, 4 trials, 8 comparisons; high‐certainty evidence). However, in comparisons of washed pyrethroid‐PBO nets to washed LLINs, we do not know if PBO nets had a greater effect on mosquito mortality (RR 1.20, 95% CI 0.88 to 1.63; 10,268 mosquitoes, 4 trials, 5 comparisons; very low‐certainty evidence), although the washed pyrethroid‐PBO nets did decrease blood‐feeding success compared to standard‐LLINs (RR 0.81, 95% CI 0.72 to 0.92; 9674 mosquitoes, 3 trials, 4 comparisons; high‐certainty evidence).
In areas where pyrethroid resistance is moderate (31% to 60% mosquito mortality), mosquito mortality was higher with unwashed pyrethroid‐PBO nets compared to unwashed standard‐LLINs (RR 1.68, 95% CI 1.33 to 2.11; 1007 mosquitoes, 2 trials, 3 comparisons; moderate‐certainty evidence), but there was little to no difference in effects on blood‐feeding success (RR 0.90, 95% CI 0.72 to 1.11; 1006 mosquitoes, 2 trials, 3 comparisons; moderate‐certainty evidence). For washed pyrethroid‐PBO nets compared to washed standard‐LLINs, we found little to no evidence for higher mosquito mortality or reduced blood feeding (mortality: RR 1.07, 95% CI 0.74 to 1.54; 329 mosquitoes, 1 trial, 1 comparison, low‐certainty evidence; blood feeding success: RR 0.91, 95% CI 0.74 to 1.13; 329 mosquitoes, 1 trial, 1 comparison; low‐certainty evidence).
In areas where pyrethroid resistance is low (61% to 90% mosquito mortality), studies reported little to no difference in the effects of unwashed pyrethroid‐PBO nets compared to unwashed standard‐LLINs on mosquito mortality (RR 1.25, 95% CI 0.99 to 1.57; 1580 mosquitoes, 2 trials, 3 comparisons; moderate‐certainty evidence), and we do not know if there was any effect on blood‐feeding success (RR 0.75, 95% CI 0.27 to 2.11; 1580 mosquitoes, 2 trials, 3 comparisons; very low‐certainty evidence). For washed pyrethroid‐PBO nets compared to washed standard‐LLINs, we do not know if there was any difference in mosquito mortality (RR 1.39, 95% CI 0.95 to 2.04; 1774 mosquitoes, 2 trials, 3 comparisons; very low‐certainty evidence) or on blood feeding (RR 1.07, 95% CI 0.49 to 2.33; 1774 mosquitoes, 2 trials, 3 comparisons; low‐certainty evidence).
In areas where mosquito populations are susceptible to insecticides (> 90% mosquito mortality), there may be little to no difference in the effects of unwashed pyrethroid‐PBO nets compared to unwashed standard‐LLINs on mosquito mortality (RR 1.20, 95% CI 0.64 to 2.26; 2791 mosquitoes, 2 trials, 2 comparisons; low‐certainty evidence). This is similar for washed nets (RR 1.07, 95% CI 0.92 to 1.25; 2644 mosquitoes, 2 trials, 2 comparisons; low‐certainty evidence). We do not know if unwashed pyrethroid‐PBO nets had any effect on the blood‐feeding success of susceptible mosquitoes (RR 0.52, 95% CI 0.12 to 2.22; 2791 mosquitoes, 2 trials, 2 comparisons; very low‐certainty evidence). The same applies to washed nets (RR 1.25, 95% CI 0.82 to 1.91; 2644 mosquitoes, 2 trials, 2 comparisons; low‐certainty evidence).
In village trials comparing pyrethroid‐PBO nets to LLINs, there was no difference in sporozoite rate (4 trials, 5 comparisons) nor in mosquito parity (3 trials, 4 comparisons).
Authors' conclusions
In areas of high insecticide resistance, pyrethroid‐PBO nets have greater entomological and epidemiological efficacy compared to standard LLINs, with sustained reduction in parasite prevalence, higher mosquito mortality and reduction in mosquito blood feeding rates 21 to 25 months post intervention. Questions remain about the durability of PBO on nets, as the impact of pyrethroid‐PBO nets on mosquito mortality was not sustained over 20 washes in experimental hut trials, and epidemiological data on pyrethroid‐PBO nets for the full intended three‐year life span of the nets is not available. Little evidence is available to support greater entomological efficacy of pyrethroid‐PBO nets in areas where mosquitoes show lower levels of resistance to pyrethroids.
PICO
Plain language summary
Pyrethroid‐PBO nets to prevent malaria
Background
Bed nets treated with pyrethroid insecticides are an effective way to reduce malaria transmission and have been deployed across Africa. However, mosquitoes that spread malaria are now developing resistance to this type of insecticide. One way to overcome this resistance is to add another chemical ‐ piperonyl butoxide (PBO) ‐ to the net. PBO is not an insecticide, but it blocks the substance (an enzyme) inside the mosquito that stops pyrethroids from working.
What is the aim of this review?
The aim of this Cochrane Review was to find out if pyrethroid‐PBO nets provide additional protection against malaria when compared to standard pyrethroid‐only nets.
Key messages
Pyrethroid‐PBO nets were more effective than standard pyrethroid‐only nets in killing mosquitoes and preventing blood feeding in areas where mosquito populations are very resistant to pyrethroid insecticides (high‐certainty evidence). Pyrethroid‐PBO nets reduced the number of malaria infections in areas of high pyrethroid resistance (moderate‐certainty evidence), although further studies are needed to measure clinical outcomes for the full lifetime of the net.
What was studied in the review?
We included 16 trials conducted between 2010 and 2020 that compared standard pyrethroid nets to pyrethroid‐PBO nets. These consisted of 10 experimental hut trials that measured the impact of pyrethroid‐PBO nets on a wild population of mosquitoes, four village trials, and two cRCTs. The two cRCTs measured the impact of pyrethroid‐PBO nets on malaria infection in humans; all other studies recorded their impact on mosquito populations. We analysed hut and village studies to determine whether pyrethroid‐PBO nets were better for killing mosquitoes and preventing them from blood feeding. For both cRCT trials, we examined whether pyrethroid‐PBO nets reduced the number of malaria infections. As the benefit of adding PBO to nets is likely to depend on the level of pyrethroid resistance in the mosquito population, we performed separate analyses for studies conducted in areas of high, medium, and low levels of pyrethroid resistance.
What are the main results of the review?
When mosquitoes show high levels of resistance to pyrethroids, pyrethroid‐PBO nets perform better than standard pyrethroid‐only nets for killing mosquitoes and preventing them from blood feeding. As expected, this effect is not seen in areas where mosquitoes show low or no resistance to pyrethroid‐only insecticides. Two trials looked at the impact of using pyrethroid‐PBO nets on the number of people infected with the malaria parasite. These trials, involving 10,603 participants in total and conducted in an area where mosquitoes are very resistant to pyrethroids, found that fewer people were infected with malaria when the population used pyrethroid‐PBO nets than when standard pyrethroid‐only nets were used.
How up‐to‐date is this review?
We searched for all studies and trials that had been published up to 25 September 2020.
Authors' conclusions
Summary of findings
| Pyrethroid‐piperonyl butoxide (PBO) nets compared to long‐lasting insecticidal nets (LLINs) for malaria control when insecticide resistance is high | ||||||
| Patient or population: adults and childen living in malaria‐endemic areas, Anopheles gambiae complex or Anopheles funestus group | ||||||
| Outcomes | Anticipated absolute effects* (95% CI) | Relative effect | Number of participants, | Certainty of the evidence | Comments | |
|---|---|---|---|---|---|---|
| Risk with LLIN | Risk with pyrethroid‐PBO nets | |||||
| Parasite prevalence (4‐ to 6‐month follow‐up) | 254 per 1000a | 201 per 1000 (174 to 233)a | OR 0.74 (0.62 to 0.89) | 11,582 people (2 trials, 2 comparisons, 61 PBO clusters, 64 non‐PBO clusters) | ⊕⊕⊕⊕ | Pyrethroid‐PBO nets at 4‐ to 6‐month follow‐up reduce parasite prevalence in areas of high insecticide resistance |
| Parasite prevalence (9‐ to 12‐month follow‐up) | 224 per 1000a | 172 per 1000 (150 to 199)a | OR 0.72 (0.61 to 0.86) | 11,370 people (2 trials, 2 comparisons, 61 PBO clusters, 64 non‐PBO clusters) | ⊕⊕⊕⊝ due to inconsistency | Pyrethroid‐PBO nets at 9‐ to 12‐month follow‐up reduce parasite prevalence in areas of high insecticide resistance |
| Parasite prevalence (16‐ to 18‐month follow‐up) | 248 per 1000a | 225 per 1000 (196 to 255)a | OR 0.88 (0.74 to 1.04) | 11,822 people (2 trials, 2 comparisons, 61 PBO clusters, 64 non‐PBO clusters) | ⊕⊕⊕⊝ due to inconsistency | Pyrethroid‐PBO nets at 16‐ to 18‐month follow‐up reduce parasite prevalence in areas of high insecticide resistance |
| Parasite prevalence (21‐ to 25‐month follow‐up) | 350 per 1000a | 298 per 1000 (265 to 338)a | OR 0.79 (0.67 to 0.95) | 10,603 people (2 trials, 2 comparisons, 54 PBO clusters, 60 non‐PBO clusters) | ⊕⊕⊕⊝ due to inconsistency | Pyrethroid‐PBO nets at 21‐ to 25‐month follow‐up reduce parasite prevalence in areas of high insecticide resistance |
| Mosquito mortality (unwashed nets) | 238 per 1000a | 438 per 1000 | RR 1.84 | 14,620 mosquitoes | ⊕⊕⊕⊕ | Mosquito mortality is higher with unwashed pyrethroid‐PBO nets compared to standard unwashed LLINs in areas of high insecticide resistance |
| Mosquito mortality (washed nets) | 201 per 1000a | 242 per 1000 | RR 1.20 | 10,268 mosquitoes | ⊕⊝⊝⊝ due to imprecision and inconsistency | We do not know whether pyrethroid‐PBO nets have an effect on mosquito mortality in areas of high insecticide resistance when the nets have been washed |
| Blood‐feeding success (unwashed nets) | 438 per 1000a | 263 per 1000 | RR 0.60 (0.50 to 0.71)
| 14,000 mosquitoes | ⊕⊕⊕⊕ | Mosquito blood‐feeding success is decreased with unwashed pyrethroid‐PBO nets compared to standard unwashed LLINs in areas of high insecticide resistance |
| Blood‐feeding success (washed nets) | 494 per 1000a | 400 per 1000 | RR 0.81 | 9674 mosquitoes | ⊕⊕⊕⊕ | Mosquito blood‐feeding success is decreased with washed pyrethroid‐PBO nets compared to standard washed LLINs in areas of high insecticide resistance |
| *The risk in the intervention group (and its 95% CI) is based on the assumed risk in the comparison group and the relative effect of the intervention (and its 95% CI). | ||||||
| GRADE Working Group grades of evidence. | ||||||
| aOriginal numbers were used in this table; however in pooled analysis, events and total numbers were generated from cluster‐adjusted results, which use the effective sample size. Note that cluster adjustments do not change the point estimate of the effect size ‐ just the standard error. | ||||||
| Pyrethroid‐piperonyl butoxide (PBO) nets compared to long‐lasting insecticidal nets (LLINs) for malaria control when insecticide resistance is moderate | ||||||
| Patient or population:Anopheles gambiae complex or Anopheles funestus group | ||||||
| Outcomes | Anticipated absolute effects* (95% CI) | Relative effect | Number of mosquitoes | Certainty of the evidence | Comments | |
|---|---|---|---|---|---|---|
| Risk with LLIN | Risk with pyrethroid‐PBO nets | |||||
| Mosquito mortality (unwashed nets) | 180 per 1000a | 303 per 1000 | RR 1.68 | 1007 | ⊕⊕⊕⊝ due to imprecision | Mosquito mortality is probably higher with unwashed pyrethroid‐PBO nets compared to standard unwashed LLINs in areas of moderate insecticide resistance |
| Mosquito mortality (washed nets) | 287 per 1000a | 307 per 1000 | RR 1.07 | 329 | ⊕⊕⊝⊝ due to imprecision and indirectness | There may be little to no difference in the effect of washed pyrethroid‐PBO nets on mosquito mortality compared to standard washed LLINs (washed) in areas of moderate insecticide resistance |
| Blood‐feeding success (unwashed nets) | 258 per 1000a | 232 per 1000 | RR 0.90 | 1006 | ⊕⊕⊕⊝ due to imprecision | There is probably little to no difference in the effect of pyrethroid‐PBO nets (unwashed) on mosquito blood‐feeding success compared to standard LLINs in areas of moderate insecticide resistance |
| Blood‐feeding success (washed nets) | 586 per 1000a | 533 per 1000 | RR 0.91 | 329 | ⊕⊕⊝⊝ due to imprecision and indirectness | There may be little to no difference in the effect of washed pyrethroid‐PBO nets on mosquito blood‐feeding success compared to standard washed LLINs in areas of moderate insecticide resistance |
| *The risk in the intervention group (and its 95% CI) is based on the assumed risk in the comparison group and the relative effect of the intervention (and its 95% CI). | ||||||
| GRADE Working Group grades of evidence. | ||||||
| aOriginal numbers are used in this table; however for the pooled analysis, we generated events and total numbers from cluster‐adjusted results, which used the effective sample size. Note that cluster adjustments do not change the point estimate of the effect size, just the standard error. | ||||||
| Pyrethroid‐piperonyl butoxide (PBO) nets compared to long‐lasting insecticidal nets (LLINs) for malaria control when insecticide resistance is low | ||||||
| Patient or population:Anopheles gambiae complex or Anopheles funestus group | ||||||
| Outcomes | Anticipated absolute effects* (95% CI) | Relative effect | Number of mosquitoes | Certainty of the evidence | Comments | |
|---|---|---|---|---|---|---|
| Risk with LLINs | Risk with pyrethroid‐PBO nets | |||||
| Mosquito mortality (unwashed nets) | 527 per 1000a | 659 per 1000 | RR 1.25 | 1580 | ⊕⊕⊕⊝ due to imprecision | There is probably little to no difference in the effect of unwashed pyrethroid‐PBO nets on mosquito mortality compared to standard unwashed LLINs in areas of low insecticide resistance |
| Mosquito mortality (washed nets) | 394 per 1000a | 547 per 1000 | RR 1.39 | 1774 | ⊕⊝⊝⊝ due to imprecision and inconsistency | We do not know if pyrethroid‐PBO nets have an effect on mosquito mortality in areas of low insecticide resistance when the nets have been washed |
| Blood‐feeding success (unwashed nets) | 201 per 1000a | 151 per 1000 | RR 0.75 | 1580 | ⊕⊝⊝⊝ due to imprecision and inconsistency | We do not know if unwashed pyrethroid‐PBO nets have an effect on mosquito blood‐feeding success in areas of low insecticide resistance |
| Blood‐feeding success (washed nets) | 161 per 1000a | 172 per 1000 | RR 1.07 | 1774 | ⊕⊕⊝⊝ due to inconsistency | Mosquito blood‐feeding success may decrease with washed pyrethroid‐PBO nets compared to standard washed LLINs in areas of low insecticide resistance |
| *The risk in the intervention group (and its 95% CI) is based on the assumed risk in the comparison group and the relative effect of the intervention (and its 95% CI). | ||||||
| GRADE Working Group grades of evidence. | ||||||
| aOriginal numbers are used in this table; however for the pooled analysis, events and total numbers were generated from cluster‐adjusted results, which use the effective sample size. Note that cluster adjustments do not change the point estimate of the effect size, just the standard error. | ||||||
| Pyrethroid‐piperonyl butoxide (PBO) nets compared to long‐lasting insecticidal nets (LLINs) for malaria control when mosquitoes are susceptible | ||||||
| Patient or population:Anopheles gambiae complex or Anopheles funestus group Intervention: pyrethroid‐PBO nets | ||||||
| Outcomes | Anticipated absolute effects* (95% CI) | Relative effect | Number of mosquitoes | Certainty of the evidence | Comments | |
|---|---|---|---|---|---|---|
| Risk with LLINs | Risk with pyrethroid‐PBO nets | |||||
| Mosquito mortality (unwashed nets) | 392 per 1000a | 471 per 1000 | RR 1.20 | 2791 | ⊕⊕⊝⊝ due to imprecision | There may be little to no difference in the effect of unwashed pyrethroid‐PBO nets on mosquito mortality compared to standard unwashed LLINs in areas of no insecticide resistance |
| Mosquito mortality (washed nets) | 457 per 1000a | 489 per 1000 | RR 1.07 | 2644 | ⊕⊕⊝⊝ due to imprecision | There may be little to no difference in the effect of washed pyrethroid‐PBO nets on mosquito mortality compared to standard washed LLINs in areas of no insecticide resistance |
| Blood‐feeding success (unwashed nets) | 57 per 1000a | 29 per 1000 | RR 0.52 | 2791 | ⊕⊝⊝⊝ due to imprecision and inconsistency | We do not know if unwashed pyrethroid‐PBO nets have an effect on mosquito blood‐feeding success in areas of no insecticide resistance |
| Blood‐feeding success (washed nets) | 64 per 1000a | 82 per 1000 | RR 1.25 | 2644 | ⊕⊝⊝⊝ due to imprecision and inconsistency | We do not know if washed pyrethroid‐PBO nets have an effect on mosquito blood‐feeding success in areas of no insecticide resistance |
| *The risk in the intervention group (and its 95% CI) is based on the assumed risk in the comparison group and the relative effect of the intervention (and its 95% CI). | ||||||
| GRADE Working Group grades of evidence. | ||||||
| aOriginal numbers are used in this table; however for the pooled analysis, events and total numbers were generated from cluster‐adjusted results, which use the effective sample size. Note that cluster adjustments do not change the point estimate of the effect size, just the standard error. | ||||||
Background
Description of the condition
Substantial progress has been made in reducing the burden of malaria in the 21st century. It is estimated that the clinical incidence of Plasmodiumfalciparum malaria in Africa dropped by 40% between 2000 and 2015, equating to prevention of 663 million cases (Bhatt 2015; WHO‐GMP 2015). However progress has stalled in recent years (WHO 2019a). Targeting the mosquito vector has proved to be the most effective method of malaria prevention in Africa, with over two‐thirds of malaria cases averted in the first 15 years of this century attributed to scale‐up in the use of long‐lasting insecticidal nets (LLINs) (Bhatt 2015). This method of malaria prevention is particularly effective in Africa, where the major malaria vectors Anopheles gambiae and Anopheles funestus are largely endophagic (feed indoors) and endophilic (rest indoors after blood feeding).
Currently all LLINs contain pyrethroids; pyrethroids have the required dual properties of low mammalian toxicity and rapid insecticidal activity (Zaim 2000), and their repellent or contact irritant effects may enhance the personal protection of LLINs. Unfortunately, resistance to pyrethroids is now widespread in African malaria vectors (Ranson 2016). This may be the result of mutations in target‐site proteins (target‐site resistance) (Ranson 2011; Ridl 2008), which result in reduced sensitivity to the insecticide or increased activity of detoxification enzymes (metabolic resistance) (Mitchell 2012; Stevenson 2011), or other as yet poorly described resistance mechanisms, or a combination of all or some of these factors. The evolution of insecticide resistance and its continuing spread threaten the operational success of malaria vector control interventions. The current impact of this resistance on malaria transmission is largely unquantified and varies depending on level of resistance, malaria endemicity, and proportion of the human population using LLINs (Churcher 2016). A multi‐country trial found no evidence that pyrethroid resistance reduced the personal protection provided by the use of LLINs (Kleinschmidt 2018). However, it is generally accepted that resistance will eventually erode the efficacy of pyrethroid‐only LLINs, and that innovation in the LLIN market is essential to maintain the efficacy of this preventative measure (MPAC 2016).
Description of the intervention
One way of controlling insecticide‐resistant mosquito populations is through the use of insecticide synergists. Synergists are generally non‐toxic and act by enhancing the potency of insecticides. Piperonyl butoxide (PBO) is a synergist that inhibits specific metabolic enzymes within mosquitoes and has been incorporated into pyrethroid‐treated LLINs to form PBO‐combination nets (hereafter referred to as pyrethroid‐PBO nets). Insecticide‐synergist combination nets represent a new product class with the capacity to affect insecticide‐resistant populations. In 2017, the World Health Organization (WHO) gave pyrethroid‐PBO nets an interim endorsement as a new vector control class and recommended that countries consider deploying these nets in areas where pyrethroid resistance has been confirmed among main malaria vectors (WHO‐GMP 2017a).
Currently six pyrethroid‐PBO nets are in production: Olyset® Plus; PermaNet® 3.0; Veeralin® LN; Tsara Plus (previously DawaPlus 3.0); Tsara Boost (previously DawaPlus 4.0); and DuraNet Plus. Olyset Plus, which is manufactured by Sumitomo Chemical Company Ltd., is a polyethylene net treated with permethrin (20 g/kg ± 25%) and PBO (10 g/kg ± 25%) across the whole net (Sumitomo 2013). PermaNet 3.0, which is manufactured by Vestergaard Frandsen, is a mixed polyester (sides) polyethylene (roof) net treated with deltamethrin and PBO; PBO is found only on the roof of the net (25 g/kg ± 25%), and the concentration of deltamethrin varies depending on location (roof: 4.0 g/kg ± 25%) and yarn type (sides: 75‐denier (thickness) yarn with 70‐cm lower border 2.8 g/kg ± 25%, 100‐denier yarn without border 2.1 g/kg ± 25%; Vestergaard 2015). Veeralin LN, manufactured by Vector Control Innovations Private Ltd., is a polyethylene net treated with alpha‐cypermethrin (6.0 g/kg) and PBO (2.2 g/kg) across the whole net (WHOPES 2016). Tsara Plus and Tsara Boost are manufactured by NRS Moon Netting FZE. Tsara Plus is treated with deltamethrin (3 g/kg) and PBO (11 g/kg) on the roof, and with deltamethrin only (2.5 g/kg) on its sides. Tsara Boost is treated with deltamethrin (120 mg/m²) and PBO (440 mg/m²) on all panels. DuraNet Plus, manufactured by Shobikaa Impex Private Limited, is a polyethylene net treated with alpha‐cypermethrin (6.0 g/kg) and PBO (2.2 g/kg) across the whole net.
How the intervention might work
PBO inhibits metabolic enzyme families, in particular the cytochrome P450 enzymes that detoxify or sequester pyrethroids. Increased production of P450s is thought to be the most potent mechanism of pyrethroid resistance in malaria vectors, and pre‐exposure to PBO has been shown to restore susceptibility to pyrethroids in laboratory bioassays on multiple pyrethroid‐resistant vector populations (Churcher 2016).
Widespread use of conventional LLINs provides both personal and community protection from malaria (Bhatt 2015; Lengeler 2004). In areas where mosquito populations are resistant to pyrethroids, experimental hut trials (as described in the Types of studies section) have shown that mosquito mortality rates and protection from blood feeding are substantially reduced when conventional LLINs are used (Abílio 2015; Awolola 2014; Bobanga 2013; N'Guessan 2007; Riveron 2015; Yewhalaw 2012). The addition of PBO to pyrethroids in LLINs can restore the killing effects of LLINs in areas where this has been eroded by insecticide resistance. LLINs that contain PBO have been evaluated in multiple experimental hut trials across Africa (Adeogun 2012; Bayili 2017; Corbel 2010; Koudou 2011; Menze 2020; Moore 2016; N'Guessan 2010; Oumbouke 2019; Pennetier 2013; Toé 2018; Tungu 2010). In most settings, pyrethroid‐PBO nets resulted in higher rates of mosquito mortality and greater blood‐feeding inhibition than conventional LLINs, although the magnitude of this effect was variable. Village trials have measured the impact on sporozoite infection rates in mosquitoes with mixed results (Awolola 2014; Cisse 2017; Mzilahowa 2014; Stiles‐Ocran 2013). Recently, two separate cluster‐randomized trials (cRCTs) in Tanzania and Uganda demonstrated that use of pyrethroid‐PBO nets can reduce parasite prevalence in children (Protopopoff 2018; Staedke 2020).
Why it is important to do this review
All LLINs approved by the WHO Prequalification Team (formerly the WHO Pesticide Evaluation Scheme (WHOPES)) contain pyrethroids. Six bed nets that contain PBO have received WHO pre‐qualification and have been recognized as a new product class by WHO (WHO‐GMP 2017a). As pyrethroid‐PBO nets are generally more expensive than conventional LLINs, it is important to determine if they are superior to conventional LLINs, and under what circumstances, to enable cost‐effectiveness trials to be performed to inform procurement decisions.
An Expert Review Group (ERG) commissioned by the WHO has recommended pyrethroid‐PBO nets be considered for use in areas where the major malaria vectors are resistant to pyrethroids (WHO‐GMP 2017a). This guidance has been adopted by some net providers, for example, the President's Malaria Initiative (PMI) (PMI 2018). The WHO recommendation was largely based on a single randomized controlled trial (RCT) of one pyrethroid‐PBO net type conducted in Tanzania (Protopopoff 2018), but it was also supported by a meta‐analysis of performance of pyrethroid‐PBO nets in experimental hut trials, which was used to parameterize a malaria transmission model to predict the public health benefit of pyrethroid‐PBO nets (Churcher 2016). The WHO recommendation is that countries should consider deployment of this new product class in areas with intermediate levels of pyrethroid resistance, but it calls for further evidence, including data from a second clinical trial (WHO 2019b). Results of a second RCT evaluating the epidemiological impact of pyrethroid‐PBO nets in Uganda were published in 2020, and this review has been updated to include these data (Staedke 2020).
In an attempt to assess evidence of effectiveness of pyrethroid‐PBO nets against African malaria vectors in areas with differing levels of insecticide resistance, we have conducted a systematic review of all relevant trials and examined both epidemiological and entomological endpoints. We appreciate that evaluation of PBO will depend on trials in which the background insecticide and dose are the same in both intervention and control groups; we are aware that most trials have evaluated pyrethroid‐PBO nets against pyrethroid‐only LLINs with different background insecticides and doses, which confounds the effects.
Objectives
To compare effects of pyrethroid‐PBO nets currently in commercial development or on the market with effects of their non‐PBO equivalent in relation to:
-
malaria parasite infection (prevalence or incidence); and
-
entomological outcomes
Methods
Criteria for considering studies for this review
Types of studies
We included:
-
randomized trials that measured epidemiological outcomes, entomological outcomes, or both; and
-
experimental hut trials.
See Table 1 for detailed WHOPES definitions.
| WHOPES Phase | Definition |
|---|---|
| WHOPES Phase I. Laboratory bioassays | Cone bioassays: these studies are conducted in the laboratory setting and use standard WHO protocols (WHO 2013, Section 2.2.1), when mosquitoes are exposed to a suitable LLIN (treated intervention or untreated control) for three minutes using a standard plastic WHO cone. Following net exposure, mosquitoes are transferred to a holding container and are maintained on a sugar solution diet while entomological outcomes (mosquitoes knocked down 1 hour post exposure, and mosquito mortality 24 hours post exposure) are measured. Tunnel tests: these studies are conducted in the laboratory setting and use standard WHO protocols (WHO 2013, Section 2.2.2). Mosquitoes are released into a glass tunnel covered at each end with untreated netting. The intervention or control LLIN net sample is placed one‐third down the length of the tunnel, and the net contains 9 holes that enable mosquitoes to pass through. A suitable bait is immobilized in the shorter section of the tunnel, where it is available for mosquito biting. Mosquitoes are released into the opposite end of the tunnel and must make contact with the net and locate holes before they are able to feed on the bait. After 12 to 15 hours, mosquitoes are removed from both sections of the tunnel, and entomological outcomes (the number of mosquitoes in each section, mortality, and blood‐feeding inhibition at the end of the assay and 24 hours post exposure) are recorded. Wire‐ball bioassays: these studies are conducted in the laboratory setting, where mosquitoes are introduced into a wire‐ball frame that has been covered with the intervention or control LLIN. Mosquitoes are exposed for 3 minutes, after which they are transferred to a holding container, and entomological outcomes (mosquitoes knocked down 1 hour post exposure, and mosquito mortality 24 hours post exposure) are measured. |
| WHOPES Phase II. Experimental hut trials | WHOPES Phase II experimental hut trials are field trials conducted in Africa where wild mosquito populations or local colonized populations are evaluated. Volunteers or livestock sleep in experimental huts under a purposefully holed LLIN, with 1 person or animal per hut. Huts are designed to resemble local housing based on a West or East African design (WHO 2013; Section 3.3.1‐2). However these trials have identical design features, such as eave gaps or entry slits to allow mosquitoes to enter, and exit traps to capture exiting mosquitoes. LLINs and volunteers are randomly allocated to huts and are rotated in a Latin square to avoid bias, with huts cleaned between rotations to avoid contamination. Several nets, including an untreated control net, can be tested at the same time. Dead and live mosquitoes are collected each morning from inside the net, inside the hut, and inside the exit traps. They are then scored as blood‐fed or non‐blood‐fed, and as alive or dead, and live mosquitoes are maintained for a further 24 hours to assess delayed mosquito mortality. |
| WHOPES Phase III. Village trials | WHOPES Phase III village trials are conducted in Africa where wild mosquito populations are evaluated. Villages chosen to be included in the study are similar in terms of size, housing structure, location, and data available on insecticide resistance status of local malaria vectors. Households are assigned as conventional LLINs or PBO‐LLINs. Randomization can be done at the household or village level. Adult mosquitoes are collected from study houses, and mosquito density is measured. An indication of malaria transmission is measured at the study sites by recording infections in mosquitoes, parasite prevalence, or malaria incidence. |
LLIN: long‐lasting insecticidal nets; PBO: piperonyl butoxide; WHOPES: World Health Organization Pesticide Evaluation Scheme.
Types of participants
Mosquitoes
Anopheles gambiae complex or Anopheles funestus group. Included trials had to test a minimum of 50 mosquitoes per trial arm. We examined the insecticide resistance level (measured by phenotypic resistance) during data analysis.
Humans
Adults and children living in malaria‐endemic areas.
Types of interventions
Intervention
Bed nets treated with both PBO and a pyrethroid insecticide. Nets must have received a minimum of interim‐WHO approval (Table 2), and LLINs had to be treated with a WHO‐recommended dose of pyrethroid (Table 3).
| Product name | Product type | Status of WHO recommendation |
|---|---|---|
| DawaPlus 2.0 | Deltamethrin coated on polyester | Interim |
| DawaPlus 3.0 | Combination of deltamethrin coated onto polyester (side panels) and deltamethrin and PBO incorporated into polyester (roof) | Interim |
| DawaPlus 4.0 | Deltamethrin and PBO incorporated into polyester | Interim |
| Duranet | Alpha‐cypermethrin incorporated into polyethylene | Full |
| Interceptor | Alpha‐cypermethrin coated on polyester | Full |
| Interceptor G2 | Alpha‐cypermethrin and chlorfenapyr incorporated into polyester | Interim |
| LifeNet | Deltamethrin incorporated into polypropylene | Interim |
| MAGNet | Alpha‐cypermethrin incorporated into polyethylene | Full |
| MiraNet | Alpha‐cypermethrin incorporated into polyethylene | Interim |
| Olyset Net | Permethrin incorporated into polyethylene | Full |
| Olyset Plus | Permethrin (20 g/kg) and PBO (10 g/kg) incorporated into polyethylene | Interim |
| Panda Net 2.0 | Deltamethrin incorporated into polyethylene | Interim |
| PermaNet 2.0 | Deltamethrin coated on polyester | Full |
| PermaNet 3.0 | Combination of deltamethrin coated on polyester with strengthened border (side panels) and deltamethrin and PBO incorporated into polyethylene (roof) | Interim |
| Royal Sentry | Alpha‐cypermethrin incorporated into polyethylene | Full |
| SafeNet | Alpha‐cypermethrin coated on polyester | Full |
| Veeralin | Alpha‐cypermethrin and PBO incorporated into polyethylene | Interim |
| Yahe | Deltamethrin coated on polyester | Interim |
| Yorkool | Deltamethrin coated on polyester | Full |
LLIN: long‐lasting insecticidal net; PBO: piperonyl butoxide; WHO: World Health Organization.
| Insecticide | Formulation | Dosagea |
|---|---|---|
| Alpha‐cypermethrin | SC 10% | 20 to 40 |
| Cyfluthrin | EW 5% | 50 |
| Deltamethrin | SC 1% | 15 to 25 |
| Etofenprox | EW 10% | 200 |
| Lambda‐cyhalothrin | CS 2.5% | 10 to 15 |
| Permethrin | EC 10% | 200 to 500 |
EC: emulsifiable concentrate; EW: emulsion, oil in water; CS: capsule suspension; SC: suspension concentrate; WT: water dispersible tablet.
aActive ingredient/netting (mg/m²).
bK‐O TAB 1‐2‐3.
Control
Conventional LLINs that contain pyrethroid only. Nets could be treated with the same insecticide at different doses from the intervention net to allow critical appraisal of all pyrethroid‐PBO nets currently in development or on the market. For both intervention and control arms, nets could be unholed, holed, unwashed, or washed, provided the trials adhered to WHO guidelines (WHO 2013).
Types of outcome measures
Trials had to include at least one of the following primary outcomes to be eligible for inclusion.
Primary outcomes
Epidemiological
-
Parasite prevalence: presence of malaria parasites detected through microscopy of blood or rapid diagnostic tests (RDTs)
-
Incidence of clinical malaria: clinical diagnosis based on participants' symptoms and on physical findings at examination
Entomological
-
Mosquito mortality: immediate death or delayed death (up to 24 hours), or both, measured as a proportion of total mosquito number. A mosquito is classified as dead if it is immobile, cannot stand or fly, or shows no sign of life
-
Mosquito knock‐down: mosquito ‘mortality' recorded one hour post insecticide exposure, termed ‘knock‐down', as some mosquitoes may recover during the 24‐hour recovery period before mosquito mortality is recorded at 24 hours post exposure
-
Blood‐feeding success: number of mosquitoes that have blood‐fed (alive or dead)
-
Sporozoite rate: percentage of mosquitoes with sporozoites in the salivary glands
Secondary outcomes
Entomological
-
Deterrence: the number of mosquitoes that enter a hut that is using a pyrethroid‐PBO net relative to the number of mosquitoes found in a control hut that is using a standard LLIN (experimental hut trials only)
-
Exophily: the proportion of mosquitoes found in exit/veranda traps of a hut that is using a pyrethroid‐PBO net relative to the control hut that is using a standard LLIN (experimental hut trials only)
-
Mosquito density: measured by all standard methods, such as window exit traps, indoor resting collections, floor sheet collections, pyrethrum spray catch, and light traps (village trials)
-
Parity rate: percentage of parous mosquitoes detected by mosquito ovary dissections (village trials)
Search methods for identification of studies
We identified all relevant trials regardless of language or publication status (published, unpublished, in press, and in progress). We have presented the search strategies in Appendix 1.
Electronic searches
Vittoria Lutje, the Cochrane Infectious Diseases Group (CIDG) Information Specialist, searched the following databases on 25 September 2020 using the search terms and strategy described in Appendix 1: the CIDG Specialized Register; the Cochrane Central Register of Controlled Trials (CENTRAL; 2018, Issue 8), included in the Cochrane Library; MEDLINE (PubMed); Embase (OVID); Web of Science Core Collection; and CAB Abstracts. She also searched for trials in progress at the WHO International Clinical Trials Registry Platform (WHO ICTRP; www.who.int/ictrp/en/) and ClinicalTrials.gov (clinicaltrials.gov/ct2/home).
Searching other resources
We contacted the following organizations for unpublished data: the PMI; the Innovative Vector Control Consortium (IVCC); Vestergaard Frandsen; Sumitomo Chemical Company Ltd.; Vector Control Innovations Private Ltd.; Endura SpA; and WHOPES. We checked the reference lists of trials identified by the above methods.
Data collection and analysis
All analyses were stratified by trial design and mosquito insecticide resistance level when possible. We performed analyses for the primary outcomes stratified by follow‐up time (4 to 6 months, 9 to 12 months, 16 to 18 months, and 21 to 25 months).
We determined whether mosquito populations are susceptible or resistant to pyrethroid insecticides based on WHO definitions (WHO 2016; Table 4). We used 24‐hour mosquito mortality to determine resistance status; however if this had been unavailable, we intended to use knock‐down 60 minutes after the end of the assay. We stratified resistant populations into low‐, moderate‐, and high‐prevalence resistance groups (Table 5), by dividing resistant mosquitoes (i.e. those with < 90% mortality) into three equal groups, with the lower third being most resistant and the upper third most susceptible.
| Outcome | Confirmed resistance | Suspected resistance | Susceptible | Unclassified |
|---|---|---|---|---|
| WHO mosquito mortalitya | < 90% | 90% to 97% | 98% to 100% | Unknown |
| CDC knock‐downb | < 90% | 80% to 97% | 98% to 100% | Unknown |
CDC: Centers for Disease Control and Prevention; WHO: World Health Organization.
aDefinition of resistance level based on mosquito mortality (%) after exposure to insecticide in a WHO diagnostic dose assay.
bDefinition of resistance level based on mosquito mortality (%) after exposure to insecticide in a CDC bottle bioassay using the methods, diagnostic doses, and diagnostic times recommended by each test respectively.
| Outcome | Low | Moderate | High | Unclassified |
|---|---|---|---|---|
| Mosquito mortalitya | 61% to 90% | 31% to 60% | < 30% | Unknown |
a24‐hour post‐exposure mortality (%).
Selection of studies
Two review authors (KG and NL or LC) independently screened titles and abstracts of all retrieved references based on the inclusion criteria (Table 6). We resolved any inconsistencies between review authors' selections by discussion. If we were unable to reach an agreement, we consulted a third review author (HR). We retrieved full‐text trial reports for all potentially relevant citations. Two review authors independently screened the full‐text articles and identified trials for inclusion, and identified and recorded reasons for exclusion of ineligible trials in a Characteristics of excluded studies table. We resolved any disagreements through discussion or, if required, we consulted a third review author (HR). We identified and excluded duplicates and collated multiple reports of the same trial, so that each trial, rather than each report, was the unit of interest in the review. We recorded the selection process in sufficient detail to complete a PRISMA flow diagram (Moher 2009).
| Criteria | Assessment | Comments | ||
|---|---|---|---|---|
| Yes | No | Unclear | ||
| Mosquito population | ||||
| Did the study test Anopheles gambiae complex or Anopheles funestus group mosquitoes? | ↓ | — | ↓ | State mosquito species |
| Were a minimum of 50 mosquitoes tested per study arm? | ↓ | — | ↓ | |
| Intervention | ||||
| Did the study include a long‐lasting insecticidal net (LLIN) or insecticide‐treated net (ITN)? | ↓ | — | ↓ | State net LLIN or ITN |
| Was the intervention net either of the following?
| ↓ | — | ↓ | State net type |
| Was the control net either of the following?
| ↓ | — | ↓ | State which objective study meets |
| Study design | ||||
| Was the study one of the following?
| ↓ | — | ↓ | State study type |
| For experimental hut study and village trial. Was the study conducted in Africa? | ↓ | — | ↓ | State country |
| Outcome | ||||
| Did the study include at least 1 of the following outcome measures?
| ↓ | — | ↓ | |
| Decision | ||||
| Is the study eligible for inclusion? | — | — | ↓ | State reason(s) for exclusion |
| Discuss with authors | ||||
ITN: insecticide‐treated net; LLIN: long‐lasting insecticidal net; PBO: piperonyl butoxide; WHO: World Health Organization.
Data extraction and management
After selection, we summarized all included trials according to the tables in Appendix 2. Two review authors (KG and NL or LC) independently extracted data from included trials using the pre‐designed data extraction form (Appendix 3). If data were missing from an included trial, we contacted the trial authors to ask for further information. We entered data into Review Manager 5 (RevMan 5) (Review Manager 2014).
Assessment of risk of bias in included studies
Two review authors (KG and NL or LC) independently assessed the risk of bias of each included trial using a set of predetermined criteria specific to each trial type adapted from Strode 2014 (Appendix 4). We assigned a classification of low, high, or unclear risk of bias for each component. For all included trials, we assessed whether any trial authors had submitted any conflicts of interest that may have biased trial methods or results.
Randomized trials and village trials
We assessed 12 criteria for village and RCTs: recruitment bias, comparability of mosquitoes between LLIN/pyrethroid‐PBO net households (e.g. species composition), collectors blinded, household blinded, treatment allocation, allocation concealment, incomplete outcome data, raw data reported, clusters lost to follow‐up, selective reporting, adjustment for data clustering, and trial authors' conflicting interests.
Experimental hut trials
For experimental hut trials, we assessed 11 criteria: comparability of mosquitoes between LLIN/pyrethroid‐PBO net arms (e.g. species composition), collectors blinded, sleepers blinded, sleeper bias accounted for, treatment allocation, treatment rotation, standardized hut design, hut cleaning between treatments, incomplete outcome data, raw data reported, and trial authors' conflicting interests.
Measures of treatment effect
For dichotomous data, we preferentially presented the risk ratio (RR). For the outcome of parasite prevalence from cRCTs, we used the odds ratio (OR) as the measure of effect, as one study presented adjusted ORs that could not be converted to adjusted RRs using the standard formula presented in the Cochrane Handbook for Systematic Reviews of Interventions (Higgins 2011). We found no continuous or count data; however if we had, we would have used mean differences (MDs) and rate ratios, respectively. We have presented all results with 95% confidence intervals (CIs).
Unit of analysis issues
For trials randomized by hut or village, we used the adjusted measure of effect reported in the paper if available. For the outcome of parasite prevalence from cRCTs, we converted adjusted RRs presented in one study ‐ Staedke 2020 ‐ to adjusted ORs using the standard formula presented in the Cochrane Handbook for Systematic Reviews of Interventions (Higgins 2011), so that this study could be pooled with Protopopoff 2018.
When adjusted measures of effect were not reported, we used an intracluster correlation coefficient (ICC) and average cluster size to adjust the data ourselves (Higgins 2011 Section 16.3.4). If the included trial did not report the ICC value, we estimated the ICC value and performed sensitivity analyses to investigate the impact of estimating the ICC. When ICCs have been used to adjust results for clustering, forest plots for both hut and village trials show the effective number of events and the number of mosquitoes after adjustments for clustering.
To adjust results of experimental hut trials for clustering, we treated each ‘hut and night' combination as the unit of randomization, as each hut was tested with each type of net over a series of nights. Sleepers inside the huts were rotated each night, so by using "hut/night" as the unit of randomization, sleeper effects were also accounted for. We calculated effective sample sizes by estimating an ICC and a corresponding design effect. We divided both the number of mosquitoes and the number experiencing the event by this design effect.
Dealing with missing data
In the case of missing data, we contacted trial authors to request this information. If we had identified trials in which participants were lost to follow‐up, we would have investigated the impact of missing data via imputation using a best/worst‐case scenario analysis.
When information on mosquito insecticide resistance was not collected at the time of the trial, review authors determined a suitable proxy. Proxy resistance data had to be taken from the same area and conducted within three years of the trial, and the same insecticide, dose, and mosquito species had to be used. More than 50 mosquitoes per insecticide should have been tested against an appropriate control. When no resistance data were available, we determined that resistance status was unclassified.
Assessment of heterogeneity
We presented the results of included trials in forest plots, which we inspected visually, to assess heterogeneity (i.e. non‐overlapping CIs generally signify statistical heterogeneity). We used the Chi² test with a P value less than 0.1 to indicate statistical heterogeneity. We quantified heterogeneity by using the I² statistic (Higgins 2003), and we interpreted a value greater than 75% to indicate considerable heterogeneity (Deeks 2017).
Assessment of reporting biases
To analyse the possibility of publication bias, we intended to use funnel plots if 10 trials with epidemiological endpoints were included in any of the meta‐analysis. However, no analyses included 10 or more trials, so this plan was not applicable.
Data synthesis
When appropriate, we pooled the results of included trials using meta‐analysis. We stratified results by type of trial, mosquito resistance status, and net type (i.e. by product, e.g. Olyset Plus).
Four review authors (KG, NL, LC, and MC) analysed the data using RevMan 5 (Review Manager 2014), using the random‐effects model (if we detected heterogeneity; or if the I² statistic value was greater than 75%) or the fixed‐effect model (for no heterogeneity; or if the I² statistic value was less than 75%). The exception to this is that for the primary outcome of parasite prevalence from cluster trials, we pooled results using the fixed‐effect model, although heterogeneity between study results was substantial. For additional information, see 'Effects of Interventions: Epidemiological results'. We would have refrained from pooling trials in meta‐analysis if it was not clinically meaningful to do so, due to clinical or methodological heterogeneity.
Subgroup analysis and investigation of heterogeneity
We performed subgroup analyses according to whether nets were washed or unwashed.
Sensitivity analysis
We intended to perform sensitivity analyses to determine the effect of exclusion of trials that we considered to be at high risk of bias; however this approach was not applicable, as no trials were deemed at high risk. We would have performed a sensitivity analysis for missing data during imputation with best/worst‐case scenarios, but again this was not applicable.
We performed sensitivity analyses to investigate the impact of estimating an ICC to adjust trial results for clustering. We performed analyses using ICCs of 0.01, 0.05, and 0.1. Because results were robust to these adjustments, we used the most conservative ICC (0.1), and we adjusted all results from unadjusted cluster trials using this ICC. We have not presented analyses using the smaller ICCs (0.01 and 0.05).
Summary of findings and assessment of the certainty of the evidence
We assessed the certainty of evidence using the GRADE approach (Schünemann 2013). We constructed ‘Summary of findings' tables using GRADEpro Guideline Development Tool (GDT) software (GRADEpro GDT 2015).
Results
Description of studies
Results of the search
We identified 389 records through our searches. We removed duplicates, leaving 347 records, and we screened all articles for possible inclusion. After abstract and title screening, we excluded 322 ineligible trials. We assessed 25 full‐text articles for eligibility and excluded nine articles for the following reasons: three trials did not share full data sets, two were laboratory studies, and four are ongoing. Sixteen trials met the inclusion criteria (Figure 1).

Study flow diagram.
Included studies
Sixteen trials met the inclusion criteria; we have described them in the Characteristics of included studies tables. Ten trials were experimental hut trials (Bayili 2017 (Burkina Faso); Corbel 2010 (Burkina Faso, Benin, Cameroon); Koudou 2011 (Côte d'Ivoire); Menze 2020 (Cameroon); Moore 2016 (Tanzania); N'Guessan 2010 (Benin); Oumbouke 2019 (Côte d'Ivoire); Pennetier 2013 (Benin); Toé 2018 (Burkina Faso); Tungu 2010 (Tanzania)). Four trials were village trials (Awolola 2014 (Nigeria); Cisse 2017 (Mali); Mzilahowa 2014 (Malawi); Stiles‐Ocran 2013 (Ghana)). Two were cRCTs (Protopopoff 2018 (Tanzania); Staedke 2020 (Uganda)). All trials were conducted in Africa.
Interventions
Six trials compared Permanet 2.0 to Permanet 3.0 (Awolola 2014; Corbel 2010; Koudou 2011; N'Guessan 2010; Stiles‐Ocran 2013; Tungu 2010); two trials compared Olyset Net to Olyset Plus (Pennetier 2013; Protopopoff 2018); two trials compared MAGNet LN to Veeralin LN (Moore 2016; Oumbouke 2019); five trials compared both Olyset Net to Olyset Plus and Permanet 2.0 to Permanet 3.0 (Cisse 2017; Menze 2020; Mzilahowa 2014; Staedke 2020; Toé 2018); and one trial compared DawaPlus 2.0 to DawaPlus 3.0 and DawaPlus 4.0 (Bayili 2017).
Excluded studies
We assessed 25 full‐text articles for eligibility and excluded nine articles for the following reasons: three trials are awaiting classification because we were unable to obtain the full data sets after we contacted trial authors (see Characteristics of studies awaiting classification table); four trials are ongoing (see Characteristics of ongoing studies section); and two trials included only laboratory data (Darriet 2011; Darriet 2013).
Risk of bias in included studies
We have provided a ‘Risk of bias' assessment summary in Figure 2. The criteria we used to assess risk of bias are provided in Appendix 5 (experimental hut trials) and in Appendix 6 (village trials).

‘Risk of bias' summary: review authors' judgements about each risk of bias item for each included study.
Allocation
Recruitment bias
We assessed all four village trials as having low risk of recruitment bias, as recruitment bias is related to human participants and so is not applicable to this review (Awolola 2014; Cisse 2017; Mzilahowa 2014; Stiles‐Ocran 2013). We assessed the two cRCTs as having low risk, as no participants were recruited after clusters had been randomized (Protopopoff 2018; Staedke 2020).
Mosquito group comparability
We judged all 10 experimental hut trials to be at low risk (Bayili 2017; Corbel 2010; Koudou 2011; Menze 2020; Moore 2016; N'Guessan 2010; Oumbouke 2019; Pennetier 2013; Toé 2018; Tungu 2010), as the huts were situated in the same trial area and therefore were accessible to the same mosquito populations. We judged all four village trials and both cRCTs to be at unclear risk, as for six trials, species composition and resistance status varied slightly between treatment arms (Awolola 2014; Cisse 2017; Menze 2020; Oumbouke 2019; Protopopoff 2018; Stiles‐Ocran 2013); for one trial, species and resistance data were not separated by village (Mzilahowa 2014); and for one trial, the size of the area covered made it difficult to classify resistance status in all areas (Staedke 2020).
Blinding
We assessed the 10 hut trials to be at unclear risk, as they did not specify whether observers, collectors and sleepers (hut trials) were blinded (Bayili 2017; Corbel 2010; Koudou 2011; Menze 2020; Moore 2016; N'Guessan 2010; Oumbouke 2019; Pennetier 2013; Toé 2018; Tungu 2010). This is not standard protocol for these trial designs and is thought unlikely to affect the results. We judged four village trials to be at high risk of bias, as it was not stated whether collectors were blinded, and this may have affected searching efforts during collection (Awolola 2014; Cisse 2017; Mzilahowa 2014; Stiles‐Ocran 2013). We judged one cRCT as having high risk, as it was stated that LLIN allocation was not masked to collectors (Staedke 2020), and the other as having low risk because collectors were masked to treatment (Protopopoff 2018). For household blinding, we judged all four village trials and both cRCTs to be at low risk of bias. Four village trials and one cRCT did not state whether households were blind to the intervention; however this was unlikely to influence the results (Awolola 2014; Cisse 2017; Mzilahowa 2014; Stiles‐Ocran 2013; Staedke 2020). We judged one cRCT as having low risk, as inhabitants and field collectors were blinded to intervention arms (Protopopoff 2018).
Sleeper bias
We assessed the 10 hut trials to be at low risk for sleeper bias, as sleepers were rotated between huts according to a Latin square design (Bayili 2017; Corbel 2010; Koudou 2011; Menze 2020; Moore 2016; N'Guessan 2010; Oumbouke 2019; Pennetier 2013; Toé 2018; Tungu 2010).
Treatment allocation, rotation, and concealment
We assessed the 10 hut trials to be at low risk for treatment allocation and rotation, as treatments were rotated between huts according to a Latin square design (Bayili 2017; Corbel 2010; Koudou 2011; Menze 2020; Moore 2016; N'Guessan 2010; Oumbouke 2019; Pennetier 2013; Toé 2018; Tungu 2010). We assessed all four village trials and both cRCTs to be at low risk for treatment allocation (Awolola 2014; Cisse 2017; Mzilahowa 2014; Protopopoff 2018; Staedke 2020; Stiles‐Ocran 2013), as villages were randomly assigned to treatment arms. We assessed all four village trials and both cRCTs as having low risk of bias for allocation concealment (Awolola 2014; Cisse 2017; Mzilahowa 2014; Protopopoff 2018; Staedke 2020; Stiles‐Ocran 2013).
Hut design
We assessed all 10 hut trials to be at low risk of bias, as huts were built to standard West or East African specifications (Bayili 2017; Corbel 2010; Koudou 2011; Menze 2020; N'Guessan 2010; Oumbouke 2019; Pennetier 2013; Toé 2018; Tungu 2010), or they used modified but standardized designs (Moore 2016).
Cleaning
We assessed four hut trials to be at unclear risk, as they did not state whether huts were cleaned between treatment arms (Bayili 2017; Corbel 2010; Moore 2016; Toé 2018). We assessed six to be at low risk, as cleaning was conducted between treatment rotations (Koudou 2011; Menze 2020; N'Guessan 2010; Oumbouke 2019; Pennetier 2013; Tungu 2010).
Incomplete outcome data
We assessed all hut trials ‐ Bayili 2017; Corbel 2010; Koudou 2011; Menze 2020; Moore 2016; N'Guessan 2010; Oumbouke 2019; Pennetier 2013; Toé 2018; Tungu 2010, village trials ‐ Awolola 2014; Cisse 2017; Mzilahowa 2014; Stiles‐Ocran 2013, and cRCTs ‐ Protopopoff 2018; Staedke 2020 ‐ to be at low risk for both incomplete outcome data and raw data reporting, as there were no incomplete outcome data, or missing data were later provided by trial authors. In cases when raw data were not reported, we were able to calculate them from the percentages and sample sizes given. When these data were not available, we did not include the trials.
Clustering bias
Staedke 2020 lost 14 clusters to follow‐up at the latest time point and was therefore assessed as having unclear risk of bias. In the other village and cRCT trials, no clusters were lost to follow‐up, and these trials were assessed as having low risk (Awolola 2014; Cisse 2017; Mzilahowa 2014; Protopopoff 2018; Staedke 2020; Stiles‐Ocran 2013). We assessed four village trials as having high risk of bias for statistical methods used, as they did not adjust for clustering (Awolola 2014; Cisse 2017; Mzilahowa 2014; Stiles‐Ocran 2013). We assessed the two cRCTs as having low risk of bias, as they took clustering into account and adjusted for it in their statistical methods (Protopopoff 2018; Staedke 2020).
Selective reporting
We assessed all village trials and cRCTs as having low risk of bias regarding selective reporting, as they appear to have reported all measured outcomes (Awolola 2014; Cisse 2017; Mzilahowa 2014; Protopopoff 2018; Staedke 2020; Stiles‐Ocran 2013).
Other potential sources of bias
Conflicting interests
We judged nine hut trials ‐ Bayili 2017; Corbel 2010; Koudou 2011; Menze 2020; Moore 2016; Oumbouke 2019; Pennetier 2013; Toé 2018; Tungu 2010, two village trials ‐ Awolola 2014; Cisse 2017, and both cRCTs ‐ Protopopoff 2018; Staedke 2020 ‐ as having low risk, as trial authors reported no conflicting interests. We assessed one hut trial to be at unclear risk (N'Guessan 2010), as trial authors stated that they had received funding from LLIN manufacturers when conducting the trials, and the same funders provided comments on the manuscript. We assessed one village trial as having unclear risk, as trial authors did not state whether there were conflicting interests (Mzilahowa 2014), and another trial as having unclear risk, as the trial was conducted to form part of the manufacturer's product dossier (Stiles‐Ocran 2013).
Effects of interventions
See: Summary of findings 1 Summary of findings table 1; Summary of findings 2 Summary of findings table 2; Summary of findings 3 Summary of findings table 3; Summary of findings 4 Summary of findings table 4
We compared the effects of pyrethroid‐PBO nets currently in commercial development or on the market with their non‐PBO equivalent in relation to malaria infection and entomological outcomes. This review is based on results from 16 trials.
Epidemiological results
Two trials examined the effects of pyrethroid‐PBO nets (Olyset Plus and PermaNet 3.0) on parasite prevalence (Protopopoff 2018; Staedke 2020). Pooling the latest endpoint after the intervention from both trials revealed that parasite prevalence was decreased in the intervention arm (Olyset Plus and PermaNet 3.0) (OR 0.79, 95% CI 0.67 to 0.95; 2 trials, 2 comparisons; Analysis 1.1).
There was little variation of effect from the earliest time point (4 to 6 months after: OR 0.74, 95% CI 0.62 to 0.89) to the latest time point (21 to 25 months after: OR 0.79, 95% CI 0.67 to 0.95) (Analysis 1.2).
We used a fixed‐effect model to pool data from the two studies. Although heterogeneity between study results was considerable, both studies demonstrated clear beneficial effects with PBO nets. Performing random‐effects meta‐analysis accounted for differences between study results to the extent that identified benefits disappeared in the pooled analysis, indicating failure of the random‐effects model.
Entomological results
Experimental hut trials
Ten experimental hut trials (phase 2 trials) examined the effects of pyrethroid‐PBO nets on mosquito mortality, blood feeding, exophily, and deterrence (Bayili 2017; Corbel 2010; Koudou 2011; Menze 2020; Moore 2016; N'Guessan 2010; Oumbouke 2019; Pennetier 2013; Toé 2018; Tungu 2010). We subgrouped the data by net washing into unwashed and washed groups. All washed nets were washed 20 times according to WHO specifications (WHO 2013). We pooled the results initially and then stratified them by insecticide resistance level and by net type. Two trials did not wash their nets and so did not report any data for the washed subgroup (Menze 2020 Toé 2018). One trial did not introduce holes into the nets and so did not report blood‐feeding success data (Koudou 2011).
Pooled analysis
Pooled analysis of all experimental hut trials using both unwashed nets ‐ Bayili 2017; Corbel 2010; Koudou 2011; Menze 2020; Moore 2016; N'Guessan 2010; Oumbouke 2019; Pennetier 2013; Toé 2018; Tungu 2010 ‐ and washed nets ‐ Bayili 2017; Corbel 2010; Koudou 2011; Moore 2016; N'Guessan 2010; Oumbouke 2019; Pennetier 2013; Tungu 2010 ‐ revealed that pyrethroid‐PBO nets significantly increased mosquito mortality by 43% (risk ratio (RR) 1.43, 95% confidence interval (CI) 1.26 to 1.62) and reduced blood‐feeding success by 25% (RR 0.75, 95% CI 0.66 to 0.85). The magnitude of the effect was reduced by net washing. Unwashed pyrethroid‐PBO nets increased mosquito mortality by 63% compared to unwashed LLINs (RR 1.63, 95% CI 1.29 to 2.05; 10 trials, 18 comparisons; Analysis 2.1); when nets were washed, this effect was decreased to 19% (RR 1.19, 95% 1.04 to 1.38; 8 trials, 12 comparisons; Analysis 2.1). Unwashed pyrethroid‐PBO nets reduced mosquito blood‐feeding success by 32% (RR 0.68, 95% CI 0.57 to 0.80; 9 trials, 17 comparisons; Analysis 2.2; Bayili 2017; Corbel 2010; Moore 2016; N'Guessan 2010; Pennetier 2013; Toé 2018; Tungu 2010); however this effect was lost when nets were washed (7 trials, 11 comparisons; Analysis 2.2; Bayili 2017; Corbel 2010; Moore 2016; N'Guessan 2010; Pennetier 2013; Tungu 2010). There was no effect on mosquito exophily in either unwashed (10 trials, 17 comparisons; Analysis 2.3) or washed groups (8 trials, 12 comparisons; Analysis 2.3). Mosquito deterrence data were presented relative to an untreated control and hence are not included as a forest plot. There was considerable variation in deterrence rates but no clear relationship with resistance level, net type, or washing status (Table 7).
| Study ID | Locality | Net type | Net washed | Total number in ITN hut | Total number in UTN hut | Deterrence (%) reported | Deterrence (%) calculated |
|---|---|---|---|---|---|---|---|
| Vallée du Kou | DawaPlus 2.0 | No | 1548 | 1848 | 16.23 | 16.23 | |
| Vallée du Kou | DawaPlus 2.0 | Yes | 2155 | 1848 | 0 | ‐16.61 | |
| Vallée du Kou | DawaPlus 3.0 | No | 1365 | 1848 | 26.13 | 26.14 | |
| Vallée du Kou | DawaPlus 3.0 | Yes | 1981 | 1848 | 0 | ‐7.20 | |
| Vallée du Kou | DawaPlus 4.0 | No | 846 | 1848 | 54.22 | 54.22 | |
| Vallée du Kou | DawaPlus 4.0 | Yes | 1646 | 1848 | 10.93 | 10.93 | |
| Malanville | Permanet 2.0 | Yes | 195 | 285 | 31.58 | 31.58 | |
| Malanville | Permanet 3.0 | Yes | 210 | 285 | 26.32 | 26.32 | |
| Malanville | Permanet 2.0 | No | 243 | 285 | 14.74 | 14.74 | |
| Malanville | Permanet 3.0 | No | 214 | 285 | 24.91 | 24.91 | |
| Pitoa | Permanet 2.0 | Yes | 310 | 401 | 22.69 | 22.69 | |
| Pitoa | Permanet 3.0 | Yes | 163 | 401 | 59.35 | 59.35 | |
| Pitoa | Permanet 2.0 | No | 105 | 401 | 73.82 | 73.82 | |
| Pitoa | Permanet 3.0 | No | 146 | 401 | 63.59 | 63.59 | |
| Vallée du Kou | Permanet 2.0 | Yes | 788 | 908 | 13.22 | 13.22 | |
| Vallée du Kou | Permanet 3.0 | Yes | 724 | 908 | 20.26 | 20.26 | |
| Vallée du Kou | Permanet 2.0 | No | 329 | 908 | 63.77 | 63.77 | |
| Vallée du Kou | Permanet 3.0 | No | 463 | 908 | 49.01 | 49.01 | |
| Yaokoffikro | Permanet 3.0 | No | 303 | 796 | 62.1 | 61.93 | |
| Yaokoffikro | Permanet 2.0 | No | 317 | 796 | 60.4 | 60.18 | |
| Yaokoffikro | Permanet 3.0 | Yes | 313 | 796 | 60.1 | 60.68 | |
| Yaokoffikro | Permanet 2.0 | Yes | 281 | 796 | 64.4 | 64.70 | |
| Mibellon | PermaNet 2.0 | No | 237 | 390 | 39.2 | 39.2 | |
| Mibellon | PermaNet 3.0 | No | 153 | 390 | 60.8 | 60.8 | |
| Mibellon | Olyset Net | No | 176 | 390 | 54.9 | 54.9 | |
| Mibellon | Olyset Plus | No | 199 | 390 | 49 | 49 | |
| Ifakara | Veeralin LN | No | 722 | 810 | 11 | 10.86 | |
| Ifakara | Veeralin LN | Yes | 727 | 810 | 10 | 10.25 | |
| Ifakara | MAGNet LN | No | 1070 | 810 | 0 | ‐32.10 | |
| Ifakara | MAGNet LN | Yes | 773 | 810 | 5 | 4.57 | |
| Ifakara | Veeralin LN | No | 89 | 170 | 48 | 47.65 | |
| Ifakara | Veeralin LN | Yes | 85 | 170 | 50 | 50.00 | |
| Ifakara | MAGNet LN | No | 114 | 170 | 33 | 32.94 | |
| Ifakara | MAGNet LN | Yes | 103 | 170 | 39 | 39.41 | |
| Akron | Permanet 3.0 | No | 128 | 185 | 31 | 30.81 | |
| Akron | Permanet 3.0 | Yes | 155 | 185 | NR | 16.22 | |
| Akron | Permanet 2.0 | No | 114 | 185 | 38 | 38.38 | |
| Akron | Permanet 2.0 | Yes | 174 | 185 | NR | 5.95 | |
| Malanville | Olyset Plus | No | 67 | 69 | NR | 2.90 | |
| Malanville | Olyset Plus | Yes | 101 | 69 | NR | ‐46.38 | |
| Malanville | Olyset Net | No | 96 | 69 | NR | ‐39.13 | |
| Malanville | Olyset Net | Yes | 124 | 69 | NR | ‐79.71 | |
| Tengrela | Olyset Net | No | 923 | 480 | ‐92.29 | ‐92.29 | |
| Tengrela | Olyset Plus | No | 695 | 480 | ‐44.79 | ‐44.79 | |
| Tengrela | Permanet 2.0 | No | 858 | 480 | ‐78.75 | ‐78.75 | |
| Tengrela | Permanet 3.0 | No | 794 | 480 | ‐65.42 | ‐65.42 | |
| VK5 | Olyset Net | No | 1458 | 1095 | ‐33.15 | ‐33.15 | |
| VK5 | Olyset Plus | No | 1278 | 1095 | ‐16.71 | ‐16.71 | |
| VK5 | Permanet 2.0 | No | 1075 | 1095 | 1.83 | 1.83 | |
| VK5 | Permanet 3.0 | No | 657 | 1095 | 40 | 40.00 | |
| Zeneti | PermaNet 3.0 | No | 425 | 723 | 41 | 41.22 | |
| Zeneti | PermaNet 2.0 | No | 574 | 723 | 21 | 20.61 | |
| Zeneti | PermaNet 3.0 | Yes | 558 | 723 | 23 | 22.82 | |
| Zeneti | PermaNet 2.0 | Yes | 586 | 723 | 19 | 18.95 |
ITN: insecticide‐treated net; LLIN: long‐lasting insecticidal net; NR: not reported; PBO: piperonyl butoxide; UTN: untreated net; WHO: World Health Organization.
Heterogeneity in this pooled analysis was considerable, particularly for estimates of mortality. We therefore performed a pre‐specified, stratified analysis, dividing the results into trials conducted in areas of low, moderate, or high resistance in the Anopheles population.
Stratified analysis: mosquito resistance status
We used WHO and Centers for Disease Control and Prevention (CDC) definitions of mosquito mortality from WHO tube assays or CDC bottle tests to classify mosquito resistance (Table 4). Both tests define mosquitoes as resistant when mortality is less than 90%. We further stratified resistance based on the following mortality levels: < 30%, high resistance; 31% to 60%, moderate resistance; and 61% to 90%, low resistance (Table 5). When resistance data were not collected at the time of the trial, we identified a suitable proxy based on previously described criteria (see Dealing with missing data section); when we could not identify a suitable proxy, we deemed the trial as ‘unclassified' and did not include it in the resistance stratification.
Five trials were conducted in four areas where mosquito populations exhibited high resistance to pyrethroids (Bayili 2017; Corbel 2010; Koudou 2011; Pennetier 2013; Toé 2018). Under these conditions, unwashed pyrethroid‐PBO nets increased mosquito mortality by 84% in comparison to unwashed LLINs (RR 1.84, 95% CI 1.60 to 2.11; 5 trials, 9 comparisons; Analysis 2.4); however this effect was lost when nets were washed (4 trials, 5 comparisons; Analysis 2.4; Bayili 2017; Corbel 2010; Koudou 2011; Pennetier 2013). Blood‐feeding success was reduced by 40% in unwashed pyrethroid‐PBO net groups compared to unwashed LLIN groups (RR 0.60, 95% CI 0.50 to 0.71; 4 trials, 8 comparisons; Analysis 2.5; Bayili 2017; Corbel 2010; Pennetier 2013; Toé 2018), and was reduced by 19% when nets were washed (RR 0.81, 95% CI 0.72 to 0.92; 3 trials, 4 comparisons; Analysis 2.5; Bayili 2017; Corbel 2010; Pennetier 2013).
Two trials at three different sites were conducted in areas with moderate insecticide resistance (Menze 2020; N'Guessan 2010). With unwashed nets, mosquito mortality was increased by 68% in comparison to mosquito mortality with unwashed LLINs (RR 1.68, 95% CI 1.33 to 2.11; 2 trials, 3 comparisons; Analysis 2.6); however there was minimal effect on blood‐feeding success. No effect on mosquito mortality (1 trial, 1 comparison; Analysis 2.6) or on blood‐feeding success (1 trial, 1 comparison; Analysis 2.7) was observed with washed treatments.
Two trials at three different sites were conducted in areas with low insecticide resistance (Corbel 2010; Oumbouke 2019). A small effect on mosquito mortality was observed with unwashed nets (RR 1.25, 95% CI 0.99 to 1.57; 2 trials, 3 comparisons; Analysis 2.8) and was also seen with washed nets (RR 1.39, 95% CI 0.95 to 2.04; 2 trials, 3 comparisons; Analysis 2.8). No effect on blood‐feeding success was noted (2 trials, 3 comparisons; Analysis 2.9).
At susceptible sites (Moore 2016; Tungu 2010), no effect on mosquito mortality (2 trials, 2 comparisons; Analysis 2.10) nor on blood‐feeding success (2 trials, 2 comparisons; Analysis 2.11) was observed.
Stratified analysis: net type
After stratifying by resistance status, we performed a secondary analysis stratified according to net type. Due to the limited number of trials, we performed this analysis only for trials using PermaNet 3.0 or Olyset Plus. Although additional trials utilising Veeralin LN, DawaPlus 3.0, and DawaPlus 4.0 have been conducted, not all data were made available to us for the purposes of this Cochrane Review. Futhermore, the analysis was restricted to trials conducted in areas of high resistance, as this analysis indicated an impact of only pyrethroid‐PBO nets in these settings. Three trials compared PermaNet 2.0 (LLIN) to PermaNet 3.0 (pyrethroid‐PBO nets), and two compared Olyset Nets (LLIN) to Olyset Plus (pyrethroid‐PBO nets).
In the PermaNet group, in high‐resistance settings, unwashed PermaNet 3.0 increased mosquito mortality by 81% compared to PermaNet 2.0 (RR 1.81, 95% CI 1.56 to 2.10; 3 trials, 4 comparisons; Analysis 2.12; Corbel 2010; Koudou 2011; Toé 2018). After washing, there was no significant increase in mortality in the PermaNet 3.0 arm (2 trials, 2 comparisons; Analysis 2.12; Corbel 2010; Koudou 2011). Blood‐feeding success was reduced by 47% when unwashed PermaNet 3.0 was used (RR 0.53, 95% CI 0.40 to 0.69; 2 trials, 3 comparisons; Analysis 2.13; Corbel 2010; Toé 2018); only one trial was available for washed nets (Corbel 2010), and in this trial, PermaNet 3.0 also reduced blood‐feeding success (RR 0.76, 95% 0.61 to 0.93; 1 trial, 1 comparison; Analysis 2.13).
In high‐resistance settings, Olyset Plus increased mosquito mortality by 72% when nets were unwashed (RR 1.72, 95% CI 1.48 to 1.99; 2 trials, 3 comparisons; Analysis 2.14; Pennetier 2013; Toé 2018). Only one trial compared washed Olyset Plus with washed Olyset (Pennetier 2013); in this trial, enhanced mortality (81%) was still observed in the Olyset Plus arm after washing (RR 1.81, 95% CI 1.25 to 2.61; 1 trial, 1 comparison; Analysis 2.14). There was no impact on blood‐feeding success when unwashed Olyset Plus was compared with Olyset (2 trials, 3 comparisons; Analysis 2.15); the single trial that looked at washed Olyset Plus showed decreased blood feeding compared to Olyset (RR 0.50, 95% 0.27 to 0.93; 1 trial, 1 comparison; Analysis 2.15).
Village trials
In the village trials, there was no decrease in sporozoite rate in trial arms receiving pyrethroid‐PBO nets (RR 0.82, 95% CI 0.24 to 2.75; 4 trials, 5 comparisons; Analysis 1.3; Awolola 2014; Cisse 2017; Protopopoff 2018; Stiles‐Ocran 2013). Mosquito parity was not reduced in pyrethroid‐PBO villages (3 trials, 4 comparisons; Analysis 1.4; Cisse 2017; Mzilahowa 2014; Stiles‐Ocran 2013). It was not possible to stratify these data by resistance status due to the variability in resistance levels between villages within the same trial. Mosquito density was measured by a variety of methods and was summarized in different ways (e.g. mean number caught per house, mean number caught per village). When baseline data were collected, we calculated a percentage reduction. Higher reductions in mosquito densities were observed in pyrethroid‐PBO net villages compared to LLIN villages (Table 8).
| Study ID | Net type | Species | Density measurement | Collection method | Baseline density | Post‐intervention density | Reduction (%) |
|---|---|---|---|---|---|---|---|
| Untreated | An gambiae s.l. | Mean number caught per house | WT, IRC | 16.2 | 17.1 | ‐5.56 | |
| PermaNet 2.0 | An gambiae s.l. | Mean number caught per house | WT, IRC | 21.3 | 7.2 | 66.20 | |
| PermaNet 3.0 | An gambiae s.l. | Mean number caught per house | WT, IRC | 20.1 | 1.4 | 93.03 | |
| PermaNet 2.0 | An gambiae s.l. | Resting density per room per day | IRC | ‐ | 1.92 | ‐ | |
| PermaNet 3.0 | An gambiae s.l. | Resting density per room per day | IRC | ‐ | 3.05 | ‐ | |
| Olyset | An gambiae s.l. | Resting density per room per day | IRC | ‐ | 3.21 | ‐ | |
| Olyset Plus | An gambiae s.l. | Resting density per room per day | IRC | ‐ | 3.7 | ‐ | |
| Olyset | An gambiae | Mean number caught per catch | PSC | ‐ | 0.10 | ‐ | |
| Olset Plus | An gambiae | Mean number caught per catch | PSC | ‐ | 0.12 | ‐ | |
| PermaNet 2.0 | An gambiae | Mean number caught per catch | PSC | ‐ | 0.13 | ‐ | |
| PermaNet 3.0 | An gambiae | Mean number caught per catch | PSC | ‐ | 0.09 | ‐ | |
| Olyset | An funestus | Mean number caught per catch | PSC | ‐ | 0.08 | ‐ | |
| Olyset Plus | An funestus | Mean number caught per catch | PSC | ‐ | 0.16 | ‐ | |
| PermaNet 2.0 | An funestus | Mean number caught per catch | PSC | ‐ | 0.27 | ‐ | |
| PermaNet 3.0 | An funestus | Mean number caught per catch | PSC | ‐ | 0.13 | ‐ | |
| Olyset | An gambiae | Mean number caught per catch | LT | ‐ | 1.23 | ‐ | |
| Olset Plus | An gambiae | Mean number caught per catch | LT | ‐ | 0.27 | ‐ | |
| PermaNet 2.0 | An gambiae | Mean number caught per catch | LT | ‐ | 0.96 | ‐ | |
| PermaNet 3.0 | An gambiae | Mean number caught per catch | LT | ‐ | 1.44 | ‐ | |
| Olyset | An funestus | Mean number caught per catch | LT | ‐ | 2.02 | ‐ | |
| Olset Plus | An funestus | Mean number caught per catch | LT | ‐ | 2.1 | ‐ | |
| PermaNet 2.0 | An funestus | Mean number caught per catch | LT | ‐ | 5.76 | ‐ | |
| PermaNet 3.0 | An funestus | Mean number caught per catch | LT | ‐ | 3.76 | ‐ | |
| Olyset (2015) | Anopheles species | Mean number caught per house per night | LT | ‐ | 2.61 | ‐ | |
| Olyset Plus (2015) | Anopheles species | Mean number caught per house per night | LT | ‐ | 1.85 | ‐ | |
| Olyset (2016) | Anopheles species | Mean number caught per house per night | LT | ‐ | 3.60 | ‐ | |
| Olyset Plus (2016) | Anopheles species | Mean number caught per house per night | LT | ‐ | 2.68 | ‐ | |
| Permanet 2.0 (6 months) | An gambiae s.l. | Mean density per house | IRC | 0.3 | 0.67 | ||
| Permanet 3.0 (6 months) | An gambiae s.l. | Mean density per house | IRC | 0.8 | 0.17 | 78.75 | |
| Olyset (6 months) | An gambiae s.l. | Mean density per house | IRC | 0.3 | 0.81 | ||
| Olyset Plus (6 months) | An gambiae s.l. | Mean density per house | IRC | 0.1 | 0.16 | ||
| Permanet 2.0 (12 months) | An gambiae s.l. | Mean density per house | IRC | 0.3 | 1.35 | ||
| Permanet 3.0 (12 months) | An gambiae s.l. | Mean density per house | IRC | 0.8 | 0.52 | 35 | |
| Olyset (12 months) | An gambiae s.l. | Mean density per house | IRC | 0.3 | 1.1 | ||
| Olyset Plus (12 months) | An gambiae s.l. | Mean density per house | IRC | 0.1 | 0.23 | ||
| Permanet 2.0 (18 months) | An gambiae s.l. | Mean density per house | IRC | 0.3 | 1.65 | ||
| Permanet 3.0 (18 months) | An gambiae s.l. | Mean density per house | IRC | 0.8 | 1.57 | ||
| Olyset (18 months) | An gambiae s.l. | Mean density per house | IRC | 0.3 | 0.66 | ||
| Olyset Plus (18 months) | An gambiae s.l. | Mean density per house | IRC | 0.1 | 0.19 | ||
| No intervention | An gambiae s.s. | Mean number caught per village | IRC | 230 | 79 | 65.65 | |
| Permanet 2.0 | An gambiae s.s. | Mean number caught per village | IRC | 39 | 36 | 7.69 | |
| Permanet 2.0 | An gambiae s.s. | Mean number caught per village | IRC | 82 | 45 | 45.12 | |
| Permanet 3.0 | An gambiae s.s. | Mean number caught per village | IRC | 77 | 12 | 84.42 | |
| Permanet 3.0 | An gambiae s.s. | Mean number caught per village | IRC | 178 | 15 | 91.57 | |
| No intervention | An gambiae s.s. | Mean number caught per person per night per village | Indoor & outdoor HLC | 415 | 72 | 82.65 | |
| Permanet 2.0 | An gambiae s.s. | Mean number caught per person per night per village | Indoor & outdoor HLC | 33 | 31 | 6.06 | |
| Permanet 2.0 | An gambiae s.s. | Mean number caught per person per night per village | Indoor & outdoor HLC | 79 | 64 | 18.99 | |
| Permanet 3.0 | An gambiae s.s. | Mean number caught per person per night per village | Indoor & outdoor HLC | 98 | 19 | 80.61 | |
| Permanet 3.0 | An gambiae s.s. | Mean number caught per person per night per village | Indoor & outdoor HLC | 156 | 36 | 76.92 |
An funestus: Anopheles funestus; An gambiae: Anopheles gambiae; HLC: human landing catch; IRC: indoor resting catch; LT: light trap; PSC: pyrethrum spray catch; WT: window trap.
Discussion
See summary of findings Table 1, summary of findings Table 2, summary of findings Table 3, and summary of findings Table 4.
Summary of main results
Two cluster‐randomized controlled trials (cRCTs) were performed on pyrethroid‐piperonyl butoxide (PBO) nets. The first trial, which compared parasite prevalence in children using Olyset Plus nets with that in children using Olyset nets, in a region of Tanzania where mosquito vectors are highly resistant to pyrethroids, found that pyrethroid‐PBO nets reduced parasite prevalence by 60% at the final time point (21 months) (Protopopoff 2018). The second cRCT compared parasite prevalence in children using Olyset Plus or Permanet 3.0 nets with that in children using Olyset or Permanet 2.0 nets across East and West Uganda, where mosquito vectors are also highly resistant to pyrethroids, and found that pyrethroid‐PBO nets reduced parasite prevalence by 17% at the latest time point (25 months) (Staedke 2020).
All other trials included in this review measured entomological endpoints. Four village trials measured sporozoite rates in mosquitoes collected from houses using pyrethroid‐PBO nets and standard pyrethroid long‐lasting insecticidal nets (LLINs), but the results were highly heterogeneous and no evidence suggests that pyrethroid‐PBO nets reduced the mosquito infection rate derived from this pooled analysis (Awolola 2014; Cisse 2017; Protopopoff 2018; Stiles‐Ocran 2013). Similarly, the proportion of parous mosquitoes (i.e. mosquitoes that have survived past one gonotrophic cycle; used as an indirect measure of longevity) was not significantly affected by the presence of pyrethroid‐PBO nets (Cisse 2017; Mzilahowa 2014; Stiles‐Ocran 2013).
When we pooled the results from 10 experimental hut trials (Bayili 2017; Corbel 2010; Koudou 2011; Menze 2020; Moore 2016; N'Guessan 2010; Oumbouke 2019; Pennetier 2013; Toé 2018; Tungu 2010), data showed improved performance of pyrethroid‐PBO LLINs over standard LLINs in both increasing mosquito mortality and reducing blood feeding, but these results were highly heterogeneous. Stratifying experimental hut data by resistance levels in this population reduced heterogeneity. In areas where mosquitoes are highly resistant to pyrethroids, pyrethroid‐PBO nets will reduce mosquito blood‐feeding rates (i.e. users will be better protected against mosquito bites by using pyrethroid‐PBO nets). This impact on blood feeding is reduced when nets have been through the standard 20 washes recommended by the World Health Organization (WHO) to assess chemical durability, but it remains significant (high‐certainty evidence). When resistance is high and new unwashed nets are used, mosquito mortality is substantially higher when the nets contain PBO compared to pyrethroid only (high‐certainty evidence). However this effect on mosquito mortality, which is important for the community‐level protection afforded by LLIN usage (Hawley 2003; Maxwell 2002), is not sustained when nets have been washed multiple times. In this Cochrane Review, we classified mosquitoes as highly resistant if less than 30% were killed in a standard bioassay. When mortality rates exceeded 30%, we found little evidence to suggest that pyrethroid‐PBO nets provided greater personal protection or resulted in greater mosquito mortality than standard pyrethroid‐only nets. This result is not unexpected, given that in areas where resistance is uncommon or absent, exposure to pyrethroids alone would be expected to negatively affect the mosquito; it is only in areas where the efficacy of pyrethroids has been eroded by the development of high levels of resistance that the addition of a synergist might be needed.
We found no evidence for any difference in the performance of pyrethroid‐PBO nets from different manufacturers against highly pyrethroid‐resistant mosquitoes. We stratified results by net type only for trials that were conducted in areas of high resistance. We have not reported comparisons for DawaPlus‐PBO and Veeralin‐PBO nets in this sub‐analysis, as there was only a single data point for these net types. We did not stratify data from the cRCTs by net type, as one trial used only one net type (Protopopoff 2018), and the second was not powered to detect differences between nets from different manufacturers and assigned an uneven number of clusters to each net type (Staedke 2020). Unwashed PermaNet 3.0 and Olyset Plus resulted in similar increases in mosquito mortality compared to pyrethroid‐only LLINs from the same manufacturer, although this effect on mortality was not always sustained after washing (Corbel 2010; Koudou 2011; Pennetier 2013; Toé 2018). A significant improvement in personal protection for unwashed pyrethroid‐PBO nets was observed only for PermaNet 3.0 (Corbel 2010; Toé 2018), but after washing, pyrethroid‐PBO nets from both manufacturers provided greater personal protection than the equivalent pyrethroid‐only nets (Corbel 2010; Pennetier 2013). Results from comparisons between pyrethroid‐PBO nets from different manufacturers should be taken with great caution, given the very limited number of data points available, particularly for washed nets. Further trials, in which nets from different manufacturers are directly compared in the same trial, are needed to address the issue of equivalence between different pyrethroid‐PBO nets.
Certainty of the evidence
We appraised the certainty of evidence using the GRADE approach (summary of findings Table 1summary of findings Table 2summary of findings Table 3summary of findings Table 4). The two cRCTs provided moderate‐certainty evidence that pyrethroid‐PBO nets reduced parasite prevalence for the duration of the trial (high‐certainty evidence after four to six months) (Protopopoff 2018; Staedke 2020).
This result was obtained from two independent studies, conducted in different locations and settings; therefore the evidence adheres to the WHO recommendation that at least two cRCTs must be completed to demonstrate public health value (WHO‐GMP 2017b).
The certainty of evidence from trials using entomological endpoints varied. Data from village trials were difficult to assess, as there was considerable heterogeneity in the level of pyrethroid resistance and presumably also in the resistance mechanisms, both within and between trials. Analysis of data from experimental hut trials yielded high‐certainty evidence for superior performance of pyrethroid‐PBO nets in areas of high resistance, but evidence from trials conducted in other settings was of low or very low certainty.
Overall completeness and applicability of evidence
All trials included in this review compared pyrethroid‐PBO nets with the nearest equivalent pyrethroid‐only LLINs. Further changes to net specifications were often included when manufacturers incorporated the synergist. For example, the pyrethroid‐PBO net manufactured by Vestergaard (PermaNet 3.0) contains higher levels of deltamethrin and yarn of a different denier (thickness) compared to the pyrethroid‐only equivalent, PermaNet 2.0; the pyrethroid in Olyset Plus (Sumitomo Chemical Co. Ltd.) is released from the yarn at a different rate than that in the Olyset nets. These additional variations in chemical or physical composition, or both, of the nets make it difficult to directly assess the added value of the addition of PBO. Furthermore, the concentration of PBO and its site of application differ markedly between nets received from different manufacturers. Two of the currently available pyrethroid‐PBO nets (PermaNet 3.0 and Tsara Plus 3.0) contain PBO only on the roof of the netting, exploiting the behavioural patterns of host‐seeking mosquitoes to attempt to reach the net user by approaching from above (Parker 2015), whilst the remaining pyrethroid‐PBO nets contain the synergist on all sides of the net. The amount of PBO contained within the net differs by a factor of 25‐fold. It is not known how net manufacturers selected the doses of PBO applied to the netting.
With currently available data, it is not possible to draw any conclusions on which strategy for producing pyrethroid‐PBO nets will prove the most effective under field conditions. The optimum PBO:pyrethroid ratio will likely differ depending on the level of resistance in the mosquito and underpinning resistance mechanisms. Data from experimental hut trials suggest that the PBO component of pyrethroid‐PBO nets is lost after repeated washing, as enhanced mortality caused by the synergist nets is not maintained after 20 washes. As yet, no trials on the durability of pyrethroid‐PBO nets under operational conditions have been published, although monitoring is under way. It is encouraging to note that both RCTs of pyrethroid‐PBO nets found that the superior protective efficacy of Olyset Plus compared to standard Olyset nets was maintained at 21 months of use; the trial in Tanzania is being extended to establish whether this effect lasts the full duration of an LLIN's intended 36‐month life span. No plans are under way to continue monitoring in the Uganda trial past the 25‐month collections (Staedke 2020).
Most available data evaluated the performance of pyrethroid‐PBO LLINs against Anopheles gambiae s.l., with very limited data available for the second major species complex in Africa, An funestus, and none for other minor vector species. As different mosquito species may differ in their behaviour and in the strength and underpinning mechanisms of pyrethroid resistance, this represents an important data gap that may have implications for practice in areas where An gambiae complex is not the predominant malaria vector.
Potential biases in the review process
As the addition of PBO to pyrethroid LLINs is expected to enhance their performance only in areas where mosquitoes are resistant to pyrethroid insecticides, it was important to stratify the results by resistance status. To do this, we used the WHO definition of resistance as mosquito populations with less than 90% mortality in a discriminating dose assay (WHO 2016), and then we split the resistant populations into three groups, depending on the percentage of mortality observed. Discriminating dose assays provide an estimate of the prevalence of resistance in a population but do not indicate the strength of this resistance nor give any indication of the mechanism(s) underpinning the resistance. As PBO works primarily by inhibiting the metabolism of pyrethroids by cytochrome P450s, this synergist is likely to have had greatest impact in populations where resistance was primarily conferred by elevated P450 activity and further stratification according to resistance mechanisms might have proved informative. However, in reality, characterization of resistance in mosquitoes is still primarily performed by bioassays alone and the relevant contributions of different resistance mechanisms to the phenotype remain unknown. An exception to this is seen in An funestus, where pyrethroid resistance is almost entirely due to elevated P450 activity (Churcher 2016). Unfortunately, only one data set from experimental hut trials conducted where An funestus was the primary vector was made available to us at the time of this review.
Other examples of missing data that may have influenced study results include the absence of data on resistance status in some settings. Three experimental hut trials did not measure resistance at the time of the trial (Moore 2016; N'Guessan 2010; Pennetier 2013). For two of these trials, we used proxies for resistance; however, no proxy data were available for An funestus in Moore 2016, and hence we did not include this population in the stratified analysis. Three trials did not share their data with the review authors; these included trials on nets from two of the more recent manufacturers to produce pyrethroid‐PBO nets (N’Guessan 2016; Tungu 2017), which precluded stratified analysis for these net types. For clinical trials, both species composition and resistance level may vary between clusters and/or over the duration of the trial (e.g. the Uganda trial ‐ Staedke 2020 ‐ involved 104 clusters across the country as part of the national LLIN campaign). The population was classified as highly pyrethroid resistant based on data provided by the study authors (WHO tube bioassay conducted in Banangaizi East: deltamethrin 0.05%, 20.7% mosquito mortality, n = 163), but the resistance phenotype of the vector population is likely to vary considerably between clusters.
One key finding of this trial was the decline in performance of pyrethroid‐PBO nets after washing. However, as discussed above, it is not clear how the standardized washing protocol employed in experimental hut trials of LLINs reflects the actual chemical retention of active ingredients under operational use. It is encouraging to note that the impact of pyrethroid‐PBO nets in reducing parasite prevalence was sustained over two years, hence the policy implications of the loss in bio efficacy after washing remain to be determined.
Agreements and disagreements with other studies or reviews
This is an update of the first Cochrane Review of pyrethroid‐PBO nets (Gleave 2018). An earlier meta‐analysis of experimental hut data indicated that pyrethroid‐PBO nets would have the greatest impact against mosquito populations with intermediate levels of resistance (Churcher 2016). Using transmission models to convert entomological outputs into estimates of public health benefit, the authors noted that the impact of pyrethroid‐PBO nets would vary depending on mosquito species, resistance levels, parasite prevalence, and LLIN usage. The importance of taking these key parameters into account when predicting the public health impact of a switch to pyrethroid‐PBO nets has been somewhat lost in policy documents and operational guidelines, which seek to provide a simple decision rule to aid net selection. Hence, in the WHO report from the 2017 Evidence Review Group on ‘Conditions for deployment of mosquito nets treated with pyrethroid and piperonyl butoxide', it is recommended that "National malaria control programmes and their partners should consider deployment of pyrethroid‐PBO nets in areas where pyrethroid resistance has been confirmed in the main malaria vectors" (WHO 2017). In technical guidelines from one of the major net distributors, the PMI, the conditions for deployment of PBO nets include "moderate levels of pyrethroid resistance (defined as 35% to 80% mortality), evidence that PBO restores pyrethroid susceptibility, and moderate to high malaria prevalence" (PMI 2018). The PMI definition of moderate resistance overlaps with our definitions of moderate and low resistance. However in our review, the best evidence for superior efficacy of pyrethroid‐PBO nets is derived from areas with high resistance (< 30% mortality), and very little evidence suggests improved performance in areas with moderate or low levels of resistance. The differences between these trials may have arisen from incorporation of a large data set of laboratory bioassays comparing mosquito mortality with or without pre‐exposure to PBO in the modelling study. These laboratory bioassays rely on use of a single discriminating dose and identified multiple trials where highly resistant populations were not impacted by PBO. In the current review, the mosquito populations included were limited to sites in which experimental hut trials had been conducted, and this may not have fully captured the full diversity of resistance mechanisms in Anopheles mosquitoes. This again highlights the importance of further trials on the influence of resistance mechanisms on the impact of pyrethroid‐PBO LLINs.
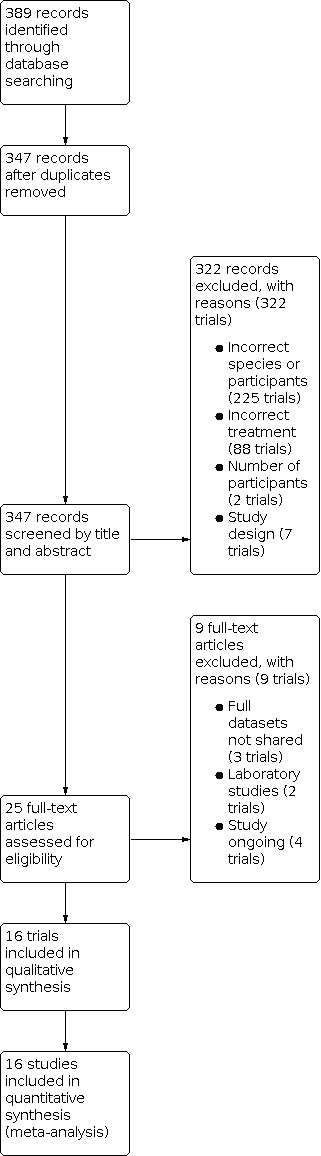
Study flow diagram.

‘Risk of bias' summary: review authors' judgements about each risk of bias item for each included study.

Comparison 1: Commercial pyrethroid‐PBO nets versus commercial LLINs: village trials, Outcome 1: Parasite prevalence (pyrethroid‐PBO nets vs non‐PBO LLINs, latest end points in RCT)

Comparison 1: Commercial pyrethroid‐PBO nets versus commercial LLINs: village trials, Outcome 2: Parasite prevalence (pyrethroid‐PBO nets vs non‐PBO LLINs, shown at 4 different time points)

Comparison 1: Commercial pyrethroid‐PBO nets versus commercial LLINs: village trials, Outcome 3: Mosquito sporozoite‐positive (adjusted ICC 0.1)

Comparison 1: Commercial pyrethroid‐PBO nets versus commercial LLINs: village trials, Outcome 4: Mosquito parous (adjusted ICC 0.1)

Comparison 2: Commercial pyrethroid‐PBO nets versus commercial LLINs: hut trials, Outcome 1: Mosquito mortality (pooled) hut/night (adjusted ICC 0.1)

Comparison 2: Commercial pyrethroid‐PBO nets versus commercial LLINs: hut trials, Outcome 2: Mosquito blood‐feeding success (pooled) hut/night (adjusted ICC 0.1)

Comparison 2: Commercial pyrethroid‐PBO nets versus commercial LLINs: hut trials, Outcome 3: Mosquito exophily (pooled) hut/night (adjusted ICC 0.1)

Comparison 2: Commercial pyrethroid‐PBO nets versus commercial LLINs: hut trials, Outcome 4: Mosquito mortality (high resistance) hut/night (adjusted ICC 0.1)

Comparison 2: Commercial pyrethroid‐PBO nets versus commercial LLINs: hut trials, Outcome 5: Mosquito blood‐feeding success (high resistance) hut/night (adjusted ICC 0.1)

Comparison 2: Commercial pyrethroid‐PBO nets versus commercial LLINs: hut trials, Outcome 6: Mosquito mortality (moderate resistance) hut/night (adjusted ICC 0.1)

Comparison 2: Commercial pyrethroid‐PBO nets versus commercial LLINs: hut trials, Outcome 7: Mosquito blood‐feeding success (moderate resistance) hut/night (adjusted ICC 0.1)

Comparison 2: Commercial pyrethroid‐PBO nets versus commercial LLINs: hut trials, Outcome 8: Mosquito mortality (low resistance) hut/night (adjusted ICC 0.1)

Comparison 2: Commercial pyrethroid‐PBO nets versus commercial LLINs: hut trials, Outcome 9: Mosquito blood‐feeding success (low resistance) hut/night (adjusted ICC 0.1)

Comparison 2: Commercial pyrethroid‐PBO nets versus commercial LLINs: hut trials, Outcome 10: Mosquito mortality (susceptible) hut/night (adjusted ICC 0.1)

Comparison 2: Commercial pyrethroid‐PBO nets versus commercial LLINs: hut trials, Outcome 11: Mosquito blood‐feeding success (susceptible) hut/night (adjusted ICC 0.1)

Comparison 2: Commercial pyrethroid‐PBO nets versus commercial LLINs: hut trials, Outcome 12: Mosquito mortality (high resistance/Permanet) hut/night (adjusted ICC 0.1)

Comparison 2: Commercial pyrethroid‐PBO nets versus commercial LLINs: hut trials, Outcome 13: Mosquito blood‐feeding success (high resistance/Permanet) hut/night (adjusted ICC 0.1)

Comparison 2: Commercial pyrethroid‐PBO nets versus commercial LLINs: hut trials, Outcome 14: Mosquito mortality (high resistance/Olyset) hut/night (adjusted ICC 0.1)

Comparison 2: Commercial pyrethroid‐PBO nets versus commercial LLINs: hut trials, Outcome 15: Mosquito blood‐feeding success (high resistance/Olyset) hut/night (adjusted ICC 0.1)
| Pyrethroid‐piperonyl butoxide (PBO) nets compared to long‐lasting insecticidal nets (LLINs) for malaria control when insecticide resistance is high | ||||||
| Patient or population: adults and childen living in malaria‐endemic areas, Anopheles gambiae complex or Anopheles funestus group | ||||||
| Outcomes | Anticipated absolute effects* (95% CI) | Relative effect | Number of participants, | Certainty of the evidence | Comments | |
|---|---|---|---|---|---|---|
| Risk with LLIN | Risk with pyrethroid‐PBO nets | |||||
| Parasite prevalence (4‐ to 6‐month follow‐up) | 254 per 1000a | 201 per 1000 (174 to 233)a | OR 0.74 (0.62 to 0.89) | 11,582 people (2 trials, 2 comparisons, 61 PBO clusters, 64 non‐PBO clusters) | ⊕⊕⊕⊕ | Pyrethroid‐PBO nets at 4‐ to 6‐month follow‐up reduce parasite prevalence in areas of high insecticide resistance |
| Parasite prevalence (9‐ to 12‐month follow‐up) | 224 per 1000a | 172 per 1000 (150 to 199)a | OR 0.72 (0.61 to 0.86) | 11,370 people (2 trials, 2 comparisons, 61 PBO clusters, 64 non‐PBO clusters) | ⊕⊕⊕⊝ due to inconsistency | Pyrethroid‐PBO nets at 9‐ to 12‐month follow‐up reduce parasite prevalence in areas of high insecticide resistance |
| Parasite prevalence (16‐ to 18‐month follow‐up) | 248 per 1000a | 225 per 1000 (196 to 255)a | OR 0.88 (0.74 to 1.04) | 11,822 people (2 trials, 2 comparisons, 61 PBO clusters, 64 non‐PBO clusters) | ⊕⊕⊕⊝ due to inconsistency | Pyrethroid‐PBO nets at 16‐ to 18‐month follow‐up reduce parasite prevalence in areas of high insecticide resistance |
| Parasite prevalence (21‐ to 25‐month follow‐up) | 350 per 1000a | 298 per 1000 (265 to 338)a | OR 0.79 (0.67 to 0.95) | 10,603 people (2 trials, 2 comparisons, 54 PBO clusters, 60 non‐PBO clusters) | ⊕⊕⊕⊝ due to inconsistency | Pyrethroid‐PBO nets at 21‐ to 25‐month follow‐up reduce parasite prevalence in areas of high insecticide resistance |
| Mosquito mortality (unwashed nets) | 238 per 1000a | 438 per 1000 | RR 1.84 | 14,620 mosquitoes | ⊕⊕⊕⊕ | Mosquito mortality is higher with unwashed pyrethroid‐PBO nets compared to standard unwashed LLINs in areas of high insecticide resistance |
| Mosquito mortality (washed nets) | 201 per 1000a | 242 per 1000 | RR 1.20 | 10,268 mosquitoes | ⊕⊝⊝⊝ due to imprecision and inconsistency | We do not know whether pyrethroid‐PBO nets have an effect on mosquito mortality in areas of high insecticide resistance when the nets have been washed |
| Blood‐feeding success (unwashed nets) | 438 per 1000a | 263 per 1000 | RR 0.60 (0.50 to 0.71)
| 14,000 mosquitoes | ⊕⊕⊕⊕ | Mosquito blood‐feeding success is decreased with unwashed pyrethroid‐PBO nets compared to standard unwashed LLINs in areas of high insecticide resistance |
| Blood‐feeding success (washed nets) | 494 per 1000a | 400 per 1000 | RR 0.81 | 9674 mosquitoes | ⊕⊕⊕⊕ | Mosquito blood‐feeding success is decreased with washed pyrethroid‐PBO nets compared to standard washed LLINs in areas of high insecticide resistance |
| *The risk in the intervention group (and its 95% CI) is based on the assumed risk in the comparison group and the relative effect of the intervention (and its 95% CI). | ||||||
| GRADE Working Group grades of evidence. | ||||||
| aOriginal numbers were used in this table; however in pooled analysis, events and total numbers were generated from cluster‐adjusted results, which use the effective sample size. Note that cluster adjustments do not change the point estimate of the effect size ‐ just the standard error. | ||||||
| Pyrethroid‐piperonyl butoxide (PBO) nets compared to long‐lasting insecticidal nets (LLINs) for malaria control when insecticide resistance is moderate | ||||||
| Patient or population:Anopheles gambiae complex or Anopheles funestus group | ||||||
| Outcomes | Anticipated absolute effects* (95% CI) | Relative effect | Number of mosquitoes | Certainty of the evidence | Comments | |
|---|---|---|---|---|---|---|
| Risk with LLIN | Risk with pyrethroid‐PBO nets | |||||
| Mosquito mortality (unwashed nets) | 180 per 1000a | 303 per 1000 | RR 1.68 | 1007 | ⊕⊕⊕⊝ due to imprecision | Mosquito mortality is probably higher with unwashed pyrethroid‐PBO nets compared to standard unwashed LLINs in areas of moderate insecticide resistance |
| Mosquito mortality (washed nets) | 287 per 1000a | 307 per 1000 | RR 1.07 | 329 | ⊕⊕⊝⊝ due to imprecision and indirectness | There may be little to no difference in the effect of washed pyrethroid‐PBO nets on mosquito mortality compared to standard washed LLINs (washed) in areas of moderate insecticide resistance |
| Blood‐feeding success (unwashed nets) | 258 per 1000a | 232 per 1000 | RR 0.90 | 1006 | ⊕⊕⊕⊝ due to imprecision | There is probably little to no difference in the effect of pyrethroid‐PBO nets (unwashed) on mosquito blood‐feeding success compared to standard LLINs in areas of moderate insecticide resistance |
| Blood‐feeding success (washed nets) | 586 per 1000a | 533 per 1000 | RR 0.91 | 329 | ⊕⊕⊝⊝ due to imprecision and indirectness | There may be little to no difference in the effect of washed pyrethroid‐PBO nets on mosquito blood‐feeding success compared to standard washed LLINs in areas of moderate insecticide resistance |
| *The risk in the intervention group (and its 95% CI) is based on the assumed risk in the comparison group and the relative effect of the intervention (and its 95% CI). | ||||||
| GRADE Working Group grades of evidence. | ||||||
| aOriginal numbers are used in this table; however for the pooled analysis, we generated events and total numbers from cluster‐adjusted results, which used the effective sample size. Note that cluster adjustments do not change the point estimate of the effect size, just the standard error. | ||||||
| Pyrethroid‐piperonyl butoxide (PBO) nets compared to long‐lasting insecticidal nets (LLINs) for malaria control when insecticide resistance is low | ||||||
| Patient or population:Anopheles gambiae complex or Anopheles funestus group | ||||||
| Outcomes | Anticipated absolute effects* (95% CI) | Relative effect | Number of mosquitoes | Certainty of the evidence | Comments | |
|---|---|---|---|---|---|---|
| Risk with LLINs | Risk with pyrethroid‐PBO nets | |||||
| Mosquito mortality (unwashed nets) | 527 per 1000a | 659 per 1000 | RR 1.25 | 1580 | ⊕⊕⊕⊝ due to imprecision | There is probably little to no difference in the effect of unwashed pyrethroid‐PBO nets on mosquito mortality compared to standard unwashed LLINs in areas of low insecticide resistance |
| Mosquito mortality (washed nets) | 394 per 1000a | 547 per 1000 | RR 1.39 | 1774 | ⊕⊝⊝⊝ due to imprecision and inconsistency | We do not know if pyrethroid‐PBO nets have an effect on mosquito mortality in areas of low insecticide resistance when the nets have been washed |
| Blood‐feeding success (unwashed nets) | 201 per 1000a | 151 per 1000 | RR 0.75 | 1580 | ⊕⊝⊝⊝ due to imprecision and inconsistency | We do not know if unwashed pyrethroid‐PBO nets have an effect on mosquito blood‐feeding success in areas of low insecticide resistance |
| Blood‐feeding success (washed nets) | 161 per 1000a | 172 per 1000 | RR 1.07 | 1774 | ⊕⊕⊝⊝ due to inconsistency | Mosquito blood‐feeding success may decrease with washed pyrethroid‐PBO nets compared to standard washed LLINs in areas of low insecticide resistance |
| *The risk in the intervention group (and its 95% CI) is based on the assumed risk in the comparison group and the relative effect of the intervention (and its 95% CI). | ||||||
| GRADE Working Group grades of evidence. | ||||||
| aOriginal numbers are used in this table; however for the pooled analysis, events and total numbers were generated from cluster‐adjusted results, which use the effective sample size. Note that cluster adjustments do not change the point estimate of the effect size, just the standard error. | ||||||
| Pyrethroid‐piperonyl butoxide (PBO) nets compared to long‐lasting insecticidal nets (LLINs) for malaria control when mosquitoes are susceptible | ||||||
| Patient or population:Anopheles gambiae complex or Anopheles funestus group Intervention: pyrethroid‐PBO nets | ||||||
| Outcomes | Anticipated absolute effects* (95% CI) | Relative effect | Number of mosquitoes | Certainty of the evidence | Comments | |
|---|---|---|---|---|---|---|
| Risk with LLINs | Risk with pyrethroid‐PBO nets | |||||
| Mosquito mortality (unwashed nets) | 392 per 1000a | 471 per 1000 | RR 1.20 | 2791 | ⊕⊕⊝⊝ due to imprecision | There may be little to no difference in the effect of unwashed pyrethroid‐PBO nets on mosquito mortality compared to standard unwashed LLINs in areas of no insecticide resistance |
| Mosquito mortality (washed nets) | 457 per 1000a | 489 per 1000 | RR 1.07 | 2644 | ⊕⊕⊝⊝ due to imprecision | There may be little to no difference in the effect of washed pyrethroid‐PBO nets on mosquito mortality compared to standard washed LLINs in areas of no insecticide resistance |
| Blood‐feeding success (unwashed nets) | 57 per 1000a | 29 per 1000 | RR 0.52 | 2791 | ⊕⊝⊝⊝ due to imprecision and inconsistency | We do not know if unwashed pyrethroid‐PBO nets have an effect on mosquito blood‐feeding success in areas of no insecticide resistance |
| Blood‐feeding success (washed nets) | 64 per 1000a | 82 per 1000 | RR 1.25 | 2644 | ⊕⊝⊝⊝ due to imprecision and inconsistency | We do not know if washed pyrethroid‐PBO nets have an effect on mosquito blood‐feeding success in areas of no insecticide resistance |
| *The risk in the intervention group (and its 95% CI) is based on the assumed risk in the comparison group and the relative effect of the intervention (and its 95% CI). | ||||||
| GRADE Working Group grades of evidence. | ||||||
| aOriginal numbers are used in this table; however for the pooled analysis, events and total numbers were generated from cluster‐adjusted results, which use the effective sample size. Note that cluster adjustments do not change the point estimate of the effect size, just the standard error. | ||||||
| WHOPES Phase | Definition |
|---|---|
| WHOPES Phase I. Laboratory bioassays | Cone bioassays: these studies are conducted in the laboratory setting and use standard WHO protocols (WHO 2013, Section 2.2.1), when mosquitoes are exposed to a suitable LLIN (treated intervention or untreated control) for three minutes using a standard plastic WHO cone. Following net exposure, mosquitoes are transferred to a holding container and are maintained on a sugar solution diet while entomological outcomes (mosquitoes knocked down 1 hour post exposure, and mosquito mortality 24 hours post exposure) are measured. Tunnel tests: these studies are conducted in the laboratory setting and use standard WHO protocols (WHO 2013, Section 2.2.2). Mosquitoes are released into a glass tunnel covered at each end with untreated netting. The intervention or control LLIN net sample is placed one‐third down the length of the tunnel, and the net contains 9 holes that enable mosquitoes to pass through. A suitable bait is immobilized in the shorter section of the tunnel, where it is available for mosquito biting. Mosquitoes are released into the opposite end of the tunnel and must make contact with the net and locate holes before they are able to feed on the bait. After 12 to 15 hours, mosquitoes are removed from both sections of the tunnel, and entomological outcomes (the number of mosquitoes in each section, mortality, and blood‐feeding inhibition at the end of the assay and 24 hours post exposure) are recorded. Wire‐ball bioassays: these studies are conducted in the laboratory setting, where mosquitoes are introduced into a wire‐ball frame that has been covered with the intervention or control LLIN. Mosquitoes are exposed for 3 minutes, after which they are transferred to a holding container, and entomological outcomes (mosquitoes knocked down 1 hour post exposure, and mosquito mortality 24 hours post exposure) are measured. |
| WHOPES Phase II. Experimental hut trials | WHOPES Phase II experimental hut trials are field trials conducted in Africa where wild mosquito populations or local colonized populations are evaluated. Volunteers or livestock sleep in experimental huts under a purposefully holed LLIN, with 1 person or animal per hut. Huts are designed to resemble local housing based on a West or East African design (WHO 2013; Section 3.3.1‐2). However these trials have identical design features, such as eave gaps or entry slits to allow mosquitoes to enter, and exit traps to capture exiting mosquitoes. LLINs and volunteers are randomly allocated to huts and are rotated in a Latin square to avoid bias, with huts cleaned between rotations to avoid contamination. Several nets, including an untreated control net, can be tested at the same time. Dead and live mosquitoes are collected each morning from inside the net, inside the hut, and inside the exit traps. They are then scored as blood‐fed or non‐blood‐fed, and as alive or dead, and live mosquitoes are maintained for a further 24 hours to assess delayed mosquito mortality. |
| WHOPES Phase III. Village trials | WHOPES Phase III village trials are conducted in Africa where wild mosquito populations are evaluated. Villages chosen to be included in the study are similar in terms of size, housing structure, location, and data available on insecticide resistance status of local malaria vectors. Households are assigned as conventional LLINs or PBO‐LLINs. Randomization can be done at the household or village level. Adult mosquitoes are collected from study houses, and mosquito density is measured. An indication of malaria transmission is measured at the study sites by recording infections in mosquitoes, parasite prevalence, or malaria incidence. |
| LLIN: long‐lasting insecticidal nets; PBO: piperonyl butoxide; WHOPES: World Health Organization Pesticide Evaluation Scheme. | |
| Product name | Product type | Status of WHO recommendation |
|---|---|---|
| DawaPlus 2.0 | Deltamethrin coated on polyester | Interim |
| DawaPlus 3.0 | Combination of deltamethrin coated onto polyester (side panels) and deltamethrin and PBO incorporated into polyester (roof) | Interim |
| DawaPlus 4.0 | Deltamethrin and PBO incorporated into polyester | Interim |
| Duranet | Alpha‐cypermethrin incorporated into polyethylene | Full |
| Interceptor | Alpha‐cypermethrin coated on polyester | Full |
| Interceptor G2 | Alpha‐cypermethrin and chlorfenapyr incorporated into polyester | Interim |
| LifeNet | Deltamethrin incorporated into polypropylene | Interim |
| MAGNet | Alpha‐cypermethrin incorporated into polyethylene | Full |
| MiraNet | Alpha‐cypermethrin incorporated into polyethylene | Interim |
| Olyset Net | Permethrin incorporated into polyethylene | Full |
| Olyset Plus | Permethrin (20 g/kg) and PBO (10 g/kg) incorporated into polyethylene | Interim |
| Panda Net 2.0 | Deltamethrin incorporated into polyethylene | Interim |
| PermaNet 2.0 | Deltamethrin coated on polyester | Full |
| PermaNet 3.0 | Combination of deltamethrin coated on polyester with strengthened border (side panels) and deltamethrin and PBO incorporated into polyethylene (roof) | Interim |
| Royal Sentry | Alpha‐cypermethrin incorporated into polyethylene | Full |
| SafeNet | Alpha‐cypermethrin coated on polyester | Full |
| Veeralin | Alpha‐cypermethrin and PBO incorporated into polyethylene | Interim |
| Yahe | Deltamethrin coated on polyester | Interim |
| Yorkool | Deltamethrin coated on polyester | Full |
| LLIN: long‐lasting insecticidal net; PBO: piperonyl butoxide; WHO: World Health Organization. | ||
| Insecticide | Formulation | Dosagea |
|---|---|---|
| Alpha‐cypermethrin | SC 10% | 20 to 40 |
| Cyfluthrin | EW 5% | 50 |
| Deltamethrin | SC 1% | 15 to 25 |
| Etofenprox | EW 10% | 200 |
| Lambda‐cyhalothrin | CS 2.5% | 10 to 15 |
| Permethrin | EC 10% | 200 to 500 |
| EC: emulsifiable concentrate; EW: emulsion, oil in water; CS: capsule suspension; SC: suspension concentrate; WT: water dispersible tablet. | ||
| Outcome | Confirmed resistance | Suspected resistance | Susceptible | Unclassified |
|---|---|---|---|---|
| WHO mosquito mortalitya | < 90% | 90% to 97% | 98% to 100% | Unknown |
| CDC knock‐downb | < 90% | 80% to 97% | 98% to 100% | Unknown |
| CDC: Centers for Disease Control and Prevention; WHO: World Health Organization. | ||||
| Outcome | Low | Moderate | High | Unclassified |
|---|---|---|---|---|
| Mosquito mortalitya | 61% to 90% | 31% to 60% | < 30% | Unknown |
| a24‐hour post‐exposure mortality (%). | ||||
| Criteria | Assessment | Comments | ||
|---|---|---|---|---|
| Yes | No | Unclear | ||
| Mosquito population | ||||
| Did the study test Anopheles gambiae complex or Anopheles funestus group mosquitoes? | ↓ | — | ↓ | State mosquito species |
| Were a minimum of 50 mosquitoes tested per study arm? | ↓ | — | ↓ | |
| Intervention | ||||
| Did the study include a long‐lasting insecticidal net (LLIN) or insecticide‐treated net (ITN)? | ↓ | — | ↓ | State net LLIN or ITN |
| Was the intervention net either of the following?
| ↓ | — | ↓ | State net type |
| Was the control net either of the following?
| ↓ | — | ↓ | State which objective study meets |
| Study design | ||||
| Was the study one of the following?
| ↓ | — | ↓ | State study type |
| For experimental hut study and village trial. Was the study conducted in Africa? | ↓ | — | ↓ | State country |
| Outcome | ||||
| Did the study include at least 1 of the following outcome measures?
| ↓ | — | ↓ | |
| Decision | ||||
| Is the study eligible for inclusion? | — | — | ↓ | State reason(s) for exclusion |
| Discuss with authors | ||||
| ITN: insecticide‐treated net; LLIN: long‐lasting insecticidal net; PBO: piperonyl butoxide; WHO: World Health Organization. | ||||
| Study ID | Locality | Net type | Net washed | Total number in ITN hut | Total number in UTN hut | Deterrence (%) reported | Deterrence (%) calculated |
|---|---|---|---|---|---|---|---|
| Vallée du Kou | DawaPlus 2.0 | No | 1548 | 1848 | 16.23 | 16.23 | |
| Vallée du Kou | DawaPlus 2.0 | Yes | 2155 | 1848 | 0 | ‐16.61 | |
| Vallée du Kou | DawaPlus 3.0 | No | 1365 | 1848 | 26.13 | 26.14 | |
| Vallée du Kou | DawaPlus 3.0 | Yes | 1981 | 1848 | 0 | ‐7.20 | |
| Vallée du Kou | DawaPlus 4.0 | No | 846 | 1848 | 54.22 | 54.22 | |
| Vallée du Kou | DawaPlus 4.0 | Yes | 1646 | 1848 | 10.93 | 10.93 | |
| Malanville | Permanet 2.0 | Yes | 195 | 285 | 31.58 | 31.58 | |
| Malanville | Permanet 3.0 | Yes | 210 | 285 | 26.32 | 26.32 | |
| Malanville | Permanet 2.0 | No | 243 | 285 | 14.74 | 14.74 | |
| Malanville | Permanet 3.0 | No | 214 | 285 | 24.91 | 24.91 | |
| Pitoa | Permanet 2.0 | Yes | 310 | 401 | 22.69 | 22.69 | |
| Pitoa | Permanet 3.0 | Yes | 163 | 401 | 59.35 | 59.35 | |
| Pitoa | Permanet 2.0 | No | 105 | 401 | 73.82 | 73.82 | |
| Pitoa | Permanet 3.0 | No | 146 | 401 | 63.59 | 63.59 | |
| Vallée du Kou | Permanet 2.0 | Yes | 788 | 908 | 13.22 | 13.22 | |
| Vallée du Kou | Permanet 3.0 | Yes | 724 | 908 | 20.26 | 20.26 | |
| Vallée du Kou | Permanet 2.0 | No | 329 | 908 | 63.77 | 63.77 | |
| Vallée du Kou | Permanet 3.0 | No | 463 | 908 | 49.01 | 49.01 | |
| Yaokoffikro | Permanet 3.0 | No | 303 | 796 | 62.1 | 61.93 | |
| Yaokoffikro | Permanet 2.0 | No | 317 | 796 | 60.4 | 60.18 | |
| Yaokoffikro | Permanet 3.0 | Yes | 313 | 796 | 60.1 | 60.68 | |
| Yaokoffikro | Permanet 2.0 | Yes | 281 | 796 | 64.4 | 64.70 | |
| Mibellon | PermaNet 2.0 | No | 237 | 390 | 39.2 | 39.2 | |
| Mibellon | PermaNet 3.0 | No | 153 | 390 | 60.8 | 60.8 | |
| Mibellon | Olyset Net | No | 176 | 390 | 54.9 | 54.9 | |
| Mibellon | Olyset Plus | No | 199 | 390 | 49 | 49 | |
| Ifakara | Veeralin LN | No | 722 | 810 | 11 | 10.86 | |
| Ifakara | Veeralin LN | Yes | 727 | 810 | 10 | 10.25 | |
| Ifakara | MAGNet LN | No | 1070 | 810 | 0 | ‐32.10 | |
| Ifakara | MAGNet LN | Yes | 773 | 810 | 5 | 4.57 | |
| Ifakara | Veeralin LN | No | 89 | 170 | 48 | 47.65 | |
| Ifakara | Veeralin LN | Yes | 85 | 170 | 50 | 50.00 | |
| Ifakara | MAGNet LN | No | 114 | 170 | 33 | 32.94 | |
| Ifakara | MAGNet LN | Yes | 103 | 170 | 39 | 39.41 | |
| Akron | Permanet 3.0 | No | 128 | 185 | 31 | 30.81 | |
| Akron | Permanet 3.0 | Yes | 155 | 185 | NR | 16.22 | |
| Akron | Permanet 2.0 | No | 114 | 185 | 38 | 38.38 | |
| Akron | Permanet 2.0 | Yes | 174 | 185 | NR | 5.95 | |
| Malanville | Olyset Plus | No | 67 | 69 | NR | 2.90 | |
| Malanville | Olyset Plus | Yes | 101 | 69 | NR | ‐46.38 | |
| Malanville | Olyset Net | No | 96 | 69 | NR | ‐39.13 | |
| Malanville | Olyset Net | Yes | 124 | 69 | NR | ‐79.71 | |
| Tengrela | Olyset Net | No | 923 | 480 | ‐92.29 | ‐92.29 | |
| Tengrela | Olyset Plus | No | 695 | 480 | ‐44.79 | ‐44.79 | |
| Tengrela | Permanet 2.0 | No | 858 | 480 | ‐78.75 | ‐78.75 | |
| Tengrela | Permanet 3.0 | No | 794 | 480 | ‐65.42 | ‐65.42 | |
| VK5 | Olyset Net | No | 1458 | 1095 | ‐33.15 | ‐33.15 | |
| VK5 | Olyset Plus | No | 1278 | 1095 | ‐16.71 | ‐16.71 | |
| VK5 | Permanet 2.0 | No | 1075 | 1095 | 1.83 | 1.83 | |
| VK5 | Permanet 3.0 | No | 657 | 1095 | 40 | 40.00 | |
| Zeneti | PermaNet 3.0 | No | 425 | 723 | 41 | 41.22 | |
| Zeneti | PermaNet 2.0 | No | 574 | 723 | 21 | 20.61 | |
| Zeneti | PermaNet 3.0 | Yes | 558 | 723 | 23 | 22.82 | |
| Zeneti | PermaNet 2.0 | Yes | 586 | 723 | 19 | 18.95 | |
| ITN: insecticide‐treated net; LLIN: long‐lasting insecticidal net; NR: not reported; PBO: piperonyl butoxide; UTN: untreated net; WHO: World Health Organization. | |||||||
| Study ID | Net type | Species | Density measurement | Collection method | Baseline density | Post‐intervention density | Reduction (%) |
|---|---|---|---|---|---|---|---|
| Untreated | An gambiae s.l. | Mean number caught per house | WT, IRC | 16.2 | 17.1 | ‐5.56 | |
| PermaNet 2.0 | An gambiae s.l. | Mean number caught per house | WT, IRC | 21.3 | 7.2 | 66.20 | |
| PermaNet 3.0 | An gambiae s.l. | Mean number caught per house | WT, IRC | 20.1 | 1.4 | 93.03 | |
| PermaNet 2.0 | An gambiae s.l. | Resting density per room per day | IRC | ‐ | 1.92 | ‐ | |
| PermaNet 3.0 | An gambiae s.l. | Resting density per room per day | IRC | ‐ | 3.05 | ‐ | |
| Olyset | An gambiae s.l. | Resting density per room per day | IRC | ‐ | 3.21 | ‐ | |
| Olyset Plus | An gambiae s.l. | Resting density per room per day | IRC | ‐ | 3.7 | ‐ | |
| Olyset | An gambiae | Mean number caught per catch | PSC | ‐ | 0.10 | ‐ | |
| Olset Plus | An gambiae | Mean number caught per catch | PSC | ‐ | 0.12 | ‐ | |
| PermaNet 2.0 | An gambiae | Mean number caught per catch | PSC | ‐ | 0.13 | ‐ | |
| PermaNet 3.0 | An gambiae | Mean number caught per catch | PSC | ‐ | 0.09 | ‐ | |
| Olyset | An funestus | Mean number caught per catch | PSC | ‐ | 0.08 | ‐ | |
| Olyset Plus | An funestus | Mean number caught per catch | PSC | ‐ | 0.16 | ‐ | |
| PermaNet 2.0 | An funestus | Mean number caught per catch | PSC | ‐ | 0.27 | ‐ | |
| PermaNet 3.0 | An funestus | Mean number caught per catch | PSC | ‐ | 0.13 | ‐ | |
| Olyset | An gambiae | Mean number caught per catch | LT | ‐ | 1.23 | ‐ | |
| Olset Plus | An gambiae | Mean number caught per catch | LT | ‐ | 0.27 | ‐ | |
| PermaNet 2.0 | An gambiae | Mean number caught per catch | LT | ‐ | 0.96 | ‐ | |
| PermaNet 3.0 | An gambiae | Mean number caught per catch | LT | ‐ | 1.44 | ‐ | |
| Olyset | An funestus | Mean number caught per catch | LT | ‐ | 2.02 | ‐ | |
| Olset Plus | An funestus | Mean number caught per catch | LT | ‐ | 2.1 | ‐ | |
| PermaNet 2.0 | An funestus | Mean number caught per catch | LT | ‐ | 5.76 | ‐ | |
| PermaNet 3.0 | An funestus | Mean number caught per catch | LT | ‐ | 3.76 | ‐ | |
| Olyset (2015) | Anopheles species | Mean number caught per house per night | LT | ‐ | 2.61 | ‐ | |
| Olyset Plus (2015) | Anopheles species | Mean number caught per house per night | LT | ‐ | 1.85 | ‐ | |
| Olyset (2016) | Anopheles species | Mean number caught per house per night | LT | ‐ | 3.60 | ‐ | |
| Olyset Plus (2016) | Anopheles species | Mean number caught per house per night | LT | ‐ | 2.68 | ‐ | |
| Permanet 2.0 (6 months) | An gambiae s.l. | Mean density per house | IRC | 0.3 | 0.67 | ||
| Permanet 3.0 (6 months) | An gambiae s.l. | Mean density per house | IRC | 0.8 | 0.17 | 78.75 | |
| Olyset (6 months) | An gambiae s.l. | Mean density per house | IRC | 0.3 | 0.81 | ||
| Olyset Plus (6 months) | An gambiae s.l. | Mean density per house | IRC | 0.1 | 0.16 | ||
| Permanet 2.0 (12 months) | An gambiae s.l. | Mean density per house | IRC | 0.3 | 1.35 | ||
| Permanet 3.0 (12 months) | An gambiae s.l. | Mean density per house | IRC | 0.8 | 0.52 | 35 | |
| Olyset (12 months) | An gambiae s.l. | Mean density per house | IRC | 0.3 | 1.1 | ||
| Olyset Plus (12 months) | An gambiae s.l. | Mean density per house | IRC | 0.1 | 0.23 | ||
| Permanet 2.0 (18 months) | An gambiae s.l. | Mean density per house | IRC | 0.3 | 1.65 | ||
| Permanet 3.0 (18 months) | An gambiae s.l. | Mean density per house | IRC | 0.8 | 1.57 | ||
| Olyset (18 months) | An gambiae s.l. | Mean density per house | IRC | 0.3 | 0.66 | ||
| Olyset Plus (18 months) | An gambiae s.l. | Mean density per house | IRC | 0.1 | 0.19 | ||
| No intervention | An gambiae s.s. | Mean number caught per village | IRC | 230 | 79 | 65.65 | |
| Permanet 2.0 | An gambiae s.s. | Mean number caught per village | IRC | 39 | 36 | 7.69 | |
| Permanet 2.0 | An gambiae s.s. | Mean number caught per village | IRC | 82 | 45 | 45.12 | |
| Permanet 3.0 | An gambiae s.s. | Mean number caught per village | IRC | 77 | 12 | 84.42 | |
| Permanet 3.0 | An gambiae s.s. | Mean number caught per village | IRC | 178 | 15 | 91.57 | |
| No intervention | An gambiae s.s. | Mean number caught per person per night per village | Indoor & outdoor HLC | 415 | 72 | 82.65 | |
| Permanet 2.0 | An gambiae s.s. | Mean number caught per person per night per village | Indoor & outdoor HLC | 33 | 31 | 6.06 | |
| Permanet 2.0 | An gambiae s.s. | Mean number caught per person per night per village | Indoor & outdoor HLC | 79 | 64 | 18.99 | |
| Permanet 3.0 | An gambiae s.s. | Mean number caught per person per night per village | Indoor & outdoor HLC | 98 | 19 | 80.61 | |
| Permanet 3.0 | An gambiae s.s. | Mean number caught per person per night per village | Indoor & outdoor HLC | 156 | 36 | 76.92 | |
| An funestus: Anopheles funestus; An gambiae: Anopheles gambiae; HLC: human landing catch; IRC: indoor resting catch; LT: light trap; PSC: pyrethrum spray catch; WT: window trap. | |||||||
| Outcome or subgroup title | No. of studies | No. of participants | Statistical method | Effect size |
| 1.1 Parasite prevalence (pyrethroid‐PBO nets vs non‐PBO LLINs, latest end points in RCT) Show forest plot | 2 | Odds Ratio (IV, Fixed, 95% CI) | 0.79 [0.67, 0.95] | |
| 1.2 Parasite prevalence (pyrethroid‐PBO nets vs non‐PBO LLINs, shown at 4 different time points) Show forest plot | 2 | Odds Ratio (IV, Fixed, 95% CI) | Subtotals only | |
| 1.2.1 4 to 6 months | 2 | Odds Ratio (IV, Fixed, 95% CI) | 0.74 [0.62, 0.89] | |
| 1.2.2 9 to 12 months | 2 | Odds Ratio (IV, Fixed, 95% CI) | 0.72 [0.61, 0.86] | |
| 1.2.3 16 to 18 months | 2 | Odds Ratio (IV, Fixed, 95% CI) | 0.88 [0.74, 1.04] | |
| 1.2.4 21 to 25 months | 2 | Odds Ratio (IV, Fixed, 95% CI) | 0.79 [0.67, 0.95] | |
| 1.3 Mosquito sporozoite‐positive (adjusted ICC 0.1) Show forest plot | 4 | 424 | Risk Ratio (M‐H, Random, 95% CI) | 0.82 [0.24, 2.75] |
| 1.4 Mosquito parous (adjusted ICC 0.1) Show forest plot | 3 | 220 | Risk Ratio (M‐H, Random, 95% CI) | 0.97 [0.82, 1.13] |
| Outcome or subgroup title | No. of studies | No. of participants | Statistical method | Effect size |
| 2.1 Mosquito mortality (pooled) hut/night (adjusted ICC 0.1) Show forest plot | 10 | 15614 | Risk Ratio (M‐H, Random, 95% CI) | 1.43 [1.26, 1.62] |
| 2.1.1 Unwashed | 10 | 8647 | Risk Ratio (M‐H, Random, 95% CI) | 1.63 [1.29, 2.05] |
| 2.1.2 Washed | 8 | 6967 | Risk Ratio (M‐H, Random, 95% CI) | 1.19 [1.04, 1.38] |
| 2.2 Mosquito blood‐feeding success (pooled) hut/night (adjusted ICC 0.1) Show forest plot | 9 | 12351 | Risk Ratio (M‐H, Random, 95% CI) | 0.75 [0.66, 0.85] |
| 2.2.1 Unwashed | 9 | 7261 | Risk Ratio (M‐H, Random, 95% CI) | 0.68 [0.57, 0.80] |
| 2.2.2 Washed | 7 | 5090 | Risk Ratio (M‐H, Random, 95% CI) | 0.87 [0.74, 1.02] |
| 2.3 Mosquito exophily (pooled) hut/night (adjusted ICC 0.1) Show forest plot | 10 | 13214 | Risk Ratio (M‐H, Random, 95% CI) | 1.00 [0.94, 1.06] |
| 2.3.1 Unwashed | 10 | 7699 | Risk Ratio (M‐H, Random, 95% CI) | 1.00 [0.91, 1.10] |
| 2.3.2 Washed | 8 | 5515 | Risk Ratio (M‐H, Random, 95% CI) | 1.00 [0.93, 1.07] |
| 2.4 Mosquito mortality (high resistance) hut/night (adjusted ICC 0.1) Show forest plot | 5 | 7997 | Risk Ratio (M‐H, Random, 95% CI) | 1.58 [1.34, 1.86] |
| 2.4.1 Unwashed | 5 | 4896 | Risk Ratio (M‐H, Random, 95% CI) | 1.84 [1.60, 2.11] |
| 2.4.2 Washed | 4 | 3101 | Risk Ratio (M‐H, Random, 95% CI) | 1.20 [0.88, 1.63] |
| 2.5 Mosquito blood‐feeding success (high resistance) hut/night (adjusted ICC 0.1) Show forest plot | 4 | 7134 | Risk Ratio (M‐H, Random, 95% CI) | 0.66 [0.57, 0.76] |
| 2.5.1 Unwashed | 4 | 4458 | Risk Ratio (M‐H, Random, 95% CI) | 0.60 [0.50, 0.71] |
| 2.5.2 Washed | 3 | 2676 | Risk Ratio (M‐H, Random, 95% CI) | 0.81 [0.72, 0.92] |
| 2.6 Mosquito mortality (moderate resistance) hut/night (adjusted ICC 0.1) Show forest plot | 2 | 1027 | Risk Ratio (M‐H, Fixed, 95% CI) | 1.47 [1.21, 1.78] |
| 2.6.1 Unwashed | 2 | 751 | Risk Ratio (M‐H, Fixed, 95% CI) | 1.68 [1.33, 2.11] |
| 2.6.2 Washed | 1 | 276 | Risk Ratio (M‐H, Fixed, 95% CI) | 1.07 [0.74, 1.54] |
| 2.7 Mosquito blood‐feeding success (moderate resistance) hut/night (adjusted ICC 0.1) Show forest plot | 2 | 1034 | Risk Ratio (M‐H, Random, 95% CI) | 0.91 [0.78, 1.05] |
| 2.7.1 Unwashed | 2 | 752 | Risk Ratio (M‐H, Random, 95% CI) | 0.90 [0.72, 1.11] |
| 2.7.2 Washed | 1 | 282 | Risk Ratio (M‐H, Random, 95% CI) | 0.91 [0.74, 1.13] |
| 2.8 Mosquito mortality (low resistance) hut/night (adjusted ICC 0.1) Show forest plot | 2 | 1970 | Risk Ratio (M‐H, Random, 95% CI) | 1.30 [1.09, 1.56] |
| 2.8.1 Unwashed | 2 | 948 | Risk Ratio (M‐H, Random, 95% CI) | 1.25 [0.99, 1.57] |
| 2.8.2 Washed | 2 | 1022 | Risk Ratio (M‐H, Random, 95% CI) | 1.39 [0.95, 2.04] |
| 2.9 Mosquito blood‐feeding success (low resistance) hut/night (adjusted ICC 0.1) Show forest plot | 2 | 1970 | Risk Ratio (M‐H, Random, 95% CI) | 0.94 [0.56, 1.57] |
| 2.9.1 Unwashed | 2 | 948 | Risk Ratio (M‐H, Random, 95% CI) | 0.75 [0.27, 2.11] |
| 2.9.2 Washed | 2 | 1022 | Risk Ratio (M‐H, Random, 95% CI) | 1.07 [0.49, 2.33] |
| 2.10 Mosquito mortality (susceptible) hut/night (adjusted ICC 0.1) Show forest plot | 2 | 1916 | Risk Ratio (M‐H, Random, 95% CI) | 1.05 [0.96, 1.15] |
| 2.10.1 Unwashed | 2 | 948 | Risk Ratio (M‐H, Random, 95% CI) | 1.20 [0.64, 2.26] |
| 2.10.2 Washed | 2 | 968 | Risk Ratio (M‐H, Random, 95% CI) | 1.07 [0.92, 1.25] |
| 2.11 Mosquito blood‐feeding success (susceptible) hut/night (adjusted ICC 0.1) Show forest plot | 2 | 1916 | Risk Ratio (M‐H, Random, 95% CI) | 0.87 [0.40, 1.89] |
| 2.11.1 Unwashed | 2 | 948 | Risk Ratio (M‐H, Random, 95% CI) | 0.52 [0.12, 2.22] |
| 2.11.2 Washed | 2 | 968 | Risk Ratio (M‐H, Random, 95% CI) | 1.25 [0.82, 1.91] |
| 2.12 Mosquito mortality (high resistance/Permanet) hut/night (adjusted ICC 0.1) Show forest plot | 3 | 2806 | Risk Ratio (M‐H, Random, 95% CI) | 1.59 [1.26, 2.01] |
| 2.12.1 Not Washed | 3 | 1877 | Risk Ratio (M‐H, Random, 95% CI) | 1.81 [1.56, 2.10] |
| 2.12.2 Washed | 2 | 929 | Risk Ratio (M‐H, Random, 95% CI) | 1.18 [0.61, 2.28] |
| 2.13 Mosquito blood‐feeding success (high resistance/Permanet) hut/night (adjusted ICC 0.1) Show forest plot | 2 | 1943 | Risk Ratio (M‐H, Random, 95% CI) | 0.58 [0.45, 0.76] |
| 2.13.1 Unwashed | 2 | 1439 | Risk Ratio (M‐H, Random, 95% CI) | 0.53 [0.40, 0.69] |
| 2.13.2 Washed | 1 | 504 | Risk Ratio (M‐H, Random, 95% CI) | 0.76 [0.61, 0.93] |
| 2.14 Mosquito mortality (high resistance/Olyset) hut/night (adjusted ICC 0.1) Show forest plot | 2 | 1410 | Risk Ratio (M‐H, Random, 95% CI) | 1.73 [1.51, 1.97] |
| 2.14.1 Unwashed | 2 | 1257 | Risk Ratio (M‐H, Random, 95% CI) | 1.72 [1.48, 1.99] |
| 2.14.2 Washed | 1 | 153 | Risk Ratio (M‐H, Random, 95% CI) | 1.81 [1.25, 2.61] |
| 2.15 Mosquito blood‐feeding success (high resistance/Olyset) hut/night (adjusted ICC 0.1) Show forest plot | 2 | 1470 | Risk Ratio (M‐H, Random, 95% CI) | 0.63 [0.40, 0.98] |
| 2.15.1 Unwashed | 2 | 1257 | Risk Ratio (M‐H, Random, 95% CI) | 0.67 [0.38, 1.18] |
| 2.15.2 Washed | 1 | 213 | Risk Ratio (M‐H, Random, 95% CI) | 0.50 [0.27, 0.93] |