Antiemetics for adults for prevention of nausea and vomiting caused by moderately or highly emetogenic chemotherapy: a network meta‐analysis
Abstract
Background
About 70% to 80% of adults with cancer experience chemotherapy‐induced nausea and vomiting (CINV). CINV remains one of the most distressing symptoms associated with cancer therapy and is associated with decreased adherence to chemotherapy. Combining 5‐hydroxytryptamine‐3 (5‐HT₃) receptor antagonists with corticosteroids or additionally with neurokinin‐1 (NK₁) receptor antagonists is effective in preventing CINV among adults receiving highly emetogenic chemotherapy (HEC) or moderately emetogenic chemotherapy (MEC). Various treatment options are available, but direct head‐to‐head comparisons do not allow comparison of all treatments versus another.
Objectives
• In adults with solid cancer or haematological malignancy receiving HEC
‐ To compare the effects of antiemetic treatment combinations including NK₁ receptor antagonists, 5‐HT₃ receptor antagonists, and corticosteroids on prevention of acute phase (Day 1), delayed phase (Days 2 to 5), and overall (Days 1 to 5) chemotherapy‐induced nausea and vomiting in network meta‐analysis (NMA)
‐ To generate a clinically meaningful treatment ranking according to treatment safety and efficacy
• In adults with solid cancer or haematological malignancy receiving MEC
‐ To compare whether antiemetic treatment combinations including NK₁ receptor antagonists, 5‐HT₃ receptor antagonists, and corticosteroids are superior for prevention of acute phase (Day 1), delayed phase (Days 2 to 5), and overall (Days 1 to 5) chemotherapy‐induced nausea and vomiting to treatment combinations including 5‐HT₃ receptor antagonists and corticosteroids solely, in network meta‐analysis
‐ To generate a clinically meaningful treatment ranking according to treatment safety and efficacy
Search methods
We searched CENTRAL, MEDLINE, Embase, conference proceedings, and study registries from 1988 to February 2021 for randomised controlled trials (RCTs).
Selection criteria
We included RCTs including adults with any cancer receiving HEC or MEC (according to the latest definition) and comparing combination therapies of NK₁ and 5‐HT₃ inhibitors and corticosteroids for prevention of CINV.
Data collection and analysis
We used standard methodological procedures expected by Cochrane.
We expressed treatment effects as risk ratios (RRs). Prioritised outcomes were complete control of vomiting during delayed and overall phases, complete control of nausea during the overall phase, quality of life, serious adverse events (SAEs), and on‐study mortality. We assessed GRADE and developed 12 'Summary of findings' tables. We report results of most crucial outcomes in the abstract, that is, complete control of vomiting during the overall phase and SAEs. For a comprehensive illustration of results, we randomly chose aprepitant plus granisetron as exemplary reference treatment for HEC, and granisetron as exemplary reference treatment for MEC.
Main results
Highly emetogenic chemotherapy (HEC)
We included 73 studies reporting on 25,275 participants and comparing 14 treatment combinations with NK₁ and 5‐HT₃ inhibitors. All treatment combinations included corticosteroids.
Complete control of vomiting during the overall phase
We estimated that 704 of 1000 participants achieve complete control of vomiting in the overall treatment phase (one to five days) when treated with aprepitant + granisetron. Evidence from NMA (39 RCTs, 21,642 participants; 12 treatment combinations with NK₁ and 5‐HT₃ inhibitors) suggests that the following drug combinations are more efficacious than aprepitant + granisetron for completely controlling vomiting during the overall treatment phase (one to five days): fosnetupitant + palonosetron (810 of 1000; RR 1.15, 95% confidence interval (CI) 0.97 to 1.37; moderate certainty), aprepitant + palonosetron (753 of 1000; RR 1.07, 95% CI 1.98 to 1.18; low‐certainty), aprepitant + ramosetron (753 of 1000; RR 1.07, 95% CI 0.95 to 1.21; low certainty), and fosaprepitant + palonosetron (746 of 1000; RR 1.06, 95% CI 0.96 to 1.19; low certainty).
Netupitant + palonosetron (704 of 1000; RR 1.00, 95% CI 0.93 to 1.08; high‐certainty) and fosaprepitant + granisetron (697 of 1000; RR 0.99, 95% CI 0.93 to 1.06; high‐certainty) have little to no impact on complete control of vomiting during the overall treatment phase (one to five days) when compared to aprepitant + granisetron, respectively.
Evidence further suggests that the following drug combinations are less efficacious than aprepitant + granisetron in completely controlling vomiting during the overall treatment phase (one to five days) (ordered by decreasing efficacy): aprepitant + ondansetron (676 of 1000; RR 0.96, 95% CI 0.88 to 1.05; low certainty), fosaprepitant + ondansetron (662 of 1000; RR 0.94, 95% CI 0.85 to 1.04; low certainty), casopitant + ondansetron (634 of 1000; RR 0.90, 95% CI 0.79 to 1.03; low certainty), rolapitant + granisetron (627 of 1000; RR 0.89, 95% CI 0.78 to 1.01; moderate certainty), and rolapitant + ondansetron (598 of 1000; RR 0.85, 95% CI 0.65 to 1.12; low certainty).
We could not include two treatment combinations (ezlopitant + granisetron, aprepitant + tropisetron) in NMA for this outcome because of missing direct comparisons.
Serious adverse events
We estimated that 35 of 1000 participants experience any SAEs when treated with aprepitant + granisetron. Evidence from NMA (23 RCTs, 16,065 participants; 11 treatment combinations) suggests that fewer participants may experience SAEs when treated with the following drug combinations than with aprepitant + granisetron: fosaprepitant + ondansetron (8 of 1000; RR 0.23, 95% CI 0.05 to 1.07; low certainty), casopitant + ondansetron (8 of 1000; RR 0.24, 95% CI 0.04 to 1.39; low certainty), netupitant + palonosetron (9 of 1000; RR 0.27, 95% CI 0.05 to 1.58; low certainty), fosaprepitant + granisetron (13 of 1000; RR 0.37, 95% CI 0.09 to 1.50; low certainty), and rolapitant + granisetron (20 of 1000; RR 0.57, 95% CI 0.19 to 1.70; low certainty).
Evidence is very uncertain about the effects of aprepitant + ondansetron (8 of 1000; RR 0.22, 95% CI 0.04 to 1.14; very low certainty), aprepitant + ramosetron (11 of 1000; RR 0.31, 95% CI 0.05 to 1.90; very low certainty), fosaprepitant + palonosetron (12 of 1000; RR 0.35, 95% CI 0.04 to 2.95; very low certainty), fosnetupitant + palonosetron (13 of 1000; RR 0.36, 95% CI 0.06 to 2.16; very low certainty), and aprepitant + palonosetron (17 of 1000; RR 0.48, 95% CI 0.05 to 4.78; very low certainty) on the risk of SAEs when compared to aprepitant + granisetron, respectively.
We could not include three treatment combinations (ezlopitant + granisetron, aprepitant + tropisetron, rolapitant + ondansetron) in NMA for this outcome because of missing direct comparisons.
Moderately emetogenic chemotherapy (MEC)
We included 38 studies reporting on 12,038 participants and comparing 15 treatment combinations with NK₁ and 5‐HT₃ inhibitors, or 5‐HT₃ inhibitors solely. All treatment combinations included corticosteroids.
Complete control of vomiting during the overall phase
We estimated that 555 of 1000 participants achieve complete control of vomiting in the overall treatment phase (one to five days) when treated with granisetron. Evidence from NMA (22 RCTs, 7800 participants; 11 treatment combinations) suggests that the following drug combinations are more efficacious than granisetron in completely controlling vomiting during the overall treatment phase (one to five days): aprepitant + palonosetron (716 of 1000; RR 1.29, 95% CI 1.00 to 1.66; low certainty), netupitant + palonosetron (694 of 1000; RR 1.25, 95% CI 0.92 to 1.70; low certainty), and rolapitant + granisetron (660 of 1000; RR 1.19, 95% CI 1.06 to 1.33; high certainty).
Palonosetron (588 of 1000; RR 1.06, 95% CI 0.85 to 1.32; low certainty) and aprepitant + granisetron (577 of 1000; RR 1.06, 95% CI 0.85 to 1.32; low certainty) may or may not increase complete response in the overall treatment phase (one to five days) when compared to granisetron, respectively. Azasetron (560 of 1000; RR 1.01, 95% CI 0.76 to 1.34; low certainty) may result in little to no difference in complete response in the overall treatment phase (one to five days) when compared to granisetron.
Evidence further suggests that the following drug combinations are less efficacious than granisetron in completely controlling vomiting during the overall treatment phase (one to five days) (ordered by decreasing efficacy): fosaprepitant + ondansetron (500 of 1000; RR 0.90, 95% CI 0.66 to 1.22; low certainty), aprepitant + ondansetron (477 of 1000; RR 0.86, 95% CI 0.64 to 1.17; low certainty), casopitant + ondansetron (461 of 1000; RR 0.83, 95% CI 0.62 to 1.12; low certainty), and ondansetron (433 of 1000; RR 0.78, 95% CI 0.59 to 1.04; low certainty).
We could not include five treatment combinations (fosaprepitant + granisetron, azasetron, dolasetron, ramosetron, tropisetron) in NMA for this outcome because of missing direct comparisons.
Serious adverse events
We estimated that 153 of 1000 participants experience any SAEs when treated with granisetron. Evidence from pair‐wise comparison (1 RCT, 1344 participants) suggests that more participants may experience SAEs when treated with rolapitant + granisetron (176 of 1000; RR 1.15, 95% CI 0.88 to 1.50; low certainty). NMA was not feasible for this outcome because of missing direct comparisons.
Certainty of evidence
Our main reason for downgrading was serious or very serious imprecision (e.g. due to wide 95% CIs crossing or including unity, few events leading to wide 95% CIs, or small information size). Additional reasons for downgrading some comparisons or whole networks were serious study limitations due to high risk of bias or moderate inconsistency within networks.
Authors' conclusions
This field of supportive cancer care is very well researched. However, new drugs or drug combinations are continuously emerging and need to be systematically researched and assessed.
For people receiving HEC, synthesised evidence does not suggest one superior treatment for prevention and control of chemotherapy‐induced nausea and vomiting.
For people receiving MEC, synthesised evidence does not suggest superiority for treatments including both NK₁ and 5‐HT₃ inhibitors when compared to treatments including 5‐HT₃ inhibitors only. Rather, the results of our NMA suggest that the choice of 5‐HT₃ inhibitor may have an impact on treatment efficacy in preventing CINV.
When interpreting the results of this systematic review, it is important for the reader to understand that NMAs are no substitute for direct head‐to‐head comparisons, and that results of our NMA do not necessarily rule out differences that could be clinically relevant for some individuals.
PICO
Plain language summary
Which drug combinations are best for prevention of nausea and vomiting caused by chemotherapy in adults with cancer?
The burden of nausea and vomiting caused by chemotherapy and what helps to prevent it?
In about 70% to 80% of adults with cancer, chemotherapy induces nausea and vomiting (CINV). Depending on the type of chemotherapy, treatment can cause strong or moderate sickness (hereafter referred to as HEC (highly emetogenic chemotherapy) and MEC (moderately emetogenic chemotherapy)). Multiple drug combinations have showed high benefit for CINV among adults receiving HEC or MEC.
What was the aim of our review?
Using a network meta‐analysis, we aimed to compare the benefits and harms of different drug combinations for prevention of CINV among people receiving HEC or MEC, and to identify treatment ranking. A network meta‐analysis is a technique used to compare different treatments described in already published trials, even when the original individual trial does not describe such comparisons.
What studies did we look at?
We searched selected medical databases and trial registries until February 2021. We included studies comparing multiple drug combinations for prevention of CINV among adults with any type of cancer receiving HEC or MEC that is commonly used in clinical practice. In particular, we looked at drugs inhibiting two specific biochemical receptors (neurokinin receptor and serotonin receptor) that trigger nausea and vomiting after chemotherapy. We looked at the preventative effects of these treatments over five days. This is the period during which the maximum intensity of CINV and further peaks of intensity are expected, after the start of chemotherapy.
Our key results...
...for people receiving HEC
We found 73 studies that reported on the experience of 25,275 participants and compared 14 treatment combinations of our interest.
Benefits. Over five days, investigated treatments helped to prevent any vomiting in 60% to 81% of people on average. Those individuals also had no need for rescue medicines, which are used in case nausea and vomiting occur even though prophylactic treatment has been given. The results of our analysis suggest some differences in effectiveness of different treatments, but overall we had little confidence that those differences would be reflected in real‐world observations.
Harms. We estimated that 1% to 4% of people experience serious side effects. The differences between treatments were small.
...for people receiving MEC
We found 38 studies that reported on the experience of 12,038 participants and compared 15 treatment combinations of our interest.
Benefits. Over five days, investigated treatments helped prevent any vomiting in 43% to 72% of people on average. Those individuals also had no need for rescue medicines. The results of our analysis suggest some differences in the effectiveness of different treatments, but overall, we had little confidence that those differences would be reflected in real‐world observations.
Harms. Few studies reported serious side effects. The ones that did suggest that on average 15% to 18% of people experience such events. Differences between treatments were small. However, we think that future research is needed to rule out potential differences between treatments.
Our confidence in the findings
We assessed how confident we were that there are differences between compared treatments. We had low or very low confidence that one treatment is better or worse than another in preventing CINV. Our confidence in differences between statistical results was mainly limited because measures of variation were wide apart and included both potential advantages and disadvantages, although measures of precision showed no or little effect. We also identified limitations in some of the included studies, which further limited our confidence in the effects. This was mainly the case when study personnel and participants knew which treatments were given and therefore may not adhere to the planned intervention, or may perceive or report effects differently.
Our conclusions
The results of our analysis suggest that there is no superior drug combination for prevention of CINV for people receiving HEC or MEC. However, results suggest that the choice of drugs targeting the serotonin receptor may impact effectiveness, irrespective of whether given with or without a drug targeting the neurokinin receptor. However, when interpreting these results, it is important for the reader to understand that these kinds of multiple‐comparison analyses are no substitute for head‐to‐head comparisons, and that the results do not necessarily rule out differences that could be clinically relevant for some individuals.
How up‐to‐date is this evidence?
Evidence is up‐to‐date to 2 February 2021.
Authors' conclusions
Summary of findings
| Efficacy | ||||||
|---|---|---|---|---|---|---|
| Antiemetics for adults for prevention of nausea and vomiting caused by highly emetogenic chemotherapy | ||||||
| Patient or population: adult cancer patients at risk for CINV caused by highly emetogenic chemotherapy Settings: inpatient and outpatient care Intervention: neurokinin‐1 (NK₁) receptor antagonist and 5‐hydroxytryptamine‐3 (5‐HT₃) receptor antagonists + corticosteroid Comparison: aprepitant (NK₁) combined with granisetron (5‐HT₃) + corticosteroid Outcome: complete control of vomiting during the overall phase (0 to 120 h of treatment with chemotherapy) RR < 1 indicates an advantage for the intervention Combinations of these interventions at any dose and by any route as mentioned above have been compared to one another in a full network | ||||||
| Interventions (corticosteroids included in all regimens)a | Illustrative comparative risks* (95% CI) | Risk ratio | No. of participants | Certainty of the evidence | Comments | |
| Assumed risk with aprepitant + granisetron | Corresponding risk with the intervention | |||||
|
|
| |||||
| fosnetupitant + palonosetron | 704 of 1000 | 810 of 1000 (683 to 944) | RR 1.15 | 21,642 (39) | ⊕⊕⊕⊝ moderateb | Fosnetupitant + palonosetron probably increases complete response in the overall phase when compared with aprepitant + granisetron |
| aprepitant + palonosetron | 704 of 1000 | 753 of 1000 (690 to 831) | RR 1.07 | 21,642 (39) | ⊕⊕⊝⊝ lowb,c | Aprepitant + palonosetron may result in a slight increase in complete response in the overall phase when compared with aprepitant + granisetron |
| aprepitant + ramosetron | 704 of 1000 | 753 of 1000 (669 to 852) | RR 1.07 | 21,642 (39) | ⊕⊕⊝⊝ lowb,c | Aprepitant + ramosetron may result in a slight increase in complete response in the overall phase when compared with aprepitant + granisetron |
| fosaprepitant + palonosetron | 704 of 1000 | 746 of 1000 (676 to 838) | RR 1.06 | 21,642 (39) | ⊕⊕⊝⊝ lowb,c | Fosaprepitant + palonosetron may result in a slight increase in complete response in the overall phase when compared with aprepitant + granisetron |
| netupitant + palonosetron | 704 of 1000 | 704 of 1000 (655 to 760) | RR 1.00 | 21,642 (39) | ⊕⊕⊕⊕ high | Netupitant + palonosetron has little to no impact on complete response in the overall phase when compared with aprepitant + granisetron |
| fosaprepitant + granisetron | 704 of 1000 | 697 of 1000 (655 to 746) | RR 0.99 | 21,642 (39) | ⊕⊕⊕⊕ high | Fosaprepitant + granisetron has little to no impact on complete response in the overall phase when compared with aprepitant + granisetron |
| aprepitant + ondansetron | 704 of 1000 | 676 of 1000 (620 to 739) | RR 0.96 | 21,642 (39) | ⊕⊕⊝⊝ lowb,c | Aprepitant + ondansetron may result in a slight decrease in complete response in the overall phase when compared with aprepitant + granisetron |
| fosaprepitant + ondansetron | 704 of 1000 | 662 of 1000 (598 to 732) | RR 0.94 | 21,642 (39) | ⊕⊕⊝⊝ lowb,c | Fosaprepitant + ondansetron may result in a slight decrease in complete response in the overall phase when compared with aprepitant + granisetron |
| casopitant + ondansetron | 704 of 1000 | 634 of 1000 (556 to 725) | RR 0.90 | 21,642 (39) | ⊕⊕⊝⊝ lowb,c | Aprepitant + ondansetron may decrease complete response in the overall phase when compared with aprepitant + granisetron |
| rolapitant + granisetron | 704 of 1000 | 627 of 1000 (549 to 711) | RR 0.89 | 21,642 (39) | ⊕⊕⊕⊝ moderateb | Rolapitant + granisetron probably decreases complete response in the overall phase when compared with aprepitant + granisetron |
| rolapitant + ondansetron | 704 of 1000 | 598 of 1000 (458 to 788) | RR 0.85 (0.65 to 1.12) | 21,642 (39) | ⊕⊕⊝⊝ lowc,d | Rolapitant + ondansetron may decrease complete response in the overall phase when compared with aprepitant + granisetron |
| *Basis for the assumed risk is actual event rates reported for the main comparator summed across studies: 1312 of 1863 (70.4%) participants treated with aprepitant + granisetron achieved complete response during the overall phase (aprepitant + granisetron was used in 7 studies reporting the outcome). The corresponding risk (and its 95% confidence interval) is based on the assumed risk in the comparison group and the risk ratio of the intervention (and its 95% CI). | ||||||
| GRADE Working Group grades of evidence. Moderate certainty: we are moderately confident in the effect estimate: the true effect is likely to be close to the estimate of effect, but there is a possibility that it is substantially different. Low certainty: our confidence in the effect estimate is limited: the true effect may be substantially different from the estimate of the effect. Very low certainty: we have very little confidence in the effect estimate: the true effect is likely to be substantially different from the estimate of effect. | ||||||
| aEither dexamethasone or methylprednisolone was used in all treatment regimens. bDowngraded once for serious imprecision because 95% CIs cross unity. cDowngraded once for serious study limitations due to high risk of bias. dDowngraded once for serious imprecision due to wide confidence intervals. | ||||||
| Safety | ||||||
|---|---|---|---|---|---|---|
| Antiemetics for adults for prevention of nausea and vomiting caused by highly emetogenic chemotherapy | ||||||
| Patient or population: adult cancer patients at risk for CINV caused by highly emetogenic chemotherapy Settings: inpatient and outpatient care Intervention: neurokinin‐1 (NK₁) receptor antagonist and 5‐hydroxytryptamine‐3 (5‐HT₃) receptor antagonists + corticosteroid Comparison: aprepitant (NK₁) combined with granisetron (5‐HT₃) + corticosteroid Outcome: serious adverse events RR < 1 indicates an advantage for the intervention Combinations of these interventions at any dose and by any route as mentioned above have been compared to one another in a full network | ||||||
| Interventions (corticosteroids included in all regimens)a | Illustrative comparative risks* (95% CI) | Risk ratio | No. of participants | Certainty of the evidence | Comments | |
| Assumed risk with aprepitant + granisetron | Corresponding risk with the intervention | |||||
| aprepitant + ondansetron | 35 of 1000 | 8 of 1000 (1 to 40) | RR 0.22 | 16,065 (23) | ⊕⊝⊝⊝ very lowb,c,d | Evidence is very uncertain about the effect of aprepitant + ondansetron on risk of serious adverse events when compared to aprepitant + granisetron |
| fosaprepitant + ondansetron | 35 of 1000 | 8 of 1000 (2 to 37) | RR 0.23 | 16,065 (23) | ⊕⊕⊝⊝ lowb,c | Fosaprepitant + ondansetron may decrease the risk of serious adverse events slightly when compared to aprepitant + granisetron |
| casopitant + ondansetron | 35 of 1000 | 8 of 1000 (1 to 49) | RR 0.24 | 16,065 (23) | ⊕⊕⊝⊝ lowb,c | Casopitant + ondansetron may decrease the risk of serious adverse events slightly when compared to aprepitant + granisetron |
| netupitant + palonosetron | 35 of 1000 | 9 of 1000 (2 to 55) | RR 0.27 | 16,065 (23) | ⊕⊕⊝⊝ lowb,c | Netupitant + palonosetron may decrease the risk of serious adverse events slightly when compared to aprepitant + granisetron |
| aprepitant + ramosetron | 35 of 1000 | 11 of 1000 (2 to 67) | RR 0.31 | 16,065 (23) | ⊕⊝⊝⊝ very lowb,c,d | Evidence is very uncertain about the effect of aprepitant plus ramosetron on risk of serious adverse events when compared to aprepitant + granisetron |
| fosaprepitant + palonosetron | 35 of 1000 | 12 of 1000 (1 to 103) | RR 0.35 | 16,065 (23) | ⊕⊝⊝⊝ very lowb,e | Evidence is very uncertain about the effect of fosaprepitant + palonosetron on risk of serious adverse events when compared to aprepitant + granisetron |
| fosnetupitant + palonosetron | 35 of 1000 | 13 of 1000 (2 to 76) | RR 0.36 | 16,065 (23) | ⊕⊝⊝⊝ very lowb,e | Evidence is very uncertain about the effect of fosnetupitant + palonosetron on risk of serious adverse events when compared to aprepitant + granisetron |
| fosaprepitant + granisetron | 35 of 1000 | 13 of 1000 (3 to 53) | RR 0.37 | 16,065 (23) | ⊕⊕⊝⊝ lowb,c | Fosaprepitant + granisetron may decrease the risk of serious adverse events slightly when compared to aprepitant + granisetron |
| aprepitant + palonosetron | 35 of 1000 | 17 of 1000 (2 to 167) | RR 0.48 | 16,065 (23) | ⊕⊝⊝⊝ very lowb,d,e | Evidence is very uncertain about the effect of aprepitant + palonosetron on risk of serious adverse events when compared to aprepitant + granisetron |
| rolapitant + granisetron | 35 of 1000 | 20 of 1000 (7 to 60) | RR 0.57 | 16,065 (23) | ⊕⊕⊝⊝ lowb,c | Rolapitant + granisetron may decrease the risk of serious adverse events slightly when compared to aprepitant + granisetron |
| *Basis for the assumed risk is actual event rates reported for the main comparator summed across studies: 20 of 573 (3.5%) participants treated with aprepitant + granisetron experienced at least 1 SAE (aprepitant + granisetron was used in 2 studies reporting the outcome, with follow‐up of up to 29 days). The corresponding risk (and its 95% confidence interval) is based on the assumed risk in the comparison group and the risk ratio of the intervention (and its 95% CI). | ||||||
| GRADE Working Group grades of evidence. Moderate certainty: we are moderately confident in the effect estimate: the true effect is likely to be close to the estimate of effect, but there is a possibility that it is substantially different. Low certainty: our confidence in the effect estimate is limited: the true effect may be substantially different from the estimate of the effect. Very low certainty: we have very little confidence in the effect estimate: the true effect is likely to be substantially different from the estimate of effect. | ||||||
| aEither dexamethasone or methylprednisolone was used in all treatment regimens. bDowngraded once for moderate inconsistency. cDowngraded once for serious imprecision because 95% CIs cross unity and confidence intervals are wide. dDowngraded once for serious study limitations due to high risk of bias. eDowngraded twice for very serious imprecision because 95% CIs cross unity and confidence intervals are very wide, suggesting high possibility of harm. | ||||||
| Efficacy | ||||||
|---|---|---|---|---|---|---|
| Antiemetics for adults for prevention of nausea and vomiting caused by moderately emetogenic chemotherapy | ||||||
| Patient or population: adult cancer patients at risk for CINV caused by moderately emetogenic chemotherapy Settings: inpatient and outpatient care Intervention
Comparison: granisetron (5‐HT₃) + corticosteroid Outcome: complete control of vomiting during the overall phase (0 to 120 h of treatment with chemotherapy) RR < 1 indicates an advantage for the intervention Combinations of these interventions at any dose and by any route as mentioned above have been compared to one another in a full network | ||||||
| Interventions (corticosteroids included in all regimens)a | Illustrative comparative risks* (95% CI) | Risk ratio | No. of participants | Certainty of the evidence | Comments | |
| Assumed risk with granisetron | Corresponding risk with the intervention | |||||
| aprepitant + palonosetron | 555 of 1000 | 716 of 1000 (555 to 921) | RR 1.29 | 7800 (22) | ⊕⊕⊝⊝ lowb,c | Aprepitant + palonosetron may increase complete response in the overall phase when compared to granisetron |
| netupitant + palonosetron | 555 of 1000 | 694 of 1000 (510 to 944) | RR 1.25 | 7800 (22) | ⊕⊕⊝⊝ lowb,d | Netupitant + palonosetron may increase complete response in the overall phase when compared to granisetron |
| rolapitant + granisetron | 555 of 1000 | 660 of 1000 (588 to 738) | RR 1.19 | 7800 (22) | ⊕⊕⊕⊕ high | Rolapitant + granisetron results in an increase in complete response in the overall phase when compared to granisetron |
| palonosetron | 555 of 1000 | 588 of 1000 (472 to 733) | RR 1.06 | 7800 (22) | ⊕⊕⊝⊝ lowb,d | Palonosetron may or may not increase complete response in the overall phase when compared to granisetron |
| aprepitant + granisetron | 555 of 1000 | 577 of 1000 (483 to 694) | RR 1.06 | 7800 (22) | ⊕⊕⊝⊝ lowb,d | Aprepitant + palonosetron may or may not increase complete response in the overall phase when compared to granisetron |
| azasetron | 555 of 1000 | 561 of 1000 (422 to 738) | RR 1.01 | 7800 (22) | ⊕⊕⊝⊝ lowb,e | Azasetron may result in little to no difference in complete response in the overall phase when compared to granisetron |
| fosaprepitant + ondansetron | 555 of 1000 | 500 of 1000 (366 to 677) | RR 0.90 | 7800 (22) | ⊕⊕⊝⊝ lowb,d | Fosaprepitant + ondansetron may decrease complete response in the overall phase when compared to granisetron |
| aprepitant + ondansetron | 555 of 1000 | 477 of 1000 (355 to 649) | RR 0.86 | 7800 (22) | ⊕⊕⊝⊝ lowb,d | Aprepitant + ondansetron may decrease complete response in the overall phase when compared to granisetron |
| casopitant + ondansetron | 555 of 1000 | 461 of 1000 (344 to 622) | RR 0.83 (0.62 to 1.12) | 7800 (22) | ⊕⊕⊝⊝ lowb,d | Casopitant + ondansetron may decrease complete response in the overall phase when compared to granisetron |
| ondansetron | 555 of 1000 | 433 of 1000 (327 to 577) | RR 0.78 | 7800 (22) | ⊕⊕⊝⊝ lowb,d | Ondansetron may decrease complete response in the overall phase when compared to granisetron |
| *Basis for the assumed risk is actual event rates reported for the main comparator summed across studies: 623 of 1123 (55.5%) participants treated with granisetron achieved complete response during the overall phase (granisetron was used in 5 studies reporting the outcome). The corresponding risk (and its 95% confidence interval) is based on the assumed risk in the comparison group and the risk ratio of the intervention (and its 95% CI). | ||||||
| GRADE Working Group grades of evidence. Moderate certainty: we are moderately confident in the effect estimate: the true effect is likely to be close to the estimate of effect, but there is a possibility that it is substantially different. Low certainty: our confidence in the effect estimate is limited: the true effect may be substantially different from the estimate of the effect. Very low certainty: we have very little confidence in the effect estimate: the true effect is likely to be substantially different from the estimate of effect. | ||||||
| aEither dexamethasone or methylprednisolone was used in all treatment regimens. bDowngraded once for serious study limitations due to high risk of bias. cDowngraded once for serious imprecision because 95% CIs included zero effect line. dDowngraded once for serious imprecision because 95% CIs cross unity. eDowngraded once for serious imprecision due to wide confidence intervals. | ||||||
| Safety | ||||||
|---|---|---|---|---|---|---|
| Antiemetics for adults for prevention of nausea and vomiting caused by moderately emetogenic chemotherapy | ||||||
| Patient or population: adult cancer patients at risk for CINV caused by moderately emetogenic chemotherapy Settings: inpatient and outpatient care Intervention
Comparison: granisetron (5‐HT₃) + corticosteroid Outcome: serious adverse events RR < 1 indicates an advantage for the intervention Combinations of these interventions at any dose and by any route as mentioned above have been compared to one another in a full network | ||||||
| Interventions (corticosteroids included in all regimens)a | Illustrative comparative risks* (95% CI) | Risk ratio | No. of participants | Quality of the evidence | Comments | |
| Assumed risk with granisetron | Corresponding risk with the intervention | |||||
| rolapitant + granisetron | 153 of 1000 | 176 of 1000 (135 to 230) | RR 1.15 | 1344 (1) | ⊕⊕⊝⊝ lowb | Rolapitant + granisetron may increase the risk of serious adverse events slightly when compared to granisetron |
| *Basis for the assumed risk is actual event rates reported for the main comparator summed across studies: 103 of 674 (10.3%) participants treated with granisetron experienced at least 1 SAE (granisetron was used in 1 study reporting the outcome; time frame for reporting safety data was not described). The corresponding risk (and its 95% confidence interval) is based on the assumed risk in the comparison group and the risk ratio of the intervention (and its 95% CI). | ||||||
| GRADE Working Group grades of evidence. Moderate certainty: we are moderately confident in the effect estimate: the true effect is likely to be close to the estimate of effect, but there is a possibility that it is substantially different. Low certainty: our confidence in the effect estimate is limited: the true effect may be substantially different from the estimate of the effect. Very low certainty: we have very little confidence in the effect estimate: the true effect is likely to be substantially different from the estimate of effect. | ||||||
| aEither dexamethasone or methylprednisolone was used in all treatment regimens. bDowngraded twice for very serious imprecision because 95% CIs cross unity, confidence intervals are wide, and information size is small. | ||||||
Background
Description of the condition
Many cancer patients, both with solid tumours and with haematological malignancies, suffer from chemotherapy‐induced nausea and vomiting (CINV), which is an important contributor to morbidity, poor performance status, and decreased quality of life (Feyer 2011; Jordan 2015). The reported age‐adjusted incidence rate of cancer in the USA in 2010 was 464.6 per 100,000, and the mortality rate was 199.8 per 100,000 persons per year (Howlader 2013). Without appropriate antiemetic therapy, 70% to 80% of cancer patients receiving chemotherapy develop CINV (Feyer 2011). This condition is classified into five categories, depending on the start of CINV in relation to the start of chemotherapy and patients’ negative previous experiences (Navari 2016; Tageja 2016).
-
Acute: nausea and vomiting occurring within the first 24 hours of treatment with chemotherapy, with maximal intensity after five to six hours; activated through a peripheral pathway in which 5‐hydroxytryptamine‐3 (5‐HT₃) receptor activation plays a role.
-
Delayed: nausea and vomiting occurring from 24 hours to 120 hours of treatment with chemotherapy, with peaks of intensity between 48 and 72 hours; activated through a central pathway in which neurokinin‐1 (NK₁) receptor activation is involved.
-
Breakthrough: nausea and vomiting occurring although appropriate prophylaxis has been administered.
-
Anticipatory: conditioned response to the occurrence of CINV in previous chemotherapy cycles resulting in nausea and vomiting.
-
Refractory: nausea and vomiting recurring in subsequent cycles of chemotherapy, excluding anticipatory CINV.
In this review, we will focus on prevention of acute and delayed CINV.
Several prognostic factors such as younger age, female sex, previous hyperemesis gravidarum or history of vomiting in pregnancy, and motion sickness have been found to increase the likelihood of CINV (Di Mattei 2016; Dranitsaris 2017; Furukawa 2014; Hu 2016; Warr 2014); regular alcohol consumption has been found to reduce the risk of CINV (Hesketh 2010; Hu 2016).
CINV remains one of the most distressing symptoms associated with cancer therapy and can lead to dehydration, electrolyte imbalances, malnutrition, and metabolic disturbances (Viale 2012). Moreover, CINV is associated with decreased adherence to chemotherapy, which could lead to a decreased response resulting in increased risk of death among cancer patients (Wozniak 1998). Therefore, preventing CINV is an important goal for cancer patients.
According to the Multinational Association of Supportive Care in Cancer (MASCC)/European Society of Medical Oncology (ESMO) and the American Society of Clinical Oncology (ASCO), practice focuses on the emetogenicity of chemotherapeutic agents (minimal, low, moderate, high) and the relative doses of antineoplastic agents used (Basch 2012; Jordan 2017; Roila 2016).
Highly emetogenic chemotherapy includes the following agents or combinations of agents (Basch 2012).
-
Anthracycline/cyclophosphamide combination.
-
Carmustine.
-
Cisplatin.
-
Cyclophosphamide ≥ 1500 mg/m².
-
Dacarbazine.
-
Hexamethylmelamine.
-
Mechlorethamine.
-
Procarbazine.
-
Streptozocin.
Moderately emetogenic chemotherapy includes the following agents (Basch 2012).
-
Alemtuzumab.
-
Azacitidine.
-
Bendamustine.
-
Bosutinib.
-
Carboplatin.
-
Ceritinib.
-
Clofarabine.
-
Crizotinib.
-
Cyclophosphamide 1000 mg/m².
-
Daunorubicin.
-
Doxorubicin.
-
Epirubicin.
-
Idarubicin.
-
Ifosfamide.
-
Imatinib.
-
Irinotecan.
-
Oxaliplatin.
-
Romidepsin.
-
Temozolomide.
-
Thiotepa.
-
Trabectedin.
-
Vinorelbine.
According to the latest MASCC/ESMO guidelines, carboplatin has higher emetogenic potential compared to the other moderately emetogenic agents; patients receiving this drug should receive the same prophylaxis as described for patients with highly emetogenic potential (Jordan 2017; Roila 2016).
With appropriate antiemetic prophylaxis, acute CINV and delayed CINV are clinically significantly reduced. In a recent systematic review, Yuan and colleagues found that the complete response rate of patients receiving an NK₁ receptor antagonist was significantly higher compared to that seen in patients given various control regimens (like 5‐HT₃ receptor antagonists + dexamethasone), with complete response in the acute phase of 85.1% versus 79.6% and complete response in the delayed phase of 71.4% versus 58.2%. According to review authors, the safety profile of NK₁ receptor antagonists was comparable to that of other regimens, with less insomnia but more diarrhoea and hiccups (Yuan 2016).
Description of the intervention
Options for prevention of CINV are 5‐HT₃ receptor antagonists (e.g. ondansetron, granisetron, palonosetron) in combination with corticosteroids (e.g. dexamethasone), or additionally combined with NK₁ receptor antagonists (e.g. aprepitant, fosaprepitant, netupitant, rolapitant). Although antiemetic therapy is common among cancer patients at risk for CINV, recommendations provided in current guidelines are inconsistent. According to ASCO, practice focuses on the emetogenicity of chemotherapeutic agents (minimal, low, moderate, high) and the relative dose of antineoplastic agents used. This guideline recommends 5‐HT₃ receptor antagonists plus dexamethasone for patients administered moderately emetogenic chemotherapy (Basch 2012). The latest update of this guideline for patients receiving highly emetogenic chemotherapy (including anthracycline + cyclophosphamide) recommends a combination of an NK₁ receptor antagonist, a 5‐HT₃ receptor antagonist, and dexamethasone. The oral combination of palonosetron, netupitant, and dexamethasone is one of the specific treatments recommended for these patients (Hesketh 2016). The recommendation in the moderately emetogenic setting is less clear. In the latest MASCC/ESMO guideline report, it was acknowledged that carboplatin‐based chemotherapy might have higher risk of nausea and vomiting compared to other drugs in the category moderately emetogenic chemotherapy (Roila 2016). The MASCC/ESMO guideline recommends the same three‐drug combination as the ASCO guideline for patients receiving highly emetogenic chemotherapy (including anthracycline plus cyclophosphamide) but points out that no published comparative studies have identified differences in efficacy and toxicity between available NK₁ receptor antagonists to recommend one specific drug over another (Roila 2016). In the so called other moderate emetogenic risk group, a 5‐HT₃ receptor antagonist + dexamethasone is still standard of care, although National Comprehensive Cancer Network (NCCN) guidelines broaden the indication for an NK₁ receptor antagonist in this risk category (Ettinger 2017).
Another option for prevention and treatment of CINV‐ or radiotherapy‐induced nausea and vomiting is olanzapine. However, evidence for efficacy and safety of this drug is not yet clear and is being evaluated in a Cochrane Review (Cochrane protocol already published: Sutherland 2017).
How the intervention might work
For 5‐HT₃ receptor antagonists and dexamethasone, solely or in combination with NK₁ receptor antagonists, systematic reviews and meta‐analyses have shown that they improve CINV in cancer patients administered especially highly emetogenic chemotherapy including anthracycline‐cyclophosphamide‐based chemotherapy, with inconclusive evidence on effectiveness and rates of adverse events for one drug compared to another (Celio 2013; dos Santos 2013; Hocking 2014; Jin 2012; Jordan 2016b; Lee 2013; Popovic 2014).
As the central nervous system, the neurotransmitter, and their receptors play a critical role in CINV, both 5‐HT₃ receptor antagonists and NK₁ receptor antagonists inhibit processing of antiemetic signals from the gut to the central nervous system (Janelsins 2013). Both drugs are usually combined with dexamethasone to improve efficacy. A pilot randomised controlled trial (RCT) including 31 patients receiving cisplatin chemotherapy has shown first improved efficacy of ondansetron when combined with dexamethasone and a good safety profile (Smith 1991). Another RCT conducted between 1992 and 1994 for patients receiving moderately emetogenic chemotherapy has shown highest efficacy in terms of complete protection of vomiting and nausea and less delayed vomiting and nausea with the combination of granisetron and dexamethasone compared to granisetron or dexamethasone. No severe adverse events were reported, but constipation and hot flushes were more often found in the granisetron + dexamethasone arm compared to single‐drug arms (Italian Group for Antiemetic Research 1995). Granisetron + dexamethasone has also shown improved efficacy compared to both single drugs only among patients receiving cisplatin chemotherapy (Heron 1994). Thereafter, a 5‐HT₃ receptor antagonist combined with dexamethasone became standard prophylaxis for preventing CINV (Gralla 1999).
As NK₁ receptor antagonists inhibit another receptor in the emetic signal activation, they are combined with 5‐HT₃ receptor antagonists and dexamethasone for patients receiving cisplatin or other highly emetogenic chemotherapeutic agents (Hesketh 2003; Poli‐Bigelli 2003).
Why it is important to do this review
As mentioned above, the decision‐making process for prevention of CINV is usually confusing for patients and physicians, as there are no clear recommendations in international guidelines for a consistent approach to the use of antiemetic agents (Hesketh 2016; Roila 2016). Economic arguments are introduced in discussions on the best strategy, as direct and indirect costs differ enormously for various treatment options, and this could lead to increased healthcare costs (Avritscher 2010; Humphreys 2013). In addition, direct head‐to‐head comparisons of prophylactic options are too sparse to favour one drug or a combined drug regimen over another.
The aim of our systematic review and network analysis is to provide a comprehensive overview on the benefits and harms of antiemetic agents for CINV. By systematically identifying all relevant RCTs conducted to date and critically reviewing their reliability and validity while considering similar trials in the network analysis, we will overcome statistical limitations of individual studies. The network meta‐analysis will allow a hierarchy of therapeutic options, in particular, if the benefits of one option compared to another will translate into a clinically important difference. This comprehensive overview is necessary for clinical decision‐making, and it has the potential to have a great impact on international guidelines and clinical pathways. Moreover, it may contribute to high‐grade decision support for effective therapeutic strategies for the individual person.
The results of this network meta‐analysis will be published in the Cochrane Library and presented at national and international expert meetings and conferences (e.g. American Society of Clinical Oncology, Multinational Association of Supportive Care in Cancer). Results of the network analysis have the potential to influence the design of new RCTs for antiemetic agents. As we have evaluated patient‐related outcomes, a direct impact on patient care and treatment might be expected.
Objectives
-
In adults with solid cancer or haematological malignancy receiving highly emetogenic chemotherapy
-
To compare the effects of antiemetic treatment combinations including NK₁ receptor antagonists, 5‐HT₃ receptor antagonists, and corticosteroids on prevention of acute phase (Day 1), delayed phase (Days 2 to 5), and overall (Days 1 to 5) chemotherapy‐induced nausea and vomiting in network meta‐analysis
-
To generate a clinically meaningful treatment ranking according to treatment safety and efficacy
-
-
In adults with solid cancer or haematological malignancy receiving moderately emetogenic chemotherapy
-
To compare whether antiemetic treatment combinations including NK₁ receptor antagonists, 5‐HT₃ receptor antagonists, and corticosteroids are superior for prevention of acute phase (Day 1), delayed phase (Days 2 to 5), and overall (Days 1 to 5) chemotherapy‐induced nausea and vomiting to treatment combinations including 5‐HT₃ receptor antagonists and corticosteroids solely, in network meta‐analysis
-
To generate a clinically meaningful treatment ranking according to treatment safety and efficacy
-
Methods
Criteria for considering studies for this review
Types of studies
The protocol for this review was previously published in the Cochrane Library (Skoetz 2017). Any differences to the protocol are described in Differences between protocol and review.
We included studies if they were randomised controlled trials (RCTs), which are best designed to minimise bias when evaluating the effectiveness of an intervention. We required full journal publication, with the exception of online clinical trial results and summaries of otherwise unpublished clinical trials and abstracts with sufficient data for analysis. We considered only results from the first cycle, regardless of potential cross‐over. We included blinded and non‐blinded studies, and we addressed the potential impact of blinding in our bias assessment and sensitivity analyses. We applied no limitations with respect to length of follow‐up. However, we considered only results from the first cycle.
We excluded studies that were cluster‐randomised or non‐randomised, as well as case reports and clinical observations.
Types of participants
Studies included trials involving adult patients according to the definition provided in the studies (usually ≧ 18 years of age), with a confirmed diagnosis of cancer, irrespective of type and stage of cancer and gender. We included both patients with solid cancer and patients with haematological malignancies. We included trials that included patients receiving highly emetogenic chemotherapy (HEC) or moderately emetogenic chemotherapy (MEC) according to the latest Antineoplastic Agents Emetic Risk Classification (Jordan 2017; Roila 2016). As this classification has changed over the years (e.g. anthracycline and cyclophosphamide combination is nowadays classified as HEC instead of MEC), we used this classification to assess the emetogenic risk of one specific chemotherapeutic agent, irrespective of the emetogenic risk applied by study authors (see section Description of the condition). We performed separate analyses for populations receiving HEC and MEC, according to the definition provided by Multinational Association of Supportive Care in Cancer (MASCC)/European Society of Medical Oncology (ESMO) (Jordan 2017; Roila 2016). We assumed that patients who fulfil the inclusion criteria were equally eligible to be randomised to any of the interventions that we had planned to compare.
We excluded trials including participants not receiving emetogenic chemotherapies at the same level of risk, which did not provide subgroup data for each emetogenic risk group. We excluded trials evaluating participants at risk for radiotherapy‐induced nausea and vomiting. We excluded trials evaluating participants at risk of vomiting and nausea due to underlying disease.
Types of interventions
At the time this review was produced, recommended antiemetics for prophylaxis of chemotherapy‐induced nausea and vomiting (CINV) caused by highly emetogenic chemotherapy (HEC) or moderately emetogenic chemotherapy (MEC) included the following drug combinations.
-
5‐Hydroxytryptamine‐3 (5‐HT₃) receptor antagonists and corticosteroids.
-
Neurokinin‐1 (NK₁) receptor antagonists, 5‐hydroxytryptamine‐3 (5‐HT₃) receptor antagonists, and corticosteroids.
We compared combinations of these interventions at any dose and by any route versus each other in a full network. We included all RCTs comparing in at least two study arms the intervention of interest ‐ either 5‐hydroxytryptamine‐3 (5‐HT₃) receptor antagonists + corticosteroids, or neurokinin‐1 (NK₁) receptor antagonists in combination with 5‐hydroxytryptamine‐3 (5‐HT₃) receptor antagonists + corticosteroids.
We included only trials that included patients on corticosteroids in both arms.
We analysed prophylaxis for cancer patients administered HEC or MEC separately. We assumed that any participant who met the inclusion criteria was, in principle, equally likely to be randomised to any of the eligible interventions. We grouped interventions by evaluating different drug doses together as one drug of interest, according to the product characteristics.
We excluded trials evaluating solely treatment of nausea and vomiting, meaning that the drug is not given before chemotherapeutic agents are administered to prevent CINV but rather once nausea or vomiting appears. Antiemetic agents to treat CINV might be the same agents used for prevention of CINV, but to include clinically homogenous trials to answer the research question, we focused on prophylaxis only.
Comparisons of direct interest
As mentioned above, current guidelines are highly uncertain about whether to recommend a doublea or tripleb drug combination for cancer patients receiving MEC, and which triple regimen should be administered to cancer patients receiving HEC (Basch 2012; Hesketh 2016; Roila 2016). Therefore the following comparisons are of direct interest.
aDouble drug combination: treatments including a 5‐HT₃ receptor antagonist and corticosteroids.
bTriple drug combination: treatments including an NK₁ receptor antagonist, a 5‐HT₃ receptor antagonist, and corticosteroids.
Comparisons in cancer patients receiving highly emetogenic chemotherapy (HEC)
-
NK₁ receptor antagonist + 5‐HT₃ receptor antagonist + corticosteroid versus other specific combinations of these drug classes + corticosteroid
We additionally included the following comparisons to strengthen the network.
-
NK₁ receptor antagonist + 5‐HT₃ receptor antagonist + corticosteroid versus 5‐HT₃ receptor antagonist + corticosteroid.
-
5‐HT₃ receptor antagonist + corticosteroid versus other specific combinations of this drug class + corticosteroid.
An overview of all included treatment regimens is provided in Table 1.
| Drug combinations | Treatment regimena | Abbreviation | Used in HECb setting | Used in MECc setting |
|---|---|---|---|---|
| NK₁ receptor antagonists and 5‐HT₃ receptor antagonists + corticosteroid | aprepitant with granisetron | apre_grani | X | X |
| aprepitant with ondansetron | apre_ondan | X | X | |
| aprepitant with palonosetron | apre_palo | X | X | |
| aprepitant with ramosetron | apre_ramo | X |
| |
| aprepitant with tropisetron | apre_tropi | X |
| |
| casopitant with ondansetron | caso_ondan | X | X | |
| fosaprepitant with granisetron | fosa_grani | X | X | |
| ezlopitant with granisetron | ezlo_grani | X |
| |
| fosaprepitant with ondansetron | fosa_ondan | X | X | |
| fosaprepitant with palonosetron | fosa_palo | X |
| |
| fosnetupitant with palonosetron | fosnetu_palo | X |
| |
| netupitant with palonosetron | netu_palo | X | X | |
| rolapitant with granisetron | rola_grani | X | X | |
| rolapitant with ondansetron | rola_ondan | X |
| |
| 5‐HT₃ receptor antagonists+ corticosteroid | azasetron | aza | X | X |
| dolasetron | dola |
| X | |
| granisetron | grani | X | X | |
| ondansetron | ondan | X | X | |
| palonosetron | palo | X | X | |
| ramosetron | ramo | X | X | |
| tropisetron | tropi | X | X |
aAll treatment regimens also include a corticosteroid.
bHighly emetogenic chemotherapy.
cModerately emetogenic chemotherapy.
Comparisons in cancer patients receiving moderately emetogenic chemotherapy (MEC)
-
NK₁ receptor antagonist + 5‐HT₃ receptor antagonist + corticosteroid versus other specific drug combinations of this drug class + corticosteroid
-
NK₁ receptor antagonist + 5‐HT₃ receptor antagonist + corticosteroid versus 5‐HT₃ receptor antagonist + corticosteroid
-
5‐HT₃ receptor antagonist + corticosteroid versus other specific combinations of this drug class + corticosteroid
An overview of all included treatment regimens is provided in Table 1.
We evaluated different intervention doses and different routes of administration together, and we had planned to assess differences in subgroup analyses. However, we were not able to perform these subgroup analyses because networks were not connected when doses and routes were considered separately.
Additional interventions to supplement the analysis
In the HEC setting, we also included trials analysing the following comparisons in addition to the direct comparisons of interest, to increase the amount of available (indirect) information included in the analysis (Ades 2013; Chaimani 2017).
-
NK₁ receptor antagonist + 5‐HT₃ receptor antagonist + corticosteroid versus 5‐HT₃ receptor antagonist + corticosteroid.
-
5‐HT₃ receptor antagonist + corticosteroid versus other specific combinations of this drug class + corticosteroid.
Included trials should have been comparable in terms of clinical and methodological criteria to hold for transitivity (Chaimani 2017). Therefore, we excluded trials evaluating in only one arm an intervention of interest but in the control arm different drug classes (e.g. metoclopramide). We excluded these trials, as they evaluated drugs that are no longer recommended for primary prophylaxis of CINV in moderately and highly emetogenic chemotherapy. As these trials might be outdated, the assumption that any participant who met the inclusion criteria was, in principle, equally likely to be randomised to any of the eligible interventions has not been sustained. The efficacy and safety of cannabinoids were evaluated in the Cochrane Review by Smith and colleagues (Smith 2015); cannabinoids are not evaluated in this review.
Types of outcome measures
We included all trials fitting the inclusion criteria mentioned above, irrespective of reported outcomes. We estimated the relative ranking of competing interventions according to each of the following outcomes.
Efficacy
-
Complete control of nausea (no nausea and no significant nausea, as defined on a study levela), determined from reports in participant diaries; in the Results section, we refer to this outcome as "no nausea"
-
in the acute phase (first 24 hours of treatment with chemotherapy)
-
in the delayed phase (after 24 to 120 hours of treatment with chemotherapy)
-
overall (after 0 to 120 hours of treatment with chemotherapy)
-
-
Complete control of vomiting (no vomiting and no use of rescue medications), determined from reports in participant diaries; this outcome was usually referred to as "complete response" in the studies; we also refer to it in the Results section as "complete response"
-
in the acute phase (first 24 hours of treatment with chemotherapy)
-
in the delayed phase (after 24 to 120 hours of treatment with chemotherapy)
-
overall (after 0 to 120 hours of treatment with chemotherapy)
-
Quality of life
-
No impairment of quality of life, up to longest follow‐up available, if measured by validated instruments
-
Functional Living Index–Emesis (FLIE) (Lindley 1992)
-
Modified Functional Living Index–Emesis (M‐FLIE) (Martin 2003; Martin 2003a)
-
Safety
-
On‐study mortality (deaths occurring from randomisation up to 30 days)
-
Adverse events
-
Serious adverse events
-
Neutropenia
-
Febrile neutropenia
-
Infections
-
Local reactions at infusion site
-
Hiccups
For outcome measurement of any adverse events, we used the longest follow‐up available.
As there are different underlying mechanisms for anticipatory CINV, which do not respond to prophylactic antiemetics, we did not evaluate this outcome.
An overview of all outcomes and prioritisation of outcomes are provided in Table 2.
| Outcome | Definition | Unit of outcome measurement | Referred to as/abbreviation | Prioritisation |
|---|---|---|---|---|
| Complete control of nausea | No nausea and no significant nausea, as defined on a study levela Assessed for:
| Binary; participants with complete control of nausea | No nausea | Overall phase prioritised for GRADE assessment |
| Complete control of vomiting | No vomiting and no use of rescue medications Assessed for:
| Binary; participants with complete control of vomiting | Complete response (CR) | Delayed and overall phases prioritised for GRADE assessment Overall phase chosen as most important efficacy outcome |
| Quality of life | No impairment in quality of life during active study period | Binary; participants with no impairment in quality of life | QoL | Prioritised for GRADE assessment |
| On‐study mortality | Deaths occurring from randomisation up to 30 days after the active study period | Binary; participants who died | OSM | Prioritised for GRADE assessment |
| Adverse events | As defined on a study level; during active study period | Binary; participants with at least 1 event | AEs | ‐ |
| Serious adverse events | As defined on a study level; during active study period | Binary; participants with at least 1 event | SAEs | Prioritised for GRADE assessment Chosen as most crucial safety outcome |
| Neutropenia | As defined on a study level; during active study period | Binary; participants with at least 1 event | ‐ | ‐ |
| Febrile neutropenia | As defined on a study level; during active study period | Binary; participants with at least 1 event | ‐ | ‐ |
| Infection | As defined on a study level; during active study period | Binary; participants with at least 1 event | ‐ | ‐ |
| Local reaction at infusion site | As defined on a study level; during active study period | Binary; participants with at least 1 event | ‐ | Prioritised for GRADE assessment |
| Hiccup | As defined on a study level; during active study period | Binary; participants with at least 1 event | ‐ | ‐ |
aStandardised tools are typically used to assess degree of nausea and vomiting (Wood 2011). No nausea and no significant nausea were defined on a study level and typically refer to pre‐defined cutoffs, e.g. in Rapoport 2015 (a) or Schwartzberg 2015, nausea was assessed on a visual analogue scale (VAS; 0 to 100 mm; 0 = no nausea, 100 = severe nausea; < 5 mm = no nausea, < 25 mm = no significant nausea). No significant nausea is typically more subjective because of the wider range on the scale and is therefore less objective, especially in an open‐label study design. To increase comparability of studies and minimise biased results, we were therefore interested in patients with no nausea.
aStandardised tools are typically used to assess degree of nausea and vomiting (Wood 2011). No nausea and no significant nausea were defined on a study level and typically referred to pre‐defined cutoffs (e.g. in Rapoport 2015 (a) or Schwartzberg 2015, nausea was assessed on a visual analogue scale (VAS; 0 to 100 mm; 0 = no nausea, 100 = severe nausea) as < 5 mm for no nausea and < 25 mm for no significant nausea). No significant nausea is typically more subjective because of the wider range on the scale and therefore is less objective, especially with an open‐label study design. To increase comparability of studies and to minimise biased results, we were interested in patients with no nausea.
Search methods for identification of studies
Electronic searches
We searched the following databases without language restrictions. As all intervention arms had to include at least one 5‐hydroxytryptamine‐3 (5‐HT₃) receptor antagonist, which has been mentioned first in 1988 for treatment of chemotherapy‐induced emesis (Carmichael 1988), we restricted our search from 1988 to present. Only trials that compared at least two of the drug combinations mentioned above are eligible. We searched for all possible comparisons formed by interventions of interest.
-
Cochrane Central Register of Controlled Trials (CENTRAL; 2021, Issue 2 of 12), in the Cochrane Library.
-
Embase (Ovid, 1988 to 2 February 2021).
-
MEDLINE (Ovid, 1988 to 2 February 2021).
We used medical subject headings (MeSH) or equivalent and text word terms. We did not apply any language restrictions, and we tailored searches to individual databases. The search strategies used can be found in Appendix 1.
Adverse effects
We did not perform a separate search for adverse effects of target interventions. We considered adverse effects only as described in included studies.
Searching other resources
In addition, we searched the following databases/sources.
-
Conference proceedings of annual meetings of the following societies if they were not included in CENTRAL (1988 to 2 February 2021).
-
American Society of Clinical Oncology (ASCO).
-
European Society of Medical Oncology (ESMO).
-
Multinational Association of Supportive Care in Cancer (MASCC).
-
-
Databases of ongoing trials.
-
clinicaltrials.gov (www.clinicaltrials.gov).
-
World Health Organization (WHO) International Clinical Trials Registry Platform (ICTRP) (http://apps.who.int/trialsearch/).
-
Reference lists of reviews and retrieved articles for additional studies (we also performed citation searches on key articles).
We contacted experts in the field for unpublished and ongoing trials. We contacted study authors for additional information when necessary.
Data collection and analysis
Selection of studies
Two review authors independently screened results of the search strategies for eligibility for this review by reading the abstracts using Covidence software (Covidence systematic review software). We coded the abstracts as either 'retrieve' or 'do not retrieve'. In the case of disagreement, or if it was unclear whether we should have retrieved the abstract or not, we obtained the full‐text publication for further discussion. Independent review authors excluded records that clearly did not meet the inclusion criteria and obtained full‐text copies of the remaining records. Two review authors assessed these records independently against our pre‐defined eligibility criteria to identify relevant studies. In the event of disagreement, we adjudicated a third review author. We did not anonymise the studies before assessment. We included a Preferred Reporting Items for Systematic Reviews and Meta‐Analyses (PRISMA) flow chart in the full review, which shows the status of identified studies (Figure 1; Moher 2009), as recommended in Part 2, Section 11.2.1 of the Cochrane Handbook for Systematic Reviews of Interventions (Higgins 2011; Schünemann 2011). We included studies in the review irrespective of whether measured outcome data were reported in a ‘usable’ way.

Study flow diagram.
Data extraction and management
Two review authors extracted data using a standardised data extraction form developed in Covidence (Covidence systematic review software). If these authors were unable to reach a consensus, we consulted a third review author for final decision. If required, we contacted the authors of specific studies for supplementary information (Higgins 2011a). After agreement had been reached, we entered data into Review Manager (RevMan 2014). We extracted the following information.
-
General information: author, title, source, publication date, country, language, duplicate publications.
-
Risk of bias assessment: sequence generation, allocation concealment, blinding (participants, personnel, outcome assessors), incomplete outcome data, selective outcome reporting, other sources (not pre‐specified) of bias.
Moreover, we extracted the following information, which may have acted as effect modifiers.
-
Study characteristics: trial design, aims, setting and dates, source of participants, inclusion/exclusion criteria, comparability of groups, subgroup analysis, statistical methods, power calculations, treatment cross‐overs, compliance with assigned treatment, length of follow‐up, time point of randomisation.
-
Participant characteristics: age, gender, ethnicity, number of participants recruited/allocated/evaluated, participants lost to follow‐up, cancer type and stage, additional diagnoses, type and intensity of antineoplastic therapy, emetogenic risk, other patient‐specific prognostic factors, e.g. pregnancy, motion sickness, alcohol intake.
-
Interventions and comparators: type and dosage of antiemetic agents, duration of prophylaxis, duration of follow‐up.
-
Outcomes: complete control of nausea (acute, delayed, and overall phases), complete control of vomiting (acute, delayed, and overall phases), on‐study mortality, quality of life, adverse events, and serious adverse events. When possible, we extracted data at arm level, not summary effects.
-
Notes: sponsorship/funding for trial and notable conflicts of interest of review authors.
We collated multiple reports of the same study, so that each study rather than each report was the unit of interest in the review. We collected characteristics of the included studies in sufficient detail to populate a table of Characteristics of included studies.
Assessment of risk of bias in included studies
This section was taken from the PaPaS template for protocols and was amended to fit our analysis criteria.
Two review authors independently assessed risk of bias for each study, using the criteria outlined in the Cochrane Handbook for Systematic Reviews of Interventions ‐ Higgins 2011c ‐ and adapted from those used by the Cochrane Pregnancy and Childbirth Group, with disagreements resolved by discussion. We completed a 'Risk of bias' table for each included study using the 'Risk of bias' tool in RevMan (RevMan 2014).
We assessed the following for each study.
-
Random sequence generation (checking for possible selection bias). We assessed the method used to generate the allocation sequence as low risk of bias (any truly random process, e.g. random number table; computer random number generator) or unclear risk of bias (method used to generate sequence not clearly stated). We excluded studies using a non‐random process (e.g. odd or even date of birth; hospital or clinic record number).
-
Allocation concealment (checking for possible selection bias). The method used to conceal allocation to interventions prior to assignment determines whether intervention allocation could have been foreseen in advance of, or during, recruitment, or could have been changed after assignment. We assessed these methods as low risk of bias (e.g. telephone or central randomisation; consecutively numbered sealed opaque envelopes) or unclear risk of bias (method not clearly stated). We excluded studies that did not conceal allocation (e.g. open list).
-
Blinding of participants and personnel (checking for possible performance bias). We assessed the methods used to blind study participants and personnel from knowledge of which intervention a participant received. We assessed methods as low risk of bias (study stated that it was blinded and described the method used to achieve blinding, such as identical tablets matched in appearance or smell, or a double‐dummy technique) or unclear risk of bias (study stated that it was blinded but did not provide an adequate description of how this was achieved). We considered studies that were not double‐blinded to have high risk of bias. We assessed blinding separately for:
-
participants; and
-
personnel.
-
-
Blinding of outcome assessment (checking for possible detection bias). We assessed the methods used to blind study participants and outcome assessors from knowledge of which intervention a participant received. We assessed the methods as low risk of bias (study had a clear statement that outcome assessors were unaware of treatment allocation, and ideally described how this was achieved) or unclear risk of bias (study stated that outcome assessors were blind to treatment allocation but lacked a clear statement on how this was achieved). We considered studies for which outcome assessment was not blinded as having high risk of bias. We assessed the blinding of outcome assessment for two outcome categories.
-
Subjective outcomes (patient‐reported outcomes).
-
Objective outcomes (including mortality and safety).
-
-
Incomplete outcome data (checking for possible attrition bias due to the quantity, nature, and handling of incomplete outcome data). We assessed the methods used to deal with incomplete data as low risk (< 10% of participants did not complete the study and/or used ‘baseline observation carried forward’ analysis), unclear risk of bias (used 'last observation carried forward' analysis), or high risk of bias (used 'completer' analysis). We assessed attrition bias for two outcome categories.
-
Subjective outcomes (patient‐reported outcomes).
-
Objective outcomes (including mortality and safety).
-
-
Selective reporting (checking for reporting bias). We assessed whether primary and secondary outcome measures were pre‐specified, and whether these were consistent with those reported: low risk of bias (study protocol was available and all of the study’s pre‐specified (primary and secondary) outcomes that were of interest in the review have been reported in the pre‐specified way, or the study protocol was not available but it was clear that the published reports included all expected outcomes, including those that were pre‐specified); unclear risk of bias (insufficient information to permit judgement of ‘low risk’ or ‘high risk'); or high risk of bias (not all of the study’s pre‐specified primary outcomes have been reported, or one or more primary outcomes are reported using measurements, analysis methods, or subsets of data that were not pre‐specified, or one or more reported primary outcomes were not pre‐specified, or one or more outcomes of interest in the review are reported incompletely so that they could not be entered into a meta‐analysis, or the study report failed to include results for a key outcome that would have been expected to have been reported for such a study).
-
Other sources of bias: we did not pre‐specify 'other sources of bias' that we were looking for in studies. This item provided us with freedom for potential causes of bias not listed otherwise, such as (but not limited to):
-
temporary halting of study;
-
midway protocol amendments, addition or removal of arms, treatment changes; and
-
additional medications provided based on subjective criteria.
-
We applied the following rule when making an overall risk of bias judgement per study.
| Overall risk of bias judgement | Criteria |
|---|---|
| Low risk of bias | The study is judged to be at low risk of bias for all domains for this result Or The study is judged to be at low risk of bias for most domains and at unclear risk of bias for selection, performance, and/or detection bias |
| Unclear risk of bias | The study is judged to be at unclear risk of bias in at least 1 of the domains of incomplete outcome data, selective reporting, or other bias for this outcome, but not to be at high risk of bias for any domain |
| High risk of bias | The study is judged to be at high risk of bias in at least 1 domain for this result |
Measures of treatment effect
Relative treatment effect
We used intention‐to‐treat data. For binary outcomes, we used risk ratios (RRs) with 95% confidence intervals (CIs) as the measure of treatment effect. We had planned to calculate continuous outcomes as mean differences (MDs) with 95% CIs, but we did not measure the effect of any outcome using continuous data. In case outcomes would have been reported as continuous data, and different instruments were used, we had planned to use standardised mean differences (SMDs) with 95% CIs to assess the extent of effects.
Relative treatment ranking
We obtained a treatment hierarchy using P scores (Rücker 2015). P scores allow ranking of treatments on a continuous zero to 1 scale in a frequentist network meta‐analysis.
Unit of analysis issues
We considered only results from the first treatment cycle. RCTs with a cross‐over design were eligible, as long as results had been reported after the first cycle, and therefore before cross‐over.
Studies with multiple treatment groups
As recommended in Chapter 16.5.4 of the Cochrane Handbook for Systematic Reviews of Interventions (Higgins 2011b), for studies with multiple treatment groups, we combined arms as long as they could be regarded as subtypes of the same intervention.
When arms could not be pooled this way, we compared each arm with the common comparator separately. For pair‐wise meta‐analysis, we split the ‘shared’ group into two or more groups with smaller sample sizes, and we included two or more (reasonably independent) comparisons. For this purpose, for dichotomous outcomes, we divided up both the number of events and the total number of participants, and for continuous outcomes, we divided up the total number of participants with unchanged means and standard deviations. For network meta‐analysis, instead of subdividing the common comparator, we used an approach that accounted for the within‐study correlation between effect sizes by re‐weighting all comparisons in each multi‐arm study (Rücker 2012; Rücker 2014).
Dealing with missing data
As suggested in Chapter 16 of the Cochrane Handbook for Systematic Reviews of Interventions (Higgins 2011b), we took the following steps to deal with missing data.
Whenever possible, we contacted the original investigators to request relevant missing data. If the number of participants evaluated for a given outcome was not reported, we used the number of participants randomised per treatment arm as the denominator. If only percentages but no absolute numbers of events were reported for binary outcomes, we calculated numerators using percentages. If estimates for means and standard deviations were missing, we planned to calculate these statistics from reported data whenever possible, using approaches described in Chapter 7.7 of the Cochrane Handbook for Systematic Reviews of Interventions (Higgins 2011a). If standard deviations were missing and we had not been able to calculate them from reported data, we planned to calculate values according to a validated imputation method (Furukawa 2006). If data were not reported numerically but were presented graphically, we estimated missing data from figures. We planned to perform sensitivity analyses to assess how sensitive results were to imputing data in some way. However, as we did not have continuous data, it was not necessary to impute potential missing data, and sensitivity analyses as described were unnecessary. We will apply this approach in future updates when necessary. We addressed in the Discussion the potential impact of missing data on review findings.
Assessment of heterogeneity
Pair‐wise meta‐analyses
For each direct comparison, we used visual inspection of forest plots as well as Cochran’s Q based on the Chi² statistic and the I² statistic to detect the presence of heterogeneity. We interpreted I² values according to Chapter 9.5.2 of the Cochrane Handbook for Systematic Reviews of Interventions (Deeks 2011).
We used the following thresholds for interpretation of I².
-
0% to 40%: might not be important.
-
30% to 60%: may represent moderate heterogeneity.
-
50% to 90%: may represent substantial heterogeneity.
-
75% to 100%: considerable heterogeneity.
However, we also considered the magnitude and direction of effects and the strength of evidence for heterogeneity. We used the P value of the Chi² test only in describing the extent of heterogeneity ‐ not in determining statistical significance. In addition, we reported Ʈ² ‐ the between‐study variance in random‐effects meta‐analysis.
Network meta‐analysis
A very important pre‐supposition for using network meta‐analysis is to make sure that the network is consistent, meaning that direct evidence and indirect evidence on the same comparisons agree. Inconsistency could be caused by incomparable inclusion and exclusion criteria of trials in the network.
We evaluated the assumption of transitivity epidemiologically by comparing the distribution of potential effect modifiers across the different pair‐wise comparisons. We created a table of important clinical and methodological characteristics, and we assessed whether there were systematic differences between identified comparisons. In particular, we looked at the following potential effect modifiers.
-
Clinical characteristics: gender, age, chemotherapy, tumour/cancer type.
-
Methodological characteristics: cross‐over design, blinding, placebo‐controlled, study period, sample size, country, multi‐centre, number of treatment arms, country.
We visually inspected the similarity of these factors, including the inclusion and exclusion criteria of every trial in the network, and we discussed whether the transitivity assumption was met.
To evaluate the presence of inconsistency locally, we used the Bucher method for single loops of evidence (Bucher 1997), as described, for example, in Dias 2013. For each closed loop, we calculated the difference between direct and indirect evidence, together with its 95% CI. We used loop‐specific z‐tests to infer about the presence of inconsistency in each loop. To assess inconsistency, we used graphical representations of direct and indirect estimates together with 95% CIs; we reported the percentage of inconsistent loops in the network and visually examined the forest plots and league tables to assess inconsistency. It should be noted that in a network of evidence, there may be many loops, and with multiple testing, the likelihood that we might find an inconsistent loop by chance was increased. Therefore, we have been cautious when deriving conclusions from the statistical approach and from preferred visual examination to assess inconsistency.
To evaluate the presence of inconsistency in the entire network, we gave the generalised heterogeneity statistic Qtotal and the generalised I² statistic, as described in Rücker 2019. We used the decomp.design command in the R package netmeta (R 2019; netmeta 2016) for decomposition of the heterogeneity statistic into a Q statistic for assessing heterogeneity between studies with the same design, and a Q statistic for assessing design inconsistency to identify the amount of heterogeneity/inconsistency within as well as between designs. Furthermore, we created a netheat plot (Krahn 2013) ‐ a graphical tool for locating inconsistency in network meta‐analysis, using the command netheat in the R package netmeta. We gave Qtotal and its components as well as net heat plots based on fixed‐effect and random‐effects models to identify differences between these approaches (netheat plots and forest plots of fixed‐effect models not shown in the review). For random‐effects models, we reported Ʈ².
In case we identified substantive heterogeneity and/or inconsistency, we explored possible sources by performing pre‐specified sensitivity and subgroup analyses (see below). In addition, we reviewed the evidence base, reconsidered inclusion criteria, and discussed the potential role of unmeasured effect modifiers to identify further sources.
Assessment of reporting biases
In pair‐wise comparisons with at least 10 trials, we planned to examine the presence of small‐study effects graphically by generating funnel plots. We planned to use linear regression tests to test for funnel plot asymmetry (Egger 1997). A P value less than 0.1 would have been considered significant for this test (Sterne 2011). We planned to examine the presence of small‐study effects for the primary outcome only. As described above, we searched study registries to identify completed but not published trials.
Data synthesis
Methods for direct treatment comparisons
We performed analyses according to recommendations provided in Chapter 9 of the Cochrane Handbook for Systematic Reviews of Interventions (Deeks 2011), and we used the statistical software of Cochrane ‐ Review Manager (RevMan 2014) ‐ for analysis. We performed separate analyses for cancer patients receiving HEC or MEC. If applicable, we used R for additional analyses that could not be done with RevMan (R 2019).
Pair‐wise comparisons were part of the network meta‐analysis. However, to outline available direct evidence, we provided forest plots for pair‐wise comparisons with at least 10 trials if trials were clinically homogenous. We performed these standard pair‐wise meta‐analyses using a random‐effects model. We calculated corresponding 95% CIs for all analyses, and we graphically presented the results using forest plots. When trials would have been clinically too heterogenous to be combined, we would have performed only subgroup analyses without calculating an overall estimate.
Methods for indirect and mixed comparisons
If we considered the data sufficiently similar to be combined, we performed a network meta‐analysis using the frequentist weighted least squares approach described by Rücker 2012. We used a random‐effects model, taking into account the correlated treatment effects in multi‐arm studies. We assumed a common estimate for the heterogeneity variance across the different comparisons. To evaluate the extent to which treatments were connected, we gave a network plot for our primary and secondary outcomes. For each comparison, we gave the estimated treatment effect along with its 95% CI. We graphically presented the results using forest plots, with placebo as the reference. We used the R package netmeta for statistical analyses (R 2019; netmeta 2016).
Subgroup analysis and investigation of heterogeneity
We conducted the following subgroup analysis, if appropriate.
-
Type of chemotherapy (carboplatin versus other moderately emetogenic chemotherapy, cisplatin versus other highly emetogenic chemotherapy, and anthracycline versus other highly emetogenic chemotherapy).
-
Cancer type (solid tumours versus haematological malignancies, and breast cancer versus others).
We had planned to use the test for interactions to test for subgroup differences. However, this test is not yet available for network‐meta analysis in netmeta 2016. We will apply this in future updates when possible.
We had planned to conduct the following subgroup analysis but could not do so because of missing information or split networks.
-
Drug dosage.
-
Route of administration.
-
Patient‐specific prognostic factors.
Sensitivity analysis
To test the robustness of the results, we conducted fixed‐effect pair‐wise and network meta‐analyses. We reported estimates of the fixed‐effect model only if they showed a difference from estimates of the random‐effects model. We explored the influence of risk of bias components by considering studies at low risk of bias when compared to all studies. Our rule for an overall risk of bias judgement is described under Assessment of risk of bias in included studies.
Summary of findings and assessment of the certainty of the evidence
'Summary of findings' table
According to Chapter 14 of the updated Cochrane Handbook for Systematic Reviews of Interventions, the “most critical and/or important health outcomes, both desirable and undesirable, limited to seven or fewer outcomes” should be included in the summary of findings table(s) (Schünemann 2019). Together with a clinical expert (KJ), we prioritised the most important and crucial (underlined) outcomes as follows.
-
Complete control of nausea in the overall phase (Days 1 to 5).
-
Complete control of vomiting.
-
Delayed phase (Days 2 to 5).
-
Overall phase (Days 1 to 5).
-
-
No impairment of quality of life.
-
On‐study mortality.
-
Serious adverse events.
-
Local reactions at infusion site.
We planned to include a 'Summary of findings' table for each outcome per emetogenic group (HEC and MEC) to present the main findings in a transparent and simple tabular format. Each table includes key information concerning the certainty of evidence and the magnitude of effect of interventions examined. For a comprehensive illustration of our results, we randomly chose aprepitant plus granisetron as exemplary reference treatment for HEC, and granisetron as exemplary reference treatment for MEC. However, theoretically, we could have used every treatment combination as a reference. The estimated absolute effects provided in the 'Summary of findings' table were based on actual event rates reported for the main comparators and summed across studies, and are provided for illustrative purposes only.
We could not include a 'Summary of findings' table for the outcome local reactions at infusion site because in the HEC group, no study reported the outcome for our reference treatment (aprepitant plus granisetron), and in the MEC group, no study reported the outcome at all.
Assessment of the certainty of the evidence
Two review authors independently rated the certainty of evidence of each prioritised outcome for both HEC and MEC groups. We used the GRADE (Grades of Recommendation, Assessment, Development and Evaluation) system to rank the certainty of evidence using the GRADEprofiler Guideline Development Tool software (GRADEpro GDT 2015), along with the guidelines provided in Chapter 12.2 of the CochraneHandbook for Systematic Reviews of Interventions (Schünemann 2011a), specifically for network meta‐analyses (Puhan 2014). The GRADE Working Group suggests assessment of the certainty of evidence for no more than seven outcomes, and for each outcome included in 'Summary of findings' tables ‐ therefore only for outcomes that are most critical or important for decision‐making (Guyatt 2013).
The GRADE approach used five considerations (study limitations, consistency of effect, imprecision, indirectness, and publication bias) to assess certainty of the body of evidence for each outcome. The GRADE system used the following criteria for assigning grade of evidence.
-
High = we are very confident that the true effect lies close to that of the estimate of the effect.
-
Moderate = we are moderately confident in the effect estimate; the true effect is likely to be close to the estimate of effect, but there is a possibility that it is substantially different.
-
Low = our confidence in the effect estimate is limited; the true effect may be substantially different from the estimate of the effect.
-
Very low = we have very little confidence in the effect estimate; the true effect is likely to be substantially different from the estimate of effect.
The GRADE system used the following criteria for assigning a certainty level to a body of evidence (Chapter 12, Schünemann 2011a).
-
High: randomised trials; or double‐upgraded observational studies.
-
Moderate: downgraded randomised trials; or upgraded observational studies.
-
Low: double‐downgraded randomised trials; or observational studies.
-
Very low: triple‐downgraded randomised trials; or downgraded observational studies; or case series/case reports.
We decreased grade if we noted:
-
serious (‐1) or very serious (‐2) risk of bias;
-
important inconsistency (‐1);
-
some (‐1) or major (‐2) uncertainty about directness;
-
imprecise or sparse data (‐1) or very imprecise or very sparse data (‐2); or
-
high probability of reporting bias (‐1).
Results
Description of studies
For this systematic review, we identified 383 records for full‐text screening, of which 107 RCTs comprising 197 references, with approximately 37,313 participants, fulfilled the inclusion criteria.
Results of the search
We identified 5192 potentially relevant references through database searches and five additional references through handsearching. After full‐text screening, we concluded that 197 references representing 73 studies in the HEC group (Appendix 2), along with 38 studies in the MEC group (Appendix 3), met the pre‐defined eligibility criteria; thus we selected them for assessment. As some trials were reported in multiple full‐text reports, abstracts, and posters, we indexed these repeating references under the main publications. Four studies included people treated with both highly and moderately emetogenic chemotherapeutic regimens and reported results for both regimens separately; thus we included them in both HEC and MEC groups (Raftopoulos 2015; Ghosh 2010; Ho 2010; Tsubata 2019), resulting in a total of 107 included studies. Two studies in the HEC group were reported in the Korean language (Cho 1998; Lee 1997), and the remaining 105 studies were reported in the English language.
We documented the overall numbers of records screened, identified, selected, excluded, and included in a PRISMA flow diagram (Figure 1, Supplementary Figure 1). Supplementary figures are available from https://osf.io/dr2u7/ (Piechotta 2021).
Included studies
In the HEC group, we included 73 studies reporting on 25,275 participants. Studies were conducted between December 1992 ‐ Roila 1995 ‐ and February 2018 ‐ Li 2019. Stewart 1996 did not report the information that we sought. Sample sizes varied from 15 in Abdel‐Malek 2017 to 2322 participants in Grunberg 2011. In the MEC group, we included 38 studies reporting on 12,038 participants. Studies were conducted between July 1997 for Herrington 2000 and March 2017 for Xiong 2019. Sample sizes varied from 12 in Brohee 1995 to 1369 participants in Schwartzberg 2015.
In the HEC group, 45 studies (62%) included cisplatin > 50 mg/m² alone or in combination for treatment of solid malignancies. Eleven studies (15%) included only breast cancer patients and used the combination of anthracycline and cyclophosphamide in the chemotherapy regimen (Arce‐Salinas 2019; Herrstedt 2009; Kalaycio 1998; Li 2019; Matsumoto 2020; Nakamura 2012; Ohzawa 2015; Rugo 2017; Saito 2017; Warr 2005; Wenzell 2013). Schmitt 2014, Svanberg 2015, Mohammed 2019, and Egerer 2010 used melphalan or ABVD (Adriamycin, Bleomycin, Vinblastine, Dacarbazine) in the chemotherapy regimen for treatment of haematological malignancies. In the MEC group, 13 studies (35%) included patients treated with carboplatin for solid and haematological malignancies (Eisenberg 2003; Endo 2012; Herrington 2000; Ito 2014; Jordan 2016a; Kaushal 2010; Kaushal 2015; Kim 2017; Kusagaya 2015; Maehara 2015; Sugimori 2017; Tanioka 2013; Yahata 2016), eight studies (22%) included patients treated with cyclophosphamide ≤ 1500 mg/m² (Arpornwirat 2009; Brohee 1995; Ghosh 2010; Raftopoulos 2015; Rapoport 2010; Schwartzberg 2015; Song 2017; Yeo 2009), and four studies (11%) included patients treated with oxaliplatin for solid and haematological malignancies (Aridome 2016; Hesketh 2012; Ho 2010; Nishimura 2015). Yeo 2009 and Webb 2010 included patients with breast cancer.
A majority of studies (70%) in the HEC group were double‐blinded (typically reported in journal publication and referring to participants and investigators) or quadruple‐blinded (typically reported in trials registries and referring to participants, care providers, investigators, and outcome assessors), and 27 studies among them were placebo‐controlled. Eleven studies (15%) were open‐label and were not placebo‐controlled (Ando 2016; Arce‐Salinas 2019; Cho 1998; Chua 2000; Ishido 2016; Lee 1997; Mahrous 2020; NCT01640340; Ohzawa 2015; Tsubata 2019; Wenzell 2013). Abdel‐Malek 2017 Kang 2020, and Mohammed 2019 were single‐blinded studies. In the MEC group, 16 studies (43%) were double‐blind with 11 studies (30%) among them placebo‐controlled, and 14 studies (38%) were open‐label. Fifteen studies in the HEC group (Abdel‐Malek 2017; Aksu 2013; Albany 2012; Cho 1998; Chua 2000; Gao 2013; Innocent 2018; Ishido 2016; Kimura 2015; Koizumi 2003; Lee 1997; Nakamura 2012; Ohzawa 2015; Stewart 2000; Wit 2001), as well as four studies in the MEC group (Fujiwara 2015; Jantunen 1992; Kaushal 2015; Seol 2016), were cross‐over studies.
Forty‐nine studies in the HEC group and 26 studies in the MEC group included a triple‐drug combination, including a neurokinin‐1 (NK₁) receptor antagonist, a 5‐hydroxytryptamine‐3 (5‐HT₃) receptor antagonist, and a corticosteroid, as experimental intervention. The most frequently used NK₁ receptor antagonist was aprepitant, followed by fosaprepitant, rolapitant, netupitant, casopitant, and ezlopitant. As 5‐HT₃ receptor antagonists, palonosetron, granisetron, ondansetron, ramosetron, tropisetron, and azasetron were used. As a corticosteroid, either dexamethasone or methylprednisolone was used. An overview of all included treatment regimens is provided in Table 1.
Nearly all of the studies included individuals ≥ 18 years of age with confirmed malignancy and naïve to emetogenic chemotherapy. Albany 2012, Kimura 2015, and Ghosh 2010 included participants ≥ 15 years of age. Data were not reported separately for participants ≥ 18 years and participants ≥ 15 years in any of these studies. As study authors considered the age of 15 as an appropriate cut‐off and provided no reason to separate the analysis, we assumed that the effects for 15‐ to 17‐year‐olds and ≥ 18‐year‐olds would not differ. Therefore, although the proportions of participants < 18 years old were not reported, we included them in the analysis.
The foremost causes of exclusion were symptomatic malignancy of the central nervous system (CNS) and participant had vomited within 24 hours before treatment Day 1, had an active infection, had an active systemic fungal infection, had any severe concurrent illness except for malignancy, or had abnormal laboratory values.
Seventeen studies from both HEC and MEC groups included participants from Asia, Europe, Africa, North America and South America, Australia, and the Pacific region (Aapro 2006; Arpornwirat 2009; Chawla 2003; Grunberg 2009; Grunberg 2011; Herrstedt 2009 Hesketh 2003; Hesketh 2012; Jordan 2016a; Rapoport 2010; Rapoport 2015 (a); Rugo 2017; Ruhlmann 2017; Warr 2005; Weinstein 2016; Schmoll 2006; Schwartzberg 2015); all were multi‐national and multi‐centred. Most studies were conducted in Asia, including Japan (23%). Other Asian sites were South Korea (Cho 1998; Kim 2015; Kim 2017; Lee 1997; Seol 2016), China (Chua 2000; Ho 2010; Hu 2014; Song 2017; Xiong 2019; Yang 2017; Yeo 2009), and India (Ghosh 2010; Kaushal 2010; Kaushal 2015). Precisely 12 studies included participants only from USA with different ethnicities (Albany 2012; Bubalo 2005; Bubalo 2018; Fox‐Geiman 2001; Herrington 2008; NCT01640340; Raftopoulos 2015; Rapoport 2015 (b); Rapoport 2015 (c); Schnadig 2016; Stiff 2013; Wenzell 2013), and eight studies included participants exclusively from Europe (Brohee 1995; Egerer 2010; Flenghi 2015; Hesketh 2014; Roila 1995; Schmitt 2014; Stewart 2000; Svanberg 2015).
We visually inspected the similarity of clinical and methodological characteristics that could act as potential effect modifiers and assessed whether there were systematic differences between identified comparisons (available from study authors upon request). We decided that for most studies (50 in the HEC group, 26 in the MEC group), it was hypothetically equally likely that any participant could have been randomised to any treatment.
We therefore included 50 studies from the HEC group in the network meta‐analysis (NMA). We could not include 23 HEC studies in the NMA for the following reasons.
-
Different definitions of efficacy outcomes: Kimura 2015, Svanberg 2015, Fox‐Geiman 2001, Wit 2001, Koizumi 2003, Ghosh 2010, Lee 1997, Chua 2000, Mohammed 2019
-
Different definitions of acute, delayed, and overall phases: Albany 2012, Ando 2016
-
Efficacy outcomes reported as a score: Albany 2012, Ando 2016
-
Results reported over multiple cycles including cross‐over: Abdel‐Malek 2017
-
Only number of adverse events reported: Albany 2012, Kalaycio 1998
-
Adverse events divided by severity grade: Kimura 2015, Svanberg 2015
-
Only abstract with insufficient information available: Arce‐Salinas 2019 Cho 1998, Flenghi 2015, Forni 2000, Gao 2013, Mahrous 2020 Stewart 1996
-
Full text with insufficient information or without any outcome of interest: Stewart 2000, Egerer 2010
-
Part of the study population received additional irradiation and results for the subgroup without irradiation have not been separately reported: Bubalo 2018
-
Adverse events for HEC and MEC reported together: Ghosh 2010.
We included 26 studies from the MEC group in the NMA. We could not include 12 MEC studies in the NMA for the following reasons.
-
Missing specification of 5‐HT₃ inhibitor: Ito 2014, Maehara 2015, Yahata 2016
-
Missing specification of 5‐HT₃ and NK₁ inhibitors: Nishimura 2015
-
Results reported over multiple cycles including cross‐over: Fujiwara 2015, Kitayama 2015
-
Results reported over multiple cycles: Brohee 1995
-
Only number of treatment‐related adverse events reported: Seol 2016
-
Different definitions of efficacy outcomes: Ghosh 2010, Jantunen 1992
-
Adverse events for HEC and MEC reported together: Ghosh 2010
-
Only abstract with insufficient information available: Webb 2010, Miyabayashi 2015, Schnadig 2014.
For detailed information regarding the characteristics of included studies, please refer to the Characteristics of included studies table.
Excluded studies
We excluded 140 records of assessed full texts for the following reasons.
We excluded 89 records (63%) because of the antiemetic therapy.
-
69 used no corticosteroid or corticosteroids in only one arm (Audhuy 1996; Ballatori 1995; Bianchi 1996; Bonneterre 1995; Bubalo 2001; Campora 1994; Dong 2011; Fauser 1995; Fauser 1996; Fauser 1999; Feng 2000; Feng 2002; Fengyi 2002; Gebbia 1994; Goldschmidt 1997; Gralla 1998; Gralla 2003; Hesketh 1996; Huang 2013; Huc 1998; Iihara 2012; Jantunen 1993; Kang 2002; Kim 1998; Kim 2004; Leonardi 1996; Lofters 1995; Martoni 1996; Marty 1995; Matsuoka 2003; Micha 2016; Nasu 2013; Noble 1994; Noda 2002; Ogihara 1999; Park 1997; Pectasides 2007; Perez 1998 (a); Peterson 1996; Poon 1998; Qiu 2011; Ruff 1994; Sheng 2010; Shi 2007; Slabý 2000; Spector 1998; Stewart 1995; Sun 2014; Tang 2013; Tian 2011; Tominaga 1996; Tong 2014; Tremont‐Lukats 2017; Tsavaris 1996; Tsubata 2015; Tsukuda 1995; Weant 2017; Xie 2003; Yalçin 1999; Yang 2005; Yano 2005; Yu 2009; Zeng 2001; Zhang 1996; Zhang 1999; Zhang 2003; Zhang 2003 (a); Zhang 2007; Öge 2000).
-
9 used other antiemetics (metoclopramide (Italian Group for Antiemetic Research 1993; Italian Group for Antiemetic Research 1995 (a); Italian Group for Antiemetic Research 1995 (b); Van der Vorst 2021), lorazepam (Lacerda 2000; Mandanas 2005), prochlorperazine (Lindley 2005; Matsui 1996), dronabinol (Meiri 2007)).
-
5 used no 5‐HT₃ inhibitors or 5‐HT₃ inhibitors in only one arm (Belle 2002; Cocquyt 2001; Lavoie 2012; Ohta 1992; Van Belle 2002).
-
3 did not define which 5‐HT₃ inhibitors or NK₁ inhibitor was used (Nishimura 2015 (a); Nishimura 2015 (b); Yahata 2016 (a)).
-
1 used corticosteroids as pre‐therapy before chemotherapy (Perez 1998 (b)).
-
2 compared different preparations of the same drug (Huang 1998; NCT04636632).
We excluded 39 records (28%) because of the study design.
-
15 were non‐randomised studies of the intervention (Abali 2007; Albany 2014; Choi 2014; Craver 2011; Creed 1999; Huang 2001; Long 2002; Monda 1994; Pater 1997; Perez 1996; Plasencia‐Mota 1993; Rzepecki 2009; Takenaka 2007; Takeshima 2014; Zeidman 1998).
-
12 were pharmacokinetic studies (Bubalo 2012; Loos 2007; Ottoboni 2014; Suzuki 2015; Tsuji 2016; Vadhan‐Raj 2011; Vadhan‐Raj 2012; Vadhan‐Raj 2014; Vadhan‐Raj 2015; Walko 2012; Zhang 2002; Zhang 2012).
-
3 were cost‐effectiveness analyses (Barrajon 2000; Humphreys 2013; Moore 2007).
-
3 were letters or correspondences (Bonneterre 1994; Fedele 1995; Silvestris 2013).
-
2 were retrospective subset analyses of included studies (Hudis 2003; Uchino 2012).
-
2 were dose‐finding studies (Roila 2009; Tanimura 1998).
-
1 was a pooled analysis of different trials (Molassiotis 2013).
-
1 was a review (Navari 2016).
We excluded 12 records (9%) because of the underlying chemotherapy.
-
5 did not clearly define the chemotherapy, so it was unclear whether it was HEC or MEC (Chiou 2000; Kilickap 2013; Kim 2012; Lee 2014; Saito 2015).
-
3 used a concurrent chemoradiotherapy (Kawaguchi 2015; Ruhlmann 2016; Tong 2012).
-
2 did not provide individual data for HEC and MEC groups (Roscoe 2012; Tan 2004).
-
1 used a low emetogenic chemotherapy (Dandamudi 2011).
-
1 used an antiblastic therapy (Adamo 1994).
For further information, please check Characteristics of excluded studies.
Ongoing studies
Of the 12 ongoing studies, four studies are comparing different combinations of NK₁ and 5‐HT₃ inhibitors for prevention and control of nausea and vomiting for people receiving HEC (KTC0001495; UMIN000004021; UMIN000006773; UMIN000007882); three studies are comparing different combinations of NK₁ and 5‐HT₃ inhibitors for prevention and control of nausea and vomiting for people receiving MEC (UMIN000005317; UMIN000005494; UMIN000032860); four studies are comparing a 5‐HT₃ inhibitor versus a combination of NK₁ and 5‐HT₃ inhibitors for prevention and control of nausea and vomiting for people receiving MEC (ChiCTR1900025227; IRCT20191103045317N1; UMIN000012500; UMIN000041004); and one study is comparing different combinations of NK₁ and 5‐HT₃ inhibitors for prevention and control of nausea and vomiting for people receiving both HEC and MEC (NCT03606369).
Please refer to Characteristics of ongoing studies for more detailed information.
Studies awaiting classification
Of the 34 studies awaiting assessment, 10 studies are not recruiting and no results are available for these (four studies using HEC (EUCTR2004‐004956‐38; EUCTR2004‐000371‐34; EUCTR2007‐004043‐30; EUCTR2015‐001800‐74), five studies using MEC (EUCTR2006‐000781‐37; EUCTR2006‐003512‐22; EUCTR2007‐005169‐36; EUCTR2009‐016775‐30; EUCTR2009‐017603‐28), and one study using both HEC and MEC (EUCTR2010‐023297‐39)).
We classified nine further studies with HEC setting and without available results as awaiting assessment because the status is given as "pending" (ChiCTR‐INR‐17010779), "authorised recruitment may be ongoing or finished" (EUCTR2008‐001339‐37), "terminated per PI’s request" (NCT02732015), or "completed" (NCT01101529; NCT03403712; UMIN000004826; UMIN000004863; UMIN000008897), or because status is unknown (PER‐055‐12).
We classified ten further studies with MEC setting and without available results as awaiting assessment because the status is given as "authorised recruitment may be ongoing or finished" (EUCTR2004‐001020‐20), "completed" (CTRI/2017/10/010163; UMIN000004998; UMIN000008041; UMIN000008552; UMIN000010056; UMIN000010186; UMIN000019122), or "terminated" (insufficient accrual)“ (NCT02550119), or because status is unknown (NCT02407600).
Two records were abstracts with insufficient information (Mylonakis 1996; Spina 1995), and one study was completed with no available results and with no information with regard to chemotherapy (NCT00169572).
One study provided insufficient information on the antiemetic regimen in the trial registry (JapicCTI‐194691).
Please refer to Characteristics of studies awaiting classification for more detailed information.
Risk of bias in included studies
Summaries of the risk of bias of included studies for all assessed domains across included studies and per included study are presented in Figure 2 and Figure 3 and in Supplementary Figure 2. Supplementary figures are available from https://osf.io/dr2u7/ (Piechotta 2021).

Risk of bias summary: review authors' judgements about each risk of bias item for each included study.

Risk of bias graph: review authors' judgements about each risk of bias item presented as percentages across all included studies.
Allocation
Among the 107 included studies, 55 (51%) reported a randomised allocation process using simple randomisation, a block randomisation method, computer‐generated randomisation, an interactive voice response system, or a telephone call; therefore we judged them as having low risk of bias for 'Random sequence generation'. The remaining 52 studies (49%) mentioned the random allocation process but did not provided information regarding the sequence generation; therefore, we judged these studies as having unclear risk of bias for 'Random sequence generation'.
Allocation is concealed to ensure that the group assignment of participants is not revealed before they are definitively allocated to their respective groups. We judged the risk of bias for allocation concealment to be low for 17 studies (16%), as these studies used methods such as sealed envelopes, central randomisation, or engaging unrelated personnel/organisations to determine group assignments (Albany 2012; Cheirsilpa 2005; Fox‐Geiman 2001; Grunberg 2011; Hu 2014; Koizumi 2003; Maehara 2015; Matsumoto 2020; Mohammed 2019; Rapoport 2010; Rapoport 2015 (b); Rapoport 2015 (c); Schwartzberg 2015; Sugawara 2019; Svanberg 2015; Weinstein 2016; Zhang 2020). We judged the remaining 90 studies (84%) as having unclear risk of bias, as they provided no sufficient information regarding concealment of allocation.
Blinding
Performance bias
Participants
Regarding blinding of participants towards treatment arms, 71 studies (66%) were reported to be single‐blind, double‐blind, or quadruple‐blind; therefore we judged them as having low risk of bias. We judged nine studies (8%) as having unclear risk of bias, as they provided no information concerning blinding of participants (Aksu 2013; Endo 2012; Forni 2000; Gao 2013; Li 2019; Matsuda 2014; Miyabayashi 2015; Ozaki 2013; Zhang 2018 (b)); we judged the remaining 27 studies (25%) as having high risk of bias because participants were not blinded (Ando 2016; Arce‐Salinas 2019; Aridome 2016; Badar 2015; Cho 1998; Chua 2000; Fujiwara 2015; Herrington 2000; Ishido 2016; Ito 2014; Jantunen 1992; Kaushal 2010; Kaushal 2015; Kusagaya 2015; Lee 1997; Maehara 2015; Mahrous 2020; Mattiuzzi 2007; NCT01640340; Nishimura 2015; Ohzawa 2015; Seol 2016; Song 2017; Sugimori 2017; Tsubata 2019; Wenzell 2013; Xiong 2019).
Personnel
Sixty‐three studies (59%) reported blinding of personnel towards treatment arms; therefore we judged them as having low risk of bias for 'Blinding of personnel'. We judged 11 studies (10%) as having unclear risk of bias, as we found no suggestive information concerning blinding of personnel (Aksu 2013; Brohee 1995; Endo 2012; Forni 2000; Gao 2013; Li 2019; Matsuda 2014; Miyabayashi 2015; Ozaki 2013; Xiong 2019; Zhang 2018 (b)); we judged the remaining 33 studies (31%) as having high risk of bias because personnel were not blinded (Abdel‐Malek 2017; Ando 2016; Arce‐Salinas 2019; Aridome 2016; Badar 2015; Cho 1998; Chua 2000; Fujiwara 2015; Herrington 2000; Ishido 2016; Ito 2014; Jantunen 1992; Kang 2020; Kaushal 2010; Kaushal 2015; Kim 2015; Kimura 2015; Kitayama 2015; Kusagaya 2015; Lee 1997; Maehara 2015; Mahrous 2020; Mattiuzzi 2007; Mohammed 2019; Nakamura 2012; NCT01640340; Nishimura 2015; Ohzawa 2015; Seol 2016; Song 2017; Sugimori 2017; Tsubata 2019; Wenzell 2013).
Detection bias
We assessed blinding of outcome assessment for two outcome categories ‐ subjective and objective outcomes ‐ as previously described.
Subjective outcomes
Assessment of subjective outcomes, such as complete control of nausea, complete control of vomiting, and quality of life, can be influenced by awareness of the intervention. We judged 65 studies (61%) as having low risk of bias because outcome assessors (i.e. participants) were blinded to the intervention. We judged ten studies (9%) as having unclear risk of bias for subjective outcomes, as they provided no information regarding blinding of participants (Aksu 2013; Brohee 1995; Endo 2012; Forni 2000; Gao 2013; Li 2019; Matsuda 2014; Miyabayashi 2015; Ozaki 2013; Zhang 2018 (b)). We judged 32 studies (30%) as having high risk of bias for subjective outcomes, as the unblinded study design might have influenced the outcome assessment (Abdel‐Malek 2017; Ando 2016; Arce‐Salinas 2019; Aridome 2016; Badar 2015; Cho 1998; Chua 2000; Fujiwara 2015; Herrington 2000; Ishido 2016; Ito 2014; Jantunen 1992; Kaushal 2010; Kaushal 2015; Kim 2015; Kimura 2015; Kitayama 2015; Kusagaya 2015; Lee 1997; Maehara 2015; Mahrous 2020; Mattiuzzi 2007; Nakamura 2012; NCT01640340; Nishimura 2015; Ohzawa 2015; Seol 2016; Song 2017; Sugimori 2017; Tsubata 2019; Wenzell 2013; Xiong 2019).
Objective outcomes
Assessment of objective outcomes, such as mortality and adverse events, should not be influenced by awareness of the intervention. We, therefore, judged the risk of detection bias to be low for all studies that assessed or reported objective outcomes. Assessment of detection bias for objective outcomes was not applicable for 41 studies (38%) because objective outcomes were not assessed or reported in those studies (Abdel‐Malek 2017; Aksu 2013; Albany 2012; Ando 2016; Brohee 1995; Bubalo 2005; Cho 1998; Chua 2000; Egerer 2010; Flenghi 2015; Forni 2000; Fox‐Geiman 2001; Fujiwara 2015; Gao 2013; Herrington 2000; Innocent 2018; Jantunen 1992; Jordan 2016a; Kaushal 2010; Kaushal 2015; Li 2019; Maehara 2015; Matsumoto 2020; Mattiuzzi 2007; Miyabayashi 2015; Mohammed 2019; NCT01640340; Ohzawa 2015; Ozaki 2013; Poli‐Bigelli 2003; Rugo 2017; Saito 2017; Schnadig 2014; Stewart 1996; Stewart 2000; Svanberg 2015; Tsubata 2019; Webb 2010; Wenzell 2013; Wit 2001; Zhang 2018 (b)).
Incomplete outcome data
We assessed risk of attrition bias for both outcome categories ‐ subjective and objective outcomes ‐ as previously described. We judged 93 studies (87%) as having low risk of bias for subjective objectives and 60 studies (56%) as having low risk of bias for objective outcomes, as most of the randomised participants (92% to 100%) were included in the antiemetic efficacy and safety analyses in primary studies, and reported study discontinuations were balanced between arms.
Subjective outcomes
We judged 11 studies (10%) as having unclear risk of bias for subjective outcomes, as insufficient information was provided to make an explicit decision whether or not the intention‐to‐treat population was analysed (Aksu 2013; Arce‐Salinas 2019; Cho 1998; Forni 2000; Gao 2013; Lee 1997; Li 2019; Mahrous 2020; Mohammed 2019; Stewart 1996; Zhang 2018 (b)). We judged three studies (3%) as having high risk of bias for subjective outcomes because Kang 2020 used a modified ITT analysis and included only participants who received at least one treatment, because Ozaki 2013 excluded 15 participants (25% of the initial included population) from the efficacy analysis due to insufficient diary entries and protocol violations, and because Seol 2016 analysed the per‐protocol population.
Objective outcomes
We judged five studies (5%) as having unclear risk of bias for objective outcomes because we were not able to evaluate completeness of safety data for Arce‐Salinas 2019 and Mahrous 2020, as only an abstract was available, because Herrington 2008 did not report whether or not serious adverse events occurred, because it was unclear for Matsumoto 2020 who was included in the safety population, and because we were not able to evaluate the completeness of safety data from Lee 1997 due to a language barrier (and we could not identify someone via Cochrane TaskExchange to translate those for us). We judged two studies (2%) as having high risk of bias for objective outcomes because Kang 2020 included the ITT population in safety analysis even though not all participants received at least one study drug, and because Yahata 2016 did only report antiemetic treatment‐related adverse events. We did not assess detection bias for objective outcomes for 40 studies (37%) because objective outcomes were not assessed or reported in those studies (Abdel‐Malek 2017; Aksu 2013; Albany 2012; Ando 2016; Brohee 1995; Bubalo 2005; Cho 1998; Chua 2000; Egerer 2010; Flenghi 2015; Forni 2000; Fox‐Geiman 2001; Fujiwara 2015; Gao 2013; Herrington 2000; Innocent 2018; Jantunen 1992; Jordan 2016a; Kaushal 2010; Kaushal 2015; Li 2019; Maehara 2015; Mattiuzzi 2007; Miyabayashi 2015; Mohammed 2019; NCT01640340; Ohzawa 2015; Ozaki 2013; Poli‐Bigelli 2003; Rugo 2017; Saito 2017; Schnadig 2014; Stewart 1996; Stewart 2000; Svanberg 2015; Tsubata 2019; Webb 2010; Wenzell 2013; Wit 2001; Zhang 2018 (b)).
Selective reporting
We judged 85 studies (79%) as having low risk of bias for selective reporting because outcome reporting seemed to be complete in the study reports for all primary, secondary, and additional outcomes, and we identified no reasons for concern.
We judged 18 studies (17%) as having unclear risk of bias for selective reporting for the following reasons. Ando 2016 reported the pre‐specified outcomes but not according to treatment arms. Herrstedt 2009 was completed and published in 2009. In 2017, the principal investigators (PIs) or Sponsors submitted the results to be published in the trials register. After quality control, results were resubmitted twice, then submission was cancelled at both times (please see https://clinicaltrials.gov/ct2/show/results/NCT00366834). We are not sure whether this means that the quality check revealed some issues with the data and the study authors did not want to resolve those, whether they were not able to resolve those, or whether after this long period of time, the data simply did not meet the quality standard of clinicaltrials.gov, and PIs and Sponsors did not have data needed for the revision because they had never been obtained. We contacted the study authors for clarification and did not receive a response. Svanberg 2015 mentioned that adverse events were not differing between groups but did not provide any supporting data. We could not evaluate selective reporting for Tsubata 2019, as the wrong study registration number was provided in the paper and the correct number was not retrievable. Further, we could not evaluate two studies because of language barriers and we could not identify someone via Cochrane TaskExchange to translate those for us (Cho 1998; Lee 1997). Twelve studies were conference abstracts with insufficient reporting (Arce‐Salinas 2019; Brohee 1995; Flenghi 2015; Forni 2000; Gao 2013; Mahrous 2020; Miyabayashi 2015; Ozaki 2013; Schnadig 2014; Stewart 1996; Webb 2010; Zhang 2018 (b))
We judged five studies (4%) as having high risk of bias for selective reporting. Bubalo 2005 did not provide any results for their pre‐specified secondary outcomes (effects on nausea, appetite and taste changes, and pharmacokinetic interactions). Egerer 2010 mentioned safety assessment in the introduction but did not provide any safety data. Kaushal 2015 and Maehara 2015 did not report any results for pre‐determined safety outcomes. Saito 2017 reported only complete response and quality of life.
Other potential sources of bias
We judged 88 studies (82%) as having low risk for other potential sources of bias because we did not identify any information that would suggest other bias.
We judged 19 studies (18%) as having unclear risk for other potential sources of bias because one study was temporarily halted and the protocol was amended with removal of one arm (Arm C) (Herrington 2008); descriptive statistics of participants in Arm C were not included in the report. Ito 2014 allowed additional antiemetic agents and other supportive treatments at the discretion of the treating physician. Kitayama 2015 did not record the incidence and severity of CINV daily but only on Days 2 and 5. We could not evaluate two studies because of language barriers and we could not identify someone via Cochrane TaskExchange to translate those for us (Cho 1998; Lee 1997). We could not find any full‐text publication for 14 studies and the abstracts did not contain sufficient information to exclude other potential sources of bias (Arce‐Salinas 2019; Brohee 1995; Flenghi 2015; Forni 2000; Gao 2013; Mahrous 2020; Mattiuzzi 2007; Miyabayashi 2015; Ozaki 2013; Saito 2017; Schnadig 2014; Stewart 1996; Webb 2010; Zhang 2018 (b)).
Effects of interventions
See: Summary of findings 1 Summary of findings: complete control of vomiting during the overall phase (HEC) when compared to treatment with aprepitant + granisetron; Summary of findings 2 Summary of findings: serious adverse events (HEC) when compared to treatment with aprepitant + granisetron; Summary of findings 3 Summary of findings: complete control of vomiting during the overall phase (MEC) when compared to treatment with granisetron; Summary of findings 4 Summary of findings: serious adverse events (MEC) when compared to treatment with granisetron
An overview of all outcomes including prioritisation of outcomes is provided in Table 2. Supplementary figures are available from https://osf.io/dr2u7/ (Piechotta 2021).
Highly emetogenic chemotherapy (HEC)
Our objectives were to compare the effects of antiemetic treatment combinations including NK₁ receptor antagonists, 5‐HT₃ receptor antagonists, and corticosteroids on prevention of acute, delayed, and overall chemotherapy‐induced nausea and vomiting, and to generate a clinically meaningful treatment ranking according to their safety and efficacy. To strengthen the network, we also included treatment arms including 5‐HT₃ receptor antagonists and corticosteroids solely. However, we report outcomes only for comparisons including also NK₁ receptor antagonists.
We describe all comparisons that show evidence of a difference between treatment comparisons including NK₁ and 5‐HT₃ inhibitors and corticosteroids. All other comparisons are provided per outcome in a league table. We do not describe the ranking of treatments because P score rankings also include treatments that include 5‐HT₃ inhibitors and corticosteroids solely. For a comprehensive illustration of our results in forest plots and presentation in 'Summary of findings' tables, we randomly chose aprepitant plus granisetron and a corticosteroid as exemplary reference treatment for HEC. However, theoretically, we could have used every treatment combination as a reference.
Efficacy
Complete control of nausea
We defined complete control of nausea as no nausea and no significant nausea, and we refer to it hereafter as "no nausea".
No nausea and no significant nausea were defined on a study level and typically refer to pre‐defined cutoffs (e.g. in Rapoport 2015 (a) or Schwartzberg 2015, nausea was assessed on a visual analogue scale (VAS; 0 to 100 mm; 0 = no nausea, 100 = severe nausea): < 5 mm for no nausea and < 25 mm for no significant nausea. No significant nausea is typically more subjective because of the wider range on the scale and therefore is less objective, especially in an open‐label study design. To increase comparability of studies and minimise biased results, we were therefore interested in patients with no nausea.
Acute phase (0 to 24 hours)
No nausea in the acute phase was reported in 22 studies including 11,225 participants and comparing a total of 17 treatment regimens. We could include all studies in network meta‐analysis (NMA), and the network was fully connected (see Supplementary Figure 3). Results for all network comparisons, including ranking of treatments, are shown in Supplementary Figures 4 and 5. We observed moderate heterogeneity (I² = 49.9%) between studies in the network. More participants treated with ezlopitant plus granisetron experienced no nausea in the acute phase than participants treated with netupitant plus palonosetron (risk ratio (RR) 1.58, 95% confidence interval (CI) 1.02 to 2.46), and than participants treated with aprepitant plus granisetron (RR 1.64, 95% CI 1.05 to 2.56), respectively. Evidence suggests no other differences between treatments including both an NK₁ inhibitor and a 5‐HT₃ inhibitor, and a corticosteroid.
We identified no evidence of a difference between direct and indirect estimates in closed loops in the network (see Supplementary Figure 6).
Delayed phase (24 to 120 hours)
No nausea in the delayed phase was reported in 19 studies including 10,545 participants and comparing a total of 15 treatment regimens. We could include all studies in NMA, and the network was fully connected (see Supplementary Figure 7). Results for all network comparisons, including ranking of treatments, are shown in Supplementary Figures 8 and 9. We observed serious heterogeneity (I² = 66.7%) between studies in the network. Evidence suggests no differences between treatment combinations including both an NK₁ inhibitor and a 5‐HT₃ inhibitor, and a corticosteroid.
We identified no evidence of a difference between direct and indirect estimates in the only closed loop for aprepitant plus granisetron versus granisetron versus palonosetron (P = 0.7668 ) (see Supplementary Figure 10).
Overall phase (0 to 120 hours)
No nausea in the overall phase was reported in 22 studies including 14,588 participants and comparing a total of 14 treatment regimens. We could include all studies in NMA, and the network was fully connected (see Supplementary Figure 11). Results for all network comparisons, including ranking of treatments, are shown in Supplementary Figures 12 and 13. We observed no heterogeneity (I² = 0%) between studies in the network. More participants treated with fosaprepitant plus palonosetron experienced no nausea in the overall phase than participants treated with fosaprepitant plus granisetron (RR 1.43, 95% CI 1.10 to 1.85), aprepitant plus granisetron (RR 1.46, 95% CI 1.12 to 1.90), netupitant plus palonosetron (RR 1.52, 95% CI 1.13 to 2.05), fosaprepitant plus ondansetron (RR 1.62, 95% CI 1.20 to 2.19), aprepitant plus ondansetron (RR 1.68, 95% CI 1.23 to 2.30), and casopitant plus ondansetron (RR 1.83, 95% CI 1.29 to 2.60). Furthermore, evidence suggests that more participants treated with fosnetupitant plus granisetron experience no nausea in the overall phase than participants treated with casopitant plus ondansetron (RR 1.52, 95% CI 1.05 to 2.20); and that more participants treated with rolapitant plus granisetron (RR 1.40, 95% CI 1.02 to 1.93) and fosaprepitant plus granisetron (RR 1.28, 95% CI 1.01 to 1.62) achieve no nausea in the overall phase than participants treated with casopitant plus ondansetron, respectively. Evidence suggests no differences between treatment combinations including both an NK₁ inhibitor and a 5‐HT₃ inhibitor, and a corticosteroid.
We rated the certainty of evidence for all treatments when compared to aprepitant plus granisetron according to the GRADE system. Using actual reported event rates, we estimated that 896 of 1000 participants achieve complete control of nausea in the overall phase when treated with aprepitant plus granisetron. When compared to treatment with aprepitant plus granisetron, treatment with fosaprepitant plus palonosetron (moderate certainty) probably results in a large increase in complete control of nausea in the overall phase (moderate certainty); treatment with fosnetupitant plus palonosetron (moderate certainty) or rolapitant plus granisetron (moderate certainty) probably increases complete control of nausea in the overall phase; and treatment with ezlopitant plus granisetron may increase complete control of nausea in the overall phase (low certainty). When compared to treatment with aprepitant plus granisetron, treatment with fosaprepitant plus granisetron (high certainty) or netupitant plus palonosetron (high certainty) has little to no effect on complete control of nausea in the overall phase, and treatment with rolapitant plus ondansetron (moderate certainty) likely results in little to no difference. When compared to treatment with aprepitant plus granisetron, treatment with fosaprepitant plus ondansetron (moderate certainty), aprepitant plus ondansetron (moderate certainty), or casopitant plus ondansetron (moderate certainty) probably decreases control of nausea in the overall phase. Our main reasons for downgrading were serious study limitations due to risk of bias and serious or very imprecision. We provide reasons for downgrading per assessment in Table 3.
| Antiemetics for adults for prevention of nausea and vomiting caused by highly emetogenic chemotherapy | ||||||
| Patient or population: adult cancer patients at risk for CINV caused by highly emetogenic chemotherapy Settings: inpatient and outpatient care Intervention: neurokinin‐1 (NK₁) receptor antagonist and 5‐hydroxytryptamine‐3 (5‐HT₃) receptor antagonists + corticosteroid Comparison: aprepitant (NK₁) combined with granisetron (5‐HT₃) + corticosteroid Outcome: complete control of nausea during the overall phase (0 to 120 h of treatment with chemotherapy) RR < 1 indicates an advantage for the intervention Combinations of these interventions at any dose and by any route as mentioned above have been compared to one another in a full network | ||||||
| Interventions (corticosteroids included in all regimens)a | Illustrative comparative risks* (95% CI) | Risk ratio | No. of participants | Certainty of the evidence | Comments | |
| Assumed risk with aprepitant + granisetron | Corresponding risk with the intervention | |||||
| fosaprepitant + palonosetron | 896 of 1000 | NE of 1000 (NE to NE) | RR 1.46 | 14,588 (22) | ⊕⊕⊕⊝ moderateb | Fosaprepitant + palonosetron probably results in a large increase in complete control of nausea in the overall phase when compared with aprepitant + granisetron |
| fosnetupitant + palonosetron | 896 of 1000 | NE of 1000 (851 to NE) | RR 1.21 | 14,588 (22) | ⊕⊕⊕⊝ moderatec | Fosnetupitant + palonosetron probably increases complete control of nausea in the overall phase when compared with aprepitant + granisetron |
| ezlopitant + granisetron | 896 of 1000 | NE of 1000 (554 to NE) | RR 1.31 | 14,588 (22) | ⊕⊕⊝⊝ lowd | Ezlopitant + granisetron may increase complete control of nausea in the overall phase when compared with aprepitant + granisetron |
| rolapitant + granisetron | 896 of 1000 | NE of 1000 (860 to NE) | RR 1.12 | 14,588 (22) | ⊕⊕⊕⊝ moderatec | Rolapitant + granisetron probably increases complete control of nausea in the overall phase when compared with aprepitant + granisetron |
| fosaprepitant + granisetron | 896 of 1000 | 914 of 1000 (780 to NE) | RR 1.02 | 14,588 (22) | ⊕⊕⊕⊕ high | Fosaprepitant + granisetron has little to no effect on complete control of nausea in the overall phase when compared with aprepitant + granisetron |
| rolapitant + ondansetron | 896 of 1000 | 860 of 1000 (591 to NE) | RR 0.96 | 14,588 (22) | ⊕⊕⊕⊝ moderatec | Rolapitant + ondansetron probably decreases complete control of nausea slightly in the overall phase when compared with aprepitant + granisetron |
| netupitant + palonosetron | 896 of 1000 | 860 of 1000 (753 to 986) | RR 0.96 | 14,588 (22) | ⊕⊕⊕⊕ high | Netupitant + palonosetron has little to no effect on complete control of nausea in the overall phase when compared with aprepitant + granisetron |
| fosaprepitant + ondansetron | 896 of 1000 | 806 of 1000 (645 to NE) | RR 0.90 | 14,588 (22) | ⊕⊕⊕⊝ moderatec | Fosaprepitant + ondansetron probably decreases complete control of nausea slightly in the overall phase when compared with aprepitant + granisetron |
| aprepitant + ondansetron | 896 of 1000 | 780 of 1000 (609 to NE) | RR 0.87 | 14,588 (22) | ⊕⊕⊕⊝ moderatec | Aprepitant + ondansetron probably decreases complete control of nausea in the overall phase when compared with aprepitant + granisetron |
| casopitant + ondansetron | 896 of 1000 | 717 of 1000 (538 to 950) | RR 0.80 | 14,588 (22) | ⊕⊕⊕⊝ moderatec | Casopitant + ondansetron probably decreases complete control of nausea in the overall phase when compared with aprepitant + granisetron |
| *Basis for the assumed risk is actual event rates reported for the main comparator summed across studies: 412 of 460 (89.6%) participants treated with aprepitant + granisetron experienced no nausea during the overall phase (aprepitant + granisetron was used in 5 studies reporting the outcome). The corresponding risk (and its 95% confidence interval) is based on the assumed risk in the comparison group and the risk ratio of the intervention (and its 95% CI). | ||||||
| GRADE Working Group grades of evidence. Moderate certainty: we are moderately confident in the effect estimate: the true effect is likely to be close to the estimate of effect, but there is a possibility that it is substantially different. Low certainty: our confidence in the effect estimate is limited: the true effect may be substantially different from the estimate of the effect. Very low certainty: we have very little confidence in the effect estimate: the true effect is likely to be substantially different from the estimate of effect. | ||||||
| aEither dexamethasone or methylprednisolone was used in all treatment regimens. bDowngraded once for serious study limitations due to high risk of bias. cDowngraded once for serious imprecision because 95% CIs cross unity and confidence intervals are wide. dDowngraded twice for very serious imprecision because wide confidence intervals suggest both a potentially substantial harm and benefit for the intervention. | ||||||
We identified no evidence for a difference between direct and indirect estimates for both closed loops within this network (see Supplementary Figure 14).
Subgroup analyses
We were able to conduct the following two subgroup analyses.
Type of chemotherapy (cisplatin versus other HEC)
Cisplatin was used for chemotherapy in 16 trials including 9421 participants and comparing a total of 14 treatment regimens. Because of limited direct evidence, not all treatments in the network were connected through direct comparisons but treatments were split into two sub‐networks (figures available from study authors upon request). Sub‐network 1 included ten studies and compared nine treatments versus another. We observed no heterogeneity between studies in this sub‐network. Sub‐network 2 included six studies and compared five treatments versus another. We observed moderate heterogeneity (I² = 48%) between studies in this sub‐network. In subgroup analysis, including cisplatin chemotherapy only, evidence suggests no robust advantage for fosaprepitant plus palonosetron when compared to fosaprepitant plus granisetron (RR 1.49, 95% CI 0.89 to 2.50), aprepitant plus granisetron (RR 1.44, 95% CI 0.92 to 2.27), or netupitant plus palonosetron (RR 1.51, 95% CI 0.94 to 2.41), respectively. Confidence intervals of the effect estimates were widely overlapping, and we identified no evidence of a difference. Despite the split network, we did not identify any further differences in direction and extent of effect in subgroup analysis between treatments including both an NK₁ inhibitor and a 5‐HT₃ inhibitor, and a corticosteroid.
Type of cancer (solid versus other)
Seventeen trials included only participants with solid tumours (n = 10,555) and compared 13 treatment regimens. We could include all studies in NMA, and the network was fully connected (figures available from study authors upon request). We observed no heterogeneity between studies in the network. In subgroup analysis, including participants with solid tumours only, evidence suggests no robust advantage for fosaprepitant plus palonosetron when compared with fosaprepitant plus granisetron (RR 1.40, 95% CI 0.85 to 2.31), aprepitant plus granisetron (RR 1.38, 95% CI 0.89 to 2.15), netupitant plus palonosetron (RR 1.44, 95% CI 0.91 to 2.29), fosaprepitant plus ondansetron (RR 1.59, 95% CI 0.95 to 2.68), casopitant plus ondansetron (RR 1.66, 95% CI 0.95 to 2.68), or aprepitant plus ondansetron (RR 1.66, 95% CI 0.98 to 2.81), respectively. Further, evidence from subgroup analysis suggests no robust advantage of fosnetupitant plus palonosetron (RR 1.30, 95% CI 0.79 to 2.15), rolapitant plus granisetron (RR 1.19, 95% CI 0.75 to 1.88), or fosaprepitant plus granisetron (RR 1.18, 95% CI 0.91 to 1.53), when compared with casopitant plus ondansetron, respectively. Confidence intervals of the effect estimates were widely overlapping, and we identified no evidence of a difference. We did not identify further differences in direction and extent of effect in subgroup analysis between treatments including both an NK₁ inhibitor and a 5‐HT₃ inhibitor, and a corticosteroid.
Sensitivity analyses
We included in risk of bias (RoB) sensitivity analysis 21 studies with low risk of bias including 13,942 participants and comparing a total of 14 treatment regimens. We could include all studies in NMA, and the network was fully connected (not shown). We observed low heterogeneity (I² = 4.3%) between studies in the network. We did not identify differences in direction and extent of effect in sensitivity analysis compared to the full analysis set.
Complete control of vomiting
We defined complete control of vomiting as no vomiting and no use of rescue medicine. This outcome was usually referred to in the studies as complete response (CR); hereafter we refer to it as CR.
Acute phase (0 to 24 hours)
CR in the acute phase was reported in 41 studies (40 two‐arm studies, one three‐arm study) including 22,400 participants and comparing a total of 18 treatment regimens. The network was not fully connected and consists of two sub‐networks (see Supplementary Figure 15). We performed NMA only for Sub‐network 1, as Sub‐network 2 consisted of only one pair‐wise comparison (Li 2019). Briefly, Li 2019 included 100 participants and compared aprepitant plus tropisetron versus tropisetron. Evidence suggest higher CR in the acute phase for aprepitant plus tropisetron compared to tropisetron (RR 1.24, 95% CI 1.03 to 1.49).
We could include in NMA 40 studies reporting on 22,300 participants and comparing 16 treatment regimens. Results for all network comparisons within Sub‐network 1, including ranking of treatments, are shown in Supplementary Figures 16 and 17. We observed low heterogeneity (I² = 5.6%) between studies in the sub‐network. Fosnetupitant plus palonosetron (RR 1.15, 95% CI 1.05 to 1.27), fosaprepitant plus palonosetron (RR 1.14, 95% CI 1.06 to 1.24), aprepitant plus ramosetron (RR 1.13, 95% CI 1.05 to 1.20), fosaprepitant plus granisetron (RR 1.12, 95% CI 1.04 to 1.20), rolapitant plus granisetron (RR 1.12, 95% CI 1.02 to 1.23), aprepitant plus granisetron (RR 1.11, 95% CI 1.04 to 1.18), aprepitant plus palonosetron (RR 1.11, 95% CI 1.03 to 1.18), fosaprepitant plus ondansetron (RR 1.09, 95% CI 1.03 to 1.16), netupitant plus palonosetron (RR 1.09, 95% CI 1.02 to 1.16), and aprepitant plus ondansetron (RR 1.08, 95% CI 1.03 to 1.14) show higher CR in the acute phase than casopitant plus ondansetron, respectively. Evidence suggests no other differences between treatments including both an NK₁ inhibitor and a 5‐HT₃ inhibitor, and a corticosteroid.
We identified no evidence of a difference between direct and indirect estimates (see Supplementary Figure 18).
Delayed phase (24 to 120 hours)
CR in the delayed phase was reported in 38 studies (37 two‐arm studies, one three‐arm study) including 21,663 participants and comparing a total of 17 treatment regimens. However, the network was not fully connected and consists of two sub‐networks (see Supplementary Figure 19). We performed NMA only for Sub‐network 1, as Sub‐network 2 consisted of only one pair‐wise comparison (Li 2019). Briefly, Li 2019 included 100 participants and compared aprepitant plus tropisetron versus tropisetron. Evidence suggests higher CR in the delayed phase for aprepitant plus tropisetron compared to tropisetron (RR 1.67, 95% CI 1.21 to 2.30).
We could include in NMA 37 studies reporting on 21,563 participants and comparing 15 treatment regimens. Results for all network comparisons within Sub‐network 1, including ranking of treatments, are shown in Supplementary Figures 20 and 21. We observed moderate heterogeneity (I² = 42.8%) between studies in the sub‐network. Evidence suggests no differences between treatments including both an NK₁ inhibitor and a 5‐HT₃ inhibitor, and a corticosteroid.
We rated the certainty of evidence for all treatments when compared to aprepitant plus granisetron according to the GRADE system. Using actual reported event rates, we estimated that 694 of 1000 participants achieve complete control of vomiting (CR) in the delayed phase when treated with aprepitant plus granisetron. When compared to treatment with aprepitant plus granisetron, treatment with fosnetupitant plus palonosetron may increase CR in the delayed phase (low certainty). Fosaprepitant plus granisetron (moderate certainty) or netupitant plus palonosetron (moderate certainty) probably results in little to no difference in CR in the delayed phase when compared to aprepitant plus granisetron. Treatment with rolapitant plus granisetron (low certainty), fosaprepitant plus ondansetron (low certainty), or casopitant plus ondansetron (low certainty) may reduce CR in the delayed phase, when compared to aprepitant plus granisetron. Evidence is very uncertain about the effects of fosaprepitant plus palonosetron (very low certainty), aprepitant plus palonosetron (very low certainty), aprepitant plus ramosetron (very low certainty), aprepitant plus ondansetron (very low certainty), and rolapitant plus ondansetron (very low certainty) on CR in the delayed phase when compared to aprepitant plus granisetron. Our main reasons for downgrading were serious study limitations due to risk of bias, moderate inconsistency, and serious imprecision. We provide reasons for downgrading per assessment in Table 4.
| Antiemetics for adults for prevention of nausea and vomiting caused by highly emetogenic chemotherapy | ||||||
| Patient or population: adult cancer patients at risk for CINV caused by highly emetogenic chemotherapy Settings: inpatient and outpatient care Intervention: neurokinin‐1 (NK₁) receptor antagonist and 5‐hydroxytryptamine‐3 (5‐HT₃) receptor antagonists + corticosteroid Comparison: aprepitant (NK₁) combined with granisetron (5‐HT₃) + corticosteroid Outcome: complete control of vomiting during the delayed phase (24 to 120 h of treatment with chemotherapy) RR > 1 indicates an advantage for the intervention Combinations of these interventions at any dose and by any route as mentioned above have been compared to one another in a full network | ||||||
| Interventions (corticosteroids included in all regimens)a | Illustrative comparative risks* (95% CI) | Risk ratio | No. of participants | Certainty of the evidence | Comments | |
|---|---|---|---|---|---|---|
| Assumed risk aprepitant + granisetron | Corresponding risk with the intervention | |||||
| fosnetupitant + palonosetron | 694 of 1000 | 784 of 1000 (632 to 972) | RR 1.13 | 21,563 (37) | ⊕⊕⊝⊝ lowb,c | Fosnetupitant + palonosetron may increase complete control of vomiting in the delayed phase when compared to aprepitant + granisetron |
| fosaprepitant + palonosetron | 694 of 1000 | 736 of 1000 (632 to 854) | RR 1.06 | 21,563 (37) | ⊕⊝⊝⊝ very lowb,c,d | Evidence is very uncertain about the effect of fosaprepitant + palonosetron on complete control of vomiting in the delayed phase when compared to aprepitant + granisetron |
| aprepitant + palonosetron | 694 of 1000 | 722 of 1000 (652 to 798) | RR 1.04 | 21,563 (37) | ⊕⊝⊝⊝ very lowb,c,d | Evidence is very uncertain about the effect of aprepitant + palonosetron on complete control of vomiting in the delayed phase when compared to aprepitant + granisetron |
| aprepitant + ramosetron | 694 of 1000 | 722 of 1000 (625 to 1.21) | RR 1.04 | 21,563 (37) | ⊕⊝⊝⊝ very lowb,c,d | Evidence is very uncertain about the effect of aprepitant + ramosetron on complete control of vomiting in the delayed phase when compared to aprepitant + granisetron |
| fosaprepitant + granisetron | 694 of 1000 | 701 of 1000 (632 to 770) | RR 1.01 | 21,563 (37) | ⊕⊕⊕⊝ moderateb | Fosaprepitant + granisetron probably has little to no effect on complete control of vomiting in the delayed phase when compared to aprepitant + granisetron |
| netupitant + palonosetron | 694 of 1000 | 687 of 1000 (618 to 763) | RR 0.99 | 21,563 (37) | ⊕⊕⊕⊝ moderateb | Netupitant + palonosetron probably has little to no effect on complete control of vomiting in the delayed phase when compared to aprepitant + granisetron |
| aprepitant + ondansetron | 694 of 1000 | 645 of 1000 (576 to 722) | RR 0.93 | 21,563 (37) | ⊕⊝⊝⊝ very lowb,c,d | Evidence is very uncertain about the effect of aprepitant + ondansetron on complete control of vomiting in the delayed phase when compared to aprepitant + granisetron |
| rolapitant + granisetron | 694 of 1000 | 632 of 1000 (541 to 736) | RR 0.91 | 21,563 (37) | ⊕⊕⊝⊝ lowb,c | Rolapitant + granisetron may decrease complete control of vomiting in the delayed phase when compared to aprepitant + granisetron |
| fosaprepitant + ondansetron | 694 of 1000 | 632 of 1000 (548 to 722) | RR 0.91 | 21,563 (37) | ⊕⊕⊝⊝ lowb,c | Fosaprepitant + ondansetron may decrease complete control of vomiting in the delayed phase when compared to aprepitant + granisetron |
| casopitant + ondansetron | 694 of 1000 | 618 of 1000 (507 to 756) | RR 0.89 | 21,563 (37) | ⊕⊕⊝⊝ lowb,c | Casopitant + ondansetron may decrease complete control of vomiting in the delayed phase when compared to aprepitant + granisetron |
| rolapitant + ondansetron | 694 of 1000 | 583 of 1000 (437 to 784) | RR 0.84 (0.63 to 1.13) | 21,563 (37) | ⊕⊝⊝⊝ very lowb,c,d | Evidence is very uncertain about the effect of rolapitant + ondansetron on complete control of vomiting in the delayed phase when compared to aprepitant + granisetron |
| *Basis for the assumed risk is actual event rates reported for the main comparator summed across studies: 1537 of 2215 (69.4%) participants treated with aprepitant + granisetron achieved complete response during the delayed phase (aprepitant + granisetron was used in 10 studies reporting the outcome). The corresponding risk (and its 95% confidence interval) is based on the assumed risk in the comparison group and the risk ratio of the intervention (and its 95% CI). | ||||||
| GRADE Working Group grades of evidence. Moderate certainty: we are moderately confident in the effect estimate: the true effect is likely to be close to the estimate of effect, but there is a possibility that it is substantially different. Low certainty: our confidence in the effect estimate is limited: the true effect may be substantially different from the estimate of the effect. Very low certainty: we have very little confidence in the effect estimate: the true effect is likely to be substantially different from the estimate of effect. | ||||||
| aEither dexamethasone or methylprednisolone was used in all treatment regimens. bDowngraded once for moderate inconsistency. cDowngraded once for serious imprecision because 95% CIs cross unity and confidence intervals are wide. dDowngraded once for serious study limitations due to high risk of bias. | ||||||
We identified no evidence of a difference between direct and indirect estimates (see Supplementary Figure 22).
Overall phase (0 to 120 hours)
CR in the overall phase was reported in 39 studies (38 two‐arm studies, one three‐arm study) including 21,642 participants and comparing a total of 17 treatment regimens. However, the network was not fully connected and consists of two sub‐networks (Figure 4 and Supplementary Figure 23). We performed NMA only for Sub‐network 1, as Sub‐network 2 consisted of only one pair‐wise comparison (Li 2019). Briefly, Li 2019 included 100 participants and compared aprepitant plus tropisetron versus tropisetron. Evidence suggests higher CR in the overall phase for aprepitant plus tropisetron compared to tropisetron (RR 1.67, 95% CI 1.21 to 2.30).
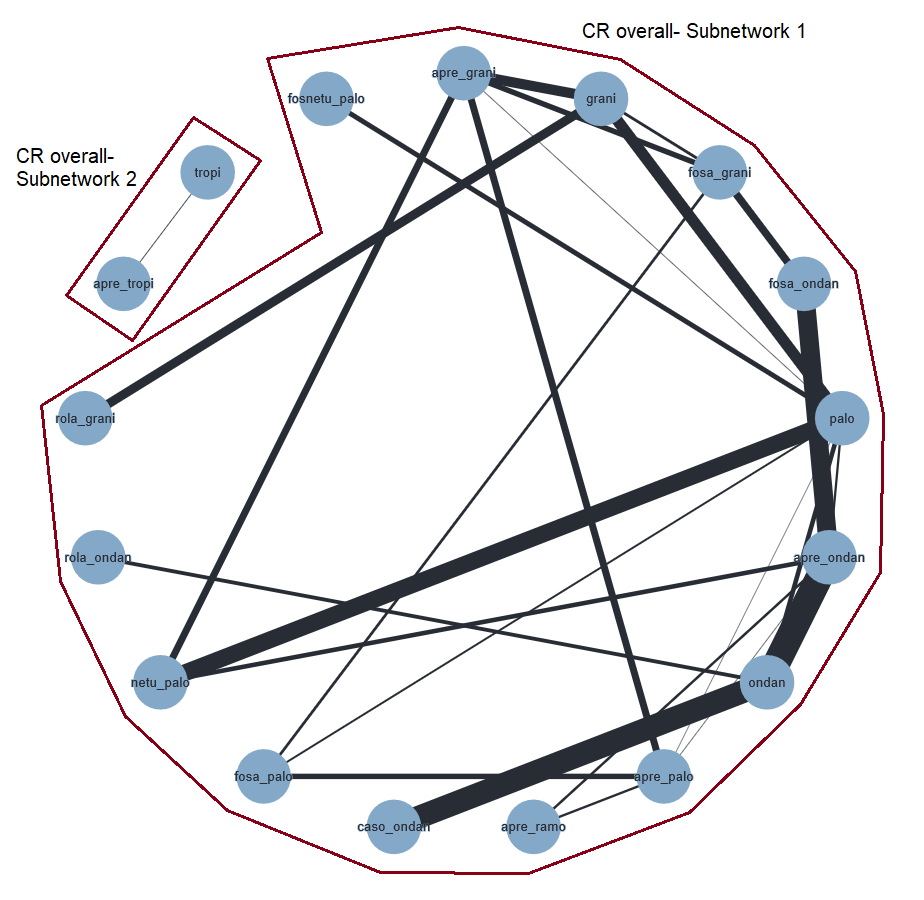
Network graph for the outcome complete control of vomiting in the overall phase (HEC).
A line connects any two treatments when there is at least one study comparing the two treatments. Line width: number of patients.
A list of treatment abbreviations is provided in Table 1; all treatments included a corticosteroid.
We included in NMA 38 studies comprising 21,542 participants and a total of 15 treatment regimens. Results for all network comparisons within Sub‐network 1, including ranking of treatments, are shown in Figure 5 and Figure 6 and in Supplementary Figures 24 and 25. We observed low heterogeneity (I² = 11.7%) between studies in the sub‐network. Evidence suggests that more people treated with fosnetupitant plus palonosetron achieve CR in the overall phase than people treated with aprepitant plus ondansetron (RR 1.20, 95% CI 1.01 to 1.43), fosaprepitant plus ondansetron (RR 1.23, 95% CI 1.02 to 1.47), casopitant plus ondansetron (RR 1.28, 95% CI 1.05 to 1.56), and rolapitant plus granisetron (RR 1.29, 95% CI 1.06 to 1.59), respectively. Aprepitant plus palonosetron shows higher CR in the overall phase than aprepitant plus ondansetron (RR 1.12, 95% CI 1.01 to 1.24), fosaprepitant plus ondansetron (RR 1.14, 95% CI 1.02 to 1.28), casopitant plus ondansetron (RR 1.19, 95% CI 1.03 to 1.37), and rolapitant plus granisetron (RR 1.20, 95% CI 1.03 to 1.40), respectively. Treatment with aprepitant plus ramosetron shows higher CR in the overall phase than treatment with casopitant plus ondansetron (RR 1.19, 95% CI 1.03 to 1.38) and rolapitant plus granisetron (RR 1.20, 95% CI 1.01 to 1.42). Treatment with fosaprepitant plus palonosetron shows higher CR in the overall phase than treatment with casopitant plus ondansetron (RR 1.18, 95% CI 1.01 to 1.38) and rolapitant plus granisetron (RR 1.20, 95% CI 1.02 to 1.40). Evidence suggests no other differences between treatments including both an NK₁ inhibitor and a 5‐HT₃ inhibitor, and a corticosteroid.
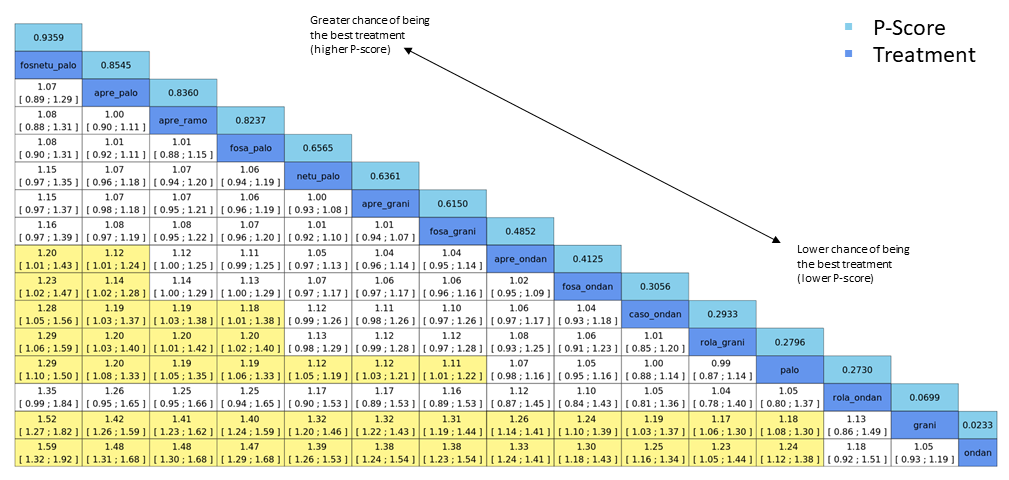
League table for the outcome complete control of vomiting in the overall phase (HEC). Network estimates with 95% CIs are given. Descending P score shows ranking of treatment options. Statistically significant results are marked in yellow. Global approach to check inconsistency/heterogeneity: Q‐statistics, I².
No. of studies: 34. No. of treatments: 14. No. of pair‐wise comparisons: 36. No. of designs: 21.
Qtotal = 23.95, df = 22, P = 0.35/Qwithin = 17.60, df = 13, P = 0.17/Qbetween = 6.34, df = 9, P = 0.71; I² = 8.1%, Tau² = 0.0005.
Treatment effects + 95% CIs (risk ratios, random‐effects model).
A list of treatment abbreviations is provided in Table 1; all treatments included a corticosteroid.

Exemplary network meta‐analysis forest plot for the outcome complete control of vomiting during the overall phase (HEC) (random‐effects model).
Aprepitant + granisetron was used as exemplary reference treatment. Ranking of treatments is ordered by P score (descending).
A list of treatment abbreviations is provided in Table 1; all treatments included a corticosteroid.
We rated the certainty of evidence for all treatments when compared to aprepitant plus granisetron according to the GRADE system. Using actual reported event rates, we estimated that 704 of 1000 participants achieve complete control of vomiting (CR) in the overall phase when treated with aprepitant plus granisetron. When compared to treatment with aprepitant plus granisetron, treatment with fosnetupitant plus palonosetron probably increases CR in the overall phase. When compared to treatment with aprepitant plus granisetron, treatment with aprepitant plus palonosetron (low certainty), aprepitant plus ramosetron (low certainty), and fosaprepitant plus palonosetron (low certainty) may result in a slight increase in CR in the overall phase. When compared to treatment with aprepitant plus granisetron, treatment with netupitant plus palonosetron (high certainty) or fosaprepitant plus granisetron (high certainty) results in little to no difference in CR in the overall phase. Treatment with aprepitant plus ondansetron (low certainty) or treatment with fosaprepitant plus ondansetron (low certainty) may result in a slight decrease in CR in the overall phase, when compared to treatment with aprepitant plus granisetron. Treatment with casopitant plus ondansetron (low certainty) or rolapitant plus ondansetron (low certainty) may decrease, and treatment with rolapitant plus granisetron (moderate certainty) probably decreases, CR in the overall phase when compared to aprepitant plus granisetron. Our main reasons for downgrading were serious study limitations due to risk of bias and serious imprecision. We provide reasons for downgrading per assessment in summary of findings Table 1.
We identified no evidence of a difference between direct and indirect estimates (Figure 7 and Supplementary Figure 26).

Comparison of direct and indirect evidence (in closed loops) for the outcome complete control of vomiting in the overall phase (HEC). CI: confidence interval; RR: risk ratio.
A list of treatment abbreviations is provided in Table 1; all treatments included a corticosteroid.
Subgroup analyses
We were able to conduct the following three subgroup analyses.
Type of chemotherapy (cisplatin versus other HEC)
Cisplatin was used for chemotherapy in 19 trials including 11,637 participants and comparing a total of 12 treatment regimens. All trials could be included in NMA, and the network was fully connected (not shown). We observed low heterogeneity (I² = 10%) between studies in the network. In subgroup analysis including cisplatin‐based chemotherapy only, evidence suggests no robust advantage for fosnetupitant plus palonosetron when compared with aprepitant plus ondansetron (RR 1.29, 95% CI 0.99 to 1.44) or fosaprepitant plus ondansetron (RR 1.20, 95% CI 0.96 to 1.47), respectively. Evidence further suggests no robust advantage for fosaprepitant plus palonosetron when compared with casopitant plus ondansetron (RR 1.18, 95% CI 0.96 to 1.45); nor for aprepitant plus palonosetron when compared with aprepitant plus ondansetron (RR 1.07, 95% CI 0.92 to 1.25), fosaprepitant plus ondansetron (RR 1.08, 95% CI 0.91 to 1.28), or casopitant plus ondansetron (RR 1.16, 95% CI 0.95 to 1.42), respectively. Confidence intervals of the effect estimates were widely overlapping, and we identified no evidence of a difference. We did not identify further differences in direction and extent of effect in subgroup analysis between treatments including both an NK₁ inhibitor and a 5‐HT₃ inhibitor, and a corticosteroid.
Type of cancer (breast cancer versus other)
Eight trials included only participants with breast cancer (n = 5162) and compared ten treatment regimens. The network was not fully connected and consisted of three sub‐networks (figures available from study authors upon request). Sub‐network 1 included six studies and compared six treatments versus another. We observed no heterogeneity between studies in this sub‐network. Sub‐network 2 and Sub‐network 3 each included one study and, respectively, compared two treatments versus another. In comparison to the full analysis set, none of the comparisons of treatments including both an NK₁ inhibitor and a 5‐HT₃ inhibitor demonstrated any evidence of a difference between comparisons. Confidence intervals of the effect estimates for both analyses were widely overlapping.
Type of cancer (solid (excluding breast cancer) versus other)
Twenty‐five trials included only participants with solid tumours (excluding breast cancer) (n = 13,716) and compared 14 treatment regimens. We could include all studies in NMA, and the network was fully connected (figures available from study authors upon request). We observed low heterogeneity (I² = 29.7%) between studies in the network. In comparison to the full analysis set, none of the comparisons of treatments including both an NK₁ inhibitor and a 5‐HT₃ inhibitor demonstrated any evidence of a difference between comparisons. Confidence intervals of the effect estimates for both analyses were widely overlapping.
Sensitivity analyses
We included 30 studies with low risk of bias including 20,137 participants and comparing a total of 14 treatment regimens in RoB sensitivity analysis. We could include all studies in NMA, and the network was fully connected (figures available from study authors upon request). We observed low heterogeneity (I² = 27.1%) between studies in the network. When only studies at low risk of bias are considered in NMA, evidence suggests no robust advantage of fosnetupitant plus palonosetron when compared with aprepitant plus ondansetron (RR 1.21, 95% CI 0.99 to 1.46) or fosaprepitant plus ondansetron (RR 1.23, 95% CI 1.00 to 1.51), respectively. Further, evidence suggests no robust advantage for aprepitant plus palonosetron when compared with aprepitant plus ondansetron (RR 1.12, 95% CI 0.97 to 1.30), fosaprepitant plus ondansetron (RR 1.14, 95% CI 0.98 to 1.33), or casopitant plus ondansetron (RR 1.19, 95% CI 1.00 to 1.43), respectively. Sensitivity analysis also suggests no robust advantage for fosaprepitant plus palonosetron when compared with casopitant plus ondansetron (RR 1.18, 95% CI 0.99 to 1.42). However, we identified no evidence of a difference in direction or estimates of effect between the full analysis set and studies with low risk of bias for treatments including both an NK₁ inhibitor and a 5‐HT₃ inhibitor, and a corticosteroid.
Quality of life
No impairment in quality of life
We reported and extracted this endpoint as number of participants with no impairment in quality of life (QoL).
QoL was reported in 16 studies (all two‐arm studies) including 8264 participants and comparing a total of 13 treatment regimens. All studies used the Functional Life Index‐Emesis (FLIE) to assess impairment in quality of life. The network was not fully connected and consisted of three sub‐networks (see Supplementary Figure 27). We performed NMA only for Sub‐network 1, as Sub‐networks 2 and 3 consisted of only one pair‐wise comparison (Kang 2020; Li 2019). Briefly, Li 2019 included 100 participants and compared aprepitant plus tropisetron versus tropisetron. Evidence suggests higher QoL for aprepitant plus tropisetron compared to tropisetron (RR 3.00, 95% CI 1.04 to 8.67). Kang 2020 included 270 participants and compared aprepitant plus palonosetron versus aprepitant plus ramosetron. Evidence suggests no differences between treatments (RR 1.01, 95% CI 0.88 to 1.17).
We could include in NMA 14 studies reporting on 7894 participants and comparing nine treatment regimens. Results for all network comparisons within Sub‐network 1, including ranking of treatments, are shown in Supplementary Figures 28 and 29. We observed substantial heterogeneity (I² = 78.1%) between studies in the sub‐network. Evidence suggests no differences in QoL between treatments including both an NK₁ inhibitor and a 5‐HT₃ inhibitor, and a corticosteroid.
We rated the certainty of evidence for all treatments when compared to aprepitant plus granisetron according to the GRADE system. Using actual reported event rates, we estimated that 714 of 1000 participants have no impairment in quality of life when treated with aprepitant plus granisetron. When compared to aprepitant plus granisetron, the evidence is very uncertain about the effects of rolapitant plus ondansetron (very low certainty), netupitant plus palonosetron (very low certainty), casopitant plus ondansetron (very low certainty), rolapitant plus granisetron (very low certainty), and aprepitant plus ondansetron (very low certainty) on QoL. Our main reasons for downgrading were serious study limitations due to risk of bias, inconsistency, and imprecision. We provide reasons for downgrading per assessment in Table 5.
| Antiemetics for adults for prevention of nausea and vomiting caused by highly emetogenic chemotherapy | ||||||
| Patient or population: adult cancer patients at risk for CINV caused by highly emetogenic chemotherapy Settings: inpatient and outpatient care Intervention: neurokinin‐1 (NK₁) receptor antagonist and 5‐hydroxytryptamine‐3 (5‐HT₃) receptor antagonists + corticosteroid Comparison: aprepitant (NK₁) combined with granisetron (5‐HT₃) + corticosteroid Outcome: no impairment in quality of life RR <1 indicates an advantage for the intervention Combinations of these interventions at any dose and by any route as mentioned above have been compared to one another in a full network | ||||||
| Interventions (corticosteroids included in all regimens)a | Illustrative comparative risks* (95% CI) | Risk ratio (95% CI) | No. of participants (studies) | Certainty of the evidence (GRADE) | Comments | |
| Assumed risk with aprepitant + granisetron | Corresponding risk with the intervention | |||||
| rolapitant + ondansetron | 714 of 1000 | 893 of 1000 (486 to 1649) | RR 1.25 | 7894 (14) | ⊕⊝⊝⊝ very lowb,c | Evidence is uncertain about the effect of rolapitant + ondansetron on quality of life when compared to aprepitant + granisetron |
| netupitant + palonosetron | 714 of 1000 | 764 of 1000 (585 to 1007) | RR 1.07 | 7894 (14) | ⊕⊝⊝⊝ very lowb,d | Evidence is uncertain about the effect of netupitant + palonosetron on quality of life when compared to aprepitant + granisetron |
| casopitant + ondansetron | 714 of 1000 | 743 of 1000 (421 to 1307) | RR 1.04 | 7894 (14) | ⊕⊝⊝⊝ very lowb,c | Evidence is uncertain about the effect of casopitant + ondansetron on quality of life when compared to aprepitant + granisetron |
| rolapitant + granisetron | 714 of 1000 | 693 of 1000 (521 to 921) | RR 0.97 | 7894 (14) | ⊕⊝⊝⊝ very lowb,d | Evidence is uncertain about the effect of rolapitant + granisetron on quality of life when compared to aprepitant + granisetron |
| aprepitant + ondansetron | 714 of 1000 | 657 of 1000 (393 to 1100) | RR 0.92 | 7894 (14) | ⊕⊝⊝⊝ very lowb,c,e | Evidence is uncertain about the effect of aprepitant + ondansetron on quality of life when compared to aprepitant + granisetron |
| *Basis for the assumed risk is actual event rates reported for the main comparator summed across studies: 569 of 797 participants treated with aprepitant + granisetron experienced no impact on QoL (aprepitant + granisetron was used in 3 studies reporting the outcome, follow‐up on Day 6). The corresponding risk (and its 95% confidence interval) is based on the assumed risk in the comparison group and the risk ratio of the intervention (and its 95% CI). | ||||||
| GRADE Working Group grades of evidence. Moderate certainty: we are moderately confident in the effect estimate: the true effect is likely to be close to the estimate of effect, but there is a possibility that it is substantially different. Low certainty: our confidence in the effect estimate is limited: the true effect may be substantially different from the estimate of the effect. Very low certainty: we have very little confidence in the effect estimate: the true effect is likely to be substantially different from the estimate of effect. | ||||||
| aEither dexamethasone or methylprednisolone was used in all treatment regimens. bDowngraded twice for high inconsistency within the network. cDowngraded twice for very serious imprecision because 95% CIs cross unity and confidence intervals are very wide, suggesting high benefit for the comparator. dDowngraded once for serious imprecision because 95% CIs cross unity and confidence intervals are wide. eDowngraded once for serious study limitations due to high risk of bias. | ||||||
As presented in Figure 27 (supplementary material), there are no closed loops in the network. Therefore, we could not statistically or visually analyse inconsistencies between direct and indirect evidence.
Safety
Safety outcomes were not consistently reported across studies. To be able to meta‐analyse results, we could consider only those that reported the number of participants with at least one event. We could not consider cumulated events or breakdowns in degree of severity, nor further subgroups.
On‐study mortality
On‐study mortality was reported in 18 studies (17 two‐arm studies, one three‐arm study) including 10,392 participants and comparing a total of 11 treatment regimens (see Supplementary Figure 30). We had to exclude from the analysis two studies including a total of 2362 participants due to zero events because no indication is provided of the direction nor the magnitude of the relative treatment effect (Grunberg 2011; NCT01640340). Furthermore, for NMA, we broke down one study ‐ Hesketh 2014 ‐ into two independent studies, as this is a three‐arm study in which two arms did not report any events and therefore one of the three comparisons was not possible. We could include in NMA 16 studies including 8030 participants and nine treatment regimens, and the network was fully connected. Results for all network comparisons, including ranking of treatments, are shown in Supplementary Figures 31 and 32. We observed no heterogeneity (I² = 0.0%) between studies in the network. Evidence suggests no differences between treatments in on‐study mortality.
We rated the certainty of evidence for all treatments when compared to aprepitant plus granisetron according to the GRADE system. Using actual reported event rates, we estimated that 8 of 1000 participants died during the study when treated with aprepitant plus granisetron. When compared to treatment with aprepitant plus granisetron, treatment with netupitant plus palonosetron (low certainty), aprepitant plus ondansetron (low certainty), casopitant plus ondansetron (low certainty), or rolapitant plus granisetron (low certainty) may reduce on‐study mortality. When compared to treatment with aprepitant plus granisetron, treatment with rolapitant plus ondansetron may increase on‐study mortality (low certainty). Our reason for downgrading was very serious imprecision (please also see Table 6).
| Antiemetics for adults for prevention of nausea and vomiting caused by highly emetogenic chemotherapy | ||||||
| Patient or population: adult cancer patients at risk for CINV caused by highly emetogenic chemotherapy Settings: inpatient and outpatient care Intervention: neurokinin‐1 (NK₁) receptor antagonist and 5‐hydroxytryptamine‐3 (5‐HT₃) receptor antagonists + corticosteroid Comparison: aprepitant (NK₁) combined with granisetron (5‐HT₃) + corticosteroid Outcome: on‐study mortality RR < 1 indicates an advantage for the intervention Combinations of these interventions at any dose and by any route as mentioned above have been compared to one another in a full network | ||||||
| Interventions (corticosteroids included in all regimens)a | Illustrative comparative risks* (95% CI) | Risk ratio (95% CI) | No. of participants (studies) | Certainty of the evidence (GRADE) | Comments | |
| Assumed risk with aprepitant + granisetron | Corresponding risk with the intervention | |||||
| netupitant + palonosetron | 8 of 1000 | 2 of 1000 (0 to 19) | RR 0.29 | 8030 (16) | ⊕⊕⊝⊝ lowb | Netupitant + palonosetron may have little to no effect on on‐study mortality when compared with aprepitant + granisetron |
| aprepitant + ondansetron | 8 of 1000 | 5 of 1000 (1 to 35) | RR 0.57 | 8030 (16) | ⊕⊕⊝⊝ lowb | Aprepitant + ondansetron may have little to no effect on on‐study mortality when compared with aprepitant + granisetron |
| casopitant + ondansetron | 8 of 1000 | 5 of 1000 (1 to 44) | RR 0.65 | 8030 (16) | ⊕⊕⊝⊝ lowb | Casopitant + ondansetron may have little to no effect on on‐study mortality when compared with aprepitant + granisetron |
| rolapitant + granisetron | 8 of 1000 | 5 of 1000 (1 to 33) | RR 0.66 | 8030 (16) | ⊕⊕⊝⊝ lowb | Rolapitant + granisetron may have little to no effect on on‐study mortality when compared with aprepitant + granisetron |
| rolapitant + ondansetron | 8 of 1000 | 12 of 1000 (1 to 216) | RR 1.56 | 8030 (16) | ⊕⊕⊝⊝ lowb | Rolapitant + ondansetron may have little to no effect on on‐study mortality when compared with aprepitant + granisetron |
| *Basis for the assumed risk is actual event rates reported for the main comparator summed across studies: 7 of 844 (0.08%) participants treated with aprepitant + granisetron died during the study (aprepitant + granisetron was used in 4 studies reporting the outcome, with follow‐up of up to 29 days). The corresponding risk (and its 95% confidence interval) is based on the assumed risk in the comparison group and the risk ratio of the intervention (and its 95% CI). | ||||||
| GRADE Working Group grades of evidence. Moderate certainty: we are moderately confident in the effect estimate: the true effect is likely to be close to the estimate of effect, but there is a possibility that it is substantially different. Low certainty: our confidence in the effect estimate is limited: the true effect may be substantially different from the estimate of the effect. Very low certainty: we have very little confidence in the effect estimate: the true effect is likely to be substantially different from the estimate of effect. | ||||||
| aEither dexamethasone or methylprednisolone was used in all treatment regimens. bDowngraded twice for very serious imprecision due to few events and very wide confidence intervals, suggesting potential benefit and harm for the comparator. | ||||||
We identified no evidence of a difference between direct and indirect estimates within this network (see Supplementary Figure 33).
Adverse events
Participants with at least one adverse event (AE) were reported in 20 studies (19 two‐arm studies, one three‐arm study) including 13,036 participants and comparing a total of 13 treatment regimens. We could include all studies in NMA, and the network was fully connected (see Supplementary Figure 34). Results for all network comparisons, including ranking of treatments, are shown in Supplementary Figures 35 and 36. We observed no heterogeneity (I² = 0.0%) between studies in the network. Evidence suggests similar relative risks of an AE for all treatment comparisons. However, evidence also suggests that participants treated with aprepitant plus granisetron experienced fewer AEs than participants treated with fosaprepitant plus ondansetron (RR 0.93, 95% CI 0.88 to 0.99), fosnetupitant plus palonosetron (RR 0.92, 95% CI 0.88 to 0.97), and fosaprepitant plus granisetron (RR 0.92, 95% CI 0.88 to 0.96), respectively. Evidence suggests no other differences between treatments including both an NK₁ inhibitor and a 5‐HT₃ inhibitor, and a corticosteroid.
We identified no evidence of a difference between direct and indirect estimates (see Supplementary Figure 37).
Serious adverse events
Participants with at least one serious AE (SAE) were reported in 23 studies (22 two‐arm studies, one three‐arm study) including 16,065 participants and comparing a total of 14 treatment regimens. We could not include in the analysis Cheirsilpa 2005, which included 73 participants, due to zero events. We could include 22 studies in NMA, and the network was fully connected (Figure 8 and Supplementary Figure 38). Results for all network comparisons, including ranking of treatments, are shown in Figure 9 and Figure 10 and in Supplementary Figures 39 and 40. We observed moderate heterogeneity (I² = 50.2%) between studies in the network. Evidence suggests no differences between treatment combinations.

Network graph for the outcome serious adverse events (HEC).
A line connects any 2 treatments when there is at least 1 study comparing the 2 treatments. Line width: number of patients.
A list of treatment abbreviations is provided in Table 1; all treatments included a corticosteroid.

League table for the outcome serious adverse events (HEC). Network estimates with 95% CIs are given. Descending P score shows ranking of treatment options. Statistically significant results are marked in yellow. Global approach to check inconsistency/heterogeneity: Q‐statistics, I².
No. of studies: 20. No. of treatments: 12. No. of pair‐wise comparisons: 22. No. of designs: 13.
Qtotal = 20.26, df = 9, P = 0.016/Qwithin = 16.39, df = 7, P = 0.022/Qbetween = 3.87, df = 2, P = 0.14; I² = 55.6%, Tau² = 0.1057.
Treatment effects + 95% CIs (risk ratios, random‐effects model).
A list of treatment abbreviations is provided in Table 1; all treatments included a corticosteroid.

Exemplary network meta‐analysis forest plot for the outcome serious adverse events (HEC) (random‐effects model).
Aprepitant + granisetron was used as exemplary reference treatment. Ranking of treatments is ordered by P score (descending).
A list of treatment abbreviations is provided in Table 1; all treatments included a corticosteroid.
We rated the certainty of evidence for all treatments when compared to aprepitant plus granisetron according to the GRADE system. Using actual reported event rates, we estimated that 35 of 1000 participants experience SAEs when treated with aprepitant plus granisetron. When compared to treatment with aprepitant plus granisetron, treatment with fosaprepitant plus ondansetron (low certainty), casopitant plus ondansetron (low certainty), netupitant plus palonosetron (low certainty), fosaprepitant plus granisetron (low certainty), or rolapitant plus granisetron (low certainty) may slightly reduce the risk of SAEs. When compared to treatment with aprepitant plus granisetron, evidence is very uncertain about the effects of aprepitant plus ondansetron (very low certainty), aprepitant plus ramosetron (very low certainty), fosaprepitant plus palonosetron (very low certainty), fosnetupitant plus palonosetron (very low certainty), or aprepitant plus palonosetron (very low certainty) on SAEs. Our main reasons for downgrading were serious study limitations due to risk of bias, moderate inconsistency, and serious or very serious imprecision. We provide reasons for downgrading per assessment in summary of findings Table 2.
We identified no evidence of a difference between direct and indirect estimates (Figure 11 and Supplementary Figure 41).
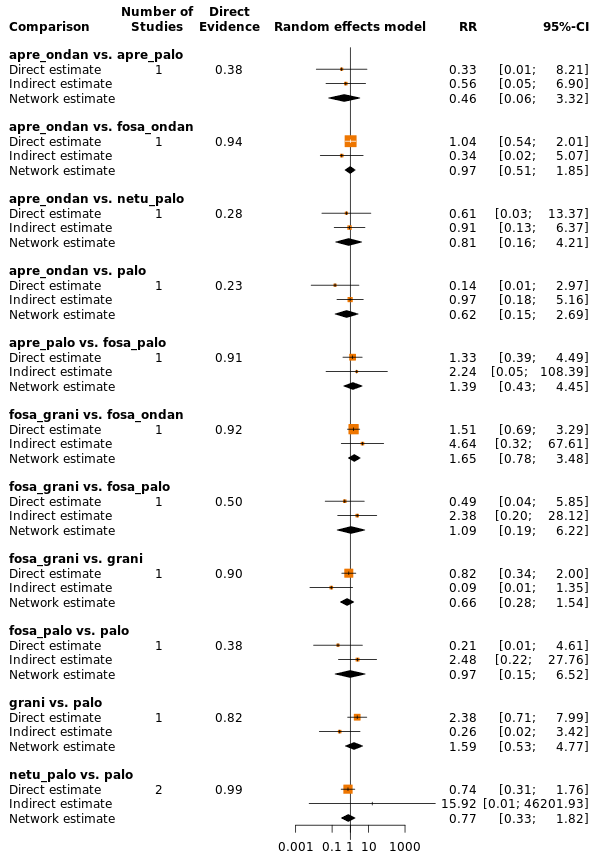
Comparison of direct and indirect evidence (in closed loops) for the outcome serious adverse events (HEC). CI: confidence interval; RR: risk ratio.
A list of treatment abbreviations is provided in Table 1; all treatments included a corticosteroid.
Neutropenia
Neutropenia was reported in 13 studies (all two‐arm studies) including 10,585 participants and comparing a total of 13 treatment regimens. However, the network was not fully connected and consists of two sub‐networks (see Supplementary Figure 42). We performed NMA for Sub‐networks 1 and 2. Results of all network comparisons within Sub‐networks 1 and 2, including ranking of treatments, are shown in Supplementary Figures 43 and 44.
We observed no heterogeneity (I² = 0.0%) between studies in Sub‐network 1. Evidence suggests that fewer participants treated with aprepitant plus ondansetron experienced neutropenia than participants treated with casopitant plus ondansetron (RR 0.35, 95% CI 0.15 to 0.84). Evidence suggests no other differences between treatments including both an NK₁ inhibitor and a 5‐HT₃ inhibitor, within Sub‐network 1.
As presented in Supplementary Figure 42, there are no closed loops in the network. Therefore, we could not statistically or visually analyse inconsistencies between direct and indirect evidence.
We could not analyse generalised heterogeneity statistic Qtotal and generalized I² statistic for Sub‐network 2. Evidence suggests no differences between treatments including both an NK₁ inhibitor and a 5‐HT₃ inhibitor, and a corticosteroid, within Sub‐network 2.
As presented in Supplementary Figure 42, there are no closed loops in Sub‐network 2. Therefore, we could not visually nor statistically analyse inconsistencies between direct and indirect evidence.
Febrile neutropenia
Febrile neutropenia was reported in 19 studies (all two‐arm studies) including 13,873 participants and comparing a total of 14 treatment regimens. We could include all studies in NMA, and the network was fully connected (see Supplementary Figure 45). Results for all network comparisons, including ranking of treatments, are shown in Supplementary Figures 46 and 47. We observed no heterogeneity (I² = 0.0%) between studies in the network. Evidence suggests no differences between treatment combinations.
As presented in Supplementary Figure 45, there are no closed loops in the network. Therefore, we could not statistically or visually analyse inconsistencies between direct and indirect evidence.
Infection
The numbers of participants experiencing any infection were reported in two pair‐wise studies including 999 participants and comparing four treatment combinations (Ishido 2016; Schnadig 2016). Treatment combinations were not connected, and we could not perform NMA (see Supplementary Figure 48) for this outcome. Ishido 2016 included 84 participants and compared aprepitant plus granisetron versus palonosetron. Evidence suggests no differences between aprepitant plus granisetron versus palonosetron (RR 6.68, 95% CI 0.36 to 125.38). Schnadig 2016 included 915 participants and compared fosaprepitant plus granisetron versus fosaprepitant plus ondansetron. Evidence also suggests no differences between fosaprepitant plus granisetron and fosaprepitant plus ondansetron (RR 1.01, 95% CI 0.36 to 2.85).
Local reaction at infusion site
The numbers of participants experiencing any reaction at the infusion site were reported in seven pair‐wise studies including 6522 participants and comparing nine treatment combinations. The network was not fully connected and consisted of three sub‐networks (available from study authors upon request). We could perform NMA for Sub‐network 1 only, as Sub‐networks 2 and 3 consisted of only pair‐wise comparisons. Results for all treatment comparisons are available from study authors upon request, including ranking of treatments for comparisons included in Sub‐network 1.
We could include four studies comparing five treatment combinations and data from 1491 participants in NMA for Sub‐network 1. We could not analyse generalised heterogeneity statistic Qtotal and generalized I² statistic for Sub‐network 1. Evidence suggests no differences between treatments including both an NK₁ inhibitor and a 5‐HT₃ inhibitor, and a corticosteroid, within Sub‐network 1.
We included data from two studies in Sub‐network 2. Grunberg 2009 and Herrstedt 2009 compared casopitant plus ondansetron versus ondansetron and included a total of 2719 participants. Results of pair‐wise meta‐analysis suggest no differences between casopitant plus ondansetron and ondansetron (RR 5.33, 95% CI 0.70 to 40.83). Sub‐network 3 consisted of only one study. Grunberg 2011 included 2312 participants and compared fosaprepitant plus ondansetron versus aprepitant plus ondansetron. Evidence suggests that participants treated with aprepitant plus ondansetron experienced fewer local reactions at the infusion site than participants treated with fosaprepitant plus ondansetron (RR 0.20, 95% CI 0.08 to 0.51).
We had planned to rate the certainty of evidence for local reactions at the infusion site according to the GRADE system for all treatment regimens compared to aprepitant plus granisetron, respectively. However, as no study reported the outcome for this treatment regimen, we could not rate the certainty of evidence for local reactions at the infusion site.
Hiccups
Hiccups were reported in 18 studies (17 two‐arm studies, one three‐arm study) including 9913 participants and comparing a total of 13 treatment regimens. The network was not fully connected and consisted of two sub‐networks (Supplementary Figure 49). We could perform NMA for Sub‐network 1 only, as Sub‐network 2 consisted of only one pair‐wise comparison. Briefly, Zhang 2020 included 646 participants and compared fosaprepitant plus palonosetron versus aprepitant plus palonosetron. Evidence suggests no differences between treatments (RR 1.17, 95% CI 0.69 to 2.0).
Results for all network comparisons included in Sub‐network 1, including ranking of treatments, are shown in Supplementary Figures 50 and 51. We observed no heterogeneity (I² = 0.0%) between studies in the network. Evidence suggests that participants treated with fosaprepitant plus granisetron (RR 0.44, 95% CI 0.24 to 0.81) and aprepitant plus granisetron (RR 0.52, 95% CI 0.29 to 0.92) experienced fewer hiccups than participants treated with rolapitant plus granisetron, respectively. Evidence suggests no other differences between treatments including both an NK₁ inhibitor and a 5‐HT₃ inhibitor, and a corticosteroid.
We identified no evidence of a difference between direct and indirect estimates (Supplementary Figure 52).
Efficacy versus acceptability
Optimal treatment should be characterised by both high efficacy and acceptability. Figure 12 and Supplementary Figure 53 illustrate concurrently an exemplary ranking of treatment combinations for the outcome CR during the overall phase, for which we chose to represent efficacy, and the outcome SAEs, for which we chose to represent acceptability. We ordered treatments by P score. Treatment combinations with both high efficacy and high acceptability are located in the upper right corner of this graph. The related league table with all network estimates (RRs and 95% CIs) is given in Figure 13 and in Supplementary Figure 54. According to this ranking, we could not identify superior treatment within this comparison. We could include in this exemplary ranking plot only treatment combinations for which data were available for both outcomes (CR during the overall phase and SAEs).

Exemplary ranking plot representing simultaneously the efficacy (x‐axis, CR during the overall phase) and the acceptability (y‐axis, SAEs) of all antiemetic regimens for patients receiving highly emetogenic chemotherapy.
Only antiemetic regimens for which data for both endpoints (CR during the overall phase and SAEs) were available are represented in the ranking plot.
A list of treatment abbreviations is provided in Table 1; all treatments included a corticosteroid.

League table with network estimates (RR with 95% CIs) of all treatment combinations for efficacy (CR during the overall phase) and acceptability (SAEs) (HEC).
Treatments are presented in alphabetical order. For efficacy, RRs > 1 favour the first treatment in alphabetical order. For safety, RRs < 1 favour the first treatment in alphabetical order.
n.a.: no data were available for this comparison
Statistically significant results are marked bold.
A list of treatment abbreviations is provided in Table 1; all treatments included a corticosteroid.
Moderately emetogenic chemotherapy (MEC)
Our objectives were to compare whether antiemetic treatment combinations including NK₁ receptor antagonists, 5‐HT₃ receptor antagonists, and corticosteroids are superior for prevention of acute, delayed, and overall CINV to treatment combinations including 5‐HT₃ receptor antagonists and corticosteroids, and to generate a clinically meaningful treatment ranking according to their safety and efficacy.
We describe all comparisons that show evidence of a difference between treatment combinations including 5‐HT₃ inhibitors and corticosteroids and treatment combinations including both an NK₁ inhibitor and a 5‐HT₃ inhibitor, and corticosteroids. All other comparisons are provided per outcome in league tables. We describe the ranking of treatments for those that appear to be most and least effective/safe. Additionally to the P score, we considered the distribution of P scores across rankings, estimated treatment effects, and confidence intervals. For a comprehensive illustration of our results in forest plots and presentation in 'Summary of findings' tables, we randomly chose granisetron as an exemplary reference treatment for MEC. However, theoretically, we could have used every treatment combination as a reference.
Efficacy
Complete control of nausea
We defined complete control of nausea as no nausea and no significant nausea, and we refer to it hereafter as "no nausea".
Acute phase (0 to 24 hours)
No nausea in the acute phase was reported in 13 studies including 4335 participants and comparing eight treatment regimens. We could include all studies in NMA, and the network was fully connected (see Supplementary Figure 55). Results for all network comparisons, including ranking of treatments, are shown in Supplementary Figures 56 and 57. We observed no heterogeneity (I² = 0.0%) between studies in the network. Evidence suggests no differences between treatment combinations including 5‐HT₃ inhibitors, and a corticosteroid versus treatment combination including both an NK₁ inhibitor and a 5‐HT₃ inhibitor, and a corticosteroid. Ranking of treatments suggests aprepitant plus palonosetron to be most effective in preventing nausea during the acute phase (P score 0.90), and aprepitant plus granisetron (P score 0.11) to be least effective.
The test for incoherence and visual examination showed no evidence of a difference between direct and indirect estimates in the only closed loop in the network (see Supplementary Figure 58).
Delayed phase (24 to 120 hours)
No nausea in the delayed phase was reported in ten studies including 4136 participants and comparing eight treatment regimens. However, the network was not fully connected and consists of two sub‐networks (see Supplementary Figure 59). We performed NMA for Sub‐networks 1 and 2. Results for all network comparisons, including ranking of treatment combinations for both sub‐networks, are shown in Supplementary Figures 60 and 61. We observed substantial heterogeneity (I² = 64.2%) between studies in Sub‐network 1. Aprepitant plus palonosetron shows higher complete control of nausea in the delayed phase than ondansetron (RR 1.63, 95% CI 1.07 to 2.47). Evidence suggests no other differences between treatment combinations including 5‐HT₃ inhibitors and a corticosteroid versus treatment combinations including both an NK₁ inhibitor and a 5‐HT₃ inhibitor, and a corticosteroid, within Sub‐network 1.
We identified no evidence of a difference between direct and indirect estimates in the only closed loop in Sub‐network 1 (see Supplementary Figure 62).
Generalised heterogeneity statistic Qtotal and generalized I² statistic could not be analysed for Sub‐network 2. Evidence suggests no differences between treatment combinations including 5‐HT₃ inhibitors and a corticosteroid versus treatment combinations including both an NK₁ inhibitor and a 5‐HT₃ inhibitor, and a corticosteroid, within Sub‐network 2.
As presented in Supplementary Figure 59, there are no closed loops in Sub‐network 2. Therefore, we could not visually nor statistically analyse inconsistencies between direct and indirect evidence.
Overall phase (0 to 120 hours)
No nausea in the overall phase was reported in ten studies including 5036 participants and comparing nine treatment regimens. However, the network was not fully connected and consists of two sub‐networks (see Supplementary Figure 63). We performed NMA for Sub‐networks 1 and 2. Results for all network comparisons, including ranking of treatment combinations for both sub‐networks, are shown in Supplementary Figures 64 and 65. We observed moderate heterogeneity (I² = 41.6%) between studies in Sub‐network 1. Aprepitant plus palonosetron shows higher complete control of nausea in the overall phase than palonosetron (RR 1.68, 95% CI 1.09 to 2.58) and ondansetron (RR 1.91, 95% CI 1.24 to 2.95), respectively. Evidence suggests no other differences between treatment combinations including 5‐HT₃ inhibitors, and a corticosteroid versus treatment combinations including both an NK₁ inhibitor and a 5‐HT₃ inhibitor, and a corticosteroid, within Sub‐network 1.
We identified no evidence of a difference between direct and indirect estimates in the only closed loops in Sub‐network 1 (see Supplementary Figure 66).
We could not analyse generalised heterogeneity statistic Qtotal and generalized I² statistic for Sub‐network 2. Evidence suggests no differences between treatment combinations including 5‐HT₃ inhibitors and a corticosteroid versus treatment combinations including both an NK₁ inhibitor and a 5‐HT₃ inhibitor, and a corticosteroid, within Sub‐network 2.
As presented in Supplementary Figure 63, there are no closed loops in Sub‐network 2. Therefore, we could not visually nor statistically analyse inconsistencies between direct and indirect evidence.
We rated the certainty of evidence for all treatments when compared to granisetron according to the GRADE system. Using actual reported event rates, we estimated that 419 of 1000 participants achieve complete control of nausea in the overall phase when treated with granisetron. When compared to treatment with granisetron, treatment with aprepitant plus granisetron likely increases complete control of nausea in the delayed phase (low certainty); treatment with rolapitant plus granisetron likely slightly increases complete control of nausea in the delayed phase (low certainty). Our main reason for downgrading was very serious imprecision (please also see Table 7).
| Antiemetics for adults for prevention of nausea and vomiting caused by moderately emetogenic chemotherapy | ||||||
| Patient or population: adult cancer patients at risk for CINV caused by moderately emetogenic chemotherapy Settings: inpatient and outpatient care Intervention:
Comparison: granisetron (5‐HT₃) + corticosteroid Outcome: complete control of nausea during the overall phase (0 to 120 h of treatment with chemotherapy) RR < 1 indicates an advantage for the intervention. Combinations of these interventions at any dose and by any route as mentioned above have been compared to one another in a full network | ||||||
| Interventions (corticosteroids included in all regimens)a | Illustrative comparative risks* (95% CI) | Risk ratio (95% CI) | No. of participants (studies) | Certainty of the evidence (GRADE) | Comments | |
| Assumed risk with granisetron | Corresponding risk with the intervention | |||||
|
|
| |||||
| aprepitant + granisetron | 419 of 1000 | 570 of 1000 (365 to 897) | RR 1.36 | 1423 (2) | ⊕⊕⊝⊝ lowb | Aprepitant + granisetron may increase complete control of nausea in the overall phase when compared with granisetron |
| rolapitant + granisetron | 419 of 1000 | 453 of 1000 (402 to 511) | RR 1.08 | 1423 (2) | ⊕⊕⊝⊝ lowc | Rolapitant + granisetron may increase complete control of nausea in the overall phase slightly when compared with granisetron |
| *Basis for the assumed risk is actual event rates reported for the main comparator summed across studies: 298 of 712 (41.9%) participants treated with granisetron experienced no nausea during the overall phase (granisetron was used in 2 studies reporting the outcome). The corresponding risk (and its 95% confidence interval) is based on the assumed risk in the comparison group and the risk ratio of the intervention (and its 95% CI). | ||||||
| GRADE Working Group grades of evidence. Moderate certainty: we are moderately confident in the effect estimate: the true effect is likely to be close to the estimate of effect, but there is a possibility that it is substantially different. Low certainty: our confidence in the effect estimate is limited: the true effect may be substantially different from the estimate of the effect. Very low certainty: we have very little confidence in the effect estimate: the true effect is likely to be substantially different from the estimate of effect. | ||||||
| aEither dexamethasone or methylprednisolone was used in all treatment regimens. bDowngraded twice for very serious imprecision because 95% CIs cross unity, information size is small, and confidence intervals are very wide, suggesting benefit and harm for the comparator. cDowngraded twice for very serious imprecision because 95% CIs cross unity, confidence intervals are wide, and information size is small. | ||||||
Subgroup analyses
We have been able to conduct the following subgroup analyses.
Type of chemotherapy (carboplatin versus other MEC)
Carboplatin was used for chemotherapy in three trials including 211 participants and comparing five treatment regimens. Just as for the full analysis set, the network was not fully connected in subgroup analyses and likewise was divided into two sub‐networks (figure available from study authors upon request). Sub‐network 1 included two studies and compared three treatments versus another. We observed no heterogeneity between studies in this sub‐network. Sub‐network 2 included one study and compared two treatments versus another. In comparison to the overall analysis of Sub‐network 1, evidence from the subgroup analysis does not suggest a robust advantage for aprepitant plus palonosetron compared to palonosetron (RR 1.11, 95% CI 0.53 to 2.34). Confidence intervals of the effect estimates were widely overlapping, and we identified no evidence of a difference. The direction and extent of effect of the subgroup analysis for Sub‐network 2 do not deviate from the full analysis set of Sub‐network 2.
Type of cancer (solid versus other)
Nine trials included only participants with solid tumours (n = 4935) and compared nine treatment regimens. Just as for the full analysis set, the network was not fully connected in subgroup analyses and likewise was divided into two sub‐networks (figures available from study authors upon request). Sub‐network 1 included seven studies and compared six treatment regimens. We observed low heterogeneity (I² = 29%) between studies in this sub‐network. Sub‐network 2 included two trials and compared three treatment regimens. We observed no heterogeneity between studies in this sub‐network. In the overall analysis, evidence may suggest an advantage of aprepitant plus ondansetron compared to palonosetron (RR 1.03, 95% CI 0.58 to 1.81), fosaprepitant plus ondansetron (RR 1.11, 95% CI 0.75 to 1.564), ondansetron (RR 1.17, 95% CI 0.85 to 1.62), and casopitant plus ondansetron (RR 1.28, 95% CI 0.88 to 1.85). In subgroup analysis including solid tumours only, the direction of effect changes and evidence may suggest an advantage for palonosetron (RR 1.32, 95% CI 0.66 to 2.62), fosaprepitant plus ondansetron (RR 1.23, 95% CI 0.71 to 2.12), ondansetron (RR 1.16, 95% CI 0.69 to 1.95), and casopitant plus ondansetron (RR 1.05, 95% CI 0.62 to 1.82) compared to aprepitant plus ondansetron. Confidence intervals of the effect estimates were widely overlapping, and we identified no evidence of a difference. We identified no further differences in direction and extent of effects in subgroup analysis between treatments.
Sensitivity analyses
We included six studies with low risk of bias including 3977 participants and comparing a total of seven treatment regimens in RoB sensitivity analysis. Just as for the full analysis set, the network was not fully connected in subgroup analyses and likewise was divided into two sub‐networks (figures available from study authors upon request). Sub‐network 1 included four studies and compared four treatment regimens. We observed low heterogeneity (I² = 13.1%) between studies in this sub‐network. Sub‐network 2 included two trials and compared three treatment regimens. In the overall analysis, evidence may suggest an advantage of aprepitant plus ondansetron compared to fosaprepitant plus ondansetron (RR 1.11, 95% CI 0.75 to 1.56), ondansetron (RR 1.17, 95% CI 0.85 to 1.62), and casopitant plus ondansetron (RR 1.28, 95% CI 0.88 to 1.85). In subgroup analysis including solid tumours only, the direction of effect changes and evidence may suggest an advantage for fosaprepitant plus ondansetron (RR 1.23, 95% CI 0.73 to 2.06), ondansetron (RR 1.16, 95% CI 0.70 to 1.92), and casopitant plus ondansetron (RR 1.05, 95% CI 0.63 to 1.75) compared to aprepitant plus ondansetron. Confidence intervals of the effect estimates were widely overlapping, and we identified no evidence of a difference.
Complete control of vomiting
We defined complete control of vomiting as no vomiting and no use of rescue medicine. This outcome was usually referred to in the studies as complete response (CR); hereafter we also refer to this as CR.
Acute phase (0 to 24 hours)
CR in the acute phase was reported in 21 studies (20 two‐arm studies, one three‐arm study) including 7783 participants and comparing 11 treatment regimens. We could include all studies in NMA, and the network was fully connected (see Supplementary Figure 67). Results for all network comparisons, including ranking of treatments, are shown in Supplementary Figures 68 and 69. We observed moderate heterogeneity (I² = 43.5%) between studies in the network. Aprepitant plus palonosetron showed higher CR in the acute phase than ondansetron (RR 1.19, 95% CI 1.08 to 1.31); and rolapitant plus granisetron showed higher CR in the acute phase than ondansetron (RR 1.14, 95% CI 1.01 to 1.29). However, palonosetron showed higher CR in the acute phase than fosaprepitant plus ondansetron (RR 1.14, 95% CI 1.01 to 1.27), aprepitant plus ondansetron (RR 1.14, 95% CI 1.03 to 1.25), and casopitant plus ondansetron (RR 1.15, 95% CI 1.04 to 1.27). Evidence suggests no other differences between treatment combinations including 5‐HT₃ inhibitors and a corticosteroid versus treatment combinations including both an NK₁ inhibitor and a 5‐HT₃ inhibitor, and a corticosteroid.
Ranking of treatments suggests that aprepitant plus palonosetron (P score 0.91) and palonosetron (P score 0.84) may be most effective in completely controlling vomiting during the acute phase, and ondansetron (P score 0.12) may be least effective.
We identified no evidence of a difference between direct and indirect estimates in closed loops in the network (see Supplementary Figure 70).
Delayed phase (24 to 120 hours)
CR in the delayed phase was reported in 21 studies (20 two‐arm studies, one three‐arm study) including 8421 participants and comparing ten treatment regimens. We could include all studies in NMA, and the network was fully connected (see Supplementary Figure 71). Results for all network comparisons, including ranking of treatments, are shown in Supplementary Figures 72 and 73. We observed low heterogeneity (I² = 6.5%) between studies in the network.
In the delayed phase, aprepitant plus palonosetron shows higher CR than palonosetron (RR 1.22, 95% CI1.08 to 1.37), granisetron (RR 1.29, 95% CI 1.11 to 1.50), and ondansetron (RR 1.51, 95% CI 1.30 to 1.76); rolapitant plus granisetron shows higher CR than granisetron (RR 1.16, 95% CI 1.06 to 1.27) and ondansetron (RR 1.35, 95% CI 1.17 to 1.56); fosaprepitant plus ondansetron shows higher CR than ondansetron (RR 1.15, 95% CI 1.05 to 1.26); and aprepitant plus ondansetron shows higher CR than ondansetron (RR 1.09, 95% CI 1.01 to 1.18). However, palonosetron shows higher CR than casopitant plus ondansetron (RR 1.18, 95% CI 1.04 to 1.34). Evidence suggests no other differences between treatment combinations including 5‐HT₃ inhibitors and a corticosteroid versus treatment combinations including both an NK₁ inhibitor and a 5‐HT₃ inhibitor, and a corticosteroid.
Ranking of treatments suggests aprepitant plus palonosetron (P score 0.98) and rolapitant plus granisetron (P score 0.85) may be most effective in completely controlling vomiting during the delayed phase, and ondansetron (P score 0.03) may be least effective.
We identified no evidence of a difference between direct and indirect estimates in closed loops in the network (see Supplementary Figure 74).
We rated the certainty of evidence for all treatments when compared to granisetron according to the GRADE system. Using actual reported event rates, we estimated that 641 of 1000 participants achieve complete control of vomiting (CR) in the delayed phase when treated with granisetron. When compared to granisetron, treatment with rolapitant plus granisetron increases CR in the delayed phase (high certainty); and treatment with aprepitant plus palonosetron likely results in a large increase in CR in the delayed phase (moderate certainty). When compared to granisetron, treatment with palonosetron may slightly increase CR in the delayed phase (low certainty); treatment with aprepitant plus granisetron may or may not slightly increase CR in the delayed phase (low certainty); treatment with azasetron may result in little to no difference in CR in the delayed phase (low certainty); treatment with fosaprepitant plus ondansetron probably results in little to no difference in CR in the delayed phase (moderate certainty); treatment with aprepitant plus ondansetron may slightly decrease CR in the delayed phase (low certainty); treatment with casopitant plus ondansetron may decrease CR in the delayed phase (low certainty); and treatment with ondansetron probably decreases CR in the delayed phase (moderate certainty). Our main reasons for downgrading were serious study limitations due to risk of bias and serious imprecision. We provide reasons for downgrading per assessment in Table 8.
| Antiemetics for adults for prevention of nausea and vomiting caused by moderately emetogenic chemotherapy | ||||||
| Patient or population: adult cancer patients at risk for CINV caused by moderately emetogenic chemotherapy Settings: inpatient and outpatient care Intervention:
Comparison: granisetron (5‐HT₃) + corticosteroid Outcome: complete control of vomiting during the delayed phase (24 to 120 h of treatment with chemotherapy) RR > 1 indicates an advantage for the intervention Combinations of these interventions at any dose and by any route as mentioned above have been compared to one another in a full network | ||||||
| Interventions (corticosteroids included in all regimens)a | Illustrative comparative risks* (95% CI) | Risk ratio | No. of participants | Certainty of the evidence | Comments | |
|---|---|---|---|---|---|---|
| Assumed risk with granisetron | Corresponding risk with the intervention | |||||
|
|
| |||||
| aprepitant + palonosetron | 641 of 1000 | 823 of 1000 (712 to 962) | RR 1.29 | 8421 (21) | ⊕⊕⊕⊝ moderateb | Aprepitant + palonosetron likely results in a large increase of complete control of vomiting during the delayed phase when compared to granisetron |
| rolapitant + granisetron | 641 of 1000 | 744 of 1000 (679 to 814) | RR 1.16 | 8421 (21) | ⊕⊕⊕⊕ high | Rolapitant + granisetron increases complete control of vomiting during the delayed phase when compared to granisetron |
| palonosetron | 641 of 1000 | 679 of 1000 (622 to 750) | RR 1.06 | 8421 (21) | ⊕⊕⊝⊝ lowb,c | Palonosetron may increase complete control of vomiting during the delayed phase slightly when compared to granisetron, but the evidence is uncertain |
| aprepitant + granisetron | 641 of 1000 | 667 of 1000 (564 to 788) | RR 1.04 | 8421 (21) | ⊕⊕⊝⊝ lowb,c | Palonosetron may or may not increase complete control of vomiting during the delayed phase slightly when compared to granisetron, but the evidence is uncertain |
| azasetron | 641 of 1000 | 647 of 1000 (494 to 846) | RR 1.01 | 8421 (21) | ⊕⊕⊝⊝ lowb,d | Azasetron may result in little to no difference in complete control of vomiting during the delayed phase slightly when compared to granisetron, but the evidence is uncertain |
| fosaprepitant + ondansetron | 641 of 1000 | 596 of 1000 (551 to 718) | RR 0.98 | 8421 (21) | ⊕⊕⊕⊝ moderateb | Fosaprepitant + ondansetron probably results in little to no difference in complete control of vomiting during the delayed phase slightly when compared to granisetron |
| aprepitant + ondansetron | 641 of 1000 | 596 of 1000 (526 to 679) | RR 0.93 | 8421 (21) | ⊕⊕⊝⊝ lowb,c | Aprepitant + ondansetron may decrease complete control of vomiting during the delayed phase slightly when compared to granisetron, but the evidence is uncertain |
| casopitant + ondansetron | 641 of 1000 | 570 of 1000 (506 to 647) | RR 0.89 | 8421 (21) | ⊕⊕⊝⊝ lowb,d | Casopitant + ondansetron may decrease complete control of vomiting during the delayed phase when compared to granisetron, but the evidence is uncertain |
| ondansetron | 641 of 1000 | 551 of 1000 (493 to 609) | RR 0.86 | 8421 (21) | ⊕⊕⊕⊝ moderateb | Ondansetron probably decreases complete control of vomiting during the delayed phase when compared to granisetron |
| *Basis for the assumed risk is actual event rates reported for the main comparator summed across studies: 953 of 1486 (64.1%) participants treated with granisetron achieved complete response during the delayed phase (granisetron was used in 7 studies reporting the outcome). The corresponding risk (and its 95% confidence interval) is based on the assumed risk in the comparison group and the risk ratio of the intervention (and its 95% CI). | ||||||
| GRADE Working Group grades of evidence. Moderate certainty: we are moderately confident in the effect estimate: the true effect is likely to be close to the estimate of effect, but there is a possibility that it is substantially different. Low certainty: our confidence in the effect estimate is limited: the true effect may be substantially different from the estimate of the effect. Very low certainty: we have very little confidence in the effect estimate: the true effect is likely to be substantially different from the estimate of effect. | ||||||
| aEither dexamethasone or methylprednisolone was used in all treatment regimens. bDowngraded once for serious study limitations due to high risk of bias. cDowngraded once for serious imprecision because 95% CIs cross unity and include potential advantages and disadvantages. dDowngraded once for serious imprecision due to wide confidence intervals. | ||||||
Overall phase (0 to 120 hours)
CR in the overall phase was reported in 22 studies including 7800 participants and comparing a total of 11 treatment regimens. We could include all studies in NMA, and the network was fully connected (Figure 14 and Supplementary Figure 75). Results for all network comparisons, including ranking of treatments, are shown in Figure 15 and Figure 16 and in Supplementary Figures 76 and 77. We observed low heterogeneity (I² = 13.7%) between studies in the network.

Network graph for the outcome complete control of vomiting during the overall phase (MEC).
A line connects any 2 treatments when there is at least 1 study comparing the 2 treatments. Line width: number of patients.
A list of treatment abbreviations is provided in Table 1; all treatments included a corticosteroid.
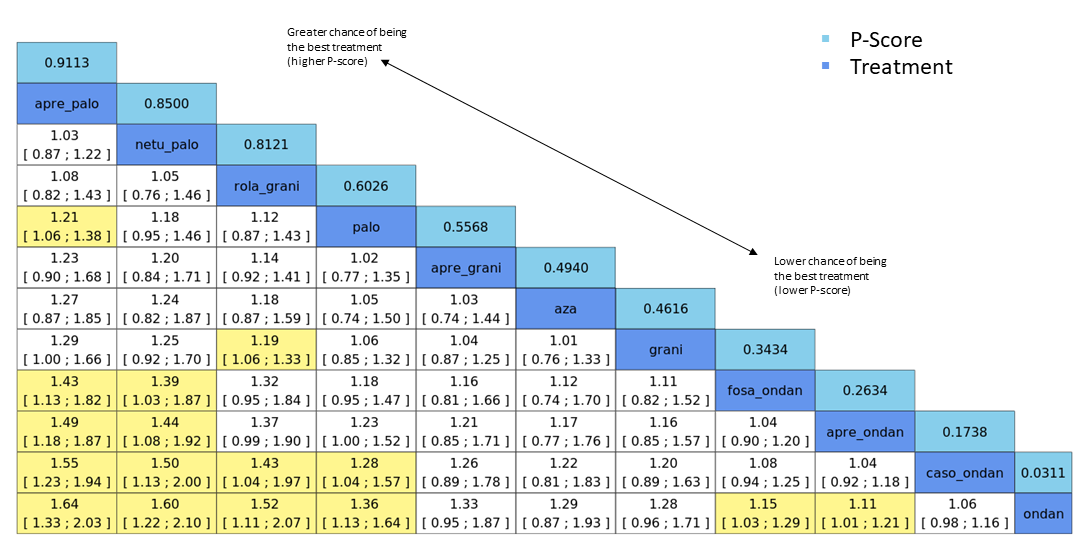
League table for the outcome complete control of vomiting during the overall phase (MEC). Network estimates with 95% CIs are given. Descending P score shows ranking of treatment options. Statistically significant results are marked in yellow. Global approach to check inconsistency/heterogeneity: Q‐statistics, I².
No. of studies: 22. No. of treatments: 11. No. of pair‐wise comparisons: 22. No. of designs: 11.
Qtotal = 13.90, df = 12, P = 0.31/Qwithin = 13.80, df = 11, P = 0.24/Qbetween = 0.09, df = 1, P = 0.76; I² = 13.7%, Tau² = 0.0018.
Treatment effects + 95% CIs (risk ratios, random‐effects model); RR > 1 favours the upper treatment/treatment on the left.
A list of treatment abbreviations is provided in Table 1; all treatments included a corticosteroid.
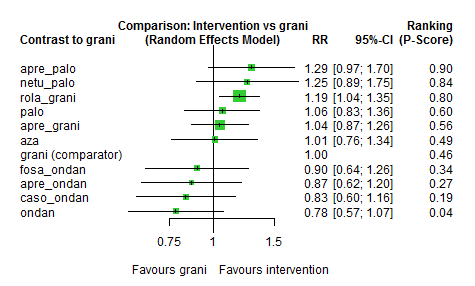
Exemplary network meta‐analysis forest plot for the outcome complete control of vomiting during the overall phase (MEC) (random‐effects model).
Granisetron was used as exemplary reference treatment. Ranking of treatments is ordered by P score (descending).
A list of treatment abbreviations is provided in Table 1; all treatments included a corticosteroid.
In the overall phase, aprepitant plus palonosetron shows higher CR than palonosetron (RR 1.21, 95% CI 1.06 to 1.38) and ondansetron (RR 1.64, 95% CI 1.33 to 2.03); netupitant plus palonosetron shows higher CR than ondansetron (RR 1.60, 95% CI 1.22 to 2.10); rolapitant plus granisetron shows higher CR than granisetron (RR 1.19, 95% CI 1.06 to 1.33) and ondansetron (RR 1.52, 95% CI 1.11 to 2.07); fosaprepitant plus ondansetron shows higher CR than ondansetron (RR 1.15, 95% CI 1.03 to 1.29); and aprepitant plus ondansetron shows higher CR than ondansetron (RR 1.11, 95% CI 1.01 to 1.21). However, palonosetron shows higher CR than casopitant plus ondansetron (RR 1.28, 95% CI 1.04 to 1.57). Evidence suggests no other differences between treatment combinations including 5‐HT₃ inhibitors and a corticosteroid versus treatment combinations including both an NK₁ inhibitor and a 5‐HT₃ inhibitor, and a corticosteroid.
Ranking of treatments suggests aprepitant plus palonosetron (P score 0.91), netupitant plus palonosetron (P score 0.85), and rolapitant plus granisetron (P score 0.81) may be most effective in completely controlling vomiting during the overall phase, and ondansetron (P score 0.03) may be least effective.
We identified no evidence of a difference between direct and indirect estimates in the only closed loop in the network (Figure 17 and Supplementary Figure 78).
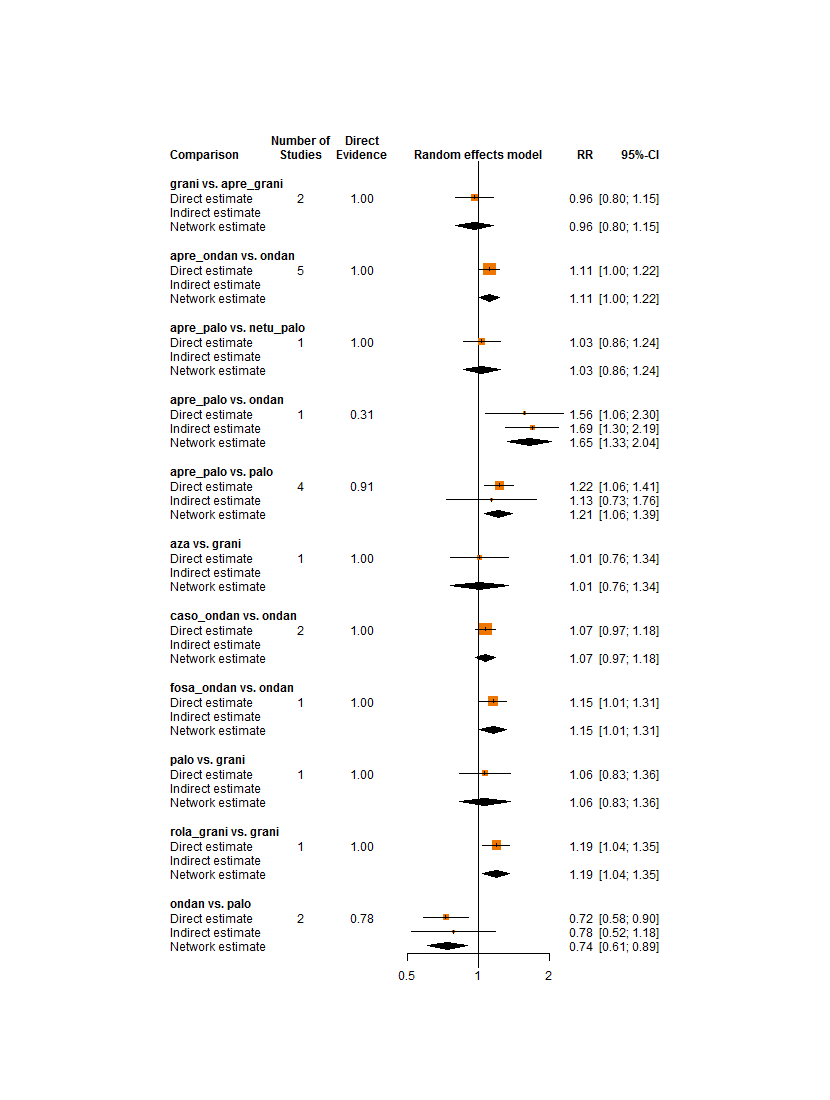
Comparison of direct and indirect evidence (in closed loops) for the outcome complete control of vomiting during the overall phase (MEC). CI: confidence interval; RR: risk ratio.
A list of treatment abbreviations is provided in Table 1; all treatments included a corticosteroid.
We rated the certainty of evidence for all treatments when compared to granisetron according to the GRADE system. Using actual reported event rates, we estimated that 555 of 1000 participants achieve complete control of vomiting (CR) in the overall phase when treated with granisetron. When compared to granisetron, treatment with rolapitant plus granisetron increases CR in the overall phase (high certainty); treatment with aprepitant plus palonosetron (low certainty) and netupitant plus palonosetron may increase CR in the overall phase (low certainty), and treatment with palonosetron (low certainty) or aprepitant plus granisetron (low certainty) may or may not increase CR in the overall phase. When compared to granisetron, treatment with azasetron may result in little to no difference in CR in the overall phase (low certainty). When compared to granisetron, fosaprepitant plus ondansetron (low certainty), aprepitant plus ondansetron (low certainty), casopitant plus ondansetron (low certainty), or ondansetron (low certainty) may reduce CR in the overall phase. Our main reasons for downgrading were serious study limitations due to risk of bias and serious imprecision. We provide reasons for downgrading per assessment in summary of findings Table 3.
Subgroup analyses
We have been able to conduct the following subgroup analyses.
Type of chemotherapy (carboplatin versus other MEC)
Carboplatin was used for chemotherapy in eight trials including 1628 participants and comparing eight treatment regimens. The network was not fully connected and consisted of two sub‐networks (figures available from study authors upon request). Sub‐network 1 included six studies and compared five treatments to another. No heterogeneity was observed between studies in this sub‐network. Sub‐network 2 included two studies and compared three treatments to another. No heterogeneity was observed between studies in this sub‐network. In comparison to the overall analysis, evidence from the subgroup analysis does not suggest a robust advantage for aprepitant plus palonosetron compared to palonosetron (RR 1.06, 95% CI 0.84 to 1.34) nor for aprepitant plus ondansetron compared to ondansetron (RR 1.04, 95% CI 0.93 to 1.17). However, evidence from subgroup analysis does suggest a robust advantage for palonosetron compared to aprepitant plus ondansetron (RR 1.34, 95% CI 1.08 to 1.67). Despite the split network, we identified no further differences in direction and extent of effects in subgroup analysis. Confidence intervals of the effect estimates were widely overlapping, and we identified no evidence of a difference.
Type of cancer (solid versus other)
Sixteen trials included only participants with solid tumours (n = 6082) and compared 11 treatment regimens. The network was not fully connected and consisted of two sub‐networks (figures available from study authors upon request). Sub‐network 1 included 12 studies and compared seven treatments to another. We observed moderate heterogeneity (I² = 44.1%) between studies in this sub‐network. Sub‐network 2 included four studies and compared four treatments to another. We observed no heterogeneity between studies in this sub‐network. In comparison to the overall analysis, evidence from subgroup analysis does not suggest a robust advantage for netupitant plus palonosetron compared to fosaprepitant plus ondansetron (RR 1.41, 95% CI 0.97 to 2.05) nor for palonosetron compared to casopitant plus ondansetron (RR 1.26, 95% CI 0.98 to 1.60), fosaprepitant plus ondansetron compared to ondansetron (RR 1.15, 95% CI 0.97 to 1.36), or aprepitant plus ondansetron compared to ondansetron (RR 1.08, 95% CI 0.94 to 1.24). Despite the split network, we identified no further differences in direction and extent of effects in subgroup analysis. Confidence intervals of the effect estimates were widely overlapping, and we identified no evidence of a difference.
Sensitivity analyses
We included 11 studies with low risk of bias including 6074 participants and comparing a total of ten treatment regimens in RoB sensitivity analysis. The network was not fully connected and consisted of two sub‐networks (figures available from study authors upon request). Sub‐network 1 included ten studies and compared eight treatments to another. We observed moderate heterogeneity (I² = 38.7%) between studies in this sub‐network. Sub‐network 2 included one study only and compared two treatments to another. In comparison to the overall analysis, evidence from the sensitivity analysis does not suggest a robust advantage for rolapitant plus granisetron compared to casopitant plus ondansetron (RR 1.43, 95% CI 0.98 to 2.22), nor for palonosetron compared to casopitant plus ondansetron (RR 1.28, 95% CI 0.98 to 1.67) or aprepitant plus ondansetron compared to ondansetron (RR 1.08, 95% CI 0.97 to 1.21). Despite the split network, we identified no differences in direction and extent of effects in sensitivity analysis between treatments. Confidence intervals of the effect estimates were widely overlapping, and we identified no evidence of a difference.
Quality of life
No impairment in quality of life
We reported and extracted this outcome as number of participants without any impairment in quality of life (QoL).
QoL was reported in four studies including 2783 participants and comparing five treatment regimens. All studies used the Functional Life Index‐Emesis (FLIE) to assess impairment in quality of life. The network was not fully connected and consists of two sub‐networks (Supplementary Figure 79). We performed NMA only for Sub‐network 1, as Sub‐network 2 consisted of only one pair‐wise comparison (Schwartzberg 2015). Briefly, Schwartzberg 2015 included 1212 participants and compared rolapitant plus granisetron versus granisetron. Evidence suggests higher QoL for participants treated with rolapitant plus granisetron compared to participants treated with granisetron (RR 0.92, 95% CI 0.86 to 0.99).
We could include three studies comprising 1671 participants and three treatment regimens in NMA. Results for all network comparisons within Sub‐network 1, including ranking of treatments, are shown in Supplementary Figures 80 and 81. We observed substantial heterogeneity (I² = 78.5%) between studies in the sub‐network. Evidence suggests no differences between treatment combinations including 5‐HT₃ inhibitors and a corticosteroid versus treatment combinations including both an NK₁ inhibitor and a 5‐HT₃ inhibitor, and a corticosteroid, within Sub‐network 1.
We rated the certainty of evidence for all treatments when compared to granisetron according to the GRADE system. Using actual reported event rates, we estimated that 674 of 1000 participants have no impairment in quality of life when treated with granisetron. When compared to granisetron, treatment with rolapitant plus granisetron likely results in a decrease in QoL (moderate certainty). Our main reason for downgrading was serious imprecision (please also see Table 9).
| Antiemetics for adults for prevention of nausea and vomiting caused by moderately emetogenic chemotherapy | ||||||
| Patient or population: adult cancer patients at risk for CINV caused by moderately emetogenic chemotherapy Settings: inpatient and outpatient care Intervention
Comparison: granisetron (5‐HT₃) + corticosteroid Outcome: no impairment in quality of life RR < 1 indicates an advantage for the intervention. Combinations of these interventions at any dose and by any route as mentioned above have been compared to one another in a full network. | ||||||
| Interventions (corticosteroids included in all regimens)a | Illustrative comparative risks* (95% CI) | Risk ratio (95% CI) | No. of participants (studies) | Certainty of the evidence (GRADE) | Comments | |
| Assumed risk with granisetron | Corresponding risk with the intervention
| |||||
| rolapitant + granisetron | 674 of 1000 | 620 of 1000 (580 to 667) | RR 0.92 | 1212 (1) | ⊕⊕⊕⊝ moderateb | Rolapitant + granisetron probably decreases quality of life slightly when compared to granisetron |
| *Basis for the assumed risk is actual event rates reported for the main comparator summed across studies: 409 of 607 (67.4%) participants treated with granisetron experienced no impact on QoL (granisetron was used in 1 study reporting the outcome, follow‐up on Day 6). The corresponding risk (and its 95% confidence interval) is based on the assumed risk in the comparison group and the risk ratio of the intervention (and its 95% CI). | ||||||
| GRADE Working Group grades of evidence. Moderate certainty: we are moderately confident in the effect estimate: the true effect is likely to be close to the estimate of effect, but there is a possibility that it is substantially different. Low certainty: our confidence in the effect estimate is limited: the true effect may be substantially different from the estimate of the effect. Very low certainty: we have very little confidence in the effect estimate: the true effect is likely to be substantially different from the estimate of effect. | ||||||
| aEither dexamethasone or methylprednisolone was used in all treatment regimens. bDowngraded once for serious imprecision for the small sample size. | ||||||
As presented in Supplementary Figure 79, there are no closed loops in the network. Therefore, we could not visually nor statistically analyse inconsistencies between direct and indirect evidence.
Safety
Safety outcomes were not consistently reported across studies. To be able to meta‐analyse results, we could consider safety outcomes only when the number of participants with at least one event was reported. We could not consider cumulated events or breakdown in degree of severity, nor further subgroups.
On‐study mortality
On‐study mortality was reported in five studies including 4149 participants and comparing a total of seven treatment regimens. The network was not fully connected and consists of two sub‐networks (see Supplementary Figure 82). We performed NMA only for Sub‐network 1, as Sub‐network 2 consisted of only one pair‐wise comparison (Schwartzberg 2015). Briefly, Schwartzberg 2015 included 1369 participants and compared rolapitant plus granisetron to granisetron. In the rolapitant plus granisetron group, 12 out of 684 participants died; in the granisetron group, four out of 685 participants died (RR 3.00, 95% CI 0.97 to 9.27).
We could include in NMA four studies reporting on 2780 participants and comparing five treatment regimens. Results for all network comparisons, including ranking of treatments within Sub‐network 1, are shown in Supplementary Figures 83 and 84. We could not analyse generalised heterogeneity statistic Qtotal and generalized I² statistic. Evidence suggests no differences between treatment comparison combinations including 5‐HT₃ inhibitors and a corticosteroid versus treatment combinations including both an NK₁ inhibitor and a 5‐HT₃ inhibitor, and a corticosteroid, within Sub‐network 1.
As presented in Supplementary Figure 82, there are no closed loops in the network. Therefore, we could not visually nor statistically analyse inconsistencies between direct and indirect evidence.
We rated the certainty of evidence for all treatments when compared to granisetron according to the GRADE system. Using actual reported event rates, we estimated that 6 of 1000 participants died during the study when treated with granisetron. When compared to granisetron, treatment with rolapitant plus granisetron may result in a large increase in on‐study mortality (low certainty). Our main reason for downgrading was very serious imprecision (please also see Table 10).
| Antiemetics for adults for prevention of nausea and vomiting caused by moderately emetogenic chemotherapy | ||||||
| Patient or population: adult cancer patients at risk for CINV caused by moderately emetogenic chemotherapy Settings: inpatient and outpatient care Intervention
Comparison: granisetron (5‐HT₃) + corticosteroid Outcome: on‐study mortality RR < 1 indicates an advantage for the intervention. Combinations of these interventions at any dose and by any route as mentioned above have been compared to one another in a full network. | ||||||
| Interventions (corticosteroids included in all regimens)a | Illustrative comparative risks* (95% CI) | Risk ratio (95% CI) | No. of participants (studies) | Certainty of the evidence (GRADE) | Comments | |
| Assumed risk with granisetron
| Corresponding risk with the intervention | |||||
| rolapitant + granisetron | 6 of 1000 | 18 of 1000 (6 to 56) | RR 3.00 | 1369 (1) | ⊕⊕⊝⊝ lowb | Rolapitant + granisetron may make little to no difference in on‐study mortality when compared to granisetron |
| *Basis for the assumed risk is actual event rates reported for the main comparator summed across studies: 4 of 685 (0.6%) participants treated with granisetron died during the study (granisetron was used in 1 study reporting the outcome, time frame for reporting safety data was not described). The corresponding risk (and its 95% confidence interval) is based on the assumed risk in the comparison group and the risk ratio of the intervention (and its 95% CI). | ||||||
| GRADE Working Group grades of evidence. Moderate certainty: we are moderately confident in the effect estimate: the true effect is likely to be close to the estimate of effect, but there is a possibility that it is substantially different. Low certainty: our confidence in the effect estimate is limited: the true effect may be substantially different from the estimate of the effect. Very low certainty: we have very little confidence in the effect estimate: the true effect is likely to be substantially different from the estimate of effect. | ||||||
| aEither dexamethasone or methylprednisolone was used in all treatment regimens. bDowngraded twice for very serious imprecision because 95% CIs cross unity and because of the small information size. | ||||||
Adverse events
Participants with at least one adverse event (AE) were reported in seven studies including 4394 participants and comparing eight treatment regimens. The network was not fully connected and consists of two sub‐networks (see Supplementary Figure 85). We performed NMA only for Sub‐network 1, as Sub‐network 2 consisted of only one pair‐wise comparison (Kusagaya 2015). Briefly, Kusagaya 2015 included 80 participants and compared aprepitant plus palonosetron versus palonosetron. Of 41 participants who were treated with aprepitant plus palonosetron, 39 experienced at least one AE; of 39 participants who were treated with palonosetron, 37 experienced at least one AE (RR 1.00, 95% CI 0.91 to 1.11).
We could include in NMA six studies comprising 4314 participants and six treatment regimens. Results for all network comparisons within Sub‐network 1, including ranking of treatments, are shown in Supplementary Figures 86 and 87. We observed no heterogeneity (I² = 0.0%) between studies in the sub‐network. Evidence suggests lower risk of AEs for ondansetron compared to rolapitant plus granisetron (RR 0.61, 95% CI 0.41 to 0.91). However, evidence also suggests lower risk of AEs for fosaprepitant plus ondansetron (RR 0.60, 95% CI 0.40 to 0.90), casopitant plus ondansetron (RR 0.60, 95% CI 0.40 to 0.89), and aprepitant plus ondansetron (RR 0.62, 95% CI 0.41 to 0.95), when compared to granisetron. Evidence suggests no other differences between treatment combinations including 5‐HT₃ inhibitors and a corticosteroid versus treatment combinations including both an NK₁ inhibitor and a 5‐HT₃ inhibitor, and a corticosteroid, within Sub‐network 1.
As presented in Supplementary Figure 85, there are no closed loops in the network. Therefore, we could not visually nor statistically analyse inconsistencies between direct and indirect evidence.
Serious adverse events
Participants with at least one serious AE (SAE) were reported in five studies including 4124 participants and comparing seven treatment regimens. The network was not fully connected and consists of two sub‐networks (Figure 18 and Supplementary Figure 88). We performed NMA only for Sub‐network 1, as Sub‐network 2 consisted of only one pair‐wise comparison (Schwartzberg 2015). Briefly, Schwartzberg 2015 included 1344 participants and compared rolapitant plus granisetron versus granisetron. Of 674 participants who were treated with granisetron, 103 experienced at least one SAE; of 670 participants who were treated with rolapitant plus granisetron, 89 experienced at least one SAE (RR 1.15, 95% CI 0.88 to 1.50).

Network graph for the outcome serious adverse events (MEC).
A line connects any 2 treatments when there is at least 1 study comparing the 2 treatments. Line width: number of patients.
A list of treatment abbreviations is provided in Table 1; all treatments included a corticosteroid.
We could include in NMA four studies comprising 2780 participants and five treatment regimens. Results for all network comparisons within Sub‐network 1, including ranking of treatments, are shown in Figure 19 and Figure 20 and in Supplementary Figures 89 and 90. We could not analyse generalised heterogeneity statistic Qtotal and generalized I² statistic. Evidence suggests no other differences between treatment combinations including 5‐HT₃ inhibitors and a corticosteroid versus treatment combinations including both an NK₁ inhibitor and a 5‐HT₃ inhibitor, and a corticosteroid, within this sub‐network.
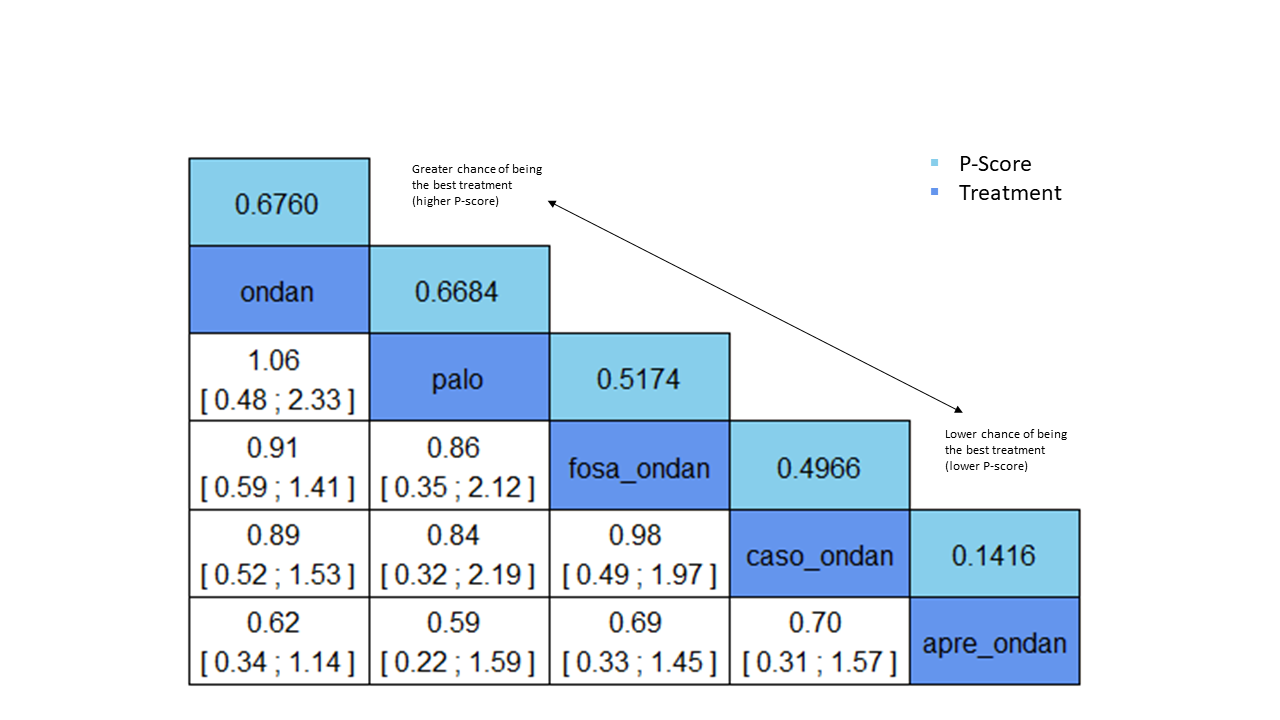
League table for the outcome serious adverse events (MEC). Network estimates with 95% CIs are given. Descending P score shows ranking of treatment options. Statistically significant results are marked in yellow. Global approach to check inconsistency/heterogeneity: Q‐statistics, I².
No. of studies: 4. No. of treatments: 5. No. of pair‐wise comparisons: 4. No. of designs: 4.
Heterogeneity/inconsistency: Q = 0, df = 0, P = not available; I² = not available, Tau² = not available.
Treatment effects + 95% CIs (risk ratios, random‐effects model).
A list of treatment abbreviations is provided in Table 1; all treatments included a corticosteroid.

Exemplary network meta‐analysis forest plot for the outcome serious adverse events (MEC) (random‐effects model).
Ondansetron was used as exemplary reference treatment. Ranking of treatments is ordered by P score (descending).
A list of treatment abbreviations is provided in Table 1; all treatments included a corticosteroid.
We rated the certainty of evidence for all treatments when compared to granisetron according to the GRADE system. Using actual reported event rates, we estimated that 153 of 1000 participants experienced serious adverse events (SAE) when treated with granisetron. When compared to granisetron, treatment with rolapitant plus granisetron may increase SAEs (low certainty). Our main reason for downgrading was very serious imprecision (please also see summary of findings Table 4).
As presented in Figure 18 and in Supplementary Figure 88, there are no closed loops in the network. Therefore, we could not visually nor statistically analyse inconsistencies between direct and indirect evidence.
Neutropenia
Neutropenia was reported in seven studies including 4214 participants and comparing a total of 99 treatment regimens. However, the network was not fully connected and consists of three sub‐networks (Supplementary Figure 91). We performed NMA only for Sub‐networks 1 and 2, as Sub‐network 3 consisted of only one pair‐wise comparison (Kusagaya 2015). Briefly, Kusagaya 2015 included 80 participants and compared aprepitant plus palonosetron versus palonosetron. Of 41 participants who were treated with aprepitant plus palonosetron, 26 experienced neutropenia; of 39 participants who were treated with palonosetron, 19 experienced neutropenia (RR 1.30, 95% CI 0.88 to 1.94).
We could include in NMA of Sub‐network 1 four studies involving 2543 participants and four treatment regimens. Results for all network comparisons within Sub‐network 1, including ranking of treatments, are shown in Supplementary Figures 92 and 93. We observed no heterogeneity (I² = 0.0%) between studies in the sub‐network. Evidence suggests no differences between treatment combinations including 5‐HT₃ inhibitors and a corticosteroid versus treatment combinations including both an NK₁ inhibitor and a 5‐HT₃ inhibitor, and a corticosteroid, within this sub‐network.
We could include in NMA of Sub‐network 2 two studies involving 1591 participants and three treatment regimens. Results for all network comparisons within Sub‐network 2, including ranking of treatments, are shown in Supplementary Figures 92 and 93. We could not analyse generalised heterogeneity statistic Qtotal and generalised I² statistic. Evidence suggests no differences between treatment comparison combinations including 5‐HT₃ inhibitors and a corticosteroid versus treatment combinations including both an NK₁ inhibitor and a 5‐HT₃ inhibitor, and a corticosteroid, within this sub‐network.
As presented in Supplementary Figure 91, there are no closed loops in the network. Therefore, we could not visually nor statistically analyse inconsistencies between direct and indirect evidence.
Febrile neutropenia
Participants with febrile neutropenia were reported in three studies including 2469 participants and comparing a total of five treatment regimens. The network was not fully connected and consists of two sub‐networks (see Supplementary Figure 94). We performed NMA only for Sub‐network 1, as Sub‐network 2 consisted of only one pair‐wise comparison (Schwartzberg 2015). Briefly, Schwartzberg 2015 included 1344 participants and compared rolapitant plus granisetron versus granisetron. Of 674 participants who were treated with granisetron, 25 experienced febrile neutropenia; of 670 participants who were treated with rolapitant plus granisetron, 14 experienced febrile neutropenia (RR 0.56, 95% CI 0.30 to 1.07).
We could include in NMA two studies comprising 1125 participants and a total of three treatment regimens. Results for all network comparisons within Sub‐network 1, including ranking of treatments, are shown in Supplementary Figures 95 and 96. We could not analyse generalised heterogeneity statistic Qtotal and generalised I² statistic. Evidence suggests no differences between treatment combinations including 5‐HT₃ inhibitors and a corticosteroid versus treatment combinations including both an NK₁ inhibitor and a 5‐HT₃ inhibitor, and a corticosteroid, within this sub‐network.
As presented in Supplementary Figure 94, there are no closed loops in the network. Therefore, we could not visually nor statistically analyse inconsistencies between direct and indirect evidence.
Infection
None of the included studies reported the number of participants with infection.
Local reaction at the infusion site
None of the included studies reported the number of participants with local reaction at the infusion site.
We had planned to rate the certainty of evidence for local reaction at the infusion site according to the GRADE system for all treatment regimens compared to granisetron, respectively. However, as no study reported this outcome, we could not rate the certainty of evidence for this outcome.
Hiccups
Hiccups were reported in five pair‐wise studies including 1061 participants and comparing six treatment combinations. The network was not fully connected and consisted of three sub‐networks (figures available from study authors upon request). We could not perform NMA, as all sub‐networks consisted of only one pair‐wise comparison. Briefly, Kim 2017 and Song 2017 compared aprepitant plus ondansetron to ondansetron and included a total of 591 participants. Results of pair‐wise meta‐analysis suggest no differences between aprepitant plus ondansetron versus ondansetron (RR 2.08, 95% CI 1.00 to 4.43). Kusagaya 2015 and Xiong 2019 compared aprepitant plus palonosetron versus palonosetron and included a total of 185 participants. Results of pair‐wise meta‐analysis suggest no differences between aprepitant plus palonosetron versus palonosetron (RR 0.77, 95% CI 0.30 to 1.97). Ho 2010 included 285 participants and compared ramosetron to granisetron. Of 144 participants treated with ramosetron, nine experienced hiccups; of 141 participants treated with granisetron, five experienced hiccups (RR 1.76, 95% CI 0.61 to 5.13).
Efficacy versus acceptability
Optimal treatment should be characterised by both high efficacy and acceptability. Figure 21 and Supplementary Figure 97 illustrate concurrently an exemplary ranking of treatment combinations for the outcome CR during the overall phase, which we chose to represent efficacy, and for the outcome SAEs, which we chose to represent acceptability. We ordered treatments by P score. Treatment combinations with both high efficacy and high acceptability are located in the upper right corner of this graph. The related league table with all network estimates (RRs and 95% CIs) is given in Figure 22 and in Supplementary Figure 98. According to this ranking, we considered palonosetron as the most efficacious and acceptable treatment within this comparison. We could include only treatment combinations for which data were available for both outcomes (CR during the overall phase and SAEs) in this exemplary ranking plot.

Exemplary ranking plot representing simultaneously the efficacy (x‐axis, CR during overall phase) and the acceptability (y‐axis, SAEs) of all antiemetic regimens for patients receiving moderately emetogenic chemotherapy.
Only antiemetic regimens for which data for both endpoints (CR during the overall phase and SAEs) were available are represented in the ranking plot.
A list of treatment abbreviations is provided in Table 1; all treatments included a corticosteroid.

League table with network estimates (RR with 95% CIs) of all treatment combinations for efficacy (CR during the overall phase) and acceptability (SAEs) (MEC).
Treatments are presented in alphabetical order. For efficacy, RRs > 1 favour the first treatment in alphabetical order. For safety, RRs < 1 favour the first treatment in alphabetical order.
n.a.: no data were available for this comparison.
Statistically significant results are marked bold.
A list of treatment abbreviations is provided in Table 1; all treatments included a corticosteroid.
Discussion
Summary of main results
The aim of this systematic review and network meta‐analysis was to synthesise all available evidence on different treatment options for prevention and control of chemotherapy‐induced nausea and vomiting (CINV) in adults with cancer receiving highly or moderately emetogenic chemotherapy (HEC or MEC, respectively). We identified 107 randomised controlled trials (RCTs) that included 37,313 participants from high‐, middle‐, and low‐income countries. Four studies included both HEC and MEC; in total, 73 trials analysed treatment options for prevention of CINV caused by HEC, and 38 analysed treatment options for prevention of CINV caused by MEC.
We investigated 22 different treatment regimens in these studies. Treatment regimens included a 5‐hydroxytryptamine‐3 (5‐HT₃) inhibitor (azasetron, granisetron, ondansetron, palonosetron, ramosetron, or tropisetron) and dexamethasone, and could additionally include a neurokinin‐1 (NK₁) inhibitor (aprepitant, casopitant, ezlopitant, fosaprepitant, fosnetupitant, netupitant (the latter two so far are available only in combination with palonosetron), or rolapitant). All treatment combinations included corticosteroids.
We could include in network meta‐analyses 50 studies in the HEC group and 26 studies in the MEC group. Overall risk of bias was generally low across studies. Results and certainty of evidence for the main outcomes and comparisons are summarised in 'Summary of findings' tables (summary of findings Table 1; summary of findings Table 2; summary of findings Table 3; summary of findings Table 4; Table 3; Table 4; Table 5; Table 6; Table 7; Table 8; Table 9; Table 10), and the most crucial outcomes are summarised below. These include complete control of vomiting during the overall treatment phase (Days 1 to 5) and serious adverse events.
Highly emetogenic chemotherapy (HEC)
We included 73 studies reporting on 25,275 participants and comparing 14 treatment combinations with NK₁ and 5‐HT₃ inhibitors. All treatment combinations included corticosteroids.
Complete control of vomiting during the overall phase
We estimated that 704 of 1000 participants achieve complete control of vomiting in the overall treatment phase (one to five days) when treated with aprepitant + granisetron. Evidence from network meta‐analysis (NMA) (39 RCTs, 21,642 participants, 12 treatment combinations with NK₁ and 5‐HT₃ inhibitors) suggests that the following drug combinations are more efficacious than aprepitant + granisetron in completely controlling vomiting during the overall treatment phase (one to five days): fosnetupitant + palonosetron (810 of 1000, risk ratio (RR) 1.15, 95% confidence interval (CI) 0.97 to 1.37; moderate certainty), aprepitant + palonosetron (753 of 1000, RR 1.07, 95% CI 1.98 to 1.18; low certainty), aprepitant + ramosetron (753 of 1000, RR 1.07, 95% CI 0.95 to 1.21; low certainty), and fosaprepitant + palonosetron (746 of 1000, RR 1.06, 95% CI 0.96 to 1.19; low certainty).
Netupitant + palonosetron (704 of 1000, RR 1.00, 95% CI 0.93 to 1.08; high certainty) and fosaprepitant + granisetron (697 of 1000, RR 0.99, 95% CI 0.93 to 1.06; high certainty) have little to no impact on complete control of vomiting during the overall treatment phase (one to five days) when compared to aprepitant + granisetron, respectively.
Evidence further suggests that the following drug combinations are less efficacious than aprepitant + granisetron in completely controlling vomiting during the overall treatment phase (one to five days) (ordered by decreasing efficacy): aprepitant + ondansetron (676 of 1000, RR 0.96, 95% CI 0.88 to 1.05; low certainty), fosaprepitant + ondansetron (662 of 1000, RR 0.94, 95% CI 0.85 to 1.04; low certainty), casopitant + ondansetron (634 of 1000, RR 0.90, 95% CI 0.79 to 1.03; low certainty), rolapitant + granisetron (627 of 1000, RR 0.89, 95% CI 0.78 to 1.01; moderate certainty), and rolapitant + ondansetron (598 of 1000, RR 0.85, 95% CI 0.65 to 1.12; low certainty).
We could not include two treatment combinations (ezlopitant + granisetron, aprepitant + tropisetron) in NMA for this outcome because of missing direct comparisons.
Serious adverse events
We estimated that 35 of 1000 participants experience any serious adverse events (SAEs) when treated with aprepitant + granisetron. Evidence from NMA (23 RCTs, 16,065 participants, 11 treatment combinations) suggests that fewer participants may experience SAEs when treated with the following drug combinations than with aprepitant + granisetron: fosaprepitant + ondansetron (8 of 1000, RR 0.23, 95% CI 0.05 to 1.07; low certainty), casopitant + ondansetron (8 of 1000, RR 0.24, 95% CI 0.04 to 1.39; low certainty), netupitant + palonosetron (9 of 1000, RR 0.27, 95% CI 0.05 to 1.58; low certainty), fosaprepitant + granisetron (13 of 1000, RR 0.37, 95% CI 0.09 to 1.50; low certainty), and rolapitant + granisetron (20 of 1000, RR 0.57, 95% CI 0.19 to 1.70; low certainty).
Evidence is very uncertain about the effects of aprepitant + ondansetron (8 of 1000, RR 0.22, 95% CI 0.04 to 1.14; very low certainty), aprepitant + ramosetron (11 of 1000, RR 0.31, 95% CI 0.05 to 1.90; very low certainty), fosaprepitant + palonosetron (12 of 1000, RR 0.35, 95% CI 0.04 to 2.95; very low certainty), fosnetupitant + palonosetron (13 of 1000, RR 0.36, 95% CI 0.06 to 2.16; very low certainty), and aprepitant + palonosetron (17 of 1000, RR 0.48, 95% CI 0.05 to 4.78; very low certainty) on risk of SAEs when compared to aprepitant + granisetron, respectively.
We could not include three treatment combinations (ezlopitant + granisetron, aprepitant + tropisetron, rolapitant + ondansetron) in NMA for this outcome because of missing direct comparisons.
Moderately emetogenic chemotherapy (MEC)
We included 38 studies reporting on 12,038 participants and comparing 15 treatment combinations with NK₁ and 5‐HT₃ inhibitors, or 5‐HT₃ inhibitors solely. All treatment combinations included corticosteroids.
Complete control of vomiting during the overall phase
We estimated that 555 of 1000 participants achieve complete control of vomiting in the overall treatment phase (one to five days) when treated with granisetron. Evidence from NMA (22 RCTs, 7800 participants, 11 treatment combinations) suggests that the following drug combinations are more efficacious than granisetron in completely controlling vomiting during the overall treatment phase (one to five days): aprepitant + palonosetron (716 of 1000, RR 1.29, 95% CI 1.00 to 1.66; low certainty), netupitant + palonosetron (694 of 1000, RR 1.25, 95% CI 0.92 to 1.70; low certainty), and rolapitant + granisetron (660 of 1000, RR 1.19, 95% CI 1.06 to 1.33; high certainty).
Palonosetron (588 of 1000, RR 1.06, 95% CI 0.85 to 1.32; low certainty) and aprepitant + granisetron (577 of 1000, RR 1.06, 95% CI 0.85 to 1.32; low certainty) may or may not increase complete response in the overall treatment phase (one to five days) when compared to granisetron, respectively. Azasetron (560 of 1000, RR 1.01, 95% CI 0.76 to 1.34; low certainty) may result in little to no difference in complete response in the overall treatment phase (one to five days) when compared to granisetron.
Evidence further suggests that the following drug combinations are less efficacious than granisetron in completely controlling vomiting during the overall treatment phase (one to five days) (ordered by decreasing efficacy): fosaprepitant + ondansetron (500 of 100, RR 0.90, 95% CI 0.66 to 1.22; low certainty), aprepitant + ondansetron (477 of 1000, RR 0.86, 95% CI 0.64 to 1.17; low certainty), casopitant + ondansetron (461 of 1000, RR 0.83, 95% CI 0.62 to 1.12; low certainty), and ondansetron (433 of 1000, RR 0.78, 95% CI 0.59 to 1.04; low certainty).
We could not include five treatment combinations (fosaprepitant + granisetron, azasetron, dolasetron, ramosetron, tropisetron) in NMA for this outcome because of missing direct comparisons.
Serious adverse events
We estimated that 153 of 1000 participants experience any SAEs when treated with granisetron. Evidence from pair‐wise comparison (1 RCT, 1344 participants) suggests that more participants may experience SAEs when treated with rolapitant + granisetron (176 of 1000, RR 1.15, 95% CI 0.88 to 1.50; low certainty). NMA was not feasible for this outcome because of missing direct comparisons.
Overall completeness and applicability of evidence
Robustness of results in subgroup and sensitivity analyses
We were able to compare a total of 21 different treatments combining 5‐HT₃ inhibitors with corticosteroids or additionally an NK₁ inhibitor for prevention and control of CINV in adults with cancer receiving HEC; of these, 14 included both an NK₁ inhibitor and a 5‐HT₃ inhibitor, and a corticosteroid. We were able to compare 15 different treatment combinations for adults with cancer receiving MEC; of these, 8 included both an NK₁ inhibitor and a 5‐HT₃ inhibitor, and a corticosteroid. We summarised different types of chemotherapies, drug dosages, routes of administration, cancer types, and patient‐specific prognostic factors, and we had planned to analyse subgroups, if possible. Because of missing information or disconnected networks, we have not been able to analyse subgroups of drug dosages, routes of administration, or patient‐specific prognostic factors. We have been able to conduct subgroup analyses for type of chemotherapy and type of cancer, as well as sensitivity analyses for risk of bias, for both HEC and MEC. We manually compared the results of our subgroup and sensitivity analyses to the results of the full analysis set and investigated whether there were deviations in direction of effects, extent of effects, or both. Most of the effect estimates have been robust in subgroup and sensitivity analyses.
In the HEC group, we noticed that confidence intervals of the effect estimates were widely overlapping, and we found no evidence of a difference between subgroup and sensitivity analyses when compared to the full analysis set, for the outcomes complete control of nausea in the overall phase and complete control of vomiting in the overall phase. The same applies for the outcomes complete control of nausea in the overall phase and complete control of vomiting in the overall phase, which we had investigated in subgroup and sensitivity analyses for the MEC group. However, we have not been able to test for subgroup differences because the test for interactions is not yet available in the software package we used.
Usability of reported outcomes
Not all of the included studies reported the same outcomes. At protocol stage, we defined our efficacy outcomes with the assistance of a clinical expert. However, the definitions of efficacy outcomes used within the included trials did not always correspond with our definitions. For example, we defined the outcome complete control of vomiting as no vomiting and no use of rescue medicine. However, some trials reported the outcome total control of vomiting and defined it as no vomiting, no use of rescue medicine, and no or mild nausea. As a result, we were not able to include these outcomes in our analysis.
Reporting of safety outcomes also differed between studies and led to limited comparability. We decided at protocol stage to include the reported safety data in NMA, if the number of participants experiencing at least one event was reported. We were not able to consider cumulated events or breakdowns in degree of severity or further subgroups (e.g. types of local reactions) in NMA. Not all trials reported the number of participants with at least one event. Therefore, we were not able to compare all identified treatment combinations versus one other for all outcomes. Because of these differences in reporting, we split most safety networks into sub‐networks. Therefore, we could compare only treatments included in the same sub‐network versus each other, reducing the informative value of our results. For the MEC group, the outcomes infection and local reaction at the infusion site have not been reported in any trials; therefore, we could not compare any treatments for these outcomes. We attempted to generate a ranking of treatments comparing efficacy against acceptability; however we could include only a limited number of treatments in this ranking because of the absence of all necessary information.
Consistency of results across phases
We checked whether the ranking of treatments was consistent across acute, delayed, and overall phases. We noticed that for the outcome complete control of nausea in the HEC group, ranking of treatments widely varied across phases. These differences probably originate from the fact that we could include different studies in the analysis of different time periods. However, this indicates discrepancies across the results of different trials and should be further investigated. Until this is done, these findings should be considered with caution.
Consistency within networks per outcome
We detected moderate inconsistency within networks for the outcomes complete control of nausea in the acute phase, complete control of vomiting in the delayed phase, and serious adverse events in the HEC group, and complete control of nausea in delayed and overall phases in the MEC group. We detected substantial inconsistency for the outcome quality of life (QoL) in both HEC and MEC groups. This inconsistency could not be statistically explained nor solved by sensitivity and subgroup analyses and probably originates from the interplay of some effect modifiers, in which our included trials differ slightly (e.g. cancer types, individuals' perceptions of nausea and quality of life, overall morbidity, study start date, study region). These are only minor differences. From a clinical point of view, our included studies therefore remain largely comparable. All trials reporting QoL used the Functional Life Index‐Emesis (FLIE) score to assess any impairments on QoL. We defined at protocol stage that we will compare the numbers of participants without any impairment in QoL. Therefore we did not consider or compare median scores. This may be a reason for inconsistency within networks and may explain why we could not identify differences between treatments.
Entirety of conducted research
In addition to the studies included in this review, we are aware of 46 additional trials that may be eligible for inclusion in our review. Of these, 34 trials are still awaiting assessment, as no results are yet available, and 12 trials are still ongoing. These studies may alter our results, if included in our analysis.
However, despite all these limitations, we were able to identify an extensive number of trials comparing many treatment combinations for multiple outcomes versus one another. We were able to consider the experience of more than 25,000 individuals in the HEC analyses and more than 12,000 individuals in the MEC analyses, emphasising the overall completeness and applicability of our findings.
Quality of the evidence
Rating the certainty of evidence in network meta‐analysis
The advantage and likewise a major challenge of NMA is that it allows us to compare multiple different treatments while considering direct and indirect evidence. We recognise that a comprehensive illustration of results is difficult to present, and that there is no standard approach for assessing the certainty of effect estimates generated by NMA. We followed methods suggested by the GRADE Working Group and discussed our approach with the Cochrane methods support unit.
For a comprehensive presentation and assessment of results, we rated the certainty of network effect estimates for every treatment within networks against one exemplary reference treatment. Because there is not a single standard antiemetic treatment, we had to randomly choose an exemplary reference treatment for both HEC and MEC groups. We chose aprepitant + granisetron as an exemplary reference treatment for all outcomes in the HEC group, and granisetron as an exemplary reference treatment for all outcomes in the MEC group. However, theoretically, we could have used every treatment combination as a reference. We rated the certainty of evidence for prioritised outcomes and all comparisons within networks against the chosen exemplary reference treatment.
For both HEC and MEC, we rated the certainty of evidence for the outcomes complete control of nausea in the overall phase (Days 1 to 5), complete control of vomiting in delayed (Days 2 to 5) and overall phases (Days 1 to 5), no impairment in quality of life, on‐study mortality, and SAEs. We had also planned to rate the certainty of evidence for the outcome local reaction at infusion side but could not do so because in the HEC group, no study reported the outcome for our reference treatment (aprepitant + granisetron), and in the MEC group, no study reported the outcome for any comparison. Overall, our confidence in effect estimates for the most important health outcomes ranged from very low to high certainty.
Highly emetogenic chemotherapy (HEC)
When we compared aprepitant + granisetron with all treatments including both an NK₁ inhibitor and a 5‐HT₃ inhibitor, most of the prioritised outcomes included a range in certainty of evidence across different comparisons. Our reasons for downgrading the evidence varied across comparisons and outcomes.
For the outcome complete control of nausea in the overall phase (Days 1 to 5), our confidence in the evidence was of low to high certainty. Our reasons for downgrading were serious study limitations due to high risk of bias and serious imprecision because the 95% confidence interval (CI) crosses unity and wide confidence intervals.
For the outcome complete control of vomiting in the delayed phase (Days 2 to 5), our confidence in the evidence was of very low to moderate certainty. Our reasons for downgrading were serious study limitations due to high risk of bias, moderate inconsistency within the network, and serious imprecision because the 95% CI crosses unity and wide confidence intervals.
For the outcome complete control of vomiting in the overall phase (Days 1 to 5), our confidence in the evidence was of low to high certainty. Our reasons for downgrading were serious study limitations due to high risk of bias, serious imprecision due to wide confidence intervals, and serious imprecision because the 95% CI crosses unity.
For the outcome no impairment in quality of life, our confidence in the evidence was of very low certainty. Our reasons for downgrading were high inconsistency within the network, very serious imprecision because the 95% CI crosses unity and wide confidence intervals suggesting high benefit for the comparator, serious imprecision because the 95% CI crosses unity, and serious study limitations due to high risk of bias.
For the outcome on‐study mortality, our confidence in the evidence was of low certainty. Our reason for downgrading was very serious imprecision because the 95% CI crosses unity and wide confidence intervals suggesting high benefit for the comparator.
For the outcome serious adverse events, our confidence in the evidence was of very low to low certainty. Our reasons for downgrading were serious study limitations due to high risk of bias, moderate inconsistency within the network, very serious imprecision because the 95% CI crosses unity and wide confidence intervals suggesting high possibility of harm, and serious imprecision because the 95% CI crosses unity and wide confidence intervals.
Moderately emetogenic chemotherapy (MEC)
When we compared granisetron with all treatments, most of the prioritised outcomes included a range of certainty of evidence across the different comparisons. Our reasons for downgrading the evidence also varied across comparisons and outcomes.
For the outcome complete control of nausea in the overall phase (Days 1 to 5), our confidence in the evidence was of low certainty. Our reason for downgrading was very serious imprecision because 95% CIs cross unity, small information size, and wide confidence intervals suggesting high benefit for the comparator, or all.
For the outcome complete control of vomiting in the delayed phase (Days 2 to 5), our confidence in the evidence was of low to high certainty. Our reasons for downgrading were serious study limitations due to high risk of bias, serious imprecision due to wide confidence intervals, and serious imprecision because 95% CIs cross unity and confidence intervals suggesting benefit for the comparator.
For the outcome complete control of vomiting in the overall phase (Days 1 to 5), our confidence in the evidence was of low to high certainty. Our reasons for downgrading were serious study limitations due to high risk of bias, serious imprecision because 95% CIs cross unity, and wide confidence intervals.
For the outcome no impairment in quality of life, our confidence in the evidence was of moderate certainty. Our reason for downgrading was serious imprecision for the small sample size.
For the outcome on‐study mortality, our confidence in the evidence was of low certainty. Our reasons for downgrading were very serious imprecision because 95% CIs cross unity and small information size.
For the outcome serious adverse events. our confidence in the evidence was of low certainty. Our reasons for downgrading were very serious imprecision because 95% CIs cross unity, wide confidence intervals, and small information size.
Potential biases in the review process
Review author IM is an information specialist experienced in medical terminology, who developed the sensitive search strategy with the support of the Cochrane Pain, Palliative and Supportive Care (PaPaS) Review Group's information specialist. We searched all relevant databases, trial registries, conference proceedings, and reference lists and therefore are confident that we identified all relevant trials.
Although we were able to include 107 studies in this systematic review with network meta‐analysis, we identified insufficient studies to produce funnel plots for pair‐wise comparisons to further investigate potential publication bias. We could have created comparison‐adjusted funnel plots, which requires an assumption regarding differences between small studies and large studies (e.g. newer treatments favoured in small trials, active treatment versus placebo, sponsored versus non‐sponsored) (Chaimani 2013). However, the challenge of NMA is that we would need to take into account several comparisons, which means that we do not have one single line of reference. We therefore decided not to create comparison‐adjusted funnel plots.
To minimise potential biases in the review process, we conducted selection of studies, data extraction, risk of bias assessment, and GRADE assessment in duplicate by two independent review authors and consulted a third review author for cases in which no consensus could be reached. We collated multiple reports of the same study, so that each study rather than each report was the unit of interest in the review. However, grouping of identified records was sometimes difficult, as not all records reported trial registration numbers. In cases for which we were uncertain whether two reports belonged to the same trial, we considered them as representing individual trials.
For a more comprehensive presentation of results, we estimated absolute treatment effects by using actual reported event rates for our randomly chosen main comparators (aprepitant + granisetron for HEC, granisetron for MEC). However, if we would choose another comparator to estimate absolute event rates, all of these effects could change. Thus, when interpreting the results of our NMA, it must be considered that reported absolute event rates are provided for illustrative purposes (using the following comparators: aprepitant + granisetron for HEC, granisetron for MEC) and do not reflect anticipated real‐life event rates.
We complied with Cochrane guidelines for every step of our review and consulted the PaPaS Review Group in cases of methodological uncertainty. With respect to available guidance for NMA, we are not aware of any methodological deficiencies in our review. However, in our opinion, 'Summary of findings' tables are not ideal for summing up such extensive analysis. Also, we surmise that the overall judgement of the quality of included trials and the certainty of evidence could diverge between different review author teams. Both the risk of bias tool and the GRADE approach are sensitive to subjective assessments and can be done more or less stringently.
Agreements and disagreements with other studies or reviews
To our knowledge, this is the first comprehensive review with NMA comparing all possible treatment combinations of NK₁ and 5‐HT₃ inhibitors with corticosteroids, or 5‐HT₃ inhibitors with corticosteroids, for prevention and control of CINV caused by HEC and MEC in adults with cancer.
Highly emetogenic chemotherapy (HEC)
We identified one further NMA comparing treatment combinations for prevention and control of CINV caused by HEC (Yokoe 2019). Additionally to our inclusion criteria, Yokoe 2019 included treatment combinations with olanzapine and treatment combinations without corticosteroids. Instead of comparing treatments per used substances versus each other, review authors grouped first‐generation 5‐HT₃ inhibitors into one group (granisetron, ondansetron, azasetron, ramosetron). Palonosetron was considered separately and was further divided into the dosages used. For therapies including an NK₁ inhibitor with a 5‐HT₃ inhibitor and dexamethasone, review authors summarised the NK₁ inhibitors aprepitant, fosaprepitant, and rolapitant into one group, and considered the combination including netupitant and palonosetron separately. In contrast to our inclusion criteria, review authors included only trials investigating antiemetic regimens in adults with solid cancer and excluded haematological malignancies.
Yokoe 2019 included 27 studies, 18 of which have been included in our review as well. We did not include the remaining nine studies in our review for the following reasons. Five studies included olanzapine in the investigational arm. Two studies used a 5‐HT₃ inhibitor without a corticosteroid. One study presented a combined analysis of two trials over multiple cycles and considered two publications of the same study as different studies; we considered this study only once. However, we identified 55 additional studies (Appendix 2), which we have included in our review. Comparability of our NMA and the NMA of Yokoe 2019 is further limited, as Yokoe and colleagues reported only one of our outcomes of interest; i.e. complete response (in acute, delayed, and overall phases).
Yokoe 2019 identified treatment combinations that included olanzapine as most efficient for achieving a complete response across all phases. Among treatment combinations that have also been compared in our analysis, Yokoe 2019 identified netupitant + palonosetron and dexamethasone as most efficient in the overall phase, followed by combinations including any NK₁ inhibitor + palonosetron and dexamethasone, and combinations including any NK₁ inhibitor and any 5‐HT₃ inhibitor with dexamethasone. Treatment combinations including only a 5‐HT₃ inhibitor with or without a corticosteroid performed least effectively.
In contrast to Yokoe 2019, we used only treatments including a 5‐HT₃ inhibitor with a corticosteroid to stabilise the network and focused on differences between treatments combining NK₁ and 5‐HT₃ inhibitors with corticosteroids. However, because immunotherapy agents such as immune checkpoint inhibitors (ICIs) are added to HEC, it is investigated whether the immunosuppressive effects of corticosteroids undermine the action and thus the efficacy of immunotherapy agents (Janowitz 2021). Concerns have been raised that corticosteroid‐including antiemetic prophylaxis reduces the effectiveness of ICI‐HEC. Until the interaction of corticosteroid immunosuppressive effects on the efficacy of immunotherapy agents is better understood, effects of corticosteroid‐sparing or corticosteroid‐free antiemetic treatments might be of particular interest for people receiving ICI‐HEC (Janowitz 2021). Neither our review nor the Yokoe 2019 review has yet been able to adequately answer this open question.
Moderately emetogenic chemotherapy (MEC)
We did not identify any other NMA comparing antiemetic regimens for prevention of CINV caused by MEC. We identified one meta‐analysis investigating the additional benefit of adding an NK₁ inhibitor to a 5‐HT₃ inhibitor for prevention of CINV caused by MEC (Jordan 2018). All 12 included trials of Jordan 2018 have been included in our systematic review as well. We could not include in this NMA the results of five trials, as only the substance class but not the active substance of the NK₁ inhibitor or the 5‐HT₃ inhibitor, or both, was defined in these trials (Aridome 2016; Ito 2014; Maehara 2015; Nishimura 2015; Yahata 2016). We included 25 additional trials in our analysis. Ten trials have not been included by Jordan 2018, as both treatment arms included a combination of 5‐HT₃ inhibitors and corticosteroids solely (Brohee 1995; Eisenberg 2003; Endo 2012; Ghosh 2010; Herrington 2000; Ho 2010; Jantunen 1992; Kaushal 2010; Raftopoulos 2015; Seol 2016); we have not included two further trials, as both treatment arms included a combination including both an NK₁ inhibitor and a 5‐HT₃ inhibitor (Fujiwara 2015; Jordan 2016a), and we could not include four trials as their publication date falls past the search date of Jordan 2018 (Kim 2017; Song 2017; Sugimori 2017; Xiong 2019). We identified ten additional trials in this systematic review (Arpornwirat 2009; Badar 2015; Kitayama 2015; Matsuda 2014; Miyabayashi 2015; Ozaki 2013; Schnadig 2014; Tsubata 2019; Webb 2010; Yeo 2009), three of which reported sufficient results to be included in NMA (Arpornwirat 2009; Badar 2015; Yeo 2009). Badar 2015 included participants with haematological malignancies, which have not been included by Jordan 2018. We analysed potential differences between types of cancer in subgroup analysis and did not identify any substantial disparities in treatment efficacy. Chemotherapy regimens used by Arpornwirat 2009 and Yeo 2009 have been classified as HEC and/or MEC by Jordan 2018 and therefore were excluded from that analysis. Arpornwirat 2009 described that investigators used cyclophosphamide from 500 mg/m² to 1500 mg/m² in combination with another MEC (not further specified) or from 750 mg/m² to 1500 mg/m² alone or in combination with agents that had been claimed by study authors to have low emetogenic potential: oxaliplatin ≥ 85 mg/m², doxorubicin ≥ 60 mg/m², epirubicin ≥ 90 mg/m², FOLFIRI, or carboplatin at an area under the curve (AUC) ≥ 5. According to the latest definition (Basch 2012), chemotherapy is classified as HEC if cyclophosphamide is used at ≥ 1500 mg/m². This was not the case for Arpornwirat 2009. However, chemotherapy is also classified as HEC if cyclophosphamide is used in combination with an anthracycline (Basch 2012). Arpornwirat 2009 described use of the low emetogenic anthracycline doxorubicin in combination with cyclophosphamide from 750 mg/m² to 1500 mg/m². The proportion of participants receiving this HEC combination has not been described in the trial, and results have not been reported separately. Therefore, this study has been mismatched to the MEC group in our review and will be excluded from analysis in an update of this review. Yeo 2009 also used doxorubicin 60 mg/m² + cyclophosphamide 600 mg/m² for chemotherapy. According to the latest definition of HEC, this study has been mismatched to the MEC group in our review. In an update of this review, we will correct this misclassification and will include Yeo 2009 in the HEC group.
The meta‐analysis of Jordan 2018 focused on efficacy outcomes (complete response, no emesis, no nausea) and separately analysed the results for carboplatin regimens, oxaliplatin regimens, and other MEC regimens including neither carboplatin nor oxaliplatin. We analysed all types of MEC together. Jordan 2018 identified benefit for antiemetic regimens including an additional NK₁ inhibitor for the outcome complete response during the overall phase for pure MEC regimens; and for the outcomes complete response during acute, delayed, and overall phases, no emesis during delayed and overall phases, and no nausea during delayed and overall phases for carboplatin‐based chemotherapy. Results of the meta‐analysis suggest no differences in efficacy between treatments including both an NK₁ inhibitor and a 5‐HT₃ inhibitor, and treatments including a 5‐HT₃ inhibitor solely, for oxaliplatin‐based chemotherapy. In comparison, results of our NMA do not show a clear trend towards combinations including both an NK₁ inhibitor and a 5‐HT₃ inhibitor, neither for the outcome complete response nor for the outcome no nausea*. On the contrary, results of our NMA suggest that the choice of 5‐HT₃ inhibitor may have an impact on response rates. We analysed potential differences between carboplatin‐based chemotherapy and all MEC regimens in subgroup analysis and did not identify any substantial disparities in treatment efficacy.
Disagreements between the meta‐analysis of Jordan 2018 and our NMA could reflect several reasons. First of all, only 7 of 37 studies have been considered in both analyses. Disagreements between analyses may indicate that the information size of study populations was insufficient to reveal the true effect. However, in the case that there is true benefit for regimens including an NK₁ inhibitor for other MEC and carboplatin‐based chemotherapy, this effect could be covered in our NMA through analyses of all types of MEC together. Unfortunately, we have not been able to conduct a test for subgroup differences as described above (Overall completeness and applicability of evidence). Also, pooling of all NK₁ inhibitors and all 5‐HT₃ inhibitors could reveal differences between individual substances, suggesting overall benefit for treatments including both an NK₁ inhibitor and a 5‐HT₃ inhibitor.
*We did not investigate the outcome of no emesis in our network meta‐analysis.

Study flow diagram.

Risk of bias summary: review authors' judgements about each risk of bias item for each included study.

Risk of bias graph: review authors' judgements about each risk of bias item presented as percentages across all included studies.

Network graph for the outcome complete control of vomiting in the overall phase (HEC).
A line connects any two treatments when there is at least one study comparing the two treatments. Line width: number of patients.
A list of treatment abbreviations is provided in Table 1; all treatments included a corticosteroid.

League table for the outcome complete control of vomiting in the overall phase (HEC). Network estimates with 95% CIs are given. Descending P score shows ranking of treatment options. Statistically significant results are marked in yellow. Global approach to check inconsistency/heterogeneity: Q‐statistics, I².
No. of studies: 34. No. of treatments: 14. No. of pair‐wise comparisons: 36. No. of designs: 21.
Qtotal = 23.95, df = 22, P = 0.35/Qwithin = 17.60, df = 13, P = 0.17/Qbetween = 6.34, df = 9, P = 0.71; I² = 8.1%, Tau² = 0.0005.
Treatment effects + 95% CIs (risk ratios, random‐effects model).
A list of treatment abbreviations is provided in Table 1; all treatments included a corticosteroid.

Exemplary network meta‐analysis forest plot for the outcome complete control of vomiting during the overall phase (HEC) (random‐effects model).
Aprepitant + granisetron was used as exemplary reference treatment. Ranking of treatments is ordered by P score (descending).
A list of treatment abbreviations is provided in Table 1; all treatments included a corticosteroid.
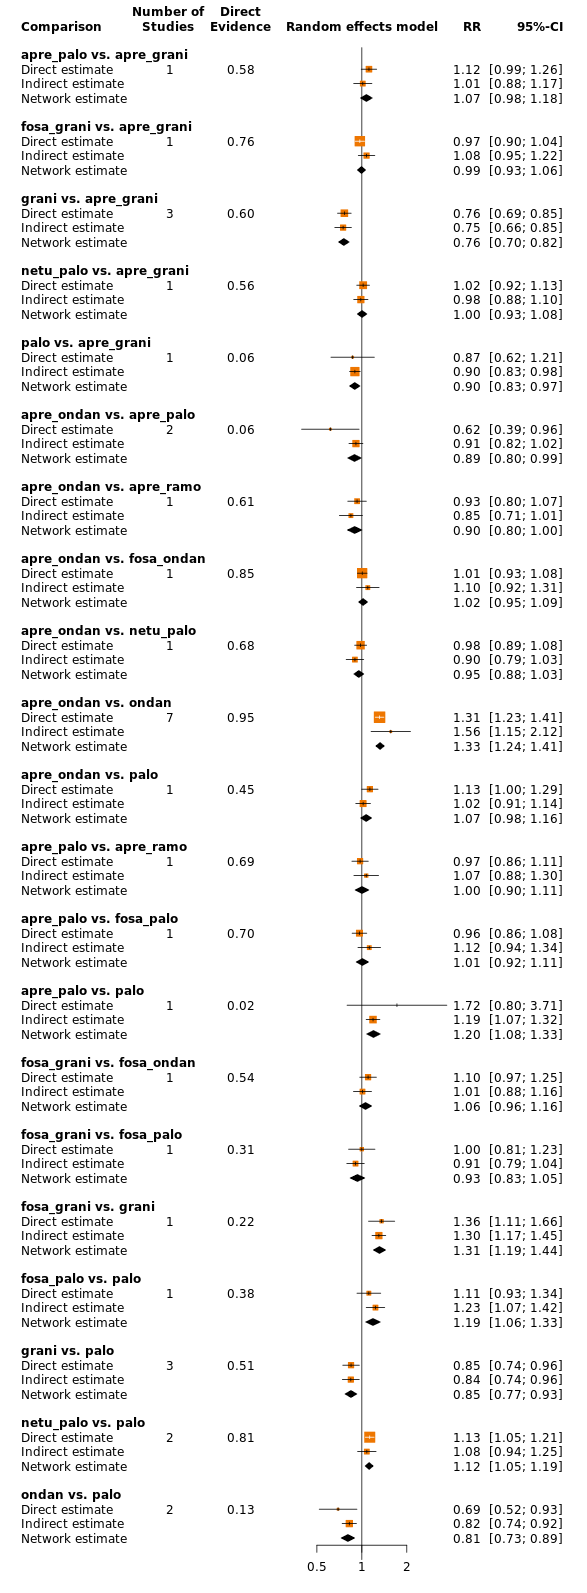
Comparison of direct and indirect evidence (in closed loops) for the outcome complete control of vomiting in the overall phase (HEC). CI: confidence interval; RR: risk ratio.
A list of treatment abbreviations is provided in Table 1; all treatments included a corticosteroid.

Network graph for the outcome serious adverse events (HEC).
A line connects any 2 treatments when there is at least 1 study comparing the 2 treatments. Line width: number of patients.
A list of treatment abbreviations is provided in Table 1; all treatments included a corticosteroid.
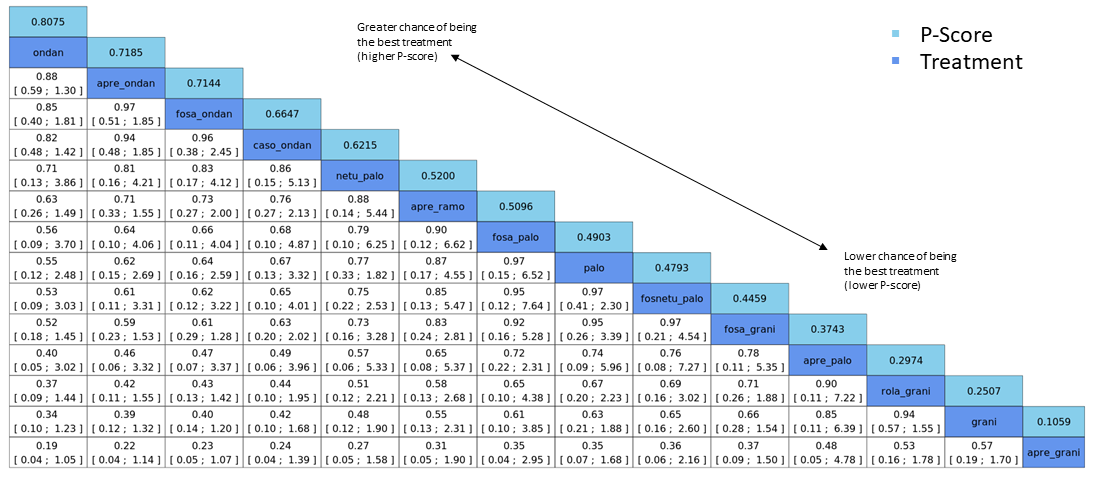
League table for the outcome serious adverse events (HEC). Network estimates with 95% CIs are given. Descending P score shows ranking of treatment options. Statistically significant results are marked in yellow. Global approach to check inconsistency/heterogeneity: Q‐statistics, I².
No. of studies: 20. No. of treatments: 12. No. of pair‐wise comparisons: 22. No. of designs: 13.
Qtotal = 20.26, df = 9, P = 0.016/Qwithin = 16.39, df = 7, P = 0.022/Qbetween = 3.87, df = 2, P = 0.14; I² = 55.6%, Tau² = 0.1057.
Treatment effects + 95% CIs (risk ratios, random‐effects model).
A list of treatment abbreviations is provided in Table 1; all treatments included a corticosteroid.

Exemplary network meta‐analysis forest plot for the outcome serious adverse events (HEC) (random‐effects model).
Aprepitant + granisetron was used as exemplary reference treatment. Ranking of treatments is ordered by P score (descending).
A list of treatment abbreviations is provided in Table 1; all treatments included a corticosteroid.

Comparison of direct and indirect evidence (in closed loops) for the outcome serious adverse events (HEC). CI: confidence interval; RR: risk ratio.
A list of treatment abbreviations is provided in Table 1; all treatments included a corticosteroid.

Exemplary ranking plot representing simultaneously the efficacy (x‐axis, CR during the overall phase) and the acceptability (y‐axis, SAEs) of all antiemetic regimens for patients receiving highly emetogenic chemotherapy.
Only antiemetic regimens for which data for both endpoints (CR during the overall phase and SAEs) were available are represented in the ranking plot.
A list of treatment abbreviations is provided in Table 1; all treatments included a corticosteroid.
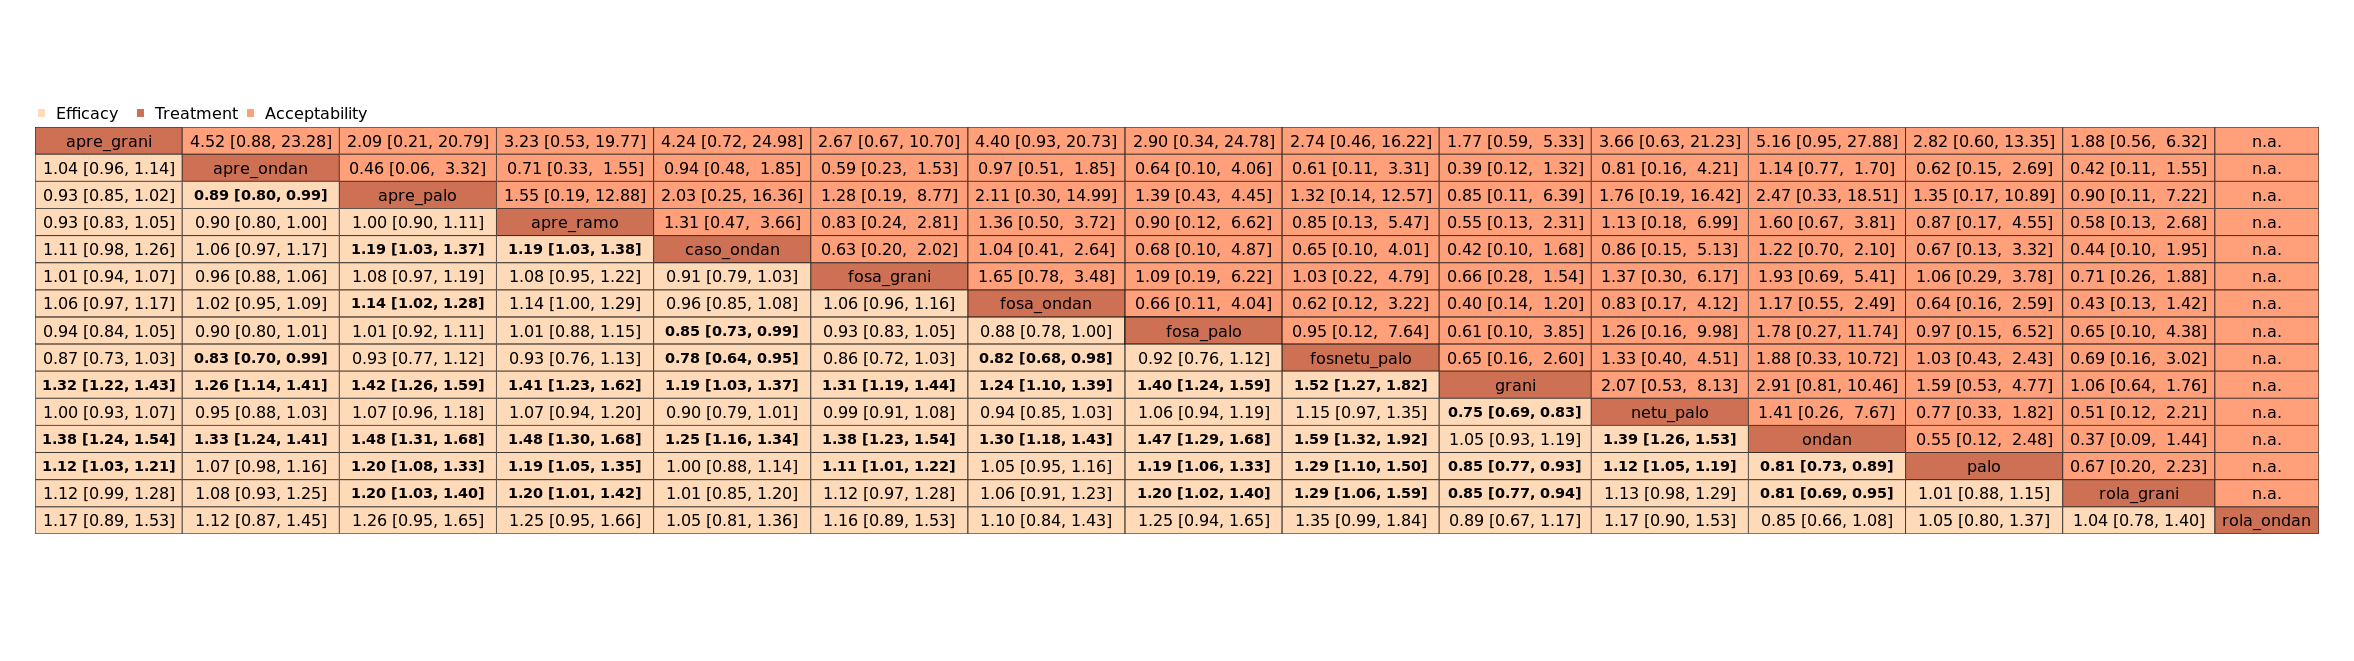
League table with network estimates (RR with 95% CIs) of all treatment combinations for efficacy (CR during the overall phase) and acceptability (SAEs) (HEC).
Treatments are presented in alphabetical order. For efficacy, RRs > 1 favour the first treatment in alphabetical order. For safety, RRs < 1 favour the first treatment in alphabetical order.
n.a.: no data were available for this comparison
Statistically significant results are marked bold.
A list of treatment abbreviations is provided in Table 1; all treatments included a corticosteroid.
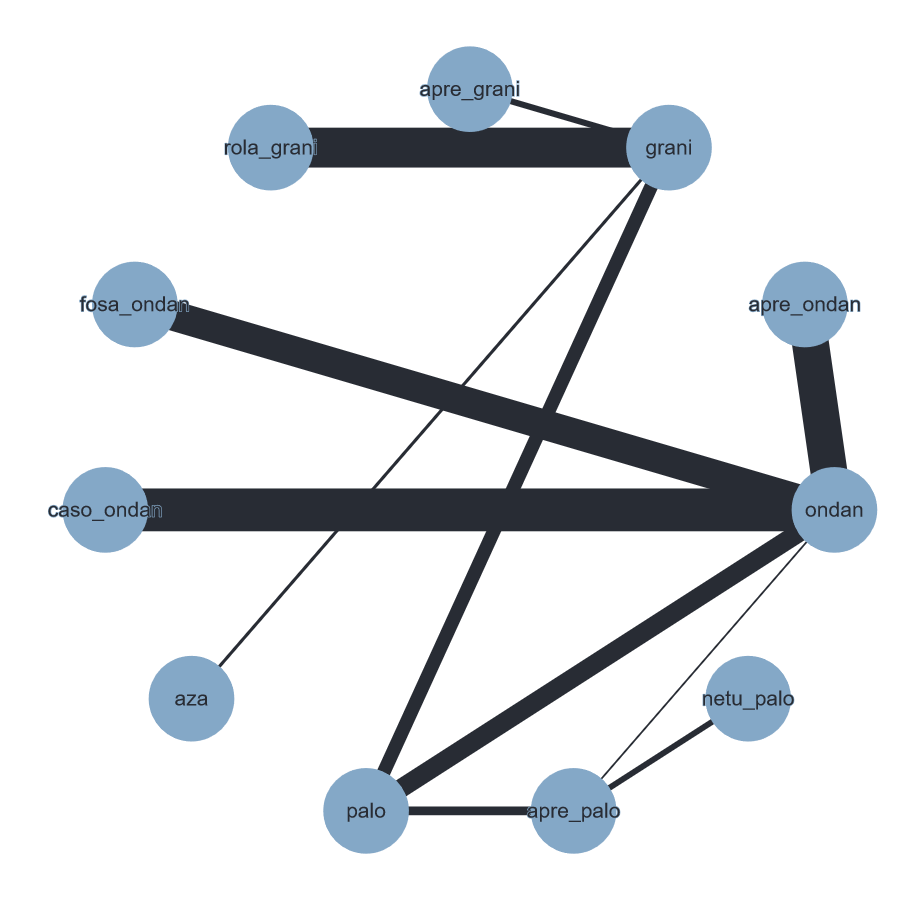
Network graph for the outcome complete control of vomiting during the overall phase (MEC).
A line connects any 2 treatments when there is at least 1 study comparing the 2 treatments. Line width: number of patients.
A list of treatment abbreviations is provided in Table 1; all treatments included a corticosteroid.

League table for the outcome complete control of vomiting during the overall phase (MEC). Network estimates with 95% CIs are given. Descending P score shows ranking of treatment options. Statistically significant results are marked in yellow. Global approach to check inconsistency/heterogeneity: Q‐statistics, I².
No. of studies: 22. No. of treatments: 11. No. of pair‐wise comparisons: 22. No. of designs: 11.
Qtotal = 13.90, df = 12, P = 0.31/Qwithin = 13.80, df = 11, P = 0.24/Qbetween = 0.09, df = 1, P = 0.76; I² = 13.7%, Tau² = 0.0018.
Treatment effects + 95% CIs (risk ratios, random‐effects model); RR > 1 favours the upper treatment/treatment on the left.
A list of treatment abbreviations is provided in Table 1; all treatments included a corticosteroid.

Exemplary network meta‐analysis forest plot for the outcome complete control of vomiting during the overall phase (MEC) (random‐effects model).
Granisetron was used as exemplary reference treatment. Ranking of treatments is ordered by P score (descending).
A list of treatment abbreviations is provided in Table 1; all treatments included a corticosteroid.

Comparison of direct and indirect evidence (in closed loops) for the outcome complete control of vomiting during the overall phase (MEC). CI: confidence interval; RR: risk ratio.
A list of treatment abbreviations is provided in Table 1; all treatments included a corticosteroid.

Network graph for the outcome serious adverse events (MEC).
A line connects any 2 treatments when there is at least 1 study comparing the 2 treatments. Line width: number of patients.
A list of treatment abbreviations is provided in Table 1; all treatments included a corticosteroid.

League table for the outcome serious adverse events (MEC). Network estimates with 95% CIs are given. Descending P score shows ranking of treatment options. Statistically significant results are marked in yellow. Global approach to check inconsistency/heterogeneity: Q‐statistics, I².
No. of studies: 4. No. of treatments: 5. No. of pair‐wise comparisons: 4. No. of designs: 4.
Heterogeneity/inconsistency: Q = 0, df = 0, P = not available; I² = not available, Tau² = not available.
Treatment effects + 95% CIs (risk ratios, random‐effects model).
A list of treatment abbreviations is provided in Table 1; all treatments included a corticosteroid.

Exemplary network meta‐analysis forest plot for the outcome serious adverse events (MEC) (random‐effects model).
Ondansetron was used as exemplary reference treatment. Ranking of treatments is ordered by P score (descending).
A list of treatment abbreviations is provided in Table 1; all treatments included a corticosteroid.

Exemplary ranking plot representing simultaneously the efficacy (x‐axis, CR during overall phase) and the acceptability (y‐axis, SAEs) of all antiemetic regimens for patients receiving moderately emetogenic chemotherapy.
Only antiemetic regimens for which data for both endpoints (CR during the overall phase and SAEs) were available are represented in the ranking plot.
A list of treatment abbreviations is provided in Table 1; all treatments included a corticosteroid.
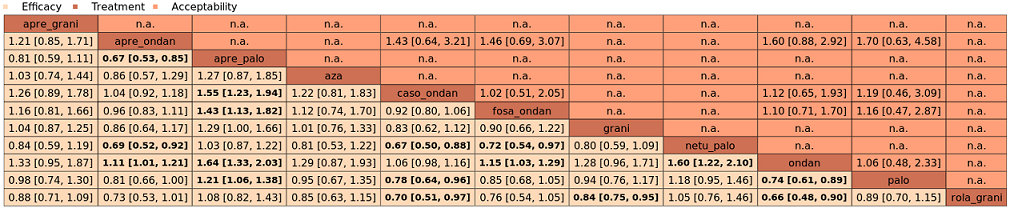
League table with network estimates (RR with 95% CIs) of all treatment combinations for efficacy (CR during the overall phase) and acceptability (SAEs) (MEC).
Treatments are presented in alphabetical order. For efficacy, RRs > 1 favour the first treatment in alphabetical order. For safety, RRs < 1 favour the first treatment in alphabetical order.
n.a.: no data were available for this comparison.
Statistically significant results are marked bold.
A list of treatment abbreviations is provided in Table 1; all treatments included a corticosteroid.
| Efficacy | ||||||
|---|---|---|---|---|---|---|
| Antiemetics for adults for prevention of nausea and vomiting caused by highly emetogenic chemotherapy | ||||||
| Patient or population: adult cancer patients at risk for CINV caused by highly emetogenic chemotherapy Settings: inpatient and outpatient care Intervention: neurokinin‐1 (NK₁) receptor antagonist and 5‐hydroxytryptamine‐3 (5‐HT₃) receptor antagonists + corticosteroid Comparison: aprepitant (NK₁) combined with granisetron (5‐HT₃) + corticosteroid Outcome: complete control of vomiting during the overall phase (0 to 120 h of treatment with chemotherapy) RR < 1 indicates an advantage for the intervention Combinations of these interventions at any dose and by any route as mentioned above have been compared to one another in a full network | ||||||
| Interventions (corticosteroids included in all regimens)a | Illustrative comparative risks* (95% CI) | Risk ratio | No. of participants | Certainty of the evidence | Comments | |
| Assumed risk with aprepitant + granisetron | Corresponding risk with the intervention | |||||
|
|
| |||||
| fosnetupitant + palonosetron | 704 of 1000 | 810 of 1000 (683 to 944) | RR 1.15 | 21,642 (39) | ⊕⊕⊕⊝ moderateb | Fosnetupitant + palonosetron probably increases complete response in the overall phase when compared with aprepitant + granisetron |
| aprepitant + palonosetron | 704 of 1000 | 753 of 1000 (690 to 831) | RR 1.07 | 21,642 (39) | ⊕⊕⊝⊝ lowb,c | Aprepitant + palonosetron may result in a slight increase in complete response in the overall phase when compared with aprepitant + granisetron |
| aprepitant + ramosetron | 704 of 1000 | 753 of 1000 (669 to 852) | RR 1.07 | 21,642 (39) | ⊕⊕⊝⊝ lowb,c | Aprepitant + ramosetron may result in a slight increase in complete response in the overall phase when compared with aprepitant + granisetron |
| fosaprepitant + palonosetron | 704 of 1000 | 746 of 1000 (676 to 838) | RR 1.06 | 21,642 (39) | ⊕⊕⊝⊝ lowb,c | Fosaprepitant + palonosetron may result in a slight increase in complete response in the overall phase when compared with aprepitant + granisetron |
| netupitant + palonosetron | 704 of 1000 | 704 of 1000 (655 to 760) | RR 1.00 | 21,642 (39) | ⊕⊕⊕⊕ high | Netupitant + palonosetron has little to no impact on complete response in the overall phase when compared with aprepitant + granisetron |
| fosaprepitant + granisetron | 704 of 1000 | 697 of 1000 (655 to 746) | RR 0.99 | 21,642 (39) | ⊕⊕⊕⊕ high | Fosaprepitant + granisetron has little to no impact on complete response in the overall phase when compared with aprepitant + granisetron |
| aprepitant + ondansetron | 704 of 1000 | 676 of 1000 (620 to 739) | RR 0.96 | 21,642 (39) | ⊕⊕⊝⊝ lowb,c | Aprepitant + ondansetron may result in a slight decrease in complete response in the overall phase when compared with aprepitant + granisetron |
| fosaprepitant + ondansetron | 704 of 1000 | 662 of 1000 (598 to 732) | RR 0.94 | 21,642 (39) | ⊕⊕⊝⊝ lowb,c | Fosaprepitant + ondansetron may result in a slight decrease in complete response in the overall phase when compared with aprepitant + granisetron |
| casopitant + ondansetron | 704 of 1000 | 634 of 1000 (556 to 725) | RR 0.90 | 21,642 (39) | ⊕⊕⊝⊝ lowb,c | Aprepitant + ondansetron may decrease complete response in the overall phase when compared with aprepitant + granisetron |
| rolapitant + granisetron | 704 of 1000 | 627 of 1000 (549 to 711) | RR 0.89 | 21,642 (39) | ⊕⊕⊕⊝ moderateb | Rolapitant + granisetron probably decreases complete response in the overall phase when compared with aprepitant + granisetron |
| rolapitant + ondansetron | 704 of 1000 | 598 of 1000 (458 to 788) | RR 0.85 (0.65 to 1.12) | 21,642 (39) | ⊕⊕⊝⊝ lowc,d | Rolapitant + ondansetron may decrease complete response in the overall phase when compared with aprepitant + granisetron |
| *Basis for the assumed risk is actual event rates reported for the main comparator summed across studies: 1312 of 1863 (70.4%) participants treated with aprepitant + granisetron achieved complete response during the overall phase (aprepitant + granisetron was used in 7 studies reporting the outcome). The corresponding risk (and its 95% confidence interval) is based on the assumed risk in the comparison group and the risk ratio of the intervention (and its 95% CI). | ||||||
| GRADE Working Group grades of evidence. Moderate certainty: we are moderately confident in the effect estimate: the true effect is likely to be close to the estimate of effect, but there is a possibility that it is substantially different. Low certainty: our confidence in the effect estimate is limited: the true effect may be substantially different from the estimate of the effect. Very low certainty: we have very little confidence in the effect estimate: the true effect is likely to be substantially different from the estimate of effect. | ||||||
| aEither dexamethasone or methylprednisolone was used in all treatment regimens. bDowngraded once for serious imprecision because 95% CIs cross unity. cDowngraded once for serious study limitations due to high risk of bias. dDowngraded once for serious imprecision due to wide confidence intervals. | ||||||
| Safety | ||||||
|---|---|---|---|---|---|---|
| Antiemetics for adults for prevention of nausea and vomiting caused by highly emetogenic chemotherapy | ||||||
| Patient or population: adult cancer patients at risk for CINV caused by highly emetogenic chemotherapy Settings: inpatient and outpatient care Intervention: neurokinin‐1 (NK₁) receptor antagonist and 5‐hydroxytryptamine‐3 (5‐HT₃) receptor antagonists + corticosteroid Comparison: aprepitant (NK₁) combined with granisetron (5‐HT₃) + corticosteroid Outcome: serious adverse events RR < 1 indicates an advantage for the intervention Combinations of these interventions at any dose and by any route as mentioned above have been compared to one another in a full network | ||||||
| Interventions (corticosteroids included in all regimens)a | Illustrative comparative risks* (95% CI) | Risk ratio | No. of participants | Certainty of the evidence | Comments | |
| Assumed risk with aprepitant + granisetron | Corresponding risk with the intervention | |||||
| aprepitant + ondansetron | 35 of 1000 | 8 of 1000 (1 to 40) | RR 0.22 | 16,065 (23) | ⊕⊝⊝⊝ very lowb,c,d | Evidence is very uncertain about the effect of aprepitant + ondansetron on risk of serious adverse events when compared to aprepitant + granisetron |
| fosaprepitant + ondansetron | 35 of 1000 | 8 of 1000 (2 to 37) | RR 0.23 | 16,065 (23) | ⊕⊕⊝⊝ lowb,c | Fosaprepitant + ondansetron may decrease the risk of serious adverse events slightly when compared to aprepitant + granisetron |
| casopitant + ondansetron | 35 of 1000 | 8 of 1000 (1 to 49) | RR 0.24 | 16,065 (23) | ⊕⊕⊝⊝ lowb,c | Casopitant + ondansetron may decrease the risk of serious adverse events slightly when compared to aprepitant + granisetron |
| netupitant + palonosetron | 35 of 1000 | 9 of 1000 (2 to 55) | RR 0.27 | 16,065 (23) | ⊕⊕⊝⊝ lowb,c | Netupitant + palonosetron may decrease the risk of serious adverse events slightly when compared to aprepitant + granisetron |
| aprepitant + ramosetron | 35 of 1000 | 11 of 1000 (2 to 67) | RR 0.31 | 16,065 (23) | ⊕⊝⊝⊝ very lowb,c,d | Evidence is very uncertain about the effect of aprepitant plus ramosetron on risk of serious adverse events when compared to aprepitant + granisetron |
| fosaprepitant + palonosetron | 35 of 1000 | 12 of 1000 (1 to 103) | RR 0.35 | 16,065 (23) | ⊕⊝⊝⊝ very lowb,e | Evidence is very uncertain about the effect of fosaprepitant + palonosetron on risk of serious adverse events when compared to aprepitant + granisetron |
| fosnetupitant + palonosetron | 35 of 1000 | 13 of 1000 (2 to 76) | RR 0.36 | 16,065 (23) | ⊕⊝⊝⊝ very lowb,e | Evidence is very uncertain about the effect of fosnetupitant + palonosetron on risk of serious adverse events when compared to aprepitant + granisetron |
| fosaprepitant + granisetron | 35 of 1000 | 13 of 1000 (3 to 53) | RR 0.37 | 16,065 (23) | ⊕⊕⊝⊝ lowb,c | Fosaprepitant + granisetron may decrease the risk of serious adverse events slightly when compared to aprepitant + granisetron |
| aprepitant + palonosetron | 35 of 1000 | 17 of 1000 (2 to 167) | RR 0.48 | 16,065 (23) | ⊕⊝⊝⊝ very lowb,d,e | Evidence is very uncertain about the effect of aprepitant + palonosetron on risk of serious adverse events when compared to aprepitant + granisetron |
| rolapitant + granisetron | 35 of 1000 | 20 of 1000 (7 to 60) | RR 0.57 | 16,065 (23) | ⊕⊕⊝⊝ lowb,c | Rolapitant + granisetron may decrease the risk of serious adverse events slightly when compared to aprepitant + granisetron |
| *Basis for the assumed risk is actual event rates reported for the main comparator summed across studies: 20 of 573 (3.5%) participants treated with aprepitant + granisetron experienced at least 1 SAE (aprepitant + granisetron was used in 2 studies reporting the outcome, with follow‐up of up to 29 days). The corresponding risk (and its 95% confidence interval) is based on the assumed risk in the comparison group and the risk ratio of the intervention (and its 95% CI). | ||||||
| GRADE Working Group grades of evidence. Moderate certainty: we are moderately confident in the effect estimate: the true effect is likely to be close to the estimate of effect, but there is a possibility that it is substantially different. Low certainty: our confidence in the effect estimate is limited: the true effect may be substantially different from the estimate of the effect. Very low certainty: we have very little confidence in the effect estimate: the true effect is likely to be substantially different from the estimate of effect. | ||||||
| aEither dexamethasone or methylprednisolone was used in all treatment regimens. bDowngraded once for moderate inconsistency. cDowngraded once for serious imprecision because 95% CIs cross unity and confidence intervals are wide. dDowngraded once for serious study limitations due to high risk of bias. eDowngraded twice for very serious imprecision because 95% CIs cross unity and confidence intervals are very wide, suggesting high possibility of harm. | ||||||
| Efficacy | ||||||
|---|---|---|---|---|---|---|
| Antiemetics for adults for prevention of nausea and vomiting caused by moderately emetogenic chemotherapy | ||||||
| Patient or population: adult cancer patients at risk for CINV caused by moderately emetogenic chemotherapy Settings: inpatient and outpatient care Intervention
Comparison: granisetron (5‐HT₃) + corticosteroid Outcome: complete control of vomiting during the overall phase (0 to 120 h of treatment with chemotherapy) RR < 1 indicates an advantage for the intervention Combinations of these interventions at any dose and by any route as mentioned above have been compared to one another in a full network | ||||||
| Interventions (corticosteroids included in all regimens)a | Illustrative comparative risks* (95% CI) | Risk ratio | No. of participants | Certainty of the evidence | Comments | |
| Assumed risk with granisetron | Corresponding risk with the intervention | |||||
| aprepitant + palonosetron | 555 of 1000 | 716 of 1000 (555 to 921) | RR 1.29 | 7800 (22) | ⊕⊕⊝⊝ lowb,c | Aprepitant + palonosetron may increase complete response in the overall phase when compared to granisetron |
| netupitant + palonosetron | 555 of 1000 | 694 of 1000 (510 to 944) | RR 1.25 | 7800 (22) | ⊕⊕⊝⊝ lowb,d | Netupitant + palonosetron may increase complete response in the overall phase when compared to granisetron |
| rolapitant + granisetron | 555 of 1000 | 660 of 1000 (588 to 738) | RR 1.19 | 7800 (22) | ⊕⊕⊕⊕ high | Rolapitant + granisetron results in an increase in complete response in the overall phase when compared to granisetron |
| palonosetron | 555 of 1000 | 588 of 1000 (472 to 733) | RR 1.06 | 7800 (22) | ⊕⊕⊝⊝ lowb,d | Palonosetron may or may not increase complete response in the overall phase when compared to granisetron |
| aprepitant + granisetron | 555 of 1000 | 577 of 1000 (483 to 694) | RR 1.06 | 7800 (22) | ⊕⊕⊝⊝ lowb,d | Aprepitant + palonosetron may or may not increase complete response in the overall phase when compared to granisetron |
| azasetron | 555 of 1000 | 561 of 1000 (422 to 738) | RR 1.01 | 7800 (22) | ⊕⊕⊝⊝ lowb,e | Azasetron may result in little to no difference in complete response in the overall phase when compared to granisetron |
| fosaprepitant + ondansetron | 555 of 1000 | 500 of 1000 (366 to 677) | RR 0.90 | 7800 (22) | ⊕⊕⊝⊝ lowb,d | Fosaprepitant + ondansetron may decrease complete response in the overall phase when compared to granisetron |
| aprepitant + ondansetron | 555 of 1000 | 477 of 1000 (355 to 649) | RR 0.86 | 7800 (22) | ⊕⊕⊝⊝ lowb,d | Aprepitant + ondansetron may decrease complete response in the overall phase when compared to granisetron |
| casopitant + ondansetron | 555 of 1000 | 461 of 1000 (344 to 622) | RR 0.83 (0.62 to 1.12) | 7800 (22) | ⊕⊕⊝⊝ lowb,d | Casopitant + ondansetron may decrease complete response in the overall phase when compared to granisetron |
| ondansetron | 555 of 1000 | 433 of 1000 (327 to 577) | RR 0.78 | 7800 (22) | ⊕⊕⊝⊝ lowb,d | Ondansetron may decrease complete response in the overall phase when compared to granisetron |
| *Basis for the assumed risk is actual event rates reported for the main comparator summed across studies: 623 of 1123 (55.5%) participants treated with granisetron achieved complete response during the overall phase (granisetron was used in 5 studies reporting the outcome). The corresponding risk (and its 95% confidence interval) is based on the assumed risk in the comparison group and the risk ratio of the intervention (and its 95% CI). | ||||||
| GRADE Working Group grades of evidence. Moderate certainty: we are moderately confident in the effect estimate: the true effect is likely to be close to the estimate of effect, but there is a possibility that it is substantially different. Low certainty: our confidence in the effect estimate is limited: the true effect may be substantially different from the estimate of the effect. Very low certainty: we have very little confidence in the effect estimate: the true effect is likely to be substantially different from the estimate of effect. | ||||||
| aEither dexamethasone or methylprednisolone was used in all treatment regimens. bDowngraded once for serious study limitations due to high risk of bias. cDowngraded once for serious imprecision because 95% CIs included zero effect line. dDowngraded once for serious imprecision because 95% CIs cross unity. eDowngraded once for serious imprecision due to wide confidence intervals. | ||||||
| Safety | ||||||
|---|---|---|---|---|---|---|
| Antiemetics for adults for prevention of nausea and vomiting caused by moderately emetogenic chemotherapy | ||||||
| Patient or population: adult cancer patients at risk for CINV caused by moderately emetogenic chemotherapy Settings: inpatient and outpatient care Intervention
Comparison: granisetron (5‐HT₃) + corticosteroid Outcome: serious adverse events RR < 1 indicates an advantage for the intervention Combinations of these interventions at any dose and by any route as mentioned above have been compared to one another in a full network | ||||||
| Interventions (corticosteroids included in all regimens)a | Illustrative comparative risks* (95% CI) | Risk ratio | No. of participants | Quality of the evidence | Comments | |
| Assumed risk with granisetron | Corresponding risk with the intervention | |||||
| rolapitant + granisetron | 153 of 1000 | 176 of 1000 (135 to 230) | RR 1.15 | 1344 (1) | ⊕⊕⊝⊝ lowb | Rolapitant + granisetron may increase the risk of serious adverse events slightly when compared to granisetron |
| *Basis for the assumed risk is actual event rates reported for the main comparator summed across studies: 103 of 674 (10.3%) participants treated with granisetron experienced at least 1 SAE (granisetron was used in 1 study reporting the outcome; time frame for reporting safety data was not described). The corresponding risk (and its 95% confidence interval) is based on the assumed risk in the comparison group and the risk ratio of the intervention (and its 95% CI). | ||||||
| GRADE Working Group grades of evidence. Moderate certainty: we are moderately confident in the effect estimate: the true effect is likely to be close to the estimate of effect, but there is a possibility that it is substantially different. Low certainty: our confidence in the effect estimate is limited: the true effect may be substantially different from the estimate of the effect. Very low certainty: we have very little confidence in the effect estimate: the true effect is likely to be substantially different from the estimate of effect. | ||||||
| aEither dexamethasone or methylprednisolone was used in all treatment regimens. bDowngraded twice for very serious imprecision because 95% CIs cross unity, confidence intervals are wide, and information size is small. | ||||||
| Drug combinations | Treatment regimena | Abbreviation | Used in HECb setting | Used in MECc setting |
|---|---|---|---|---|
| NK₁ receptor antagonists and 5‐HT₃ receptor antagonists + corticosteroid | aprepitant with granisetron | apre_grani | X | X |
| aprepitant with ondansetron | apre_ondan | X | X | |
| aprepitant with palonosetron | apre_palo | X | X | |
| aprepitant with ramosetron | apre_ramo | X |
| |
| aprepitant with tropisetron | apre_tropi | X |
| |
| casopitant with ondansetron | caso_ondan | X | X | |
| fosaprepitant with granisetron | fosa_grani | X | X | |
| ezlopitant with granisetron | ezlo_grani | X |
| |
| fosaprepitant with ondansetron | fosa_ondan | X | X | |
| fosaprepitant with palonosetron | fosa_palo | X |
| |
| fosnetupitant with palonosetron | fosnetu_palo | X |
| |
| netupitant with palonosetron | netu_palo | X | X | |
| rolapitant with granisetron | rola_grani | X | X | |
| rolapitant with ondansetron | rola_ondan | X |
| |
| 5‐HT₃ receptor antagonists+ corticosteroid | azasetron | aza | X | X |
| dolasetron | dola |
| X | |
| granisetron | grani | X | X | |
| ondansetron | ondan | X | X | |
| palonosetron | palo | X | X | |
| ramosetron | ramo | X | X | |
| tropisetron | tropi | X | X | |
| aAll treatment regimens also include a corticosteroid. bHighly emetogenic chemotherapy. cModerately emetogenic chemotherapy. | ||||
| Outcome | Definition | Unit of outcome measurement | Referred to as/abbreviation | Prioritisation |
|---|---|---|---|---|
| Complete control of nausea | No nausea and no significant nausea, as defined on a study levela Assessed for:
| Binary; participants with complete control of nausea | No nausea | Overall phase prioritised for GRADE assessment |
| Complete control of vomiting | No vomiting and no use of rescue medications Assessed for:
| Binary; participants with complete control of vomiting | Complete response (CR) | Delayed and overall phases prioritised for GRADE assessment Overall phase chosen as most important efficacy outcome |
| Quality of life | No impairment in quality of life during active study period | Binary; participants with no impairment in quality of life | QoL | Prioritised for GRADE assessment |
| On‐study mortality | Deaths occurring from randomisation up to 30 days after the active study period | Binary; participants who died | OSM | Prioritised for GRADE assessment |
| Adverse events | As defined on a study level; during active study period | Binary; participants with at least 1 event | AEs | ‐ |
| Serious adverse events | As defined on a study level; during active study period | Binary; participants with at least 1 event | SAEs | Prioritised for GRADE assessment Chosen as most crucial safety outcome |
| Neutropenia | As defined on a study level; during active study period | Binary; participants with at least 1 event | ‐ | ‐ |
| Febrile neutropenia | As defined on a study level; during active study period | Binary; participants with at least 1 event | ‐ | ‐ |
| Infection | As defined on a study level; during active study period | Binary; participants with at least 1 event | ‐ | ‐ |
| Local reaction at infusion site | As defined on a study level; during active study period | Binary; participants with at least 1 event | ‐ | Prioritised for GRADE assessment |
| Hiccup | As defined on a study level; during active study period | Binary; participants with at least 1 event | ‐ | ‐ |
| aStandardised tools are typically used to assess degree of nausea and vomiting (Wood 2011). No nausea and no significant nausea were defined on a study level and typically refer to pre‐defined cutoffs, e.g. in Rapoport 2015 (a) or Schwartzberg 2015, nausea was assessed on a visual analogue scale (VAS; 0 to 100 mm; 0 = no nausea, 100 = severe nausea; < 5 mm = no nausea, < 25 mm = no significant nausea). No significant nausea is typically more subjective because of the wider range on the scale and is therefore less objective, especially in an open‐label study design. To increase comparability of studies and minimise biased results, we were therefore interested in patients with no nausea. | ||||
| Antiemetics for adults for prevention of nausea and vomiting caused by highly emetogenic chemotherapy | ||||||
| Patient or population: adult cancer patients at risk for CINV caused by highly emetogenic chemotherapy Settings: inpatient and outpatient care Intervention: neurokinin‐1 (NK₁) receptor antagonist and 5‐hydroxytryptamine‐3 (5‐HT₃) receptor antagonists + corticosteroid Comparison: aprepitant (NK₁) combined with granisetron (5‐HT₃) + corticosteroid Outcome: complete control of nausea during the overall phase (0 to 120 h of treatment with chemotherapy) RR < 1 indicates an advantage for the intervention Combinations of these interventions at any dose and by any route as mentioned above have been compared to one another in a full network | ||||||
| Interventions (corticosteroids included in all regimens)a | Illustrative comparative risks* (95% CI) | Risk ratio | No. of participants | Certainty of the evidence | Comments | |
| Assumed risk with aprepitant + granisetron | Corresponding risk with the intervention | |||||
| fosaprepitant + palonosetron | 896 of 1000 | NE of 1000 (NE to NE) | RR 1.46 | 14,588 (22) | ⊕⊕⊕⊝ moderateb | Fosaprepitant + palonosetron probably results in a large increase in complete control of nausea in the overall phase when compared with aprepitant + granisetron |
| fosnetupitant + palonosetron | 896 of 1000 | NE of 1000 (851 to NE) | RR 1.21 | 14,588 (22) | ⊕⊕⊕⊝ moderatec | Fosnetupitant + palonosetron probably increases complete control of nausea in the overall phase when compared with aprepitant + granisetron |
| ezlopitant + granisetron | 896 of 1000 | NE of 1000 (554 to NE) | RR 1.31 | 14,588 (22) | ⊕⊕⊝⊝ lowd | Ezlopitant + granisetron may increase complete control of nausea in the overall phase when compared with aprepitant + granisetron |
| rolapitant + granisetron | 896 of 1000 | NE of 1000 (860 to NE) | RR 1.12 | 14,588 (22) | ⊕⊕⊕⊝ moderatec | Rolapitant + granisetron probably increases complete control of nausea in the overall phase when compared with aprepitant + granisetron |
| fosaprepitant + granisetron | 896 of 1000 | 914 of 1000 (780 to NE) | RR 1.02 | 14,588 (22) | ⊕⊕⊕⊕ high | Fosaprepitant + granisetron has little to no effect on complete control of nausea in the overall phase when compared with aprepitant + granisetron |
| rolapitant + ondansetron | 896 of 1000 | 860 of 1000 (591 to NE) | RR 0.96 | 14,588 (22) | ⊕⊕⊕⊝ moderatec | Rolapitant + ondansetron probably decreases complete control of nausea slightly in the overall phase when compared with aprepitant + granisetron |
| netupitant + palonosetron | 896 of 1000 | 860 of 1000 (753 to 986) | RR 0.96 | 14,588 (22) | ⊕⊕⊕⊕ high | Netupitant + palonosetron has little to no effect on complete control of nausea in the overall phase when compared with aprepitant + granisetron |
| fosaprepitant + ondansetron | 896 of 1000 | 806 of 1000 (645 to NE) | RR 0.90 | 14,588 (22) | ⊕⊕⊕⊝ moderatec | Fosaprepitant + ondansetron probably decreases complete control of nausea slightly in the overall phase when compared with aprepitant + granisetron |
| aprepitant + ondansetron | 896 of 1000 | 780 of 1000 (609 to NE) | RR 0.87 | 14,588 (22) | ⊕⊕⊕⊝ moderatec | Aprepitant + ondansetron probably decreases complete control of nausea in the overall phase when compared with aprepitant + granisetron |
| casopitant + ondansetron | 896 of 1000 | 717 of 1000 (538 to 950) | RR 0.80 | 14,588 (22) | ⊕⊕⊕⊝ moderatec | Casopitant + ondansetron probably decreases complete control of nausea in the overall phase when compared with aprepitant + granisetron |
| *Basis for the assumed risk is actual event rates reported for the main comparator summed across studies: 412 of 460 (89.6%) participants treated with aprepitant + granisetron experienced no nausea during the overall phase (aprepitant + granisetron was used in 5 studies reporting the outcome). The corresponding risk (and its 95% confidence interval) is based on the assumed risk in the comparison group and the risk ratio of the intervention (and its 95% CI). | ||||||
| GRADE Working Group grades of evidence. Moderate certainty: we are moderately confident in the effect estimate: the true effect is likely to be close to the estimate of effect, but there is a possibility that it is substantially different. Low certainty: our confidence in the effect estimate is limited: the true effect may be substantially different from the estimate of the effect. Very low certainty: we have very little confidence in the effect estimate: the true effect is likely to be substantially different from the estimate of effect. | ||||||
| aEither dexamethasone or methylprednisolone was used in all treatment regimens. bDowngraded once for serious study limitations due to high risk of bias. cDowngraded once for serious imprecision because 95% CIs cross unity and confidence intervals are wide. dDowngraded twice for very serious imprecision because wide confidence intervals suggest both a potentially substantial harm and benefit for the intervention. | ||||||
| Antiemetics for adults for prevention of nausea and vomiting caused by highly emetogenic chemotherapy | ||||||
| Patient or population: adult cancer patients at risk for CINV caused by highly emetogenic chemotherapy Settings: inpatient and outpatient care Intervention: neurokinin‐1 (NK₁) receptor antagonist and 5‐hydroxytryptamine‐3 (5‐HT₃) receptor antagonists + corticosteroid Comparison: aprepitant (NK₁) combined with granisetron (5‐HT₃) + corticosteroid Outcome: complete control of vomiting during the delayed phase (24 to 120 h of treatment with chemotherapy) RR > 1 indicates an advantage for the intervention Combinations of these interventions at any dose and by any route as mentioned above have been compared to one another in a full network | ||||||
| Interventions (corticosteroids included in all regimens)a | Illustrative comparative risks* (95% CI) | Risk ratio | No. of participants | Certainty of the evidence | Comments | |
|---|---|---|---|---|---|---|
| Assumed risk aprepitant + granisetron | Corresponding risk with the intervention | |||||
| fosnetupitant + palonosetron | 694 of 1000 | 784 of 1000 (632 to 972) | RR 1.13 | 21,563 (37) | ⊕⊕⊝⊝ lowb,c | Fosnetupitant + palonosetron may increase complete control of vomiting in the delayed phase when compared to aprepitant + granisetron |
| fosaprepitant + palonosetron | 694 of 1000 | 736 of 1000 (632 to 854) | RR 1.06 | 21,563 (37) | ⊕⊝⊝⊝ very lowb,c,d | Evidence is very uncertain about the effect of fosaprepitant + palonosetron on complete control of vomiting in the delayed phase when compared to aprepitant + granisetron |
| aprepitant + palonosetron | 694 of 1000 | 722 of 1000 (652 to 798) | RR 1.04 | 21,563 (37) | ⊕⊝⊝⊝ very lowb,c,d | Evidence is very uncertain about the effect of aprepitant + palonosetron on complete control of vomiting in the delayed phase when compared to aprepitant + granisetron |
| aprepitant + ramosetron | 694 of 1000 | 722 of 1000 (625 to 1.21) | RR 1.04 | 21,563 (37) | ⊕⊝⊝⊝ very lowb,c,d | Evidence is very uncertain about the effect of aprepitant + ramosetron on complete control of vomiting in the delayed phase when compared to aprepitant + granisetron |
| fosaprepitant + granisetron | 694 of 1000 | 701 of 1000 (632 to 770) | RR 1.01 | 21,563 (37) | ⊕⊕⊕⊝ moderateb | Fosaprepitant + granisetron probably has little to no effect on complete control of vomiting in the delayed phase when compared to aprepitant + granisetron |
| netupitant + palonosetron | 694 of 1000 | 687 of 1000 (618 to 763) | RR 0.99 | 21,563 (37) | ⊕⊕⊕⊝ moderateb | Netupitant + palonosetron probably has little to no effect on complete control of vomiting in the delayed phase when compared to aprepitant + granisetron |
| aprepitant + ondansetron | 694 of 1000 | 645 of 1000 (576 to 722) | RR 0.93 | 21,563 (37) | ⊕⊝⊝⊝ very lowb,c,d | Evidence is very uncertain about the effect of aprepitant + ondansetron on complete control of vomiting in the delayed phase when compared to aprepitant + granisetron |
| rolapitant + granisetron | 694 of 1000 | 632 of 1000 (541 to 736) | RR 0.91 | 21,563 (37) | ⊕⊕⊝⊝ lowb,c | Rolapitant + granisetron may decrease complete control of vomiting in the delayed phase when compared to aprepitant + granisetron |
| fosaprepitant + ondansetron | 694 of 1000 | 632 of 1000 (548 to 722) | RR 0.91 | 21,563 (37) | ⊕⊕⊝⊝ lowb,c | Fosaprepitant + ondansetron may decrease complete control of vomiting in the delayed phase when compared to aprepitant + granisetron |
| casopitant + ondansetron | 694 of 1000 | 618 of 1000 (507 to 756) | RR 0.89 | 21,563 (37) | ⊕⊕⊝⊝ lowb,c | Casopitant + ondansetron may decrease complete control of vomiting in the delayed phase when compared to aprepitant + granisetron |
| rolapitant + ondansetron | 694 of 1000 | 583 of 1000 (437 to 784) | RR 0.84 (0.63 to 1.13) | 21,563 (37) | ⊕⊝⊝⊝ very lowb,c,d | Evidence is very uncertain about the effect of rolapitant + ondansetron on complete control of vomiting in the delayed phase when compared to aprepitant + granisetron |
| *Basis for the assumed risk is actual event rates reported for the main comparator summed across studies: 1537 of 2215 (69.4%) participants treated with aprepitant + granisetron achieved complete response during the delayed phase (aprepitant + granisetron was used in 10 studies reporting the outcome). The corresponding risk (and its 95% confidence interval) is based on the assumed risk in the comparison group and the risk ratio of the intervention (and its 95% CI). | ||||||
| GRADE Working Group grades of evidence. Moderate certainty: we are moderately confident in the effect estimate: the true effect is likely to be close to the estimate of effect, but there is a possibility that it is substantially different. Low certainty: our confidence in the effect estimate is limited: the true effect may be substantially different from the estimate of the effect. Very low certainty: we have very little confidence in the effect estimate: the true effect is likely to be substantially different from the estimate of effect. | ||||||
| aEither dexamethasone or methylprednisolone was used in all treatment regimens. bDowngraded once for moderate inconsistency. cDowngraded once for serious imprecision because 95% CIs cross unity and confidence intervals are wide. dDowngraded once for serious study limitations due to high risk of bias. | ||||||
| Antiemetics for adults for prevention of nausea and vomiting caused by highly emetogenic chemotherapy | ||||||
| Patient or population: adult cancer patients at risk for CINV caused by highly emetogenic chemotherapy Settings: inpatient and outpatient care Intervention: neurokinin‐1 (NK₁) receptor antagonist and 5‐hydroxytryptamine‐3 (5‐HT₃) receptor antagonists + corticosteroid Comparison: aprepitant (NK₁) combined with granisetron (5‐HT₃) + corticosteroid Outcome: no impairment in quality of life RR <1 indicates an advantage for the intervention Combinations of these interventions at any dose and by any route as mentioned above have been compared to one another in a full network | ||||||
| Interventions (corticosteroids included in all regimens)a | Illustrative comparative risks* (95% CI) | Risk ratio (95% CI) | No. of participants (studies) | Certainty of the evidence (GRADE) | Comments | |
| Assumed risk with aprepitant + granisetron | Corresponding risk with the intervention | |||||
| rolapitant + ondansetron | 714 of 1000 | 893 of 1000 (486 to 1649) | RR 1.25 | 7894 (14) | ⊕⊝⊝⊝ very lowb,c | Evidence is uncertain about the effect of rolapitant + ondansetron on quality of life when compared to aprepitant + granisetron |
| netupitant + palonosetron | 714 of 1000 | 764 of 1000 (585 to 1007) | RR 1.07 | 7894 (14) | ⊕⊝⊝⊝ very lowb,d | Evidence is uncertain about the effect of netupitant + palonosetron on quality of life when compared to aprepitant + granisetron |
| casopitant + ondansetron | 714 of 1000 | 743 of 1000 (421 to 1307) | RR 1.04 | 7894 (14) | ⊕⊝⊝⊝ very lowb,c | Evidence is uncertain about the effect of casopitant + ondansetron on quality of life when compared to aprepitant + granisetron |
| rolapitant + granisetron | 714 of 1000 | 693 of 1000 (521 to 921) | RR 0.97 | 7894 (14) | ⊕⊝⊝⊝ very lowb,d | Evidence is uncertain about the effect of rolapitant + granisetron on quality of life when compared to aprepitant + granisetron |
| aprepitant + ondansetron | 714 of 1000 | 657 of 1000 (393 to 1100) | RR 0.92 | 7894 (14) | ⊕⊝⊝⊝ very lowb,c,e | Evidence is uncertain about the effect of aprepitant + ondansetron on quality of life when compared to aprepitant + granisetron |
| *Basis for the assumed risk is actual event rates reported for the main comparator summed across studies: 569 of 797 participants treated with aprepitant + granisetron experienced no impact on QoL (aprepitant + granisetron was used in 3 studies reporting the outcome, follow‐up on Day 6). The corresponding risk (and its 95% confidence interval) is based on the assumed risk in the comparison group and the risk ratio of the intervention (and its 95% CI). | ||||||
| GRADE Working Group grades of evidence. Moderate certainty: we are moderately confident in the effect estimate: the true effect is likely to be close to the estimate of effect, but there is a possibility that it is substantially different. Low certainty: our confidence in the effect estimate is limited: the true effect may be substantially different from the estimate of the effect. Very low certainty: we have very little confidence in the effect estimate: the true effect is likely to be substantially different from the estimate of effect. | ||||||
| aEither dexamethasone or methylprednisolone was used in all treatment regimens. bDowngraded twice for high inconsistency within the network. cDowngraded twice for very serious imprecision because 95% CIs cross unity and confidence intervals are very wide, suggesting high benefit for the comparator. dDowngraded once for serious imprecision because 95% CIs cross unity and confidence intervals are wide. eDowngraded once for serious study limitations due to high risk of bias. | ||||||
| Antiemetics for adults for prevention of nausea and vomiting caused by highly emetogenic chemotherapy | ||||||
| Patient or population: adult cancer patients at risk for CINV caused by highly emetogenic chemotherapy Settings: inpatient and outpatient care Intervention: neurokinin‐1 (NK₁) receptor antagonist and 5‐hydroxytryptamine‐3 (5‐HT₃) receptor antagonists + corticosteroid Comparison: aprepitant (NK₁) combined with granisetron (5‐HT₃) + corticosteroid Outcome: on‐study mortality RR < 1 indicates an advantage for the intervention Combinations of these interventions at any dose and by any route as mentioned above have been compared to one another in a full network | ||||||
| Interventions (corticosteroids included in all regimens)a | Illustrative comparative risks* (95% CI) | Risk ratio (95% CI) | No. of participants (studies) | Certainty of the evidence (GRADE) | Comments | |
| Assumed risk with aprepitant + granisetron | Corresponding risk with the intervention | |||||
| netupitant + palonosetron | 8 of 1000 | 2 of 1000 (0 to 19) | RR 0.29 | 8030 (16) | ⊕⊕⊝⊝ lowb | Netupitant + palonosetron may have little to no effect on on‐study mortality when compared with aprepitant + granisetron |
| aprepitant + ondansetron | 8 of 1000 | 5 of 1000 (1 to 35) | RR 0.57 | 8030 (16) | ⊕⊕⊝⊝ lowb | Aprepitant + ondansetron may have little to no effect on on‐study mortality when compared with aprepitant + granisetron |
| casopitant + ondansetron | 8 of 1000 | 5 of 1000 (1 to 44) | RR 0.65 | 8030 (16) | ⊕⊕⊝⊝ lowb | Casopitant + ondansetron may have little to no effect on on‐study mortality when compared with aprepitant + granisetron |
| rolapitant + granisetron | 8 of 1000 | 5 of 1000 (1 to 33) | RR 0.66 | 8030 (16) | ⊕⊕⊝⊝ lowb | Rolapitant + granisetron may have little to no effect on on‐study mortality when compared with aprepitant + granisetron |
| rolapitant + ondansetron | 8 of 1000 | 12 of 1000 (1 to 216) | RR 1.56 | 8030 (16) | ⊕⊕⊝⊝ lowb | Rolapitant + ondansetron may have little to no effect on on‐study mortality when compared with aprepitant + granisetron |
| *Basis for the assumed risk is actual event rates reported for the main comparator summed across studies: 7 of 844 (0.08%) participants treated with aprepitant + granisetron died during the study (aprepitant + granisetron was used in 4 studies reporting the outcome, with follow‐up of up to 29 days). The corresponding risk (and its 95% confidence interval) is based on the assumed risk in the comparison group and the risk ratio of the intervention (and its 95% CI). | ||||||
| GRADE Working Group grades of evidence. Moderate certainty: we are moderately confident in the effect estimate: the true effect is likely to be close to the estimate of effect, but there is a possibility that it is substantially different. Low certainty: our confidence in the effect estimate is limited: the true effect may be substantially different from the estimate of the effect. Very low certainty: we have very little confidence in the effect estimate: the true effect is likely to be substantially different from the estimate of effect. | ||||||
| aEither dexamethasone or methylprednisolone was used in all treatment regimens. bDowngraded twice for very serious imprecision due to few events and very wide confidence intervals, suggesting potential benefit and harm for the comparator. | ||||||
| Antiemetics for adults for prevention of nausea and vomiting caused by moderately emetogenic chemotherapy | ||||||
| Patient or population: adult cancer patients at risk for CINV caused by moderately emetogenic chemotherapy Settings: inpatient and outpatient care Intervention:
Comparison: granisetron (5‐HT₃) + corticosteroid Outcome: complete control of nausea during the overall phase (0 to 120 h of treatment with chemotherapy) RR < 1 indicates an advantage for the intervention. Combinations of these interventions at any dose and by any route as mentioned above have been compared to one another in a full network | ||||||
| Interventions (corticosteroids included in all regimens)a | Illustrative comparative risks* (95% CI) | Risk ratio (95% CI) | No. of participants (studies) | Certainty of the evidence (GRADE) | Comments | |
| Assumed risk with granisetron | Corresponding risk with the intervention | |||||
|
|
| |||||
| aprepitant + granisetron | 419 of 1000 | 570 of 1000 (365 to 897) | RR 1.36 | 1423 (2) | ⊕⊕⊝⊝ lowb | Aprepitant + granisetron may increase complete control of nausea in the overall phase when compared with granisetron |
| rolapitant + granisetron | 419 of 1000 | 453 of 1000 (402 to 511) | RR 1.08 | 1423 (2) | ⊕⊕⊝⊝ lowc | Rolapitant + granisetron may increase complete control of nausea in the overall phase slightly when compared with granisetron |
| *Basis for the assumed risk is actual event rates reported for the main comparator summed across studies: 298 of 712 (41.9%) participants treated with granisetron experienced no nausea during the overall phase (granisetron was used in 2 studies reporting the outcome). The corresponding risk (and its 95% confidence interval) is based on the assumed risk in the comparison group and the risk ratio of the intervention (and its 95% CI). | ||||||
| GRADE Working Group grades of evidence. Moderate certainty: we are moderately confident in the effect estimate: the true effect is likely to be close to the estimate of effect, but there is a possibility that it is substantially different. Low certainty: our confidence in the effect estimate is limited: the true effect may be substantially different from the estimate of the effect. Very low certainty: we have very little confidence in the effect estimate: the true effect is likely to be substantially different from the estimate of effect. | ||||||
| aEither dexamethasone or methylprednisolone was used in all treatment regimens. bDowngraded twice for very serious imprecision because 95% CIs cross unity, information size is small, and confidence intervals are very wide, suggesting benefit and harm for the comparator. cDowngraded twice for very serious imprecision because 95% CIs cross unity, confidence intervals are wide, and information size is small. | ||||||
| Antiemetics for adults for prevention of nausea and vomiting caused by moderately emetogenic chemotherapy | ||||||
| Patient or population: adult cancer patients at risk for CINV caused by moderately emetogenic chemotherapy Settings: inpatient and outpatient care Intervention:
Comparison: granisetron (5‐HT₃) + corticosteroid Outcome: complete control of vomiting during the delayed phase (24 to 120 h of treatment with chemotherapy) RR > 1 indicates an advantage for the intervention Combinations of these interventions at any dose and by any route as mentioned above have been compared to one another in a full network | ||||||
| Interventions (corticosteroids included in all regimens)a | Illustrative comparative risks* (95% CI) | Risk ratio | No. of participants | Certainty of the evidence | Comments | |
|---|---|---|---|---|---|---|
| Assumed risk with granisetron | Corresponding risk with the intervention | |||||
|
|
| |||||
| aprepitant + palonosetron | 641 of 1000 | 823 of 1000 (712 to 962) | RR 1.29 | 8421 (21) | ⊕⊕⊕⊝ moderateb | Aprepitant + palonosetron likely results in a large increase of complete control of vomiting during the delayed phase when compared to granisetron |
| rolapitant + granisetron | 641 of 1000 | 744 of 1000 (679 to 814) | RR 1.16 | 8421 (21) | ⊕⊕⊕⊕ high | Rolapitant + granisetron increases complete control of vomiting during the delayed phase when compared to granisetron |
| palonosetron | 641 of 1000 | 679 of 1000 (622 to 750) | RR 1.06 | 8421 (21) | ⊕⊕⊝⊝ lowb,c | Palonosetron may increase complete control of vomiting during the delayed phase slightly when compared to granisetron, but the evidence is uncertain |
| aprepitant + granisetron | 641 of 1000 | 667 of 1000 (564 to 788) | RR 1.04 | 8421 (21) | ⊕⊕⊝⊝ lowb,c | Palonosetron may or may not increase complete control of vomiting during the delayed phase slightly when compared to granisetron, but the evidence is uncertain |
| azasetron | 641 of 1000 | 647 of 1000 (494 to 846) | RR 1.01 | 8421 (21) | ⊕⊕⊝⊝ lowb,d | Azasetron may result in little to no difference in complete control of vomiting during the delayed phase slightly when compared to granisetron, but the evidence is uncertain |
| fosaprepitant + ondansetron | 641 of 1000 | 596 of 1000 (551 to 718) | RR 0.98 | 8421 (21) | ⊕⊕⊕⊝ moderateb | Fosaprepitant + ondansetron probably results in little to no difference in complete control of vomiting during the delayed phase slightly when compared to granisetron |
| aprepitant + ondansetron | 641 of 1000 | 596 of 1000 (526 to 679) | RR 0.93 | 8421 (21) | ⊕⊕⊝⊝ lowb,c | Aprepitant + ondansetron may decrease complete control of vomiting during the delayed phase slightly when compared to granisetron, but the evidence is uncertain |
| casopitant + ondansetron | 641 of 1000 | 570 of 1000 (506 to 647) | RR 0.89 | 8421 (21) | ⊕⊕⊝⊝ lowb,d | Casopitant + ondansetron may decrease complete control of vomiting during the delayed phase when compared to granisetron, but the evidence is uncertain |
| ondansetron | 641 of 1000 | 551 of 1000 (493 to 609) | RR 0.86 | 8421 (21) | ⊕⊕⊕⊝ moderateb | Ondansetron probably decreases complete control of vomiting during the delayed phase when compared to granisetron |
| *Basis for the assumed risk is actual event rates reported for the main comparator summed across studies: 953 of 1486 (64.1%) participants treated with granisetron achieved complete response during the delayed phase (granisetron was used in 7 studies reporting the outcome). The corresponding risk (and its 95% confidence interval) is based on the assumed risk in the comparison group and the risk ratio of the intervention (and its 95% CI). | ||||||
| GRADE Working Group grades of evidence. Moderate certainty: we are moderately confident in the effect estimate: the true effect is likely to be close to the estimate of effect, but there is a possibility that it is substantially different. Low certainty: our confidence in the effect estimate is limited: the true effect may be substantially different from the estimate of the effect. Very low certainty: we have very little confidence in the effect estimate: the true effect is likely to be substantially different from the estimate of effect. | ||||||
| aEither dexamethasone or methylprednisolone was used in all treatment regimens. bDowngraded once for serious study limitations due to high risk of bias. cDowngraded once for serious imprecision because 95% CIs cross unity and include potential advantages and disadvantages. dDowngraded once for serious imprecision due to wide confidence intervals. | ||||||
| Antiemetics for adults for prevention of nausea and vomiting caused by moderately emetogenic chemotherapy | ||||||
| Patient or population: adult cancer patients at risk for CINV caused by moderately emetogenic chemotherapy Settings: inpatient and outpatient care Intervention
Comparison: granisetron (5‐HT₃) + corticosteroid Outcome: no impairment in quality of life RR < 1 indicates an advantage for the intervention. Combinations of these interventions at any dose and by any route as mentioned above have been compared to one another in a full network. | ||||||
| Interventions (corticosteroids included in all regimens)a | Illustrative comparative risks* (95% CI) | Risk ratio (95% CI) | No. of participants (studies) | Certainty of the evidence (GRADE) | Comments | |
| Assumed risk with granisetron | Corresponding risk with the intervention
| |||||
| rolapitant + granisetron | 674 of 1000 | 620 of 1000 (580 to 667) | RR 0.92 | 1212 (1) | ⊕⊕⊕⊝ moderateb | Rolapitant + granisetron probably decreases quality of life slightly when compared to granisetron |
| *Basis for the assumed risk is actual event rates reported for the main comparator summed across studies: 409 of 607 (67.4%) participants treated with granisetron experienced no impact on QoL (granisetron was used in 1 study reporting the outcome, follow‐up on Day 6). The corresponding risk (and its 95% confidence interval) is based on the assumed risk in the comparison group and the risk ratio of the intervention (and its 95% CI). | ||||||
| GRADE Working Group grades of evidence. Moderate certainty: we are moderately confident in the effect estimate: the true effect is likely to be close to the estimate of effect, but there is a possibility that it is substantially different. Low certainty: our confidence in the effect estimate is limited: the true effect may be substantially different from the estimate of the effect. Very low certainty: we have very little confidence in the effect estimate: the true effect is likely to be substantially different from the estimate of effect. | ||||||
| aEither dexamethasone or methylprednisolone was used in all treatment regimens. bDowngraded once for serious imprecision for the small sample size. | ||||||
| Antiemetics for adults for prevention of nausea and vomiting caused by moderately emetogenic chemotherapy | ||||||
| Patient or population: adult cancer patients at risk for CINV caused by moderately emetogenic chemotherapy Settings: inpatient and outpatient care Intervention
Comparison: granisetron (5‐HT₃) + corticosteroid Outcome: on‐study mortality RR < 1 indicates an advantage for the intervention. Combinations of these interventions at any dose and by any route as mentioned above have been compared to one another in a full network. | ||||||
| Interventions (corticosteroids included in all regimens)a | Illustrative comparative risks* (95% CI) | Risk ratio (95% CI) | No. of participants (studies) | Certainty of the evidence (GRADE) | Comments | |
| Assumed risk with granisetron
| Corresponding risk with the intervention | |||||
| rolapitant + granisetron | 6 of 1000 | 18 of 1000 (6 to 56) | RR 3.00 | 1369 (1) | ⊕⊕⊝⊝ lowb | Rolapitant + granisetron may make little to no difference in on‐study mortality when compared to granisetron |
| *Basis for the assumed risk is actual event rates reported for the main comparator summed across studies: 4 of 685 (0.6%) participants treated with granisetron died during the study (granisetron was used in 1 study reporting the outcome, time frame for reporting safety data was not described). The corresponding risk (and its 95% confidence interval) is based on the assumed risk in the comparison group and the risk ratio of the intervention (and its 95% CI). | ||||||
| GRADE Working Group grades of evidence. Moderate certainty: we are moderately confident in the effect estimate: the true effect is likely to be close to the estimate of effect, but there is a possibility that it is substantially different. Low certainty: our confidence in the effect estimate is limited: the true effect may be substantially different from the estimate of the effect. Very low certainty: we have very little confidence in the effect estimate: the true effect is likely to be substantially different from the estimate of effect. | ||||||
| aEither dexamethasone or methylprednisolone was used in all treatment regimens. bDowngraded twice for very serious imprecision because 95% CIs cross unity and because of the small information size. | ||||||