| Antiemetics for adults for prevention of nausea and vomiting caused by highly emetogenic chemotherapy |
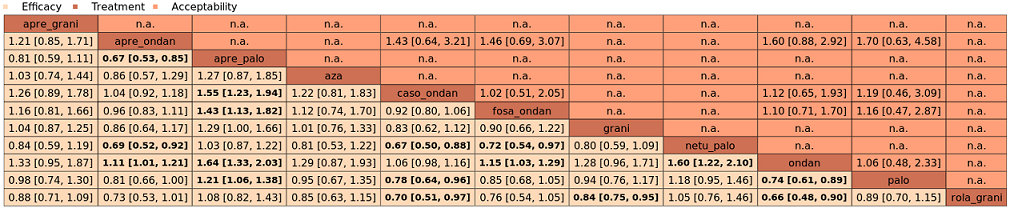
| Patient or population: adult cancer patients at risk for CINV caused by highly emetogenic chemotherapy Settings: inpatient and outpatient care Intervention: neurokinin‐1 (NK₁) receptor antagonist and 5‐hydroxytryptamine‐3 (5‐HT₃) receptor antagonists + corticosteroid Comparison: aprepitant (NK₁) combined with granisetron (5‐HT₃) + corticosteroid Outcome: complete control of nausea during the overall phase (0 to 120 h of treatment with chemotherapy) RR < 1 indicates an advantage for the intervention Combinations of these interventions at any dose and by any route as mentioned above have been compared to one another in a full network |
| Interventions (corticosteroids included in all regimens)a | Illustrative comparative risks* (95% CI) | Risk ratio
(95% CI) | No. of participants
(studies) | Certainty of the evidence
(GRADE) | Comments |
| Assumed risk with aprepitant + granisetron | Corresponding risk with the intervention |
| fosaprepitant + palonosetron | 896 of 1000 | NE of 1000 (NE to NE) | RR 1.46
(1.12 to 1.90) | 14,588 (22) | ⊕⊕⊕⊝ moderateb | Fosaprepitant + palonosetron probably results in a large increase in complete control of nausea in the overall phase when compared with aprepitant + granisetron |
| fosnetupitant + palonosetron | 896 of 1000 | NE of 1000 (851 to NE) | RR 1.21
(0.95 to 1.56) | 14,588 (22) | ⊕⊕⊕⊝ moderatec | Fosnetupitant + palonosetron probably increases complete control of nausea in the overall phase when compared with aprepitant + granisetron |
| ezlopitant + granisetron | 896 of 1000 | NE of 1000 (554 to NE) | RR 1.31
(0.62 to 2.80) | 14,588 (22) | ⊕⊕⊝⊝ lowd | Ezlopitant + granisetron may increase complete control of nausea in the overall phase when compared with aprepitant + granisetron |
| rolapitant + granisetron | 896 of 1000 | NE of 1000 (860 to NE) | RR 1.12
(0.96 to 1.31) | 14,588 (22) | ⊕⊕⊕⊝ moderatec | Rolapitant + granisetron probably increases complete control of nausea in the overall phase when compared with aprepitant + granisetron |
| fosaprepitant + granisetron | 896 of 1000 | 914 of 1000 (780 to NE) | RR 1.02
(0.87 to 1.20) | 14,588 (22) | ⊕⊕⊕⊕ high | Fosaprepitant + granisetron has little to no effect on complete control of nausea in the overall phase when compared with aprepitant + granisetron |
| rolapitant + ondansetron | 896 of 1000 | 860 of 1000 (591 to NE) | RR 0.96
(0.66 to 1.39) | 14,588 (22) | ⊕⊕⊕⊝ moderatec | Rolapitant + ondansetron probably decreases complete control of nausea slightly in the overall phase when compared with aprepitant + granisetron |
| netupitant + palonosetron | 896 of 1000 | 860 of 1000 (753 to 986) | RR 0.96
(0.84 to 1.10) | 14,588 (22) | ⊕⊕⊕⊕ high | Netupitant + palonosetron has little to no effect on complete control of nausea in the overall phase when compared with aprepitant + granisetron |
| fosaprepitant + ondansetron | 896 of 1000 | 806 of 1000 (645 to NE) | RR 0.90
(0.72 to 1.13) | 14,588 (22) | ⊕⊕⊕⊝ moderatec | Fosaprepitant + ondansetron probably decreases complete control of nausea slightly in the overall phase when compared with aprepitant + granisetron |
| aprepitant + ondansetron | 896 of 1000 | 780 of 1000 (609 to NE) | RR 0.87
(0.68 to 1.10) | 14,588 (22) | ⊕⊕⊕⊝ moderatec | Aprepitant + ondansetron probably decreases complete control of nausea in the overall phase when compared with aprepitant + granisetron |
| casopitant + ondansetron | 896 of 1000 | 717 of 1000 (538 to 950) | RR 0.80
(0.60 to 1.06) | 14,588 (22) | ⊕⊕⊕⊝ moderatec | Casopitant + ondansetron probably decreases complete control of nausea in the overall phase when compared with aprepitant + granisetron |
| *Basis for the assumed risk is actual event rates reported for the main comparator summed across studies: 412 of 460 (89.6%) participants treated with aprepitant + granisetron experienced no nausea during the overall phase (aprepitant + granisetron was used in 5 studies reporting the outcome). The corresponding risk (and its 95% confidence interval) is based on the assumed risk in the comparison group and the risk ratio of the intervention (and its 95% CI).
CI: confidence interval; NE: not estimable; RR: risk ratio. |
| GRADE Working Group grades of evidence.
High certainty: we are very confident that the true effect lies close to that of the estimate of the effect Moderate certainty: we are moderately confident in the effect estimate: the true effect is likely to be close to the estimate of effect, but there is a possibility that it is substantially different. Low certainty: our confidence in the effect estimate is limited: the true effect may be substantially different from the estimate of the effect. Very low certainty: we have very little confidence in the effect estimate: the true effect is likely to be substantially different from the estimate of effect. |
| aEither dexamethasone or methylprednisolone was used in all treatment regimens. bDowngraded once for serious study limitations due to high risk of bias. cDowngraded once for serious imprecision because 95% CIs cross unity and confidence intervals are wide. dDowngraded twice for very serious imprecision because wide confidence intervals suggest both a potentially substantial harm and benefit for the intervention. |