Desfibriladores cardíacos implantables para los pacientes con miocardiopatía no isquémica
Información
- DOI:
- https://doi.org/10.1002/14651858.CD012738.pub2Copiar DOI

- Base de datos:
-
- Cochrane Database of Systematic Reviews
- Versión publicada:
-
- 08 diciembre 2018see what's new
- Tipo:
-
- Intervention
- Etapa:
-
- Review
- Grupo Editorial Cochrane:
-
Grupo Cochrane de Corazón
- Copyright:
-
- Copyright © 2018 The Cochrane Collaboration. Published by John Wiley & Sons, Ltd.
Cifras del artículo
Altmetric:
Citado por:
Autores
Contributions of authors
Mohamad El Moheb conceived the review.
Johny Nicolas conceived the review.
Assem Khamis helped with data analysis.
Ghida Iskandarani helped draft the protocol.
Elie A Akl helped draft and revise the review.
Marwan Refaat helped draft the review and revised the review.
Sources of support
Internal sources
-
No sources of support supplied
External sources
-
Northwestern University Feinberg School of Medicine and the Northwestern University Clinical and Translational Science (NUCATS) Institute (UL1TR000150), USA.
The Cochrane Heart Group US Satellite is supported by intramural support from the Northwestern University Feinberg School of Medicine and the NUCATS Institute (UL1TR000150).
-
National Institute for Health Research (NIHR), UK.
This project was supported by the NIHR, via Cochrane Infrastructure funding to the Cochrane Heart Group. The views and opinions expressed therein are those of the authors and do not necessarily reflect those of the Systematic Reviews Programme, the NIHR, the National Health Service (NHS), or the Department of Health.
Declarations of interest
Mohamad El Moheb has no conflict of interest to declare.
Johny Nicolas has no conflict of interest to declare.
Assem Khamis has no conflict of interest to declare.
Ghida Iskandarani has no conflict of interest to declare.
Elie A Akl has no conflict of interest to declare.
Marwan Refaat has no conflict of interest to declare.
Acknowledgements
We thank Cochrane Heart for providing a template protocol.
We thank Nicole Martin and other staff in Cochrane Heart for their assistance with the review.
We thank Cochrane Information Specialist Charlene Bridges and Cochrane Information Specialist Support for running the initial search for us.
We thank Ms Aida Farha (Librarian at the Saab Medical Library at the American University of Beirut) who helped us review the literature.
We thank Ms Lara Kahale and Ms Amena El Harakeh for revising our review.
Version history
| Published | Title | Stage | Authors | Version |
| 2018 Dec 08 | Implantable cardiac defibrillators for people with non‐ischaemic cardiomyopathy | Review | Mohamad El Moheb, Johny Nicolas, Assem M Khamis, Ghida Iskandarani, Elie A Akl, Marwan Refaat | |
| 2017 Jul 28 | Implantable cardiac defibrillators for patients with non‐ischaemic cardiomyopathy | Protocol | Mohamad El Moheb, Johny Nicolas, Ghida Iskandarani, Elie A Akl, Marwan Refaat | |
Differences between protocol and review
There were several differences between how we conducted the review and how we planned to do so in the protocol (El Moheb 2017).
We initially planned to analyse dichotomous data as risk ratio only. However, since more studies reported hazard ratio than risk ratio, and since hazard ratio accounts for time and censorship, we decided to perform an analysis for hazard ratio as well.
In addition to the databases listed in the protocol (i.e. CENTRAL, MEDLINE, Embase, Web of Science), we searched the grey literature using the European Association for Grey Literature Exploitation (EAGLE) and National Technical Information Serve (NTIS) databases.
In the protocol, we planned to study the cost of ICD treatment compared to optimal medical therapy as a secondary outcome. We revised the Methods section and decided that it would be more valuable to report data on the cost‐effectiveness of ICDs.
In the protocol, we planned to include in our analysis only data from participants with non‐ischaemic cardiomyopathy. We found little data for the effect of ICD on adverse events and quality of life in participants with non‐ischaemic cardiomyopathy. A number of trials that included participants with ischaemic cardiomyopathy and those with non‐ischaemic cardiomyopathy reported adverse events and quality of life for the total population (i.e. participants with ischaemic cardiomyopathy and those with non‐ischaemic cardiomyopathy), but not for non‐ischaemic participants only. Hence, we pooled data from trials with mixed participants when the percentage of participants with ischaemic cardiomyopathy was less than 25%.
We performed a post hoc meta‐regression based on the number of participants included per hospital per year to explore sources of heterogeneity.
We made several modifications with respect to the subgroup analyses. First, we only performed a subgroup analysis for all‐cause mortality and adverse events, as the necessary data were lacking for the other outcomes. Moreover, we defined the following subgroups for analysis in our protocol: follow‐up duration of studies (< 24 months versus 24 to 36 months versus > 36 months), diabetes (yes versus no), mean estimated glomerular filtration rate (< 60 mL/min/1.73 m² versus ≥ 60 mL/min/1.73 m²), and pre‐existing pacemaker (yes versus no). Since no study had a follow‐up time of less than 24 months, we have redefined the subgroup in the review as follows: follow‐up duration of studies < 36 months versus ≥ 36 months. We did not conduct an analysis on the last three subgroups since it would be unlikely for the differences, if detected, to be real rather than due to residual confounding.
Keywords
MeSH
Medical Subject Headings (MeSH) Keywords
Medical Subject Headings Check Words
Humans;
PICO

Study flow diagram.
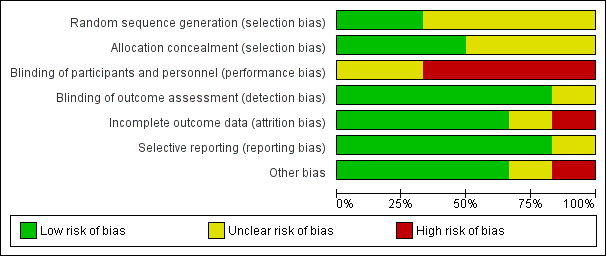
Risk of bias graph: review authors' judgements about each risk of bias item presented as percentages across all included studies.

Risk of bias summary: review authors' judgements about each risk of bias item for each included study.
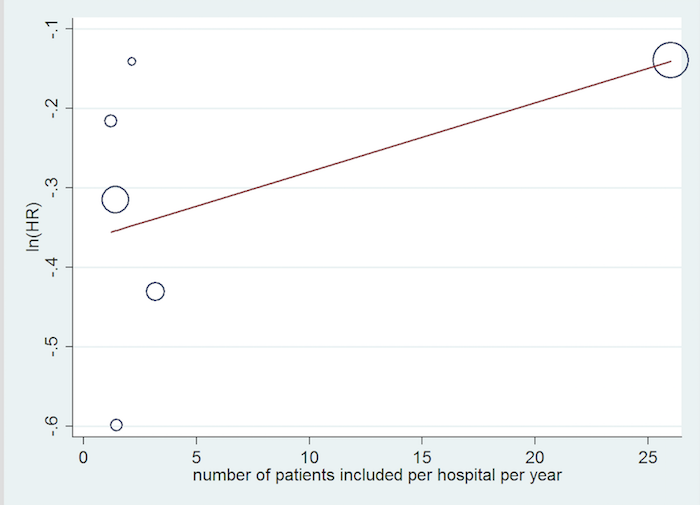
Inclusion rate meta‐regression.

Comparison 1 ICD plus optimal medical therapy compared to optimal medical therapy alone, Outcome 1 All‐cause mortality (HR) ‐ main analysis.

Comparison 1 ICD plus optimal medical therapy compared to optimal medical therapy alone, Outcome 2 All‐cause mortality (RR).
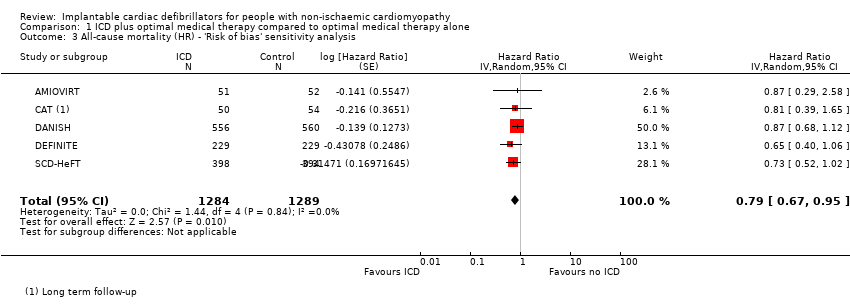
Comparison 1 ICD plus optimal medical therapy compared to optimal medical therapy alone, Outcome 3 All‐cause mortality (HR) ‐ 'Risk of bias' sensitivity analysis.
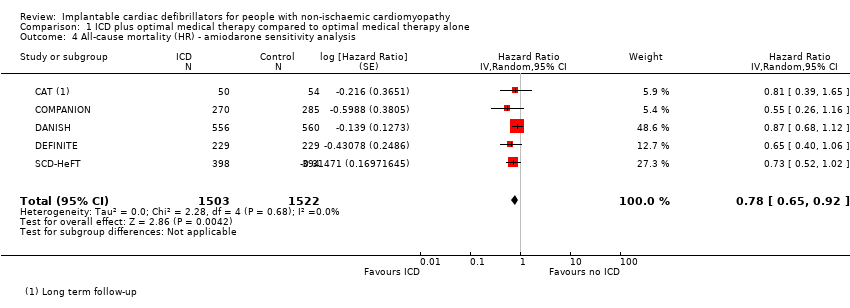
Comparison 1 ICD plus optimal medical therapy compared to optimal medical therapy alone, Outcome 4 All‐cause mortality (HR) ‐ amiodarone sensitivity analysis.
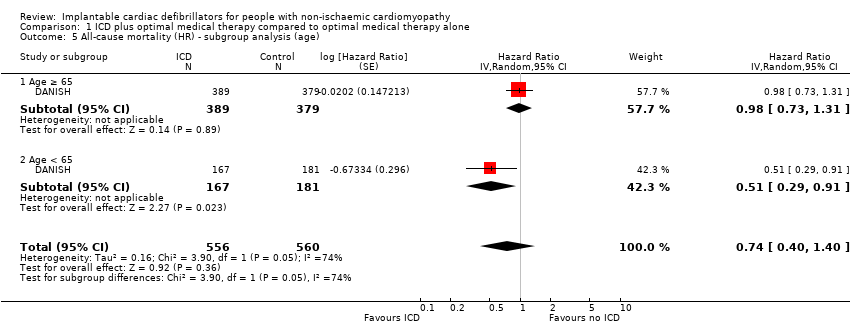
Comparison 1 ICD plus optimal medical therapy compared to optimal medical therapy alone, Outcome 5 All‐cause mortality (HR) ‐ subgroup analysis (age).

Comparison 1 ICD plus optimal medical therapy compared to optimal medical therapy alone, Outcome 6 All‐cause mortality (HR) ‐ subgroup analysis (gender).

Comparison 1 ICD plus optimal medical therapy compared to optimal medical therapy alone, Outcome 7 All‐cause mortality (HR) ‐ subgroup analysis (CRT).

Comparison 1 ICD plus optimal medical therapy compared to optimal medical therapy alone, Outcome 8 All‐cause mortality (HR) ‐ subgroup analysis (NYHA).

Comparison 1 ICD plus optimal medical therapy compared to optimal medical therapy alone, Outcome 9 All‐cause mortality (HR) ‐ subgroup analysis (heart failure duration).

Comparison 1 ICD plus optimal medical therapy compared to optimal medical therapy alone, Outcome 10 All‐cause mortality (HR) ‐ subgroup analysis (LVEF).

Comparison 1 ICD plus optimal medical therapy compared to optimal medical therapy alone, Outcome 11 All‐cause mortality (HR) ‐ subgroup analysis (year of publication).

Comparison 1 ICD plus optimal medical therapy compared to optimal medical therapy alone, Outcome 12 All‐cause mortality (HR) ‐ subgroup analysis (mean follow‐up time).

Comparison 1 ICD plus optimal medical therapy compared to optimal medical therapy alone, Outcome 13 Cardiovascular mortality (HR).
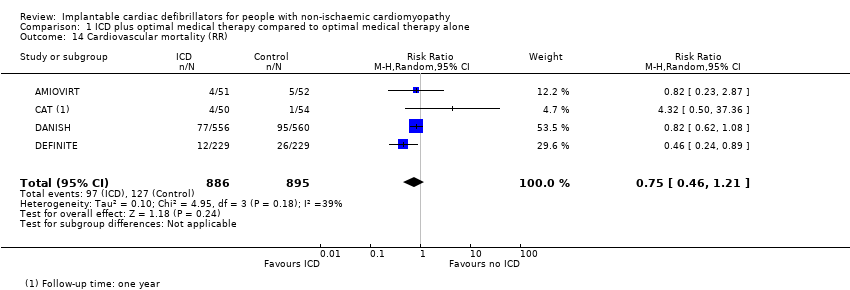
Comparison 1 ICD plus optimal medical therapy compared to optimal medical therapy alone, Outcome 14 Cardiovascular mortality (RR).
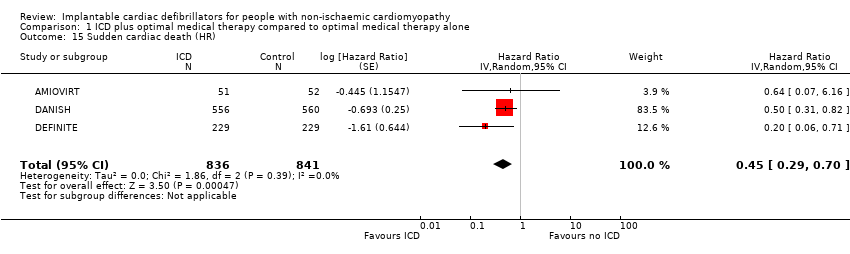
Comparison 1 ICD plus optimal medical therapy compared to optimal medical therapy alone, Outcome 15 Sudden cardiac death (HR).
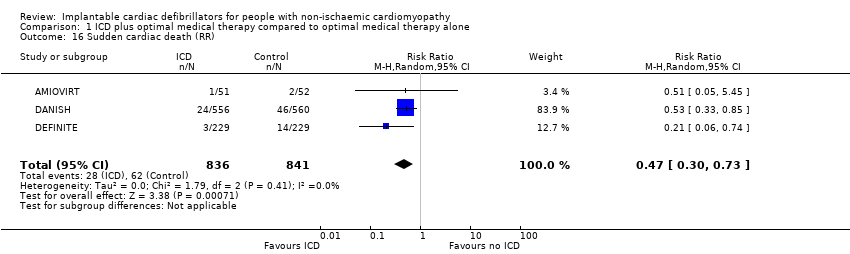
Comparison 1 ICD plus optimal medical therapy compared to optimal medical therapy alone, Outcome 16 Sudden cardiac death (RR).

Comparison 1 ICD plus optimal medical therapy compared to optimal medical therapy alone, Outcome 17 Adverse events ‐ device infection (RR).
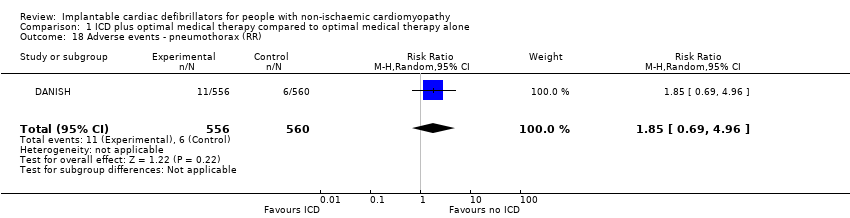
Comparison 1 ICD plus optimal medical therapy compared to optimal medical therapy alone, Outcome 18 Adverse events ‐ pneumothorax (RR).
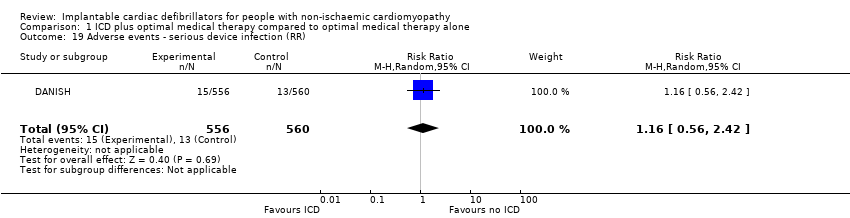
Comparison 1 ICD plus optimal medical therapy compared to optimal medical therapy alone, Outcome 19 Adverse events ‐ serious device infection (RR).

Comparison 1 ICD plus optimal medical therapy compared to optimal medical therapy alone, Outcome 20 Adverse events ‐ bleeding requiring intervention (RR).
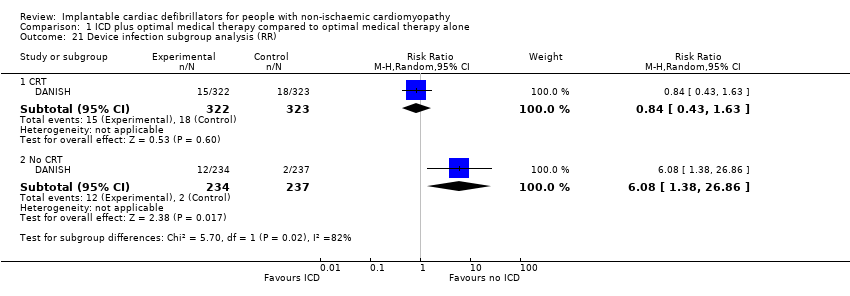
Comparison 1 ICD plus optimal medical therapy compared to optimal medical therapy alone, Outcome 21 Device infection subgroup analysis (RR).

Comparison 1 ICD plus optimal medical therapy compared to optimal medical therapy alone, Outcome 22 Serious device infection subgroup analysis (RR).
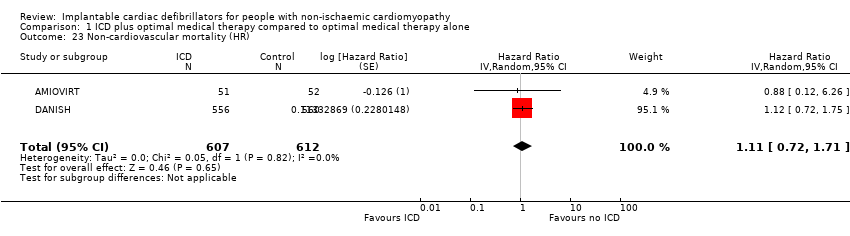
Comparison 1 ICD plus optimal medical therapy compared to optimal medical therapy alone, Outcome 23 Non‐cardiovascular mortality (HR).

Comparison 1 ICD plus optimal medical therapy compared to optimal medical therapy alone, Outcome 24 Non‐cardiovascular mortality (RR).
| ICD plus optimal medical therapy compared to optimal medical therapy alone for people with non‐ischaemic cardiomyopathy Population: people with non‐ischaemic cardiomyopathy Setting: USA, Israel, New Zealand, Canada, Germany, and Denmark Intervention: implantable cardioverter‐defibrillator in addition to optimal medical therapy Comparator: optimal medical therapy alone | |||||
| Outcomes length of follow‐up (range) | № of participants | Certainty of the evidence | Relative effect | Anticipated absolute effects* (95% CI) | |
| Risk with optimal medical therapy alone | Risk difference with ICD plus optimal medical therapy | ||||
| All‐cause mortality (HR) ‐ main analysisa 16.5 to 67.6 months | 3128 | ⊕⊕⊕⊕ | HR 0.78 | Study population | |
| 216 per 1000 | 43 fewer per 1000 | ||||
| Cardiovascular mortality (RR)b 22.8 to 67.6 months | 1781 | ⊕⊕⊕⊝ | RR 0.75 | Study population | |
| 142 per 1000 | 35 fewer per 1000 | ||||
| Sudden cardiac death (HR)a 24 to 67.6 months | 1677 | ⊕⊕⊕⊕ | HR 0.45 | Study population | |
| 74 per 1000 | 40 fewer per 1000 | ||||
| Adverse events 67.7 months | 1116 | ⊕⊕⊕⊝ | ‐ | The adverse events reported were: device infection, serious device infection, bleeding requiring intervention, and pneumothorax. An analysis of 1116 participants showed that ICD when added to optimal medical therapy probably increases the risk of device infection and pneumothorax (RR 1.36, 95% CI 0.77 to 2.40 and RR 1.85, 95% CI 0.69 to 4.96, respectively). Implantable cardioverter‐defibrillator probably slightly increases the risk for serious device infection (RR 1.16, 95% CI 0.56 to 2.42) and may increase the risk for bleeding requiring intervention (RR 3.02, 95% CI 0.12 to 74.01). | |
| Noncardiovascular mortality (RR)b 22.8 to 67.6 months | 1781 | ⊕⊕⊕⊝ | RR 1.17 | Study population | |
| 57 per 1000 | 10 more per 1000 | ||||
| Health‐related quality of life 24 to 29 months | 561 | ⊕⊕⊕⊝ | ‐ | The health‐related quality of life of 561 participants extracted from 2 studies was evaluated using 4 different scales. None of the studies showed a statistically significant difference in score between the ICD and the control group. | |
| First ICD‐related hospitalisation ‐ not reported | ‐ | ‐ | ‐ | ‐ | ‐ |
| *The risk in the intervention group (and its 95% confidence interval) is based on the assumed risk in the comparison group and the relative effect of the intervention (and its 95% CI). | |||||
| GRADE Working Group grades of evidence | |||||
| aBoth HR and RR were calculated. However, we reported HR since it is more informative for this outcome, pooling more participants than RR. 1One of six studies appears to be at high risk of bias (COMPANION). However, the weight of this study in the meta‐analysis was only 5.3%. We conducted a sensitivity analysis excluding this study, and the results did not change significantly. | |||||
| Study | Questionnaire | Total number of participants | Measure | Baseline score | Score/change at 3 months | Score/change at 6 months | Score/change at 12 months | Score/change at 30 months | Notes | |
| Quality of Well‐Being Schedule | 103 | Baseline vs 1 year (mean ± SD) | Amiodarone: 70 ± 17 | N/A | N/A | Amiodarone: 70 ± 22 | N/A | Scores were not significantly different at 1 year between ICD and amiodarone groups (P > 0.05). | ||
| State‐Trait Anxiety Inventory | Amiodarone: 79 ± 21 | Amiodarone: 67 ± 20 | ||||||||
| MLHFQ | Physical | 458 | Change in quality of life (mean ± SD per month) | Placebo: 20 ± 12 | Placebo: ‐0.7 ± 0.1/month | N/A | Placebo: 0.7 ± 0.3/year | No significant difference in long‐term MLHFQ scores between ICD and control groups | ||
| Emotional | Placebo: 10 ± 8 | Placebo: ‐1.6 ± 0.2/month | N/A | |||||||
| SF‐12 | Physical (PCS) | Placebo: 38 ± 10 | Placebo: +1.0 ± 0.2/month | Placebo: ‐0.4 ± 0.3/year | No significant difference in long‐term PCS scores between ICD and placebo groups | |||||
| Mental (MCS) | Placebo: 47 ± 11 | Placebo: 0.3 ± 0.2/month | Placebo: ‐1.8 ± 0.3/year | No significant difference in long‐term MCS scores between ICD and placebo groups (P = 0.89) | ||||||
| Abbreviations: ICD: implantable cardioverter‐defibrillator; MCS: mental component summary; MLHFQ: Minnesota Living With Heart Failure Questionnaire; N/A: not available; PCS: physical component symmary; SD: standard deviation; SF‐12: 12‐item Short Form Health Survey 195% confidence intervals for difference in mean values for continuous variables. | ||||||||||
| Study | Start year | End year | Duration | Country | Number of participants | Number of centres | Number of patients included per hospital per year |
| 1996 | 2001 | 4 years 10 months | USA | 103 | 10 | 2.13 | |
| 1991 | 1997 | 5 years 9 months | Germany | 104 | 15 | 1.21 | |
| 2000 | 2002 | 3 years | USA | 555 | 128 | 1.45 | |
| 2007 | 2016 | 8 years 7 months | Denmark | 1116 | 5 | 26 | |
| 2002 | 2004 | 3 years | USA/Israel | 458 | 48 | 3.18 | |
| 1997 | 2001 | 3 years 10 months | Canada/New Zealand/USA | 792 | 148 | 1.40 |
| Our study | |||||||||||||||||||||
| Outcomes | All‐cause mortality | Yes | 0.78 (0.66, 0.92) | Yes | 0.8 (0.67, 0.96) | Yes | 0.88 (0.73, 1.07) | Yes | 0.78 (0.66, 0.92) | Yes | 0.75 (0.61, 0.93) | Yes | 0.79 (0.64, 0.93) | Yes | 0.76 (0.65, 0.91) | Yes | 0.77 (0.64, 0.91) | Yes | 0.81 (0.72, 0.91) | Yes | 0.76 (0.64, 0.91) |
| Cardiovascular mortality | Yes | 0.80 (0.47, 1.35) | No | Yes | 0.66 (0.42, 1.03) | Yes | 0.77 (0.60, 0.98) | No | No | No | No | Yes | 0.80 (0.40, 1.59) | No | |||||||
| Sudden cardiac death | Yes | 0.45 (0.29, 0.70) | Yes | 0.51 (0.34, 0.76) | Yes | 0.47 (0.30, 0.73) | Yes | 0.45 (0.29, 0.70) | No | Yes | 0.47 (0.30, 0.73) | No | No | Yes | 0.44 (0.17, 1.12) | No | |||||
| Non‐cardiovascular mortality | Yes | 1.17 (0.81, 1.68) | No | No | No | No | No | No | No | Yes | 1.08 (0.58, 2.02) | No | |||||||||
| Adverse events | Yes | No | No | No | No | No | No | No | No | No | |||||||||||
| Cost‐effectiveness | Yes | No | No | No | No | No | No | No | No | No | |||||||||||
| Studies included | Yes | No | No | Yes | No | No | Yes | Yes | No | Yes | |||||||||||
| Yes | Yes | Yes | Yes | Yes | Yes | Yes | Yes | Yes | Yes | ||||||||||||
| Yes | Yes | Yes | Yes | No | Yes | Yes | Yes | Yes | Yes | ||||||||||||
| Yes | Yes | Yes | Yes | Yes | Yes | Yes | Yes | Yes | Yes | ||||||||||||
| Yes | Yes | Yes | Yes | Yes | Yes | Yes | Yes | Yes | Yes | ||||||||||||
| Yes | Yes | No | Yes | Yes | Yes | Yes | Yes | Yes | Yes | ||||||||||||
| Analysis performed (HR/RR/OR) | HR & HR | HR | RR | HR & RR | HR | HR | RR | HR | HR | OR | |||||||||||
| GRADE | Yes | No | No | Yes | No | Yes | No | No | No | No | |||||||||||
| Risk of bias | Yes | No | No | Yes | No | Yes | No | No | Yes | Yes | |||||||||||
| Subgroup analysis | Yes | No | No | No | No | Yes | No | No | Yes | No | |||||||||||
| HR: hazard ratio; OR: odds ratio; RR: risk ratio | |||||||||||||||||||||
| Outcomes | All‐cause mortality | Yes | 0.79 (0.66, 0.91) | Yes | 0.84 (0.71, 0.99) | Yes | 0.832 (0.712, 0.973) | Yes | 0.76 (0.64, 0.90) | Yes | 0.79 (0.68, 0.91) | Yes | 0.78 (0.66, 0.92) | Yes | 0.75 (0.64, 0.89) | Yes | 0.77 (0.64, 0.93) | Yes | 0.83 (0.71, 0.97) | Yes | 0.76 (0.64, 0.91) | Yes | 0.76 (0.63, 0.91) |
| Cardiovascular mortality | No | No | No | No | No | No | No | Yes | 0.83 (0.62, 1.12) | No | Yes | 0.75 (0.39, 1.44) | No | ||||||||||
| Sudden cardiac death | No | Yes | 0.47 (0.30, 0.73) | No | No | No | Yes | 0.46 (0.29, 0.71) | Yes | 0.45 (0.28, 0.71) | Yes | 0.43 (0.27, 0.69) | Yes | 0.54 (0.21, 1.37) | Yes | 0.40 (0.18, 0.90) | Yes | 0.27 (0.15, 0.50) | |||||
| Non‐cardiovascular mortality | No | No | No | No | No | No | No | Yes | 1.18 (0.76, 1.83) | No | No | No | |||||||||||
| Adverse events | No | No | No | No | No | No | No | No | No | No | No | ||||||||||||
| Cost‐effectiveness | No | No | No | No | No | No | No | No | No | No | No | ||||||||||||
| Studies included | Yes | No | No | Yes | Yes | Yes | Yes | No | No | Yes | Yes | ||||||||||||
| Yes | Yes | Yes | Yes | Yes | Yes | Yes | Yes | Yes | Yes | Yes | |||||||||||||
| Yes | Yes | Yes | Yes | Yes | Yes | Yes | Yes | Yes | No | Yes | |||||||||||||
| Yes | Yes | Yes | Yes | Yes | Yes | Yes | Yes | Yes | Yes | Yes | |||||||||||||
| Yes | Yes | Yes | Yes | Yes | Yes | Yes | Yes | Yes | Yes | Yes | |||||||||||||
| Yes | Yes | Yes | Yes | Yes | Yes | Yes | Yes | Yes | Yes | Yes | |||||||||||||
| Analysis performed (HR/RR/OR) | RR | RR | RR | HR | RR | HR | RR | OR | RR | RR | RR | ||||||||||||
| GRADE | No | No | No | No | No | No | No | No | Yes | No | No | ||||||||||||
| Risk of bias | No | Yes | No | Yes | No | No | No | Yes | No | Yes | No | ||||||||||||
| Subgroup analysis | No | No | No | No | No | Yes | No | No | No | No | Yes | ||||||||||||
| HR: hazard ratio; OR: odds ratio; RR: risk ratio | |||||||||||||||||||||||
| Outcome or subgroup title | No. of studies | No. of participants | Statistical method | Effect size |
| 1 All‐cause mortality (HR) ‐ main analysis Show forest plot | 6 | 3128 | Hazard Ratio (Random, 95% CI) | 0.78 [0.66, 0.92] |
| 2 All‐cause mortality (RR) Show forest plot | 4 | 1781 | Risk Ratio (M‐H, Random, 95% CI) | 0.87 [0.72, 1.05] |
| 3 All‐cause mortality (HR) ‐ 'Risk of bias' sensitivity analysis Show forest plot | 5 | 2573 | Hazard Ratio (Random, 95% CI) | 0.79 [0.67, 0.95] |
| 4 All‐cause mortality (HR) ‐ amiodarone sensitivity analysis Show forest plot | 5 | 3025 | Hazard Ratio (Random, 95% CI) | 0.78 [0.65, 0.92] |
| 5 All‐cause mortality (HR) ‐ subgroup analysis (age) Show forest plot | 1 | 1116 | Hazard Ratio (Random, 95% CI) | 0.74 [0.40, 1.40] |
| 5.1 Age ≥ 65 | 1 | 768 | Hazard Ratio (Random, 95% CI) | 0.98 [0.73, 1.31] |
| 5.2 Age < 65 | 1 | 348 | Hazard Ratio (Random, 95% CI) | 0.51 [0.29, 0.91] |
| 6 All‐cause mortality (HR) ‐ subgroup analysis (gender) Show forest plot | 1 | 1116 | Hazard Ratio (Random, 95% CI) | 0.88 [0.68, 1.13] |
| 6.1 Male | 1 | 809 | Hazard Ratio (Random, 95% CI) | 0.85 [0.64, 1.12] |
| 6.2 Female | 1 | 307 | Hazard Ratio (Random, 95% CI) | 1.03 [0.57, 1.87] |
| 7 All‐cause mortality (HR) ‐ subgroup analysis (CRT) Show forest plot | 6 | 3128 | Hazard Ratio (Random, 95% CI) | 0.78 [0.65, 0.92] |
| 7.1 CRT | 2 | 1200 | Hazard Ratio (Random, 95% CI) | 0.79 [0.51, 1.23] |
| 7.2 No CRT | 5 | 1928 | Hazard Ratio (Random, 95% CI) | 0.76 [0.62, 0.93] |
| 8 All‐cause mortality (HR) ‐ subgroup analysis (NYHA) Show forest plot | 1 | 1116 | Hazard Ratio (Random, 95% CI) | 0.86 [0.67, 1.10] |
| 8.1 NYHA I‐II | 1 | 597 | Hazard Ratio (Random, 95% CI) | 0.92 [0.63, 1.35] |
| 8.2 NYHA III‐IV | 1 | 519 | Hazard Ratio (Random, 95% CI) | 0.81 [0.58, 1.13] |
| 9 All‐cause mortality (HR) ‐ subgroup analysis (heart failure duration) Show forest plot | 1 | 1115 | Hazard Ratio (Random, 95% CI) | 0.83 [0.65, 1.06] |
| 9.1 Heart failure duration < 18 months | 1 | 531 | Hazard Ratio (Random, 95% CI) | 0.88 [0.54, 1.43] |
| 9.2 Heart failure duration ≥ 18 months | 1 | 584 | Hazard Ratio (Random, 95% CI) | 0.81 [0.61, 1.08] |
| 10 All‐cause mortality (HR) ‐ subgroup analysis (LVEF) Show forest plot | 1 | 1116 | Hazard Ratio (Random, 95% CI) | 0.83 [0.65, 1.07] |
| 10.1 LVEF < 25% | 1 | 506 | Hazard Ratio (Random, 95% CI) | 0.87 [0.62, 1.22] |
| 10.2 LVEF ≥ 25% | 1 | 610 | Hazard Ratio (Random, 95% CI) | 0.79 [0.55, 1.14] |
| 11 All‐cause mortality (HR) ‐ subgroup analysis (year of publication) Show forest plot | 6 | Hazard Ratio (Random, 95% CI) | 0.78 [0.66, 0.92] | |
| 11.1 Year of publication before 2003 | 2 | Hazard Ratio (Random, 95% CI) | 0.82 [0.45, 1.50] | |
| 11.2 Year of publication 2004 or after | 4 | Hazard Ratio (Random, 95% CI) | 0.77 [0.65, 0.93] | |
| 12 All‐cause mortality (HR) ‐ subgroup analysis (mean follow‐up time) Show forest plot | 6 | Hazard Ratio (Random, 95% CI) | 0.78 [0.66, 0.92] | |
| 12.1 Mean follow‐up time < 36 months | 2 | Hazard Ratio (Random, 95% CI) | 0.68 [0.44, 1.06] | |
| 12.2 Mean follow‐up time ≥ 36 months | 4 | Hazard Ratio (Random, 95% CI) | 0.80 [0.66, 0.96] | |
| 13 Cardiovascular mortality (HR) Show forest plot | 2 | 1219 | Hazard Ratio (Random, 95% CI) | 0.78 [0.58, 1.05] |
| 14 Cardiovascular mortality (RR) Show forest plot | 4 | 1781 | Risk Ratio (M‐H, Random, 95% CI) | 0.75 [0.46, 1.21] |
| 15 Sudden cardiac death (HR) Show forest plot | 3 | 1677 | Hazard Ratio (Random, 95% CI) | 0.45 [0.29, 0.70] |
| 16 Sudden cardiac death (RR) Show forest plot | 3 | 1677 | Risk Ratio (M‐H, Random, 95% CI) | 0.47 [0.30, 0.73] |
| 17 Adverse events ‐ device infection (RR) Show forest plot | 1 | 1116 | Risk Ratio (M‐H, Random, 95% CI) | 1.36 [0.77, 2.40] |
| 18 Adverse events ‐ pneumothorax (RR) Show forest plot | 1 | 1116 | Risk Ratio (M‐H, Random, 95% CI) | 1.85 [0.69, 4.96] |
| 19 Adverse events ‐ serious device infection (RR) Show forest plot | 1 | 1116 | Risk Ratio (M‐H, Random, 95% CI) | 1.16 [0.56, 2.42] |
| 20 Adverse events ‐ bleeding requiring intervention (RR) Show forest plot | 1 | 1116 | Risk Ratio (M‐H, Random, 95% CI) | 3.02 [0.12, 74.01] |
| 21 Device infection subgroup analysis (RR) Show forest plot | 1 | Risk Ratio (M‐H, Random, 95% CI) | Subtotals only | |
| 21.1 CRT | 1 | 645 | Risk Ratio (M‐H, Random, 95% CI) | 0.84 [0.43, 1.63] |
| 21.2 No CRT | 1 | 471 | Risk Ratio (M‐H, Random, 95% CI) | 6.08 [1.38, 26.86] |
| 22 Serious device infection subgroup analysis (RR) Show forest plot | 1 | Risk Ratio (M‐H, Random, 95% CI) | Subtotals only | |
| 22.1 CRT | 1 | 645 | Risk Ratio (M‐H, Random, 95% CI) | 0.82 [0.34, 1.95] |
| 22.2 No CRT | 1 | 471 | Risk Ratio (M‐H, Random, 95% CI) | 3.04 [0.62, 14.90] |
| 23 Non‐cardiovascular mortality (HR) Show forest plot | 2 | 1219 | Hazard Ratio (Random, 95% CI) | 1.11 [0.72, 1.71] |
| 24 Non‐cardiovascular mortality (RR) Show forest plot | 4 | 1781 | Risk Ratio (M‐H, Random, 95% CI) | 1.17 [0.81, 1.68] |