Desfibriladores cardíacos implantables para los pacientes con miocardiopatía no isquémica
Appendices
Appendix 1. Search strategies
CENTRAL
#1 MeSH descriptor: [Defibrillators] explode all trees
#2 (defibrillat* or defibrilat*)
#3 (icd or icds)
#4 (crt or crts)
#5 electrover*
#6 ((resynch* or re‐synch*) near/3 (therap* or treatment* or device*))
#7 (cardiover* or (cardio next ver*) or cardioconver* or (cardio next conver*))
#8 #1 or #2 or #3 or #4 or #5 or #6 or #7
#9 MeSH descriptor: [Heart Failure] explode all trees
#10 ((cardi* or heart* or myocard* or ventricular or systolic) near/2 (fail* or incompet* or insufficien* or decomp* or dysfunction* or overload or over‐load))
#11 MeSH descriptor: [Cardiac Output, Low] this term only
#12 (output near/2 failure)
#13 (low near/2 (cardiac or heart or myocardia* or systolic or ventricular) near/2 output)
#14 MeSH descriptor: [Cardiomyopathies] explode all trees
#15 cardiomyopath*
#16 myocardiopath*
#17 (cardio* next myopathy*)
#18 #9 or #10 or #11 or #12 or #13 or #14 or #15 or #16 or #17
#19 #8 and #18 Publication Year from 1975 to 2018
MEDLINE
1. exp defibrillators/
2. (defibrillat* or defibrilat*).mp.
3. (icd or icds).mp.
4. (crt or crts).mp.
5. electrover*.mp.
6. ((resynch* or re‐synch*) adj3 (therap* or treatment* or device*)).mp.
7. (cardiover* or (cardio adj ver*) or cardioconver* or (cardio adj conver*)).mp.
8. 1 or 2 or 3 or 4 or 5 or 6 or 7
9. exp Heart Failure/
10. ((cardi* or heart* or myocard* or ventricular or systolic) adj2 (fail* or incompet* or insufficien* or decomp* or dysfunction* or overload or over‐load)).mp.
11. cardiac output, low/
12. (output adj2 failure).mp.
13. (low adj2 (cardiac or heart or myocardia* or systolic or ventricular) adj2 output).mp.
14. exp cardiomyopathies/
15. cardiomyopath*.mp.
16. myocardiopath*.mp.
17. (cardio* adj myopathy*).mp.
18. 9 or 10 or 11 or 12 or 13 or 14 or 15 or 16 or 17
19. 8 and 18
20. randomized controlled trial.pt.
21. controlled clinical trial.pt.
22. randomized.ab.
23. placebo.ab.
24. drug therapy.fs.
25. randomly.ab.
26. trial.ab.
27. groups.ab.
28. 20 or 21 or 22 or 23 or 24 or 25 or 26 or 27
29. exp animals/ not humans.sh.
30. 28 not 29
31. 19 and 30
32. limit 31 to yr=1975‐current
Embase
1. exp defibrillator/
2. (defibrillat* or defibrilat*).tw.
3. (icd or icds).tw.
4. (crt or crts).tw.
5. electrover*.tw.
6. ((resynch* or re‐synch*) adj3 (therap* or treatment* or device*)).tw.
7. (cardiover* or (cardio adj ver*) or cardioconver* or (cardio adj conver*)).tw.
8. 1 or 2 or 3 or 4 or 5 or 6 or 7
9. exp heart failure/
10. ((cardi* or heart* or myocard* or ventricular or systolic) adj2 (fail* or incompet* or insufficien* or decomp* or dysfunction* or overload or over‐load)).tw.
11. forward heart failure/
12. (output adj2 failure).tw.
13. (low adj2 (cardiac or heart or myocardia* or systolic or ventricular) adj2 output).tw.
14. exp cardiomyopathy/
15. cardiomyopath*.tw.
16. myocardiopath*.tw.
17. (cardio* adj myopathy*).tw.
18. 9 or 10 or 11 or 12 or 13 or 14 or 15 or 16 or 17
19. 8 and 18
20. random$.tw.
21. factorial$.tw.
22. crossover$.tw.
23. cross over$.tw.
24. cross‐over$.tw.
25. placebo$.tw.
26. (doubl$ adj blind$).tw.
27. (singl$ adj blind$).tw.
28. assign$.tw.
29. allocat$.tw.
30. volunteer$.tw.
31. crossover procedure/
32. double blind procedure/
33. randomized controlled trial/
34. single blind procedure/
35. 20 or 21 or 22 or 23 or 24 or 25 or 26 or 27 or 28 or 29 or 30 or 31 or 32 or 33 or 34
36. (animal/ or nonhuman/) not human/
37. 35 not 36
38. 19 and 37
Web of science core collection
# 1 TS=(defibrillat* or defibrilat*)
# 2 TS=(icd or icds)
# 3 TS=(crt or crts)
# 4 TS=electrover*
# 5 TS=((resynch* or re‐synch*) near/3 (therap* or treatment* or device*))
# 6 TS=(cardiover* or (cardio near ver*) or cardioconver* or (cardio near conver*))
# 7 #6 OR #5 OR #4 OR #3 OR #2 OR #1
# 8 TS=((cardi* or heart* or myocard* or ventricular or systolic) near/2 (fail* or incompet* or insufficien* or decomp* or dysfunction* or overload or over‐load))
# 9 TS=(output near/2 failure)
# 10 TS=(low near/2 (cardiac or heart or myocardia* or systolic or ventricular) near/2 output)
# 11 TS=cardiomyopath*
# 12 TS=myocardiopath*
# 13 TS=(cardio* near myopathy*)
# 14 #13 OR #12 OR #11 OR #10 OR #9 OR #8
# 15 #14 AND #7
# 16 TS=(random* or blind* or allocat* or assign* or trial* or placebo* or crossover* or cross‐over*)
# 17 #16 AND #15 (Indexes=SCI‐EXPANDED, SSCI, A&HCI, CPCI‐S, CPCI‐SSH, ESCI Timespan=1975‐2018)
ClinicalTrials.gov
Condition or disease: Non‐ischemic cardiomyopathy
Ohter terms: ICD OR implantable cardioverter defibrillator OR implantable defibrillator
Study type: Interventional Studies (Clinical Trials)
ICTRP register
1. Non‐ischemic cardiomyopathy
2. ICD OR implantable cardioverter defibrillator OR implantable defibrillator
3. 1 AND 2
ISRCTN
1. Condition: non‐ischemic cardiomyopathy
2. Interventions: ICD OR implantable cardioverter defibrillator OR implantable defibrillator
NHS economic evaluation database
1. MeSH DESCRIPTOR Defibrillators EXPLODE ALL TREES
2. (defibrillat* OR defibrilat*)
3. (icd OR icds)
4. (crt OR crts)
5. (electrover*)
6. ((resynch* OR re‐synch*) NEAR3 (therap* OR treatment* OR device*))
7. (cardiover* OR (cardio NEAR ver*) OR cardioconver* OR (cardio NEAR conver*))
8. (electric* NEAR2 card* NEAR2 stimulat*)
9. 1 OR 2 OR 3 OR 4 OR 5 OR 6 OR 7 OR 8
10. MeSH DESCRIPTOR Heart Failure EXPLODE ALL TREES
11. ((cardi* OR heart* OR myocard* OR ventricular OR systolic) NEAR2 (fail* OR incompet* OR insufficien* OR decomp* OR dysfunction* OR overload OR over‐load))
12. MeSH DESCRIPTOR Cardiac Output, Low IN NHSEED
13. (output NEAR2 failure)
14. (low NEAR2 (cardiac OR heart OR myocardia* OR systolic OR ventricular) NEAR2 output)
15. MeSH DESCRIPTOR Cardiomyopathies EXPLODE ALL TREES
16. (cardiomyopath*)
17. (myocardiopath*)
18. (cardio* NEAR myopathy*)
19. 10 OR 11 OR 12 OR 13 OR 14 OR 15 OR 16 OR 17 OR 18
20. 9 AND 19
MEDLINE economics evaluation studies
1. exp defibrillators/
2. (defibrillat* or defibrilat*).mp.
3. (icd or icds).mp.
4. (crt or crts).mp.
5. electrover*.mp.
6. ((resynch* or re‐synch*) adj3 (therap* or treatment* or device*)).mp.
7. (cardiover* or (cardio adj ver*) or cardioconver* or (cardio adj conver*)).mp.
8. 1 or 2 or 3 or 4 or 5 or 6 or 7
9. exp Heart Failure/
10. ((cardi* or heart* or myocard* or ventricular or systolic) adj2 (fail* or incompet* or insufficien* or decomp* or dysfunction* or overload or over‐load)).mp.
11. cardiac output, low/
12. (output adj2 failure).mp.
13. (low adj2 (cardiac or heart or myocardia* or systolic or ventricular) adj2 output).mp.
14. exp cardiomyopathies/
15. cardiomyopath*.mp.
16. myocardiopath*.mp.
17. (cardio* adj myopathy*).mp.
18. 9 or 10 or 11 or 12 or 13 or 14 or 15 or 16 or 17
19. 8 and 18
20. Economics/
21. exp "costs and cost analysis"/
22. exp economics, hospital/
23. Economics, Medical/
24. Economics, Nursing/
25. Economics, Pharmaceutical/
26. (economic$ or cost or costs or costly or costing or price or prices or pricing or pharmacoeconomic$).ti,ab.
27. (expenditure$ not energy).ti,ab.
28. value for money.ti,ab.
29. budget$.ti,ab.
30. or/20‐29
31. ((energy or oxygen) adj cost).ti,ab.
32. (metabolic adj cost).ti,ab.
33. ((energy or oxygen) adj expenditure).ti,ab.
34. or/31‐33
35. 30 not 34
36. letter.pt.
37. editorial.pt.
38. historical article.pt.
39. or/36‐38
40. 35 not 39
41. exp animals/ not humans/
42. 40 not 41
43. 19 and 42
44. limit 43 to yr=2015‐current
Embase economic evaluation studies
1. exp defibrillator/
2. (defibrillat* or defibrilat*).tw.
3. (icd or icds).tw.
4. (crt or crts).tw.
5. electrover*.tw.
6. ((resynch* or re‐synch*) adj3 (therap* or treatment* or device*)).tw.
7. (cardiover* or (cardio adj ver*) or cardioconver* or (cardio adj conver*)).tw.
8. 1 or 2 or 3 or 4 or 5 or 6 or 7
9. exp heart failure/
10. ((cardi* or heart* or myocard* or ventricular or systolic) adj2 (fail* or incompet* or insufficien* or decomp* or dysfunction* or overload or over‐load)).tw.
11. forward heart failure/
12. (output adj2 failure).tw.
13. (low adj2 (cardiac or heart or myocardia* or systolic or ventricular) adj2 output).tw.
14. exp cardiomyopathy/
15. cardiomyopath*.tw.
16. myocardiopath*.tw.
17. (cardio* adj myopathy*).tw.
18. 9 or 10 or 11 or 12 or 13 or 14 or 15 or 16 or 17
19. 8 and 18
20. Health Economics/
21. exp Economic Evaluation/
22. exp Health Care Cost/
23. pharmacoeconomics/
24. 20 or 21 or 22 or 23
25. (econom$ or cost or costs or costly or costing or price or prices or pricing or pharmacoeconomic$).ti,ab.
26. (expenditure$ not energy).ti,ab.
27. (value adj2 money).ti,ab.
28. budget$.ti,ab.
29. 25 or 26 or 27 or 28
30. 24 or 29
31. letter.pt.
32. editorial.pt.
33. note.pt.
34. 31 or 32 or 33
35. 30 not 34
36. (metabolic adj cost).ti,ab.
37. ((energy or oxygen) adj cost).ti,ab.
38. ((energy or oxygen) adj expenditure).ti,ab.
39. 36 or 37 or 38
40. 35 not 39
41. animal/
42. exp animal experiment/
43. nonhuman/
44. (rat or rats or mouse or mice or hamster or hamsters or animal or animals or dog or dogs or cat or cats or bovine or sheep).ti,ab,sh.
45. 41 or 42 or 43 or 44
46. exp human/
47. human experiment/
48. 46 or 47
49. 45 not (45 and 48)
50. 40 not 49
51. conference abstract.pt.
52. 50 not 51
53. 19 and 52
54. limit 53 to yr="2015 ‐Current"
EAGLE and NTIS
(non‐ischemic OR non‐ischaemic OR nonischemic OR nonischaemic) AND (cardiomyopathy OR heart failure)
Appendix 2. Effect estimates calculations
Table 1. Number of events for cardiovascular mortality inDEFINITEtrial:
| ICD group | Standard therapy group | |
| Arrhythmias | 3 | 14 |
| Heart failure | 9 | 11 |
| Other cardiac causes | 0 | 1 |
| Total cardiac deaths | 12 | 26 |
Number of events for non‐cardiovascular mortality in DEFINITE trial:
| ICD group | Standard therapy group | Total | |
| Non‐cardiovascular deaths | X | Y | 26 |
| Cardiovascular mortality | 12 | 26 | 38 |
| Unknown cause | 2 | 2 | 4 |
| Total mortality | 28 | 40 | 68 |
X = 28 ‐ 12 ‐ 2 = 14
Non‐cardiovascular mortality in ICD group = 14
Y = 40 ‐ 26 ‐ 2 = 12
Non‐cardiovascular mortality in control group = 12
Table 2. Calculations of effect estimates for all‐cause mortality
| Bansch 2002 (CAT) | Using Parmar methodology, we calculated HR of all‐cause mortality in 7 years. We used the total number randomised in the ICD arm (50) and control arm (54), total number of events in the ICD arm (13) and control arm (17), and the logrank P value of 0.5539 (Parmar 1998). |
| Bardy 2005 (SCD‐HeFT) | Among the non‐ischaemic cardiomyopathy patients, the study reported HR of ICD therapy vs placebo = 0.73 with 97.5% CI (0.50 to 1.07). We calculated the 95% CI as follows: 0.73 (0.52 to 1.02). |
| Bristow 2004 | Among participants with non‐ischaemic cardiomyopathy, the study reported HR of all‐cause mortality of pacemaker‐defibrillator vs pharmacological therapy = 0.50 with 95% CI (0.29 to 0.88), and HR of all‐cause mortality of pacemaker vs pharmacological therapy = 0.91 with 95% CI (0.55 to 1.49). We derived the indirect estimate from both estimates to get the HR of all‐cause mortality defibrillator vs pharmacological therapy (Bucher 1997): HRa: OMT vs CRT‐P = 0.91 (0.55 to 1.49) HRb: OMT vs CRT‐D = 0.5 (0.29 to 0.88) HRc: CRT‐P vs CRT‐D
SEa = [ln (upper CI) – ln (lower CI)] / (2 * 1.96) = [ln(1.49) – ln(0.55)] / (3.92) = 0.254
SEb = [ln (upper CI) – ln (lower CI)] / (2 * 1.96) = [ln(0.88) – ln(0.29)] / (3.92) = 0.283
SEc = √(SEa)2+(SEb)2 = √(0.254)2+(0.283)2 = 0.38 HRc = 0.55 (0.26 to 1.16) |
| Kadish 2004 (DEFINITE) | The study reported HR for death from any cause in the ICD group vs the standard therapy group = 0.65 with 95% CI (0.40 to 1.06) |
| Kober 2016 (DANISH) | The study reported HR for death from any cause in the ICD group vs the control group = 0.87 with 95% CI (0.68 to 1.12) |
| Strickberger 2003 (AMIOVIRT) | Using Parmar methodology, we calculated HR of all‐cause mortality. We used the total number randomised in ICD arm (51) and amiodarone arm (52), total number of events in ICD arm (6) and amiodarone arm (7), and the logrank P value of 0.8 (Parmar 1998). |
| Abbreviations: CI: confidence interval; CRT‐D: cardiac resynchronisation therapy defibrillator; CRT‐P: cardiac resynchronisation therapy pacemaker; HR: hazard ratio; ICD: implantable cardioverter‐defibrillator; OMT: optimal medical therapy; SE: standard error | |
Appendix 3. GRADE approach to describing results
Table 1. Decision of the clinical importance of effect estimate in relation to its size
| Important benefit or harm | Less important benefit or harm | No important benefit/harm | |
| All‐cause mortality | RR/HR < 0.8 (20% decrease in mortality)1 | RR/HR between 0.8 and 0.9 (10% to 20% decrease in mortality) | RR/HR > 0.9 (less than 10% decrease in mortality) |
| Cardiovascular mortality | RR/HR < 0.8 (20% decrease in mortality) | RR/HR between 0.8 and 0.9 (10% to 20% decrease in mortality) | RR/HR > 0.9 (less than 10% decrease in mortality) |
| Sudden cardiac deaths | RR/HR < 0.8 (20% decrease in mortality) | RR/HR between 0.8 and 0.9 (10% to 20% decrease in mortality) | RR/HR > 0.9 (less than 10% decrease in mortality) |
| Adverse events | RR/HR > 1.25 (25% increase)2 | RR/HR between 1.1 and 1.25 | RR/HR < 1.1 (less than 10% increase in adverse events) |
| Non‐cardiac deaths | RR/HR < 0.8 (20% decrease in mortality) | RR/HR between 0.8 and 0.9 (10% to 20% decrease in mortality) | RR/HR > 0.9 (less than 10% decrease in mortality) |
| Abbreviations: HR: hazard ratio; ICD: implantable cardioverter‐defibrillator; RR: risk ratio | |||
1The SCD‐HeFT trial showed that ICD therapy was associated with a decreased risk of death of 23% (RR 0.77). This was implemented in guidelines and is thus considered clinically important.
2This is the cut‐off point for the effect size suggested by GRADE. Risk ratio > 1.25 is considered important by GRADE.
Table 2. Relation of the effect size to the certainty of evidence to describe resultsa
| Important benefit or harm | Less important benefit or harm | No important benefit/harm or null effect | |
| High | Improves | Improves slightly | Little or no difference in [outcome] |
| Moderate | Probably improves | Probably improves slightly | Probably little or no difference in [outcome] |
| Low | May improve | May improve slightly | May have little or no difference in [outcome] |
| Very low | We are uncertain whether [intervention] improves [outcome]. | ||
| No events or rare events | Use comments in 'Summary of findings' table in a plainer language or summarise the results. | ||
| No studies | No studies were found that looked at [outcome]. | ||
aTable 2 is based on Glenton 2010.

Study flow diagram.
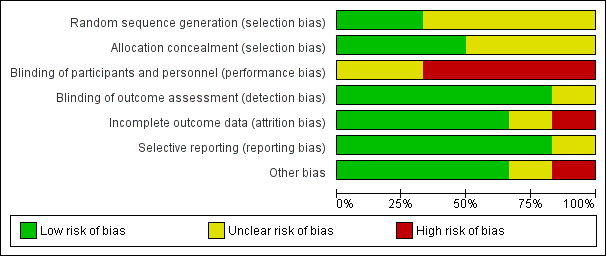
Risk of bias graph: review authors' judgements about each risk of bias item presented as percentages across all included studies.

Risk of bias summary: review authors' judgements about each risk of bias item for each included study.
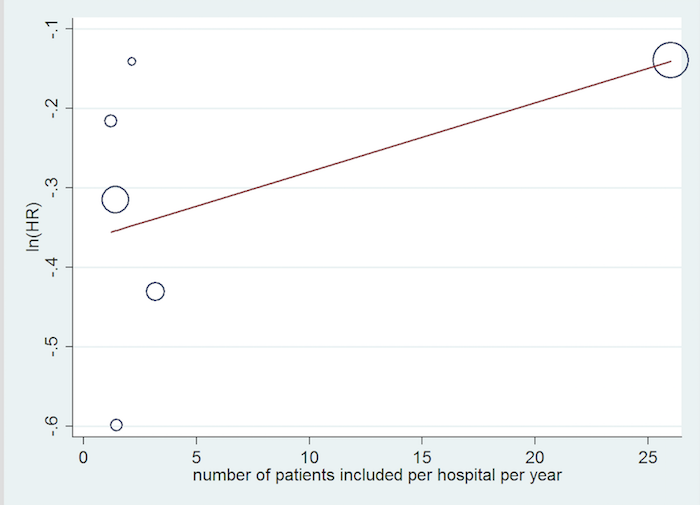
Inclusion rate meta‐regression.

Comparison 1 ICD plus optimal medical therapy compared to optimal medical therapy alone, Outcome 1 All‐cause mortality (HR) ‐ main analysis.

Comparison 1 ICD plus optimal medical therapy compared to optimal medical therapy alone, Outcome 2 All‐cause mortality (RR).
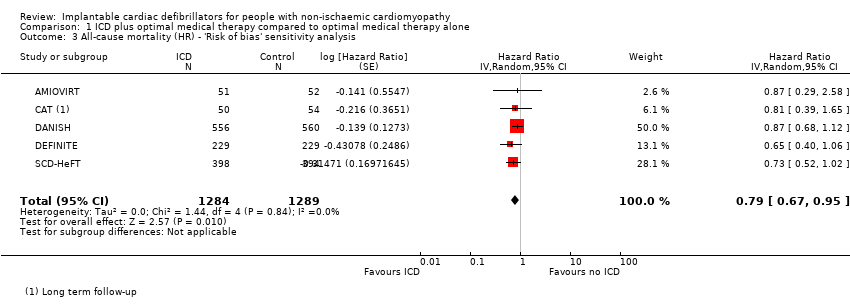
Comparison 1 ICD plus optimal medical therapy compared to optimal medical therapy alone, Outcome 3 All‐cause mortality (HR) ‐ 'Risk of bias' sensitivity analysis.
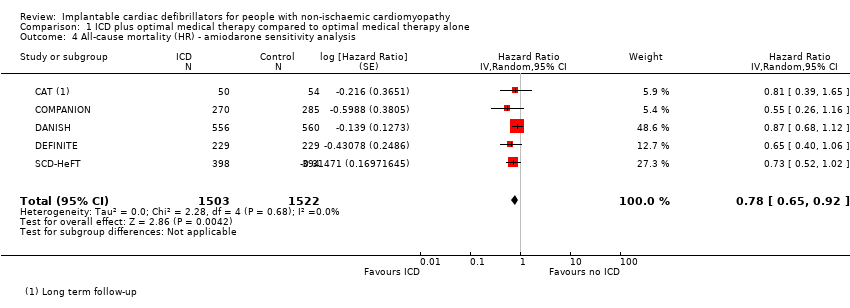
Comparison 1 ICD plus optimal medical therapy compared to optimal medical therapy alone, Outcome 4 All‐cause mortality (HR) ‐ amiodarone sensitivity analysis.
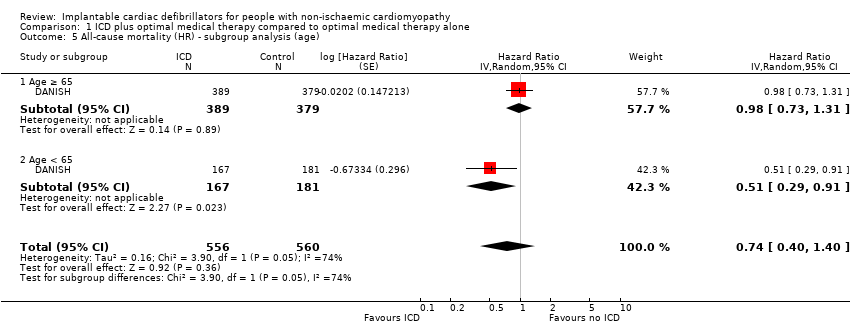
Comparison 1 ICD plus optimal medical therapy compared to optimal medical therapy alone, Outcome 5 All‐cause mortality (HR) ‐ subgroup analysis (age).

Comparison 1 ICD plus optimal medical therapy compared to optimal medical therapy alone, Outcome 6 All‐cause mortality (HR) ‐ subgroup analysis (gender).

Comparison 1 ICD plus optimal medical therapy compared to optimal medical therapy alone, Outcome 7 All‐cause mortality (HR) ‐ subgroup analysis (CRT).

Comparison 1 ICD plus optimal medical therapy compared to optimal medical therapy alone, Outcome 8 All‐cause mortality (HR) ‐ subgroup analysis (NYHA).

Comparison 1 ICD plus optimal medical therapy compared to optimal medical therapy alone, Outcome 9 All‐cause mortality (HR) ‐ subgroup analysis (heart failure duration).

Comparison 1 ICD plus optimal medical therapy compared to optimal medical therapy alone, Outcome 10 All‐cause mortality (HR) ‐ subgroup analysis (LVEF).

Comparison 1 ICD plus optimal medical therapy compared to optimal medical therapy alone, Outcome 11 All‐cause mortality (HR) ‐ subgroup analysis (year of publication).

Comparison 1 ICD plus optimal medical therapy compared to optimal medical therapy alone, Outcome 12 All‐cause mortality (HR) ‐ subgroup analysis (mean follow‐up time).

Comparison 1 ICD plus optimal medical therapy compared to optimal medical therapy alone, Outcome 13 Cardiovascular mortality (HR).
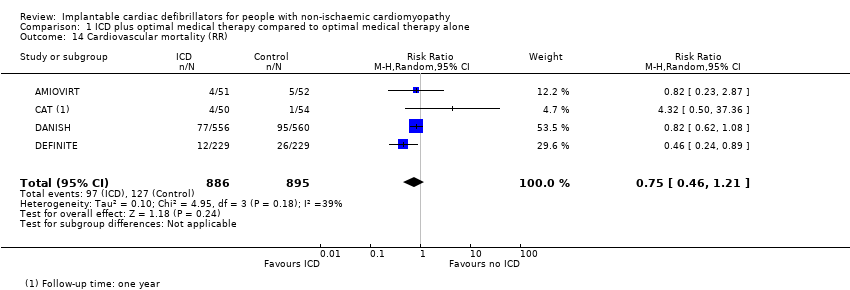
Comparison 1 ICD plus optimal medical therapy compared to optimal medical therapy alone, Outcome 14 Cardiovascular mortality (RR).
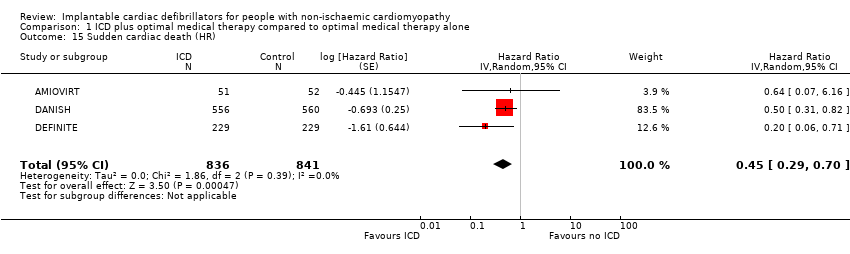
Comparison 1 ICD plus optimal medical therapy compared to optimal medical therapy alone, Outcome 15 Sudden cardiac death (HR).
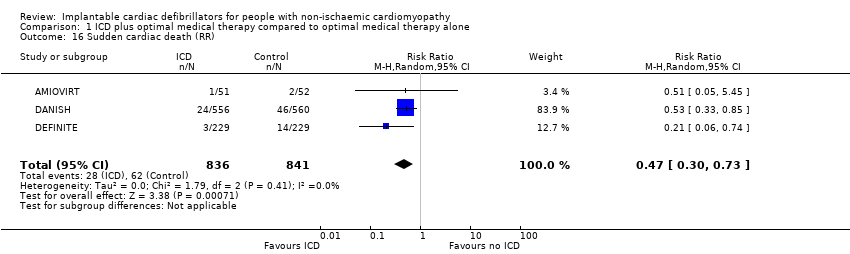
Comparison 1 ICD plus optimal medical therapy compared to optimal medical therapy alone, Outcome 16 Sudden cardiac death (RR).

Comparison 1 ICD plus optimal medical therapy compared to optimal medical therapy alone, Outcome 17 Adverse events ‐ device infection (RR).
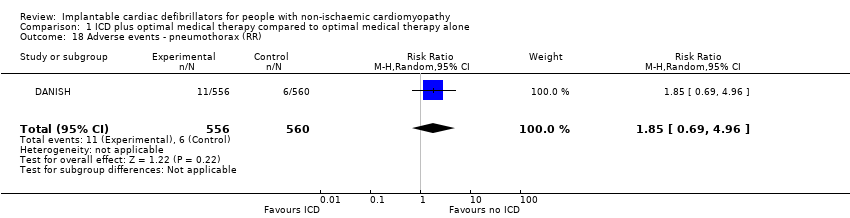
Comparison 1 ICD plus optimal medical therapy compared to optimal medical therapy alone, Outcome 18 Adverse events ‐ pneumothorax (RR).
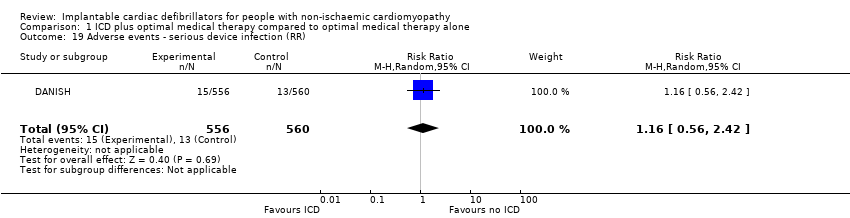
Comparison 1 ICD plus optimal medical therapy compared to optimal medical therapy alone, Outcome 19 Adverse events ‐ serious device infection (RR).

Comparison 1 ICD plus optimal medical therapy compared to optimal medical therapy alone, Outcome 20 Adverse events ‐ bleeding requiring intervention (RR).
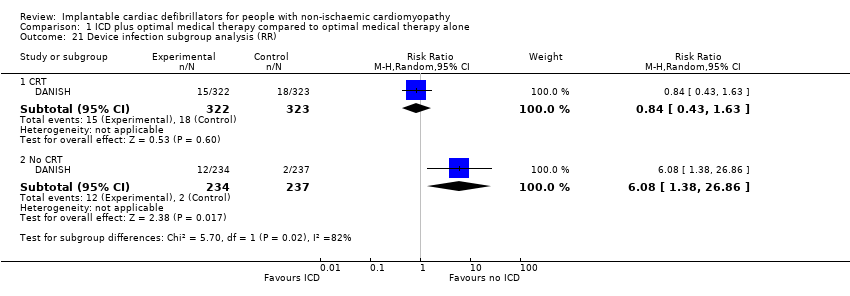
Comparison 1 ICD plus optimal medical therapy compared to optimal medical therapy alone, Outcome 21 Device infection subgroup analysis (RR).

Comparison 1 ICD plus optimal medical therapy compared to optimal medical therapy alone, Outcome 22 Serious device infection subgroup analysis (RR).
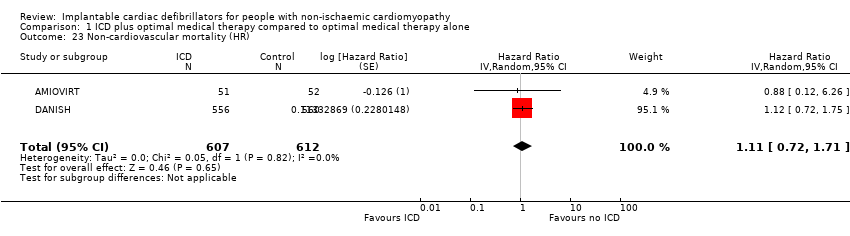
Comparison 1 ICD plus optimal medical therapy compared to optimal medical therapy alone, Outcome 23 Non‐cardiovascular mortality (HR).

Comparison 1 ICD plus optimal medical therapy compared to optimal medical therapy alone, Outcome 24 Non‐cardiovascular mortality (RR).
| ICD plus optimal medical therapy compared to optimal medical therapy alone for people with non‐ischaemic cardiomyopathy Population: people with non‐ischaemic cardiomyopathy Setting: USA, Israel, New Zealand, Canada, Germany, and Denmark Intervention: implantable cardioverter‐defibrillator in addition to optimal medical therapy Comparator: optimal medical therapy alone | |||||
| Outcomes length of follow‐up (range) | № of participants | Certainty of the evidence | Relative effect | Anticipated absolute effects* (95% CI) | |
| Risk with optimal medical therapy alone | Risk difference with ICD plus optimal medical therapy | ||||
| All‐cause mortality (HR) ‐ main analysisa 16.5 to 67.6 months | 3128 | ⊕⊕⊕⊕ | HR 0.78 | Study population | |
| 216 per 1000 | 43 fewer per 1000 | ||||
| Cardiovascular mortality (RR)b 22.8 to 67.6 months | 1781 | ⊕⊕⊕⊝ | RR 0.75 | Study population | |
| 142 per 1000 | 35 fewer per 1000 | ||||
| Sudden cardiac death (HR)a 24 to 67.6 months | 1677 | ⊕⊕⊕⊕ | HR 0.45 | Study population | |
| 74 per 1000 | 40 fewer per 1000 | ||||
| Adverse events 67.7 months | 1116 | ⊕⊕⊕⊝ | ‐ | The adverse events reported were: device infection, serious device infection, bleeding requiring intervention, and pneumothorax. An analysis of 1116 participants showed that ICD when added to optimal medical therapy probably increases the risk of device infection and pneumothorax (RR 1.36, 95% CI 0.77 to 2.40 and RR 1.85, 95% CI 0.69 to 4.96, respectively). Implantable cardioverter‐defibrillator probably slightly increases the risk for serious device infection (RR 1.16, 95% CI 0.56 to 2.42) and may increase the risk for bleeding requiring intervention (RR 3.02, 95% CI 0.12 to 74.01). | |
| Noncardiovascular mortality (RR)b 22.8 to 67.6 months | 1781 | ⊕⊕⊕⊝ | RR 1.17 | Study population | |
| 57 per 1000 | 10 more per 1000 | ||||
| Health‐related quality of life 24 to 29 months | 561 | ⊕⊕⊕⊝ | ‐ | The health‐related quality of life of 561 participants extracted from 2 studies was evaluated using 4 different scales. None of the studies showed a statistically significant difference in score between the ICD and the control group. | |
| First ICD‐related hospitalisation ‐ not reported | ‐ | ‐ | ‐ | ‐ | ‐ |
| *The risk in the intervention group (and its 95% confidence interval) is based on the assumed risk in the comparison group and the relative effect of the intervention (and its 95% CI). | |||||
| GRADE Working Group grades of evidence | |||||
| aBoth HR and RR were calculated. However, we reported HR since it is more informative for this outcome, pooling more participants than RR. 1One of six studies appears to be at high risk of bias (COMPANION). However, the weight of this study in the meta‐analysis was only 5.3%. We conducted a sensitivity analysis excluding this study, and the results did not change significantly. | |||||
| Study | Questionnaire | Total number of participants | Measure | Baseline score | Score/change at 3 months | Score/change at 6 months | Score/change at 12 months | Score/change at 30 months | Notes | |
| Quality of Well‐Being Schedule | 103 | Baseline vs 1 year (mean ± SD) | Amiodarone: 70 ± 17 | N/A | N/A | Amiodarone: 70 ± 22 | N/A | Scores were not significantly different at 1 year between ICD and amiodarone groups (P > 0.05). | ||
| State‐Trait Anxiety Inventory | Amiodarone: 79 ± 21 | Amiodarone: 67 ± 20 | ||||||||
| MLHFQ | Physical | 458 | Change in quality of life (mean ± SD per month) | Placebo: 20 ± 12 | Placebo: ‐0.7 ± 0.1/month | N/A | Placebo: 0.7 ± 0.3/year | No significant difference in long‐term MLHFQ scores between ICD and control groups | ||
| Emotional | Placebo: 10 ± 8 | Placebo: ‐1.6 ± 0.2/month | N/A | |||||||
| SF‐12 | Physical (PCS) | Placebo: 38 ± 10 | Placebo: +1.0 ± 0.2/month | Placebo: ‐0.4 ± 0.3/year | No significant difference in long‐term PCS scores between ICD and placebo groups | |||||
| Mental (MCS) | Placebo: 47 ± 11 | Placebo: 0.3 ± 0.2/month | Placebo: ‐1.8 ± 0.3/year | No significant difference in long‐term MCS scores between ICD and placebo groups (P = 0.89) | ||||||
| Abbreviations: ICD: implantable cardioverter‐defibrillator; MCS: mental component summary; MLHFQ: Minnesota Living With Heart Failure Questionnaire; N/A: not available; PCS: physical component symmary; SD: standard deviation; SF‐12: 12‐item Short Form Health Survey 195% confidence intervals for difference in mean values for continuous variables. | ||||||||||
| Study | Start year | End year | Duration | Country | Number of participants | Number of centres | Number of patients included per hospital per year |
| 1996 | 2001 | 4 years 10 months | USA | 103 | 10 | 2.13 | |
| 1991 | 1997 | 5 years 9 months | Germany | 104 | 15 | 1.21 | |
| 2000 | 2002 | 3 years | USA | 555 | 128 | 1.45 | |
| 2007 | 2016 | 8 years 7 months | Denmark | 1116 | 5 | 26 | |
| 2002 | 2004 | 3 years | USA/Israel | 458 | 48 | 3.18 | |
| 1997 | 2001 | 3 years 10 months | Canada/New Zealand/USA | 792 | 148 | 1.40 |
| Our study | |||||||||||||||||||||
| Outcomes | All‐cause mortality | Yes | 0.78 (0.66, 0.92) | Yes | 0.8 (0.67, 0.96) | Yes | 0.88 (0.73, 1.07) | Yes | 0.78 (0.66, 0.92) | Yes | 0.75 (0.61, 0.93) | Yes | 0.79 (0.64, 0.93) | Yes | 0.76 (0.65, 0.91) | Yes | 0.77 (0.64, 0.91) | Yes | 0.81 (0.72, 0.91) | Yes | 0.76 (0.64, 0.91) |
| Cardiovascular mortality | Yes | 0.80 (0.47, 1.35) | No | Yes | 0.66 (0.42, 1.03) | Yes | 0.77 (0.60, 0.98) | No | No | No | No | Yes | 0.80 (0.40, 1.59) | No | |||||||
| Sudden cardiac death | Yes | 0.45 (0.29, 0.70) | Yes | 0.51 (0.34, 0.76) | Yes | 0.47 (0.30, 0.73) | Yes | 0.45 (0.29, 0.70) | No | Yes | 0.47 (0.30, 0.73) | No | No | Yes | 0.44 (0.17, 1.12) | No | |||||
| Non‐cardiovascular mortality | Yes | 1.17 (0.81, 1.68) | No | No | No | No | No | No | No | Yes | 1.08 (0.58, 2.02) | No | |||||||||
| Adverse events | Yes | No | No | No | No | No | No | No | No | No | |||||||||||
| Cost‐effectiveness | Yes | No | No | No | No | No | No | No | No | No | |||||||||||
| Studies included | Yes | No | No | Yes | No | No | Yes | Yes | No | Yes | |||||||||||
| Yes | Yes | Yes | Yes | Yes | Yes | Yes | Yes | Yes | Yes | ||||||||||||
| Yes | Yes | Yes | Yes | No | Yes | Yes | Yes | Yes | Yes | ||||||||||||
| Yes | Yes | Yes | Yes | Yes | Yes | Yes | Yes | Yes | Yes | ||||||||||||
| Yes | Yes | Yes | Yes | Yes | Yes | Yes | Yes | Yes | Yes | ||||||||||||
| Yes | Yes | No | Yes | Yes | Yes | Yes | Yes | Yes | Yes | ||||||||||||
| Analysis performed (HR/RR/OR) | HR & HR | HR | RR | HR & RR | HR | HR | RR | HR | HR | OR | |||||||||||
| GRADE | Yes | No | No | Yes | No | Yes | No | No | No | No | |||||||||||
| Risk of bias | Yes | No | No | Yes | No | Yes | No | No | Yes | Yes | |||||||||||
| Subgroup analysis | Yes | No | No | No | No | Yes | No | No | Yes | No | |||||||||||
| HR: hazard ratio; OR: odds ratio; RR: risk ratio | |||||||||||||||||||||
| Outcomes | All‐cause mortality | Yes | 0.79 (0.66, 0.91) | Yes | 0.84 (0.71, 0.99) | Yes | 0.832 (0.712, 0.973) | Yes | 0.76 (0.64, 0.90) | Yes | 0.79 (0.68, 0.91) | Yes | 0.78 (0.66, 0.92) | Yes | 0.75 (0.64, 0.89) | Yes | 0.77 (0.64, 0.93) | Yes | 0.83 (0.71, 0.97) | Yes | 0.76 (0.64, 0.91) | Yes | 0.76 (0.63, 0.91) |
| Cardiovascular mortality | No | No | No | No | No | No | No | Yes | 0.83 (0.62, 1.12) | No | Yes | 0.75 (0.39, 1.44) | No | ||||||||||
| Sudden cardiac death | No | Yes | 0.47 (0.30, 0.73) | No | No | No | Yes | 0.46 (0.29, 0.71) | Yes | 0.45 (0.28, 0.71) | Yes | 0.43 (0.27, 0.69) | Yes | 0.54 (0.21, 1.37) | Yes | 0.40 (0.18, 0.90) | Yes | 0.27 (0.15, 0.50) | |||||
| Non‐cardiovascular mortality | No | No | No | No | No | No | No | Yes | 1.18 (0.76, 1.83) | No | No | No | |||||||||||
| Adverse events | No | No | No | No | No | No | No | No | No | No | No | ||||||||||||
| Cost‐effectiveness | No | No | No | No | No | No | No | No | No | No | No | ||||||||||||
| Studies included | Yes | No | No | Yes | Yes | Yes | Yes | No | No | Yes | Yes | ||||||||||||
| Yes | Yes | Yes | Yes | Yes | Yes | Yes | Yes | Yes | Yes | Yes | |||||||||||||
| Yes | Yes | Yes | Yes | Yes | Yes | Yes | Yes | Yes | No | Yes | |||||||||||||
| Yes | Yes | Yes | Yes | Yes | Yes | Yes | Yes | Yes | Yes | Yes | |||||||||||||
| Yes | Yes | Yes | Yes | Yes | Yes | Yes | Yes | Yes | Yes | Yes | |||||||||||||
| Yes | Yes | Yes | Yes | Yes | Yes | Yes | Yes | Yes | Yes | Yes | |||||||||||||
| Analysis performed (HR/RR/OR) | RR | RR | RR | HR | RR | HR | RR | OR | RR | RR | RR | ||||||||||||
| GRADE | No | No | No | No | No | No | No | No | Yes | No | No | ||||||||||||
| Risk of bias | No | Yes | No | Yes | No | No | No | Yes | No | Yes | No | ||||||||||||
| Subgroup analysis | No | No | No | No | No | Yes | No | No | No | No | Yes | ||||||||||||
| HR: hazard ratio; OR: odds ratio; RR: risk ratio | |||||||||||||||||||||||
| Outcome or subgroup title | No. of studies | No. of participants | Statistical method | Effect size |
| 1 All‐cause mortality (HR) ‐ main analysis Show forest plot | 6 | 3128 | Hazard Ratio (Random, 95% CI) | 0.78 [0.66, 0.92] |
| 2 All‐cause mortality (RR) Show forest plot | 4 | 1781 | Risk Ratio (M‐H, Random, 95% CI) | 0.87 [0.72, 1.05] |
| 3 All‐cause mortality (HR) ‐ 'Risk of bias' sensitivity analysis Show forest plot | 5 | 2573 | Hazard Ratio (Random, 95% CI) | 0.79 [0.67, 0.95] |
| 4 All‐cause mortality (HR) ‐ amiodarone sensitivity analysis Show forest plot | 5 | 3025 | Hazard Ratio (Random, 95% CI) | 0.78 [0.65, 0.92] |
| 5 All‐cause mortality (HR) ‐ subgroup analysis (age) Show forest plot | 1 | 1116 | Hazard Ratio (Random, 95% CI) | 0.74 [0.40, 1.40] |
| 5.1 Age ≥ 65 | 1 | 768 | Hazard Ratio (Random, 95% CI) | 0.98 [0.73, 1.31] |
| 5.2 Age < 65 | 1 | 348 | Hazard Ratio (Random, 95% CI) | 0.51 [0.29, 0.91] |
| 6 All‐cause mortality (HR) ‐ subgroup analysis (gender) Show forest plot | 1 | 1116 | Hazard Ratio (Random, 95% CI) | 0.88 [0.68, 1.13] |
| 6.1 Male | 1 | 809 | Hazard Ratio (Random, 95% CI) | 0.85 [0.64, 1.12] |
| 6.2 Female | 1 | 307 | Hazard Ratio (Random, 95% CI) | 1.03 [0.57, 1.87] |
| 7 All‐cause mortality (HR) ‐ subgroup analysis (CRT) Show forest plot | 6 | 3128 | Hazard Ratio (Random, 95% CI) | 0.78 [0.65, 0.92] |
| 7.1 CRT | 2 | 1200 | Hazard Ratio (Random, 95% CI) | 0.79 [0.51, 1.23] |
| 7.2 No CRT | 5 | 1928 | Hazard Ratio (Random, 95% CI) | 0.76 [0.62, 0.93] |
| 8 All‐cause mortality (HR) ‐ subgroup analysis (NYHA) Show forest plot | 1 | 1116 | Hazard Ratio (Random, 95% CI) | 0.86 [0.67, 1.10] |
| 8.1 NYHA I‐II | 1 | 597 | Hazard Ratio (Random, 95% CI) | 0.92 [0.63, 1.35] |
| 8.2 NYHA III‐IV | 1 | 519 | Hazard Ratio (Random, 95% CI) | 0.81 [0.58, 1.13] |
| 9 All‐cause mortality (HR) ‐ subgroup analysis (heart failure duration) Show forest plot | 1 | 1115 | Hazard Ratio (Random, 95% CI) | 0.83 [0.65, 1.06] |
| 9.1 Heart failure duration < 18 months | 1 | 531 | Hazard Ratio (Random, 95% CI) | 0.88 [0.54, 1.43] |
| 9.2 Heart failure duration ≥ 18 months | 1 | 584 | Hazard Ratio (Random, 95% CI) | 0.81 [0.61, 1.08] |
| 10 All‐cause mortality (HR) ‐ subgroup analysis (LVEF) Show forest plot | 1 | 1116 | Hazard Ratio (Random, 95% CI) | 0.83 [0.65, 1.07] |
| 10.1 LVEF < 25% | 1 | 506 | Hazard Ratio (Random, 95% CI) | 0.87 [0.62, 1.22] |
| 10.2 LVEF ≥ 25% | 1 | 610 | Hazard Ratio (Random, 95% CI) | 0.79 [0.55, 1.14] |
| 11 All‐cause mortality (HR) ‐ subgroup analysis (year of publication) Show forest plot | 6 | Hazard Ratio (Random, 95% CI) | 0.78 [0.66, 0.92] | |
| 11.1 Year of publication before 2003 | 2 | Hazard Ratio (Random, 95% CI) | 0.82 [0.45, 1.50] | |
| 11.2 Year of publication 2004 or after | 4 | Hazard Ratio (Random, 95% CI) | 0.77 [0.65, 0.93] | |
| 12 All‐cause mortality (HR) ‐ subgroup analysis (mean follow‐up time) Show forest plot | 6 | Hazard Ratio (Random, 95% CI) | 0.78 [0.66, 0.92] | |
| 12.1 Mean follow‐up time < 36 months | 2 | Hazard Ratio (Random, 95% CI) | 0.68 [0.44, 1.06] | |
| 12.2 Mean follow‐up time ≥ 36 months | 4 | Hazard Ratio (Random, 95% CI) | 0.80 [0.66, 0.96] | |
| 13 Cardiovascular mortality (HR) Show forest plot | 2 | 1219 | Hazard Ratio (Random, 95% CI) | 0.78 [0.58, 1.05] |
| 14 Cardiovascular mortality (RR) Show forest plot | 4 | 1781 | Risk Ratio (M‐H, Random, 95% CI) | 0.75 [0.46, 1.21] |
| 15 Sudden cardiac death (HR) Show forest plot | 3 | 1677 | Hazard Ratio (Random, 95% CI) | 0.45 [0.29, 0.70] |
| 16 Sudden cardiac death (RR) Show forest plot | 3 | 1677 | Risk Ratio (M‐H, Random, 95% CI) | 0.47 [0.30, 0.73] |
| 17 Adverse events ‐ device infection (RR) Show forest plot | 1 | 1116 | Risk Ratio (M‐H, Random, 95% CI) | 1.36 [0.77, 2.40] |
| 18 Adverse events ‐ pneumothorax (RR) Show forest plot | 1 | 1116 | Risk Ratio (M‐H, Random, 95% CI) | 1.85 [0.69, 4.96] |
| 19 Adverse events ‐ serious device infection (RR) Show forest plot | 1 | 1116 | Risk Ratio (M‐H, Random, 95% CI) | 1.16 [0.56, 2.42] |
| 20 Adverse events ‐ bleeding requiring intervention (RR) Show forest plot | 1 | 1116 | Risk Ratio (M‐H, Random, 95% CI) | 3.02 [0.12, 74.01] |
| 21 Device infection subgroup analysis (RR) Show forest plot | 1 | Risk Ratio (M‐H, Random, 95% CI) | Subtotals only | |
| 21.1 CRT | 1 | 645 | Risk Ratio (M‐H, Random, 95% CI) | 0.84 [0.43, 1.63] |
| 21.2 No CRT | 1 | 471 | Risk Ratio (M‐H, Random, 95% CI) | 6.08 [1.38, 26.86] |
| 22 Serious device infection subgroup analysis (RR) Show forest plot | 1 | Risk Ratio (M‐H, Random, 95% CI) | Subtotals only | |
| 22.1 CRT | 1 | 645 | Risk Ratio (M‐H, Random, 95% CI) | 0.82 [0.34, 1.95] |
| 22.2 No CRT | 1 | 471 | Risk Ratio (M‐H, Random, 95% CI) | 3.04 [0.62, 14.90] |
| 23 Non‐cardiovascular mortality (HR) Show forest plot | 2 | 1219 | Hazard Ratio (Random, 95% CI) | 1.11 [0.72, 1.71] |
| 24 Non‐cardiovascular mortality (RR) Show forest plot | 4 | 1781 | Risk Ratio (M‐H, Random, 95% CI) | 1.17 [0.81, 1.68] |